 Open Access Article
Creative Commons Attribution 3.0 Unported Licence
A facile sonochemical synthesis of the Zn-based metal–organic framework for electrochemical sensing of paracetamol†
Khaled M.
Ismail
*,
Safaa S.
Hassan
 ,
Shymaa S.
Medany
 and
Mahmoud A.
Hefnawy
 *
*
Department of Chemistry, Faculty of Science, Cairo University, Giza, Egypt. E-mail: kismail@sci.cu.edu.eg; hsafaa@sci.cu.edu.eg; shymaasamir80@cu.edu.eg; maadel@cu.edu.eg
First published on 28th May 2024
Abstract
A zinc-based organic framework was synthesized using a fast, economical, and environmentally friendly sonochemical method. It consisted of a zinc central metal ion coordinated to a 1,3-benzene dicarboxylate linker (BDC). Several techniques have been employed to determine the exact chemical structure of the synthesized metal–organic framework. The X-ray diffraction pattern (XRD) matches the theoretical pattern of the polymeric [Zn(BDC)(H2O)]n structure. The suggested structure of Zn-MOF was supported by FTIR, 1H NMR and 13C NMR studies. The morphological structures of Zn-MOF particles and the modified electrode GC/Zn-MOF before and after paracetamol (PA) oxidation were characterized using SEM. Also, the modified electrode composition was analyzed using energy-dispersive X-ray spectroscopy and mapping techniques. The modified GC/Zn-MOF electrode exhibited a detection limit (LOD) of 0.104 μM with a linear detection range of 1–50 μM PA in a phosphate buffer solution (PBS) using a differential pulse technique. Additionally, the modified Zn-MOF electrode exhibited anti-interference capability in the presence of different species. The negative adsorption energy predicted the spontaneity of the PA adsorption on the GC/Zn-MOF electrode surface. The modified GC/Zn-MOF electrode is simple, reliable, and practical, with promising potential for application as a PA sensor.
1. Introduction
Paracetamol (PA) is a potent antipyretic and analgesic medication commonly used to relieve moderate pain, such as headache caused by influenza or joint pain and migraine. While the normal dose of paracetamol is harmless to the human body, excessive or prolonged use can result in liver damage, kidney failure, leukemia, or even central nervous system poisoning.1 Therefore, there is a critical need to develop sensitive, simple, and rapid detection methods for paracetamol.Various analytical methods such as gas or liquid chromatography-mass spectrometry (GC-MS or LC-MS),2,3 chemiluminescence, high-performance liquid chromatography (HPLC),4–6 spectrofluorimetric,7,8 and electrochemical methods,9 have been employed to detect PA in biological systems.10–12
Among these methods, electroanalytical techniques have recently gained popularity due to their simplicity, rapid processing time, affordability, and low detection limits.13–15 Voltammetry, a sensitive electrochemical technique, is commonly used for detecting medicinal compounds in trace amounts. To assess the redox activity of pharmaceutical substances, various voltammetry techniques, such as cyclic voltammetry, linear sweep voltammetry, and differential pulse voltammetry, can be utilized.16,17
Modification of the electrode surface with electroactive materials has been a significant area of research in electrochemistry for decades.18 Many electroanalytical studies have introduced an improvement in the selectivity and sensitivity of PA detection using various combinations of electrode surfaces, techniques, modifiers and methods.19–24
Metal–organic frameworks (MOFs), porous materials with vast surface areas and ordered lattices, have emerged as promising platforms for electrochemical sensing.25–27 MOFs offer several advantages, such as universal catalytic capabilities, pre-concentration of analytes, and size selectivity effects, making them suitable for electrochemical sensing applications.28–31 Redox-active MOFs have been employed as a sensor platform in the electrochemical sensing of various small-molecule organic chemicals, large biomolecules, and inorganic ions, including H2O2, glucose, dopamine, and heavy metals.32–37 Furthermore, Zn-MOF has been recognized as an efficient electrochemical sensor for diverse compounds such as bisphenol,38 uric acid,39 catechol,40 and metal ions.41,42
MOFs can be synthesized through a variety of methods, such as electrochemical, sonochemical, mechanochemical, microwave, hydrothermal, and solvothermal methods.43–47 The sonochemical method is a powerful technique for synthesizing MOFs by inducing cavitation and small bubbles in a solution containing organic precursors and metal ions under the influence of high-frequency ultrasonic waves.48,49 As these bubbles collapse, they generate high temperatures and pressures, leading to the formation of MOF crystals. Compared to conventional methods, sonochemical synthesis can rapidly produce MOFs. The nucleation and growth processes of MOFs can be accelerated by the action of ultrasonic waves, resulting in MOFs with narrow size criteria, thus enhancing their effectiveness in various applications. Also, it produces high-purity MOFs by generating high-energy conditions that facilitate the formation of well-defined MOF structures with minimal impurities. Therefore, sonochemical synthesis is a promising technique for the rapid, efficient, and high-quality synthesis of MOFs, making it a valuable tool for the development of new MOFs and their applications.50–52
To the best of our knowledge, this is the first instance of applying Zn-MOF as an electrocatalyst for PA oxidation, suggesting its potential application as a PA sensor. In this study, a water-stable Zn-MOF was prepared using a rapid ultrasonication technique for the electrochemical detection of PA. The prepared Zn-MOF was characterized using various analytical techniques, including SEM, TEM, XRD, EDX, IR, NMR, TGA, and UV-Vis spectroscopy. The activity of GC/Zn-MOF toward PA detection was examined in a phosphate buffer solution and real blood samples. Additionally, the dmol3 theoretical method was employed to investigate the interaction between PA and the Zn-MOF surface. One of the main objectives of the present investigation is to estimate PA in the presence of different interfering species at physiological pH using a Zn-MOF-modified electrode.
2. Experimental
2.1. Materials and physical measurements
Zinc acetate dihydrate, 1,3-benzene dicarboxylic acid, paracetamol (PA), and ethanol were obtained from Sigma-Aldrich Company. The investigation used the following instruments: a Shimadzu FTIR spectrometer, an Automated UV/Vis-NIR 3101 PC Shimadzu spectrophotometer, and a TGA-50H-Shimadzu thermal analyzer operated under a nitrogen atmosphere. NMR spectra were obtained using a Varian Oxford mercury spectrometer at 300 MHz. A scanning electron microscope (SEM) (model Quanta FEG 250, USA) was used to examine the morphological structure and elemental mapping. Additionally, energy dispersive X-ray analysis (EDX) was performed at an accelerating voltage of 30 kV to conduct elemental analysis. The particle size was investigated using a transmission electron microscope (TEM) (model JEOL JEM 1400, Japan), operating at 80 kV. The phase structure was examined using X-ray diffraction (XRD) with Cu-Kα radiation (wavelength = 1.5406 A). In addition, surface area analysis employing nitrogen adsorption/desorption at a temperature of 77 K was conducted using a gas sorption analyzer (Quantachrome, NOVA, version 2.1).2.2. [Zn(BDC)(H2O)] n synthesis
Zinc acetate dihydrate (1.5 mmol) was mixed with (1.0 mmol) of 1,3-benzene dicarboxylic acid. Zinc acetate dihydrate was dissolved in water, while 1,3-benzene dicarboxylic acid was dissolved in ethanol. The reaction was carried out under ultrasonic irradiation at atmospheric pressure and ambient temperature for 120 minutes. Subsequently, the resulting white crystalline precipitate was washed with a 50% ethanol/water mixture and dried in an oven overnight at 60 °C.2.3. Electrode fabrication and electrochemical cells
A glassy carbon electrode (GCE), 0.3 cm thick with a surface area of 0.071 cm2, was employed as the working electrode. Initially, the GCE was polished with emery paper and rinsed with double-distilled water and ethanol. The electrocatalyst was prepared by dispersing 15 mg of the Zn-MOF powder in a mixture containing 1 mL of isopropyl alcohol, 5 wt % Nafion solution, and double-distilled water. The prepared mixture was agitated by ultrasonication for 20 min until the ink was formed. Subsequently, 50 μL of the ink was applied on the surface of the GC and allowed to dry overnight in a desiccator. The resulting data from the different electrochemical techniques were obtained using an Autolab PGSTAT128N instrument. For impedance analysis, NOVA (Version 2.1) software was used. A three-electrode cell was constructed using the Zn-MOF electrocatalyst as the working electrode. Ag/AgCl/KCl (saturated) and Pt wires were used as the reference and auxiliary electrodes, respectively. An AC amplitude of 10 mV in a frequency range of 1 × 10⁴–0.1 Hz was used for electrochemical impedance spectroscopy (EIS) measurements. The collected data was matched to a selected electric circuit model utilizing a sophisticated complex non-linear least-squares (CNLS) circuit fitting program. All electrochemical investigations were conducted in oxygen-free solutions at ambient temperature.3. Result and discussion
3.1. Structure characterization
The white crystals obtained from the ultrasonic irradiation of the Zn-acetate and 1,3-benzene dicarboxylic acid mixture at a 1.5![[thin space (1/6-em)]](https://www.rsc.org/images/entities/char_2009.gif) :
:![[thin space (1/6-em)]](https://www.rsc.org/images/entities/char_2009.gif) 1.0 molar ratio were characterized by using different techniques, including FTIR, 1H NMR, 13C NMR, UV-Vis, XRD, and TGA, SEM, TEM, and adsorption–desorption techniques (BET) to analyze the surface and porosity of the crystals.
1.0 molar ratio were characterized by using different techniques, including FTIR, 1H NMR, 13C NMR, UV-Vis, XRD, and TGA, SEM, TEM, and adsorption–desorption techniques (BET) to analyze the surface and porosity of the crystals.
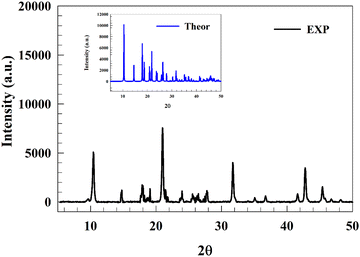
X-ray diffraction (XRD) was used to determine the crystallinity of the produced zinc compounds. Fig. 1 displays sharp peaks consistent with the XRD pattern of the single crystal of polymeric [Zn(C8H4O4)(H2O)]n, which was synthesized by Wheeler et al.53 The theoretically calculated XRD was compared to the experimental data to confirm the prepared structure (inset Fig. 1). The main peaks were observed at similar positions; slight variations in both peak positions and intensities may occur potentially due to changes in the morphology during synthesis. The experimental peak positions were at 2θ: 10.46, 14.64, 17.96, 18.74, 21.02, 21.87, 23.87, 26.56, 31.77, 42.77, and 45.42° relative to {002}, {010}, {012}, {111}, {200}, {201}, {104}, {211}, {006}, {008}, and {217} crystal planes, respectively. Additionally, good agreement was observed between the reported Zn–O binding values from JCPDS card no. 00-036-1451 for ZnO and our recorded peak positions,54 particularly with comparable peaks at 2θ = 31.749 and 47.257.
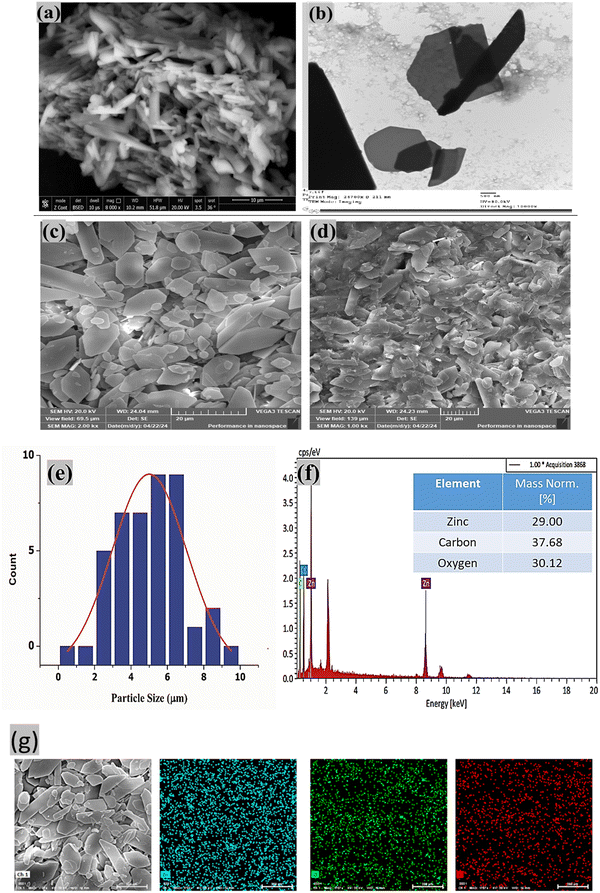
Visual observation is a crucial step in characterizing the materials under investigation. Scanning electron microscopy (SEM) and transmission electron microscopy (TEM) are commonly used to assess the morphology (size and shape) of particles. SEM and TEM micrographs revealed an aggregated polygonal plate-like morphology of Zn-MOF particles with varying dimensions (Fig. 2a and b). Additionally, the surface morphology of the GC/Zn-MOF-modified electrode, both before and after the electrochemical oxidation of PA, was examined by SEM. Notably, the SEM micrographs show a hexagonal plate-like morphology, some with truncated edges (Fig. 2c and d). This observation indicates the success of the modified electrode preparation method in increasing the surface area, which is evident from the separation of aggregated particles (compare Fig. 2a with c). Despite the apparent deterioration and agglomeration of the Zn-MOF particles after numerous cycles of PA oxidation, the porous structure remained intact (Fig. 2d).
Understanding the size distribution of particles is important, particularly for small particles. The particle size distribution was determined by measuring the diameter of the Zn-MOF particles using SEM images processed with ImageJ software (Fig. 2e). The resulting values were plotted in a histogram and fitted with a Gaussian function, which revealed a mean particle size of 5 μm.
To assess the purity and elemental distribution of the GC/Zn-MOF electrode, energy-dispersive X-ray spectrometry (EDS) elemental mapping was performed. The EDS spectra and elemental mapping of the SEM images of the GC/Zn-MOF electrode confirmed the presence and distribution of elements (C, Zn, and O) corresponding to Zn-MOF on the electrode surface (Fig. 2f and g). The uniform distribution of these elements is crucial for enhancing electrooxidation performance.
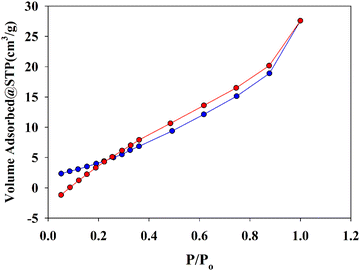
The N2 adsorption–desorption isotherm (Fig. 3) was used to study the surface area and porosity of the synthesized material. The specific surface area, porosity volume, pore size, and particle radius were determined to be 20.67 m2 g−1, 42.77 m3 g−1, 4.14 nm and 65.97 nm, respectively. It is noteworthy that the prepared Zn-MOF using the sonochemical method exhibited a higher surface area compared to the solvothermal method (18.57 m2 g−1).55
The FTIR technique was employed to identify the different types of functional groups with a band-shifting appearance after coordination, along with the observation of new bands due to zinc binding to the BDC and water molecules, as shown in Fig. 4a. First, the broadband region around 3000 cm−1 in the BDC represents the hydrogen bond formation of the carboxylic acid groups. The broad band decreased and appeared at 3411 cm−1 after MOF formation due to the OH stretching mode of the coordinated water molecule.56,57 The bands reported at 1690 cm−1 and 1280 cm−1 were associated with the uncoordinated (ν(C![[double bond, length as m-dash]](https://www.rsc.org/images/entities/char_e001.gif) O) and ν(C–O)) in the BDC, respectively.58–62 After coordination, these absorption bands were replaced by the ν(COO−) of carboxylates, and their absorption bands were shifted to νas(COO−) at ca. 1598 and 1533 cm−1, and νs(COO−) at ca. 1462 and 1410 cm−1. The difference between the two frequencies {Δ = νas(COO−) − νs(COO−)} revealed the information about the carboxylate binding type to zinc ion; the experimental values of Δνexp were 188 and 71 cm−1, which corresponded to monodentate and bridging (or chelating) binding modes, respectively.63 Therefore, we can conclude that Zn was coordinated to two bridging oxygens, one monodentate from the carboxylate linker, and one additional coordinated water molecule. Lastly, the bands at 472 and 469 cm−1 were assigned to Zn–O.64,65
O) and ν(C–O)) in the BDC, respectively.58–62 After coordination, these absorption bands were replaced by the ν(COO−) of carboxylates, and their absorption bands were shifted to νas(COO−) at ca. 1598 and 1533 cm−1, and νs(COO−) at ca. 1462 and 1410 cm−1. The difference between the two frequencies {Δ = νas(COO−) − νs(COO−)} revealed the information about the carboxylate binding type to zinc ion; the experimental values of Δνexp were 188 and 71 cm−1, which corresponded to monodentate and bridging (or chelating) binding modes, respectively.63 Therefore, we can conclude that Zn was coordinated to two bridging oxygens, one monodentate from the carboxylate linker, and one additional coordinated water molecule. Lastly, the bands at 472 and 469 cm−1 were assigned to Zn–O.64,65
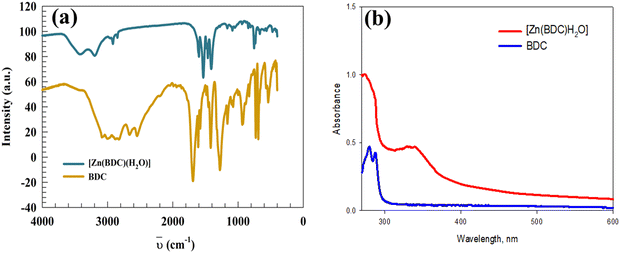 | ||
| Fig. 4 (a) FTIR of 1,3-benzene dicarboxylic acid (BDC) and [Zn(BDC)(H2O)]. (b) UV-vis spectra of 1,3-benzene dicarboxylic acid (BDC) and [Zn(BDC)(H2O)]. | ||
The electronic transitions (UV-vis) of the 1,3-benzene dicarboxylate linker and its Zn-MOF are shown in Fig. 4b. In both compounds, the basic transitions were related to the organic moieties, which corresponded to π–π* transitions due to the aromatic component and n–π* transitions arising from the carbonyl groups. Upon coordination of Zn to BDC, the previously mentioned transitions were shifted from 279.0 to 283.0 nm and from 288.0 to 339.0 nm, respectively.
The (1H and 13C NMR) nuclear magnetic resonance spectra of the synthesized Zn-MOF signals confirmed the suggested structure [Zn(BDC)(H2O)], as shown in Fig. S1 and S2 (ESI†). Different non-equivalent protons appeared in the resonated spectra at different values of the applied field. The water protons (Ha) were observed at 3.37 ppm as a singlet signal, while the protons related to the aromatic nuclei were observed at 7.42–7.48 ppm (Hb, triplet), 8.04–8.06 ppm (2Hc, doublet) and 8.56 ppm (Hd, singlet). The di-anionic behavior of 1,3-benzene dicarboxylic acid was explored from the absence of the carboxylic group proton in the Zn-MOF spectrum, which was reported before at 13.0 ppm.66–68 The 13C-NMR spectrum showed a signal at 171.21 ppm, which can be assigned to the carbonyl carbon of the carboxylate group. The carbons related to the benzene ring were observed from 127.75 to 134.37 ppm, as shown in Fig. S2 (ESI†).
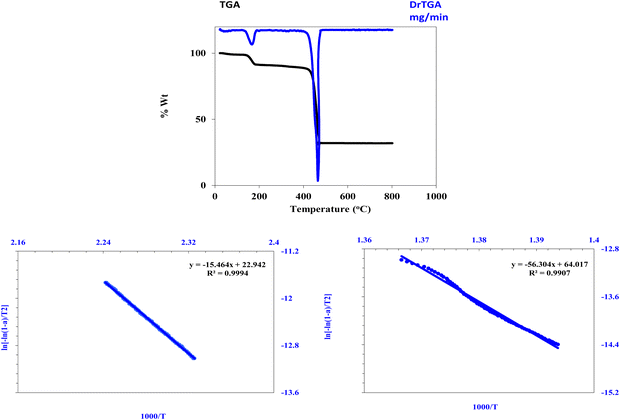
The synthesized Zn-MOF underwent thermal decomposition in two steps, as shown in Fig. 5, resulting in the formation of a ZnO precipitate as the final residual product, with an observed residual weight percentage of 31.90% and a calculated percentage of 32.88%. Initially, Zn-MOF decomposed with the loss of coordinated water molecules at 172 °C, with an observed weight loss of 7.90% and a calculated loss of 7.27%. Subsequently, the 1,3-benzene dicarboxylate linker decomposed at 465.0 °C, resulting in a decrease in the thermogram, with an observed weight loss of 60.10% and a calculated loss of 59.84%. The stability of the formed Zn-MOF was estimated from its thermal decomposition. Fig. 5 and Table 1 present the Coats–Redfern (CR) method, which is used to evaluate the kinetic and thermodynamic parameters. The obtained activation energy values reveal the stability of the synthesized Zn-MOF. Based on the results obtained using various characterization techniques, including thermal analysis, the structure was confirmed to be [Zn(BDC)(H2O)].
3.2. Electrocatalytic behavior of Zn-MOF
Before investigating the estimation of PA in the presence of various interfering species at physiological pH using the Zn-MOF-modified electrode, we studied the oxidation of PA using cyclic voltammetry (CV). CV of the GC/Zn-MOF electrode was performed to investigate the electrochemical behavior of 50 μM PA. The potential was scanned from 0.0 to 0.8 V at a scan rate of 50 mV s−1. Fig. 6a shows the CV responses of the pristine GC and modified GC/Zn-MOF electrodes in PBS at pH 7.4. Remarkably, the current observed for the modified electrode exceeded that of the bare GCE, accompanied by the observation of a peak at 0.6 V related to the oxidation of PA to n-acetyl-p-benzoquinoneimine (Fig. S3, ESI†). No cathodic peak was observed in the reverse scan, suggesting that either the oxidized species (n-acetyl-p-benzoquinoneimine or p-benzoquinone) were present in insignificant concentrations near the electrode surface during the reverse sweep or they were not reducible within the investigated potential range. Furthermore, we investigated the stability of the modified electrode during PA oxidation by continuously recording CVs. Fig. 6b shows the CVs obtained over 50 consecutive potential scans for the oxidation of PA. Examination of these curves reveals a slight decrease in the oxidation potential of PA after 50 continuous potential scans.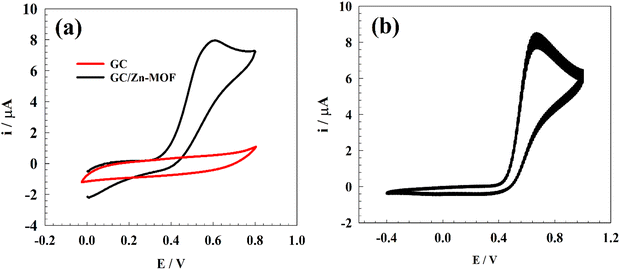 | ||
| Fig. 6 (a) CVs of GC and GC/Zn-MOF electrodes in 0.1 M PBS (pH = 7.4) in the presence of 50 μM PA at a scan rate of 50 mV s−1. (b) Repeated 50 CV curves of the modified electrode Zn-MOF. | ||
3.3. Effect of scan rate
To attain a comprehensive understanding of PA sensing, we assessed the kinetic parameters for the oxidation process of PA over the modified electrode. Fig. 7a depicts the CVs of the GC/Zn-MOF-modified electrode in 0.05 M PBS containing 25 μM PA. The scan rate used in the experiments was 5–200 mV s−1. The Randles–Sevcik equation was employed to estimate the diffusion coefficient (D):69| Ip = 2.99 × 10⁵nACo[(1 − α)noDυ]0.5 |
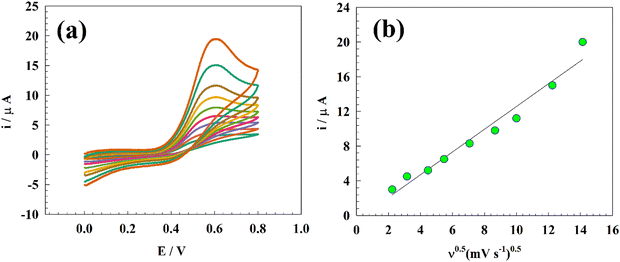 | ||
| Fig. 7 (a) CV curves of the modified Zn-MOF electrode at different scan rates, and (b) linear relationship between the anodic oxidation current and square root of the sweep rate. | ||
3.4. Calibration curve and the effect of concentration
PA is one of the most widely used and effective antipyretic medications. The permissible concentration range of PA in serum should be less than 30 mg L−1 (200 μmol L−1) to prevent PA poisoning.70 Consequently, a calibration curve of PA was constructed using the DPV approach, and the impact of altering the PA concentration was examined (Fig. 8a). The sensitivity of the electrode was assessed in 0.05 M PBS at pH 7.4, using a calibration curve at a concentration range of 1 × 10⁻⁶–80 × 10−6 M. The electrode exhibited two linear ranges of PA concentrations, namely 1–5 and 5–80 μM. The sensor exhibited two linear responses, represented by the following equations (Fig. 8b):| Ip (μA) = 0.72CPA (μM) + 1.25 |
| Ip (μA) = 0.25CPA (μM) + 3.012 |
where m is the slope and S is the standard deviation. The LOD and LOQ values determined were 0.104 and 0.347 μM, respectively, for the GC/Zn-MOF modified electrode at low concentrations. On the other hand, at high concentrations, the observed values of LOD and LOQ were 0.301 and 1.01 μM, respectively. The results obtained for the measurement of PA were compared with previously reported values, as shown in Table 2.
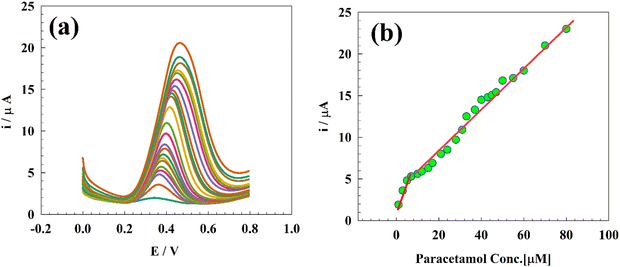 | ||
| Fig. 8 (a) DPV for different concentrations of PA, and (b) calibration curve of the GC/Zn-MOF-modified electrode. | ||
| Electrode | Linear range (μM) | Limit of detection (μM) | Electrochemical technique | Ref. |
|---|---|---|---|---|
| GC/Zn-MOF | 1–5 | 0.104 | DPV | This work |
| 5–80 | 0.301 | |||
| GC/Chit/CB/RGO | 2.8–190 | 0.053 | SWV | 71 |
| GC/PTHR/GO/CNT | 5–200 | 0.16 | DPV | 72 |
| GC/Co(OH)3 | 50–550 | 1.83 | Amperometry | 73 |
| GC/Pd-Schiff base | 1–50 | 0.067 | Cyclic voltammetry | 12 |
| CPE/CeO2–Cu2O/Pt | 0.4–32 | 0.05 | Cyclic voltammetry | 74 |
The GC/Zn-MOF-modified electrode was utilized to quantify PA in tablet form, allowing for the practical validation of the suggested technique. Tablets of Panadol® home brand containing 500 mg of PA were ground into a powder, dissolved in PBS, and then filtered to remove any solids. The standard addition method was used to determine the recovery rate. As shown in Table 3, the detection results revealed a high degree of agreement with the values provided by the manufacturer. The obtained recovery values ranged from 97% to 99.1% of the original value.
| Sample | Added concentration (μM) | Found concentration (μM) | Recovery (%) |
|---|---|---|---|
| 1 | 25 | 24 | 96 |
| 2 | 35 | 33 | 94 |
| 3 | 40 | 39 | 98 |
| 4 | 50 | 48 | 96 |
| 5 | 70 | 68 | 97 |
3.5. Chronoamperometry study
The stability of the modified electrode during constant potential oxidation was evaluated using the chronoamperometry technique at its oxidation peak potential. The chronoamperogram shown in Fig. 9a indicates a decrease in current by 11.7% after 20 minutes of continuous oxidation. This decline in the oxidation current can be attributed to the depletion of PA near the electrode surface and/or the mechanical degradation of the electrode surface.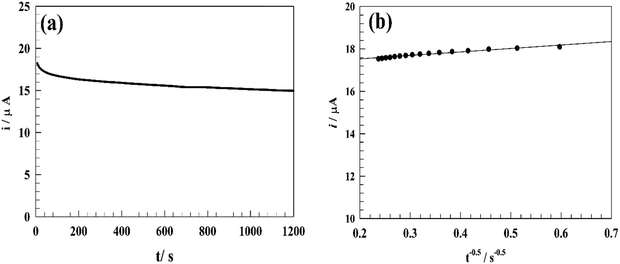 | ||
| Fig. 9 (a) Chronoamperogram for the modified electrode in 50 μM PA at 0.5 V in PBS (pH 7.4). (b) Linear relationship between t−0.5vs. oxidation current of PA. | ||
The diffusion coefficient (D) related to the modified electrode surface during the PA oxidation process was determined using the chronoamperometry technique. A chronoamperogram of 50 μM PA in PBS was recorded, and the ipversus t−1/2 curve was plotted, as shown in Fig. 9b.
The diffusion coefficient D (cm2 s−1) was estimated using Cottrell's equation by plotting Ip against t−1/2, where C, n and A represent the PA concentration in the solution (mol cm−3), the number of electrons involved in the reaction, and the electrode surface area (cm2), respectively:
3.6. EIS study
EIS measurements were performed over the frequency range of 0.01 Hz to 100 kHz. The electrode was immersed in 0.05 M PBS containing different concentrations of PA, ranging from 10 to 100 μM. The electrode was held at a potential of 0.5 V relative to the Ag/AgCl reference electrode. The Nyquist plots shown in Fig. 10a were analyzed using the NOVA version 2.16 fitting program in AUTOLAB128N. The inset in Fig. 10a displays the Randles equivalent circuit, where the parameters Rs, Rct, Cdl, and W correspond to the solution resistance, charge transfer resistance, double-layer capacitance, and Warburg impedance, respectively. The diameter of the semicircular section represents the charge transfer resistance, whereas the linear portion at lower frequencies represents the diffusion impedance. The resulting electrical circuit characteristics are listed in Table 4. Fig. 10b illustrates the linear relationship between Rct and PA concentration, indicating the potential utility of a non-destructive technique like EIS for estimating PA concentrations.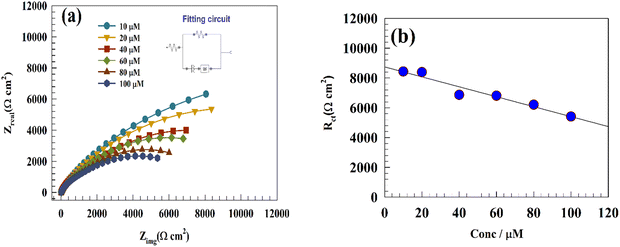 | ||
| Fig. 10 (a) Nyquist plot of the GC/Zn-MOF-modified electrode showing variations in the PA concentrations. (b) Linear relationship between the charge transfer resistance, Rct, and PA concentration. | ||
| PA concentration (μM) | R s (Ω cm2) | R ct (Ω cm2) | Q | W | |
|---|---|---|---|---|---|
| Y 0 (Ω−1 cm2 s−n) | n | Y 0 (Ω−1 cm2 s−n) | |||
| 10 | 10.82 | 8435 | 0.000013716 | 0.735 | 0.0000189 |
| 20 | 6.82 | 8391 | 0.000016823 | 0.681 | 0.0000248 |
| 40 | 10.06 | 6868 | 0.000018171 | 0.751 | 0.0000265 |
| 60 | 10.21 | 6810 | 0.000021138 | 0.525 | 0.0000252 |
| 80 | 9.54 | 6210 | 0.000026418 | 0.681 | 0.0000275 |
| 100 | 6.22 | 5410 | 0.000029214 | 0.693 | 0.0000314 |
3.7. Effect of pH
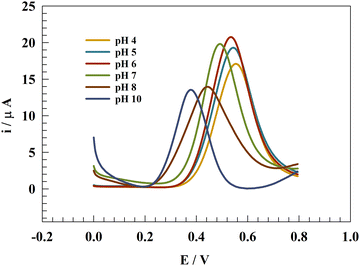
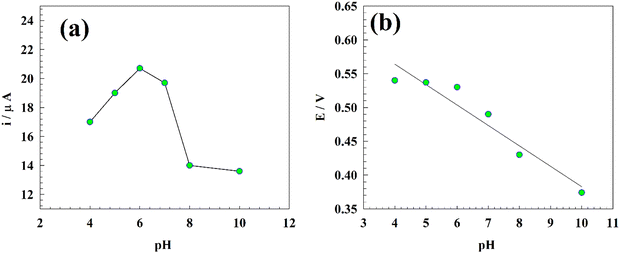
This experiment aimed to investigate the impact of pH on the electrochemical determination of PA, with a focus on identifying the optimal measurement conditions. It is worth noting that the blood pH value is approximately 7.4, while urine typically ranges from 4.5 to 8.75,76Fig. 11 illustrates the differential pulse voltammetry (DPV) conducted on a modified glassy carbon electrode with Zn-MOF at pH values ranging from 4 to 10. The experiment was performed in 0.05 M PBS containing 25 μM PA using the DPV technique. The measured oxidation peak current displayed fluctuations in response to changes in the solution pH, reaching a maximum value at pH 6.0. Moreover, the current in acidic media was found to exceed that in the basic media, possibly because of the improved durability of Zn-MOF in the acidic environment, as shown in Fig. 12a.A positive correlation was observed between the oxidation peak potential (Ep) and the pH of the solution. The change in Ep towards more negative values with an increase in pH is described by the following equation:
| Ep = 0.68 − 0.031pH, R2 = 0.994 |
3.8. Interference
The electrode's selectivity towards PA was assessed in the presence of various interfering species using chronoamperometry at 0.5 V. As shown in Fig. 13, the electrode exhibited noticeable activity after sequential exposure to different types of interfering species. To investigate the interference, PA was added to PBS, followed by the addition of three groups of interfering species.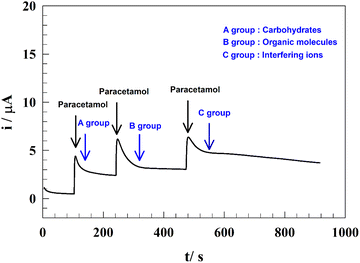 | ||
| Fig. 13 Representation of the anti-interference performance of the modified electrode in different matrix types. | ||
The first group comprised carbohydrates, with glucose–fructose added at a concentration of 100 μM. This addition resulted in a slight decrease in the current (∼5% of the initial value). The second step involved the addition of organic compounds (Group B), such as ascorbic acid, citric acid, β-alanine, and cysteine, each at a concentration of 50 μM. The resulting current remained stable over time. Finally, the anti-interference performance of the tested electrode was evaluated against the added metal ions and anions, including Mg2+, Ca2+, Fe3+, Na+, K+, SO4−, and Cl− at a concentration of 100 μM.
The noticeable decrease in the current observed when metal ions and anions were added can be attributed to their adsorption at the surface, which influences the diffusion of PA toward the electrode surface. In general, all studied interfering species showed less than a 5% decrease in the measured current. These results indicate that the added species did not significantly affect the determination of PA, demonstrating the excellent sensitivity of the modified electrode towards PA.
3.9. Real sample
The effectiveness of the modified Zn-MOF electrode as a viable electrode for PA estimation in real samples, such as spiked human blood serum, was investigated. The following procedure was used for the analysis of actual samples to determine the amount of PA: human blood serum samples were collected and stored in sterile vials at 4 °C. To reduce matrix complexity, sample dilution was performed 200 times using 0.1 mol L−1 PBS at pH 7.4. A stock solution of PA at a concentration of 1 mmol L−1 was prepared by dissolving PA in blood serum without any pretreatment. This stock solution in 10 mL of 0.1 mol L−1 PBS (pH = 7.4) served as the starting point for standard additions. All observations were conducted at an ambient temperature (20 °C).The ability of the modified electrode to detect PA was investigated using low- and high-concentration ranges. Fig. 14a shows the DPV of the modified GC/Zn-MOF at a concentration range of 50–100 μM, with a detection limit of 0.11 μM. Similarly, Fig. 14b depicts the DPV results for higher PA concentrations up to 300 μM, showing a detection limit of 0.122 μM.
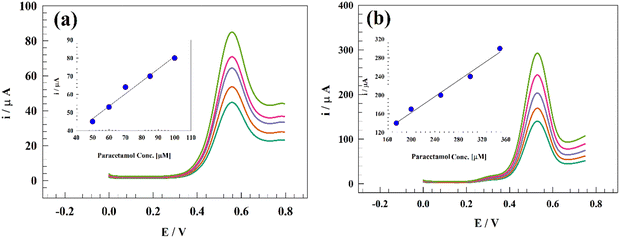 | ||
| Fig. 14 DPV of the GC/Zn-MOF-modified electrode at a concentration range of (a) 50–100 μM PA and (b) 100–300 μM PA. | ||
3.10. Theoretical study of paracetamol adsorption on the Zn-MOF surface
The Dmol3 numerical-based DFT modules were employed to examine the optimal shapes of both Zn-MOF and paracetamol structures employing density functional theory (DFT) calculations.82 This computational research employed the spin-unrestricted generalized gradient approximation (GGA) method within the PW91 framework,83,84 paired with the DNP basis set that shares similarities with the Gaussian 6-31G** basis set.85 Chemisorption of the paracetamol molecule on the top site of the Zn-MOF atoms following the cleavage of Zn-MOF {200}, {002}, and {006} surfaces was explored in this study.The convergence criteria employed for geometry optimization included a maximum force limit of 4 × 10⁻² eV Å−1 and an energy threshold of 2 × 10⁻⁵ eV per atom. The following equation was employed to calculate the binding energies (E) of PA adsorbed on various surfaces:86
| Eads = E(surface+adsorbate) − Esurface − Eadsorbate |
The intermolecular potential energies of PA-Zn-MOF and the other intermediates were calculated using the COMPASS force field. Molecular dynamics simulations were preceded by energy minimization of all systems using the minimizer tool in Material Studio. This process aimed to optimize the shape of the system. During the calculation of the minima, a maximum iteration of 10![[thin space (1/6-em)]](https://www.rsc.org/images/entities/char_2009.gif) 000 was performed, and an ultrafine convergence level was utilized to ensure precise optimization. Fig. 15 shows different forms of PA adsorption on Zn-MOF {200}, with form no. 8 exhibiting the highest binding energy attributed to the interaction between zinc atoms and carbon in the paracetamol skeleton. It is important to note that a more negative value for adsorption energy indicates higher favorability of the form for paracetamol adsorption.
000 was performed, and an ultrafine convergence level was utilized to ensure precise optimization. Fig. 15 shows different forms of PA adsorption on Zn-MOF {200}, with form no. 8 exhibiting the highest binding energy attributed to the interaction between zinc atoms and carbon in the paracetamol skeleton. It is important to note that a more negative value for adsorption energy indicates higher favorability of the form for paracetamol adsorption.
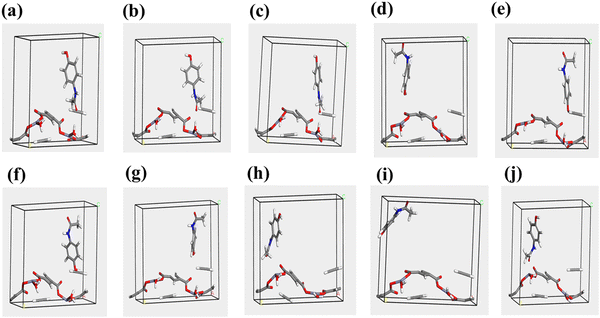 | ||
| Fig. 15 Different adsorption possibilities, denoted from (a) to (j), for the {200} surface of Zn-MOF. | ||
Similarly, Fig. S4 (ESI†) shows different forms of paracetamol adsorption on Zn-MOF {002}, with the highest binding energy observed for form no. 10 (−0.049 to −0.066 Hartree), attributed to the interaction between the zinc atoms and electron-donating atoms in paracetamol. Additionally, the third facet, Zn-MOF {006}, was studied, as shown in Fig. S5 (ESI†), with binding energy for PA-Zn-MOF in the range of −0.087 to −0.141 Hartree. A comparison of the different adsorption possibilities suggests that hydrogen bonding between N in paracetamol and oxygen in the Zn-MOF structure. By comparing the different adsorption possibilities, we concluded that the surface of Zn-MOF is suitable for paracetamol adsorption. Table 5 lists the binding energies for the different MOF facets and adsorption forms.
| Plane | Form no. | |||||||||
|---|---|---|---|---|---|---|---|---|---|---|
| 1 | 2 | 3 | 4 | 5 | 6 | 7 | 8 | 9 | 10 | |
| Zn-MOF{200} | −0.065 | −0.068 | −0.087 | −0.067 | −0.088 | −0.054 | −0.071 | −0.121 | −0.088 | −0.091 |
| Zn-MOF{002} | −0.062 | −0.062 | −0.065 | −0.049 | −0.059 | −0.050 | −0.064 | −0.059 | −0.058 | −0.066 |
| Zn-MOF{006} | −0.141 | −0.094 | −0.108 | −0.129 | −0.087 | −0.115 | −0.103 | −0.092 | −0.103 | −0.099 |
4. Conclusions
White crystals of the zinc-BDC framework were successfully synthesized using a facile and fast US irradiation technique. Using several analytical techniques, the Zn-MOF structure was determined to be [Zn(BDC)(H2O)], comprising tetrahedral Zn atoms bonded to three carboxylate groups and one water molecule. The US method facilitated the formation of a crystalline structure with a large surface area and porous character. The electrode demonstrated effective electrochemical detection of paracetamol and exhibited high anti-interference ability towards different species. Notably, it displayed remarkable sensitivity for detecting paracetamol in blood in the concentration range of 50 to 100 μM, with a detection limit of 0.11 μM. Furthermore, the detection range surpassed that of similar electrodes reported in the literature. Paracetamol was found to preferentially adsorb onto the {006} facet of the Zn-MOF surface. Overall, the Zn-MOF electrode exhibited exceptional performance, with a high anti-interference ability against various interfering species, including carbohydrates, metal ions, and organic molecules. In conclusion, the proposed GC/Zn-MOF electrode is simple, reliable, and practical, showing promising potential for application as a PA sensor.Data availability
The datasets used and analyzed during the current study are available from the corresponding author upon reasonable request.Author contributions
The authors have contributed equally to this work.Conflicts of interest
The authors declare that they have no known competing financial interests or personal relationships that could have appeared to influence the work reported in this paper.References
- Y. Fan, J.-H. Liu, H.-T. Lu and Q. Zhang, Electrochemical behavior and voltammetric determination of paracetamol on Nafion/TiO2–graphene modified glassy carbon electrode, Colloids Surf., B, 2011, 85, 289–292 CrossRef CAS PubMed
.
- I. Dalmázio, T. Alves and R. Augusti, An appraisal on the degradation of paracetamol by TiO2/UV system in aqueous medium: product identification by gas chromatography-mass spectrometry (GC-MS), J. Braz. Chem. Soc., 2008, 19, 81–88 Search PubMed
.
- W. Lohmann and U. Karst, Simulation of the detoxification of paracetamol using on-line electrochemistry/liquid chromatography/mass spectrometry, Anal. Bioanal. Chem., 2006, 386, 1701–1708 CrossRef CAS PubMed
.
- K. L. Muldrew, L. P. James, L. Coop, S. S. McCullough, H. P. Hendrickson, J. A. Hinson and P. R. Mayeux, Determination of acetaminophen-protein adducts in mouse liver and serum and human serum after hepatotoxic doses of acetaminophen using high-performance liquid chromatography with electrochemical detection, Drug Metab. Dispos., 2002, 30, 446–451 CrossRef CAS PubMed
.
- G. S. N. Lau and J. Critchley, The estimation of paracetamol and its major metabolites in both plasma and urine by a single high-performance liquid chromatography assay, J. Pharm. Biomed. Anal., 1994, 12, 1563–1572 CrossRef CAS PubMed
.
- R. R. Cunha, S. C. Chaves, M. M. A. C. Ribeiro, L. M. F. C. Torres, R. A. A. Muñoz, W. T. P. Dos Santos and E. M. Richter, Simultaneous determination of caffeine, paracetamol, and ibuprofen in pharmaceutical formulations by high-performance liquid chromatography with UV detection and by capillary electrophoresis with conductivity detection, J. Sep. Sci., 2015, 38, 1657–1662 CrossRef CAS PubMed
.
- J. Vilchez, R. Blanc, R. Avidad and A. Navalón, Spectrofluorimetric determination of paracetamol in pharmaceuticals and biological fluids, J. Pharm. Biomed. Anal., 1995, 13, 1119–1125 CrossRef CAS PubMed
.
- M. de los, A. Oliva, R. A. Olsina and A. N. Masi, Selective spectrofluorimetric method for paracetamol determination through coumarinic compound formation, Talanta, 2005, 66, 229–235 CrossRef PubMed
.
- S. S. Medany, M. A. Hefnawy, S. A. Fadlallah and R. M. El-Sherif, Zinc oxide–chitosan matrix for efficient electrochemical sensing of acetaminophen, Chem. Pap., 2024, 78, 3049–3061, DOI:10.1007/s11696-023-03292-3
.
- R. Rama, S. Meenakshi, K. Pandian and S. C. B. Gopinath, Room temperature ionic liquids-based electrochemical sensors: an overview on paracetamol detection, Crit. Rev. Anal. Chem., 2022, 52, 1422–1431 CrossRef CAS PubMed
.
- X. Kang, J. Wang, H. Wu, J. Liu, I. A. Aksay and Y. Lin, A graphene-based electrochemical sensor for sensitive detection of paracetamol, Talanta, 2010, 81, 754–759 CrossRef CAS PubMed
.
- M. A. Hefnawy, S. S. Medany, S. A. Fadlallah, R. M. El-Sherif and S. S. Hassan, Novel Self-assembly Pd(II)-Schiff Base Complex Modified Glassy Carbon Electrode for Electrochemical Detection of Paracetamol, Electrocatalysis, 2022, 13, 598–610, DOI:10.1007/s12678-022-00741-7
.
- M. A. Hefnawy, S. A. Fadlallah, R. M. El-Sherif and S. S. Medany, Competition between enzymatic and non-enzymatic electrochemical determination of cholesterol, J. Electroanal. Chem., 2023, 930, 117169, DOI:10.1016/j.jelechem.2023.117169
.
- N. S. Al-Kadhi, M. A. Hefnawy, S. S. Nafee, F. S. Alamro, R. A. Pashameah, H. A. Ahmed and S. S. Medany, Zinc Nanocomposite Supported Chitosan for Nitrite Sensing and Hydrogen Evolution Applications, Polymers, 2023, 15, 2357, DOI:10.3390/polym15102357
.
- N. S. Al-Kadhi, M. A. Hefnawy, F. S. Alamro, R. A. Pashameah, H. A. Ahmed and S. S. Medany, Polyaniline-Supported Nickel Oxide Flower for Efficient Nitrite Electrochemical Detection in Water, Polymers, 2023, 15, 1804, DOI:10.3390/polym15071804
.
- A. G. Cardoso, H. Viltres, G. A. Ortega, V. Phung, R. Grewal, H. Mozaffari, S. R. Ahmed, A. R. Rajabzadeh and S. Srinivasan, Electrochemical sensing of analytes in saliva: challenges, progress, and perspectives, TrAC, Trends Anal. Chem., 2023, 116965 CrossRef CAS
.
- U. Guth, W. Vonau and J. Zosel, Recent developments in electrochemical sensor application and technology—a review, Meas. Sci. Technol., 2009, 20, 42002 CrossRef
.
- W. Tan, M. Zidan, Z. Zainal, A. Halim Abdullah and J. K. Goh, Electrocatlytic oxidation of ascorbic acid mediated by ZnO microcrystalline modified glassy carbon electrode, Orient. J. Chem., 2010, 26, 45 CAS
.
- G. Yang, L. Wang, J. Jia, D. Zhou and D. Li, Chemically modified glassy carbon electrode for electrochemical sensing paracetamol in acidic solution, J. Solid State Electrochem., 2012, 16, 2967–2977 CrossRef CAS
.
- K. Tyszczuk-Rotko, I. Bęczkowska, M. Wójciak-Kosior and I. Sowa, Simultaneous voltammetric determination of paracetamol and ascorbic acid using a boron-doped diamond electrode modified with Nafion and lead films, Talanta, 2014, 129, 384–391 CrossRef CAS PubMed
.
- M. H. Pournaghi-Azar, S. Kheradmandi and A. Saadatirad, Simultaneous voltammetry of paracetamol, ascorbic acid, and codeine on a palladium-plated aluminum electrode: oxidation pathway and kinetics, J. Solid State Electrochem., 2010, 14, 1689–1695 CrossRef CAS
.
- A. K. Vidyadharan, D. Jayan and T. E. Mary Nancy, Ni0. 1Co0. 9Fe2O4-based electrochemical sensor for the detection of paracetamol, J. Solid State Electrochem., 2014, 18, 2513–2519 CrossRef CAS
.
- S. Iijima, Helical microtubules of graphite carbon, Nature, 1999, 56, 354 Search PubMed
.
- J. B. Raoof, F. Chekin, R. Ojani, S. Barari, M. Anbia and S. Mandegarzad, Synthesis and characterization of ordered mesoporous carbon as electrocatalyst for simultaneous determination of epinephrine and acetaminophen, J. Solid State Electrochem., 2012, 16, 3753–3760 CrossRef CAS
.
- H. Yang, G.-X. Zhang, H.-J. Zhou, Y.-Y. Sun and H. Pang, Metal–Organic Frameworks Meet MXene: New Opportunities for Electrochemical Application, Energy Mater. Adv., 2023, 4, 33 CrossRef CAS
.
- X. Fu, B. Ding and D. D’Alessandro, Fabrication strategies for metal-organic framework electrochemical biosensors and their applications, Coord. Chem. Rev., 2023, 475, 214814 CrossRef CAS
.
- H. Sohrabi, F. Maleki, P. Khaaki, M. Kadhom, N. Kudaibergenov and A. Khataee, Electrochemical-Based Sensing Platforms for Detection of Glucose and H2O2 by Porous Metal–Organic Frameworks: A Review of Status and Prospects, Biosensors, 2023, 13, 347 CrossRef CAS PubMed
.
- Z. Chen, Y. Li, Y. Cai, S. Wang, B. Hu, B. Li, X. Ding, L. Zhuang and X. Wang, Application of covalent organic frameworks and metal–organic frameworks nanomaterials in organic/inorganic pollutants removal from solutions through sorption-catalysis strategies, Carbon Res., 2023, 2, 8 CrossRef
.
- S. C. Moore, M. R. Smith, J. L. Trettin, R. A. Yang and M. L. Sarazen, Kinetic impacts of defect sites in metal–organic framework catalysts under varied driving forces, ACS Energy Lett., 2023, 8, 1397–1407 CrossRef CAS
.
- F. Zheng, T. Lin, K. Wang, Y. Wang and G. Li, Recent advances in bimetallic metal-organic frameworks and their derivatives for thermal catalysis, Nano Res., 2023, 1–17 CAS
.
- Q. Yao, X. Zhang, Z.-H. Lu and Q. Xu, Metal-organic framework-based catalysts for hydrogen production from liquid-phase chemical hydrides, Coord. Chem. Rev., 2023, 493, 215302 CrossRef CAS
.
- X. Ke, Z. Zhao, J. Huang, C. Liu, G. Huang, J. Tan, H. Zhu, Z. Xiao, X. Liu and Y. Mei, Growth Control of Metal–Organic Framework Films on Marine Biological Carbon and Their Potential-Dependent Dopamine Sensing, ACS Appl. Mater. Interfaces, 2023, 15, 12005–12016 CrossRef CAS PubMed
.
- P. Li, Y. Peng, J. Cai, Y. Bai, Q. Li and H. Pang, Recent Advances in Metal–Organic Frameworks (MOFs) and Their Composites for Non-Enzymatic Electrochemical Glucose Sensors, Bioengineering, 2023, 10, 733 CrossRef CAS PubMed
.
- J. Dong, J. Zheng, J. Hou, P. Zhao, Y. Liang, J. Lei, X. Luo, C. Hou and D. Huo, Au Nanoparticle/CoFc/Metal–Organic Framework as Enzyme-Free Dual-Signal Ratiometric Electrochemical Sensor for In-Situ Determination of Cell-Secreted H2O2, ACS Appl. Nano Mater., 2023, 6(13), 11630–11639 CrossRef CAS
.
- E. F. Hasan Alzaimoor and E. Khan, Metal–Organic Frameworks (MOFs)-Based Sensors for the Detection of Heavy Metals: A Review, Crit. Rev. Anal. Chem., 2023, 1–22 CrossRef PubMed
.
- Y.-N. Chang, C.-H. Shen, C.-W. Huang, M.-D. Tsai and C.-W. Kung, Defective Metal–Organic Framework Nanocrystals as Signal Amplifiers for Electrochemical Dopamine Sensing, ACS Appl. Nano Mater., 2023, 6, 3675–3684 CrossRef CAS
.
- K. G. Motora, C.-M. Wu and K.-C. Li, Effective Azo-functionalized metal-organic framework colorimetric and ratiometric sensor for detection of heavy metals in aqueous solution by the naked eye, J. Environ. Chem. Eng., 2023, 11, 110144 CrossRef CAS
.
- D. Huang, X. Huang, J. Chen, R. Ye, Q. Lin and S. Chen, An electrochemical bisphenol: A sensor based on bimetallic Ce-Zn-MOF, Electrocatalysis, 2021, 12, 456–468 CrossRef CAS
.
- J. Zhang, L. Gao, Y. Zhang, R. Guo and T. Hu, A heterometallic sensor based on Ce@ Zn-MOF for electrochemical recognition of uric acid, Microporous Mesoporous Mater., 2021, 322, 111126 CrossRef CAS
.
- M. H. Mashhadizadeh, S. M. Kalantarian and A. Azhdeh, A novel electrochemical sensor for simultaneous determination of hydroquinone, catechol, and resorcinol using a carbon paste electrode modified by Zn-MOF, nitrogen-doped graphite, and AuNPs, Electroanalysis, 2021, 33, 160–169 CrossRef CAS
.
- M. Baghayeri, M. Ghanei-Motlagh, R. Tayebee, M. Fayazi and F. Narenji, Application of graphene/zinc-based metal-organic framework nanocomposite for electrochemical sensing of As (III) in water resources, Anal. Chim. Acta, 2020, 1099, 60–67 CrossRef CAS PubMed
.
- Z. Li, Q. Li, R. Jiang, Y. Qin, Y. Luo, J. Li, W. Kong, Z. Yang, C. Huang and X. Qu, An electrochemical sensor based on a MOF/ZnO composite for the highly sensitive detection of Cu (II) in river water samples, RSC Adv., 2022, 12, 5062–5071 RSC
.
- C.-W. Huang, V.-H. Nguyen, S.-R. Zhou, S.-Y. Hsu, J.-X. Tan and K. C.-W. Wu, Metal–organic frameworks: preparation and applications in highly efficient heterogeneous photocatalysis, Sustain, Energy Fuels, 2020, 4, 504–521 CAS
.
- M. Moharramnejad, A. Ehsani, M. Shahi, S. Gharanli, H. Saremi, R. E. Malekshah, Z. S. Basmenj, S. Salmani and M. Mohammadi, MOF as nanoscale drug delivery devices: Synthesis and recent progress in biomedical applications, J. Drug Deliv. Sci. Technol., 2023, 81, 104285 CrossRef CAS
.
- H. Kaur, N. Devi, S. S. Siwal, W. F. Alsanie, M. K. Thakur and V. K. Thakur, Metal–organic framework-based materials for wastewater treatment: superior adsorbent materials for the removal of hazardous pollutants, ACS Omega, 2023, 8, 9004–9030 CrossRef CAS PubMed
.
- E. Issaka, J. N. O. Amu-Darko, M. Adams, S. Yakubu, E. Gyimah, N. Ali, J. Cui and M. Bilal, Zinc imidazolate metal–organic frameworks-8-encapsulated enzymes/nanoenzymes for biocatalytic and biomedical applications, Catal. Lett., 2023, 153, 2083–2106 CrossRef CAS
.
- H. Ramezanalizadeh, F. Zakeri and F. Manteghi, Immobilization of BaWO4 nanostructures on a MOF-199-NH2: An efficient separable photocatalyst for the degradation of organic dyes, Optik, 2018, 174, 776–786 CrossRef CAS
.
-
C. Vaitsis, G. Sourkouni and C. Argirusis, in Sonochemical synthesis of MOFs, Met. Fram. Biomed. Appl., Elsevier, 2020, pp. 223–244 Search PubMed
.
- S. Głowniak, B. Szczęśniak, J. Choma and M. Jaroniec, Recent developments in sonochemical synthesis of nanoporous materials, Molecules, 2023, 28, 2639 CrossRef PubMed
.
- G. Lin, B. Zeng, J. Li, Z. Wang, S. Wang, T. Hu and L. Zhang, A systematic review of metal organic frameworks materials for heavy metal removal: Synthesis, applications and mechanism, Chem. Eng. J., 2023, 460, 141710 CrossRef CAS
.
- A. Kazemi Korayem, S. Ghamami and Z. Bahrami, Fractal properties and morphological investigation of nano-amiodarone using image processing, Signal, Image and Video Processing, 2019, 13, 281–287 CrossRef
.
- X. Liu, Z. Wu, R. Cavalli and G. Cravotto, Sonochemical preparation of inorganic nanoparticles and nanocomposites for drug release–A review, Ind. Eng. Chem. Res., 2021, 60, 10011–10032 CrossRef CAS
.
- T. J. Otto and K. A. Wheeler, Aqua (benzene-1, 3-dicarboxylato) zinc (II), Acta Crystallogr., Sect. C: Cryst. Struct. Commun., 2001, 57, 704–705 CrossRef CAS PubMed
.
- P. D. File, Joint committee on powder diffraction standards, ASTM, Philadelphia, Pa, 1967, pp. 9–185.
- Y. Zhang, X. Kang, P. Guo, H. Tan and S.-H. Zhang, Studies on the removal of phosphate in water through adsorption using a novel Zn-MOF and its derived materials, Arab. J. Chem., 2022, 15, 103955, DOI:10.1016/j.arabjc.2022.103955
.
-
G. Socrates, Infrared and Raman characteristic group frequencies: tables and charts, John Wiley & Sons, 2004 Search PubMed
.
- K. I. Hadjiivanov, D. A. Panayotov, M. Y. Mihaylov, E. Z. Ivanova, K. K. Chakarova, S. M. Andonova and N. L. Drenchev, Power of infrared and Raman spectroscopies to characterize metal-organic frameworks and investigate their interaction with guest molecules, Chem. Rev., 2020, 121, 1286–1424 CrossRef PubMed
.
- S. Bordiga, C. Lamberti, G. Ricchiardi, L. Regli, F. Bonino, A. Damin, K.-P. Lillerud, M. Bjorgen and A. Zecchina, Electronic and vibrational properties of a MOF-5 metal–organic framework: ZnO quantum dot behaviour, Chem. Commun., 2004, 2300–2301 RSC
.
- C. A. S. Téllez, E. Hollauer, M. A. Mondragon and V. M. Castaño, Fourier Transform Infrared and Raman Spectra, Vibrational Assignment and Ab Initio Calculations of Terephthalic Acid and Related Compounds, Spectrochim. Acta, Part A, 2001, 57, 993–1007 CrossRef PubMed
.
- E. M. Abdalla and M. T. Abd-Allah, Synthesis, Characterization, Antimicrobial/Antitumor Activity of Binary and Ternary Neodymium (III) Complex with 2,2’-((1E,1’E)-(ethane-1,2-diylbis(azaneylylidene)) bis(methaneylylidene)) diphenol and Imidazole, Egypt. J. Chem., 2022, 65, 735–744, DOI:10.21608/ejchem.2022.179421.7282
.
- S. A. Aly, A. Eldourghamy, B. A. El-Fiky, A. A. Megahed, W. A. El-Sayed, E. M. Abdalla and H. H. Elganzory, Synthesis, spectroscopic characterization, thermal studies, and molecular docking of novel Cr (III), Fe (III), and Co (II) complexes based on Schiff base: In vitro antibacterial and antitumor activities, J. Appl. Pharm. Sci., 2023, 13, 196–210 CAS
.
- E. M. Abdalla, A. I. Al-Sulami, S. A. Aly, M. T. Abd-Allah, G. M. Nasr, S. A. H. Albohy and S. Hosny, Synthesis, characterization, DNA binding, DFT, anticancer, antibacterial, and the effect of gamma irradiation of novel Co(II), Ag (I), and Cd (II) complexes with hydrazone derivatives, J. Saudi Chem. Soc., 2023, 27, 101770, DOI:10.1016/j.jscs.2023.101770
.
- V. Zeleňák, Z. Vargová and K. Györyová, Correlation of infrared spectra of zinc (II) carboxylates with their structures, Spectrochim, Spectrochim. Acta, Part A, 2007, 66, 262–272 CrossRef PubMed
.
- K. Vellingiri, J. E. Szulejko, P. Kumar, E. E. Kwon, K.-H. Kim, A. Deep, D. W. Boukhvalov and R. J. C. Brown, Metal
organic frameworks as sorption media for volatile and semi-volatile organic compounds at ambient conditions, Sci. Rep., 2016, 6, 27813 CrossRef CAS PubMed
.
- V. Tzitzios, N. Kostoglou, M. Giannouri, G. Basina, C. Tampaxis, G. Charalambopoulou, T. Steriotis, K. Polychronopoulou, C. Doumanidis and C. Mitterer, Solvothermal synthesis, nanostructural characterization and gas cryo-adsorption studies in a metal–organic framework (IRMOF-1) material, Int. J. Hydrogen Energy, 2017, 42, 23899–23907 CrossRef CAS
.
- J. Lincke, D. Lässig, K. Stein, J. Moellmer, A. Viswanath Kuttatheyil, C. Reichenbach, A. Moeller, R. Staudt, G. Kalies, M. Bertmer and H. Krautscheid, A novel Zn4O-based triazolyl benzoate MOF: synthesis, crystal structure, adsorption properties and solid state 13C NMR investigations, Dalton Trans., 2012, 41, 817–824, 10.1039/C1DT11431J
.
- K. Yazaki, M. Takahashi, N. Miyajima and M. Obata, Construction of a polyMOF using a polymer ligand bearing the benzenedicarboxylic acid moiety in the side chain, New J. Chem., 2020, 44, 5182–5185, 10.1039/C9NJ06394C
.
- G.-D. Wang, Y.-Z. Li, W.-J. Shi, B. Zhang, L. Hou and Y.-Y. Wang, A robust cluster-based Eu-MOF as multi-functional fluorescence sensor for detection of antibiotics and pesticides in water, Sens. Actuators, B, 2021, 331, 129377, DOI:10.1016/j.snb.2020.129377
.
- A. Galal, N. F. Atta and M. A. Hefnawy, Lanthanum nickel oxide nano-perovskite decorated carbon nanotubes/poly (aniline) composite for effective electrochemical oxidation of urea, J. Electroanal. Chem., 2020, 862, 114009 CrossRef CAS
.
- F. Shihana, D. Dissanayake, P. Dargan and A. Dawson, A modified low-cost colorimetric method for paracetamol (acetaminophen) measurement in plasma, Clin. Toxicol., 2010, 48, 42–46 CrossRef CAS PubMed
.
- M. Baccarin, F. A. Santos, F. C. Vicentini, V. Zucolotto, B. C. Janegitz and O. Fatibello-Filho, Electrochemical sensor based on reduced graphene oxide/carbon black/chitosan composite for the simultaneous determination of dopamine and paracetamol concentrations in urine samples, J. Electroanal. Chem., 2017, 799, 436–443, DOI:10.1016/j.jelechem.2017.06.052
.
- G. V. Prasad, V. Vinothkumar, S. J. Jang and T. H. Kim, Multi-walled carbon nanotube/graphene oxide/poly (threonine) composite electrode for boosting electrochemical detection of paracetamol in biological samples, Microchem. J., 2023, 184, 108205 CrossRef
.
- M. Houshmand, A. Jabbari, H. Heli, M. Hajjizadeh and A. A. Moosavi-Movahedi, Electrocatalytic oxidation of aspirin and acetaminophen on a cobalt hydroxide nanoparticles modified glassy carbon electrode, J. Solid State Electrochem., 2008, 12, 1117–1128, DOI:10.1007/s10008-007-0454-6
.
- A. R. Rajamani and S. C. Peter, Novel Nanostructured Pt/CeO2@Cu2O Carbon-Based Electrode To Magnify the Electrochemical Detection of the Neurotransmitter Dopamine and Analgesic Paracetamol, ACS Appl. Nano Mater., 2018, 1, 5148–5157, DOI:10.1021/acsanm.8b01217
.
- R. K. Packer and W. A. Dunson, Effects of low environmental pH on blood pH and sodium balance of brook trout, J. Exp. Zool., 1970, 174, 65–71 CrossRef
.
- V. Bernal, A. Erto, L. Giraldo and J. C. Moreno-Piraján, Effect of solution pH on the adsorption of paracetamol on chemically modified activated carbons, Molecules, 2017, 22, 1032 CrossRef PubMed
.
- J. Wang, S. Liu, J. Luo, S. Hou, H. Song, Y. Niu and C. Zhang, Conductive metal-organic frameworks for amperometric sensing of paracetamol, Front. Chem., 2020, 8, 594093 CrossRef CAS PubMed
.
- P. Niedziałkowski, Z. Cebula, N. Malinowska, W. Białobrzeska, M. Sobaszek, M. Ficek, R. Bogdanowicz, J. S. Anand and T. Ossowski, Comparison of the paracetamol electrochemical determination using boron-doped diamond electrode and boron-doped carbon nanowalls, Biosens. Bioelectron., 2019, 126, 308–314 CrossRef PubMed
.
- N. Karikalan, R. Karthik, S.-M. Chen, M. Velmurugan and C. Karuppiah, Electrochemical properties of the acetaminophen on the screen printed carbon electrode towards the high performance practical sensor applications, J. Colloid Interface Sci., 2016, 483, 109–117 CrossRef CAS PubMed
.
- N. Tavakkoli, N. Soltani, F. Shahdost-Fard, M. Ramezani, H. Salavati and M. R. Jalali, Simultaneous voltammetric sensing of acetaminophen, epinephrine and melatonin using a carbon paste electrode modified with zinc ferrite nanoparticles, Microchim. Acta, 2018, 185, 1–11 CrossRef CAS PubMed
.
- D. Nematollahi, H. Shayani-Jam, M. Alimoradi and S. Niroomand, Electrochemical oxidation of acetaminophen in aqueous solutions: Kinetic evaluation of hydrolysis, hydroxylation and dimerization processes, Electrochim. Acta, 2009, 54, 7407–7415 CrossRef CAS
.
- B. Delley, From molecules to solids with the DMol3 approach, J. Chem. Phys., 2000, 113, 7756–7764, DOI:10.1063/1.1316015
.
- X. Huang and S. E. Mason, DFT-GGA errors in NO chemisorption energies on (111) transition metal surfaces, Surf. Sci., 2014, 621, 23–30 CrossRef CAS
.
- Y.-W. Huang and S.-L. Lee, Hybrid DFT and hyper-GGA DFT studies of the CO adsorption on Pt nanoclusters: Effects of the cluster size and better CO LUMO description, Chem. Phys. Lett., 2010, 492, 98–102 CrossRef CAS
.
- Y. Inada and H. Orita, Efficiency of numerical basis sets for predicting the binding energies of hydrogen bonded complexes: evidence of small basis set superposition error compared to Gaussian basis sets, J. Comput. Chem., 2008, 29, 225–232 CrossRef CAS PubMed
.
- M. A. Hefnawy, S. A. Fadlallah, R. M. El-Sherif and S. S. Medany, Synergistic effect of Cu-doped NiO for enhancing urea electrooxidation: Comparative electrochemical and DFT studies, J. Alloys Compd., 2022, 896, 162857, DOI:10.1016/j.jallcom.2021.162857
.
Footnote |
| † Electronic supplementary information (ESI) available. See DOI: https://doi.org/10.1039/d4ma00061g |
| This journal is © The Royal Society of Chemistry 2024 |

