 Open Access Article
Citric acid-assisted synthesis of FeFe(CN)6 with reduced defects and high specific surface area for aqueous zinc–sodium hybrid batteries†
Chaoqiao
Yang
a,
Ya
Zhao
a,
Jiaxin
Fan
 *b,
Lin
Li
b,
Jinxia
Zhou
 a,
Keliang
Wang
b,
Fenglian
Lu
b and
Hongmei
Sun
b
aCollege of Environmental and Chemical Engineering, Dalian University, Dalian, 116622, Liaoning, China
bSchool of Chemistry and Materials Engineering, Liupanshui Normal University, Liupanshui, 553004, Guizhou, China. E-mail: fmf_fjx@163.com
First published on 18th June 2024
Abstract
Due to their open structure, numerous reactive sites, and eco-friendly characteristics, Prussian blue-based electrode materials find widespread application in aqueous zinc-ion batteries. However, the Prussian blue materials face challenges such as low specific surface area and high defect rate, resulting in slow ion transport and poor cycling performance. This study focuses on synthesizing ferric ferricyanide (FeFe(CN)6) material with reduced vacancies and a higher specific surface area. The synthesis process incorporates citric acid as a chemical assistant, resulting in the as-synthesized C-FeFe(CN)6 featuring a significantly larger specific surface area of 406.625 m2 g−1, compared to FeFe(CN)6 without citric acid (28.143 m2 g−1). Moreover, C-FeFe(CN)6 has a lower vacancy rate of 20% compared to FeFe(CN)6 at 31%. The addition of citric acid effectively slows down the nucleation rate of C-FeFe(CN)6 crystals. When utilized as cathode materials in aqueous zinc–sodium hybrid batteries, C-FeFe(CN)6 demonstrates highly reversible Na+ storage behavior, exhibiting a remarkable reversible capacity of 162.5 mA h g−1 at 0.1C and a good cycling performance with 88% capacity retention over 500 cycles (at a high rate of 45C). These superior performance characteristics make C-FeFe(CN)6 a promising candidate for extensive energy storage applications.
1. Introduction
In recent years, the extensive utilization of fossil fuels has resulted in exceptionally severe issues related to environmental contamination and energy scarcity. To address these problems, it becomes crucial to establish clean and sustainable renewable energy sources.1–3 Additionally, the development of electrochemical energy storage devices is of utmost importance to efficiently store this renewable energy. With the rapid advancement of portable mobile electronic devices and electric vehicles, the demand for energy storage devices has become even more significant. Among these devices, the Li-ion battery (LIB) holds a prominent position due to its exceptional energy density, excellent performance over multiple charging cycles, and high voltage platform.4–6 However, researchers are exploring alternatives to lithium due to its limited resources, high cost, and potential safety concerns.7 In this regard, aqueous zinc-ion batteries (ZIBs) have gained significant interest for their non-toxic, non-flammable, and cost-effective characteristics.8–10The cathode materials play a crucial role in zinc-ion batteries.11 These materials primarily include manganese-based oxides,12 vanadium-based oxides,13–15 Prussian blue analogues,16 organic compounds17 and other cathode materials.18,19 Prussian blue (PB) has a general chemical formula of AxFe[Fe(CN)6]1−ynH2O, where A represents various possible interstitial cations introduced during synthesis or through electrochemical insertion.20 The cyanide ion's strong ligand field results in the low spin state of the C-coordinated Fe cation in the Fe(CN)6 group, while the N-coordinated Fe ion adopts a high spin state.21 Therefore, high-spin iron and low-spin iron have different redox potentials, which may also depend on water content and ion embedding position.22–24
So far, a considerable amount of work has been done on minimizing the [Fe(CN)]6 defects. Researchers have found that slow-release chelating agents such as citric acid can significantly delay the crystallization of PBA, thus inhibiting the formation of defects.25–28 In this regard, Yang25et al. proposed a simple citrate-assisted kinetic control crystallization method, successfully synthesizing Na1.85Co[Fe(CN)6]0.99·2.5H2O with low defects and high crystallinity. Through this method, the vacancy defect formation rate was reduced from 12% to 1%, while significantly increasing the redox sites of Na+, resulting in a high reversible capacity of 130 mA h g−1 and 90% capacity retention after 800 cycles. Furthermore, Liu27et al. synthesized NaxFeFe(CN)6 with different sodium contents by adding varying masses of sodium citrate. Among them, Na1.70FeFe(CN)6 exhibited a capacity of up to 120.7 mA h g−1 at a current density of 200 mA g−1, and even at a current density of 1200 mA g−1, the capacity remained at 73.6 mA h g−1. In addition, Chen28et al. successfully synthesized s-PBMN samples with high crystallinity and regular morphology by controlling the nucleation rate with sodium citrate. Using this method, the vacancy defect content was reduced from 11% to 2%, and the material exhibited a high specific capacity of 120 mA h g−1. Even after 400 cycles at a current density of 100 mA g−1, the capacity remained at 110 mA h g−1. However, so far, the effectiveness of the aforementioned strategies for eliminating PBA vacancy defects is still relatively low, posing a major challenge. Overall, the above-mentioned studies mainly explore the application of sodium citrate in slowing down the coordination rates of [Fe(CN)6]4− and M2+ (M represents transition metal ion). Hence, in this study, we utilized a dropwise mixed reaction solution and simultaneously introduced citric acid to jointly regulate the reaction rate, aiming to investigate the impact of citric acid on the coordination of [Fe(CN)6]3− and Fe3+. The ferric ferricyanide synthesized via the coprecipitation method presents certain issues such as high vacancy defect, small specific surface area, and large grain size. Therefore, this paper introduces citric acid as a chelating agent to decelerate the nucleation rate of the sample, leading to the production of ferric ferricyanide with fewer defects and a higher specific surface area, consequently enhancing the electrochemical performance of the battery. Additionally, the exploration of the selectivity of Na+ and Zn2+ ions embedding in the cathode C-FeFe(CN)6 structure is rarely documented for Zn–Na hybrid systems.
The combination of aqueous electrolytes with Na+ and Zn2+ ions renders the fabrication of rechargeable battery without using the toxic organic electrolyte and highly activated metals (e.g., Li, Na) in ambient air.29 Zinc–sodium hybrid battery can help solve the problems of low energy density and poor cycle performance of PBAs.30 Through introducing an extra charge carrier into the aqueous zinc salt electrolyte, like alkali cation Li+/Na+/K+, the overall energy storage performance can be improved on basis of the appropriate cathode materials and co-insertion of the alkali cation and zinc ion.31 Zinc salt is a strong acid and weak base salt with low ionization degree. Adding sodium salt can improve the conductivity of electrolyte.
In previous studies, we have investigated the electrochemical performance of FeFe(CN)6 synthesized without the addition of citric acid.32 The focus of this article will be on studying the effect of citric acid on the formation of C-FeFe(CN)6 crystals and exploring its storage performance for Zn2+ and Na+ in a Zn–Na hybrid battery. We prepared C-FeFe(CN)6 using a controlled crystallization method and characterized it using XRD, BET, TEM, and other characterization tests. The electrochemical performance of the material was tested using cyclic voltammetry (CV) and galvanostatic charge–discharge (GCD) methods. The findings suggest that the inclusion of citric acid enhanced the specific surface area of ferric ferricyanide materials, mitigated the vacancy defects of Fe(CN)6, improved the overall crystal structure, consequently showcasing outstanding electrochemical performance.
2. Results and discussion
2.1 The structure of C-FeFe(CN)6
The diagram illustrating the formation mechanism of iron ferrocyanide in the presence of citric acid is presented in Fig. 1. Initially, Fe3+ forms complexes with citrate3−, resulting in the creation of a Fe-citrate chelation solution. By adding K3Fe(CN)6 and Fe-citrate drop by drop to deionized water, they co-precipitate. Subsequently, as additional reagents are introduced, the Fe-citrate gradually separates. Fe3+ and Fe(CN)63− start to combine, leading to the slow generation of precipitates while citrate3− dissociates. This is followed by the initiation of nucleation, during which some C-FeFe(CN)6 transitions into crystals with a face-centered cubic structure. Finally, the crystals continue to grow, ultimately culminating in the complete formation of C-FeFe(CN)6 crystals.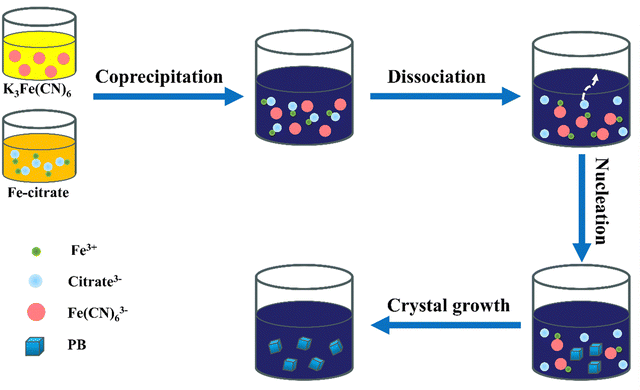 | ||
| Fig. 1 Schematic representation of the formation mechanism of C-FeFe(CN)6 in a controlled crystallization reaction. | ||
Fig. 2a illustrates the XRD patterns of FeFe(CN)6 and C-FeFe(CN)6, both displaying a distinct correlation with the face-centered cubic structure of PBAs, indicating high crystallinity (JCPDS no. 73-0687). In Fig. 2b, the infrared spectra of the two samples are presented. The peaks observed at 3441 (3427) cm−1 and 1613 (1626) cm−1 can be ascribed to the stretching and bending of O–H bonds, respectively. Additionally, a prominent peak at 2086 (2089) cm−1 corresponds to the stretching vibration of the C![[triple bond, length as m-dash]](https://www.rsc.org/images/entities/char_e002.gif) N ligand (Fe3+–CN–Fe3+). Furthermore, the peak at 502 cm−1 corresponds to the in-plane deformation of Fe–C bonds. The thermogravimetric (TG) results in Fig. 2c indicate that the weight loss of C-FeFe(CN)6 in the temperature range of 0–250 °C is 14.89%, equivalent to 2.19 water molecules per C-FeFe(CN)6. Moreover, in comparison to FeFe(CN)6, the water content of the C-FeFe(CN)6 material is reduced, indicating that the addition of citric acid slows down the crystallization rate and inhibits the formation of crystalline water. This results in stronger thermal stability and a more stable crystal structure. Fig. 2d displays the Raman spectra of the two materials, with a single peak at 2147 (2152) cm−1 attributed to the stretching vibration of Fe3+–CN–Fe3+.
N ligand (Fe3+–CN–Fe3+). Furthermore, the peak at 502 cm−1 corresponds to the in-plane deformation of Fe–C bonds. The thermogravimetric (TG) results in Fig. 2c indicate that the weight loss of C-FeFe(CN)6 in the temperature range of 0–250 °C is 14.89%, equivalent to 2.19 water molecules per C-FeFe(CN)6. Moreover, in comparison to FeFe(CN)6, the water content of the C-FeFe(CN)6 material is reduced, indicating that the addition of citric acid slows down the crystallization rate and inhibits the formation of crystalline water. This results in stronger thermal stability and a more stable crystal structure. Fig. 2d displays the Raman spectra of the two materials, with a single peak at 2147 (2152) cm−1 attributed to the stretching vibration of Fe3+–CN–Fe3+.
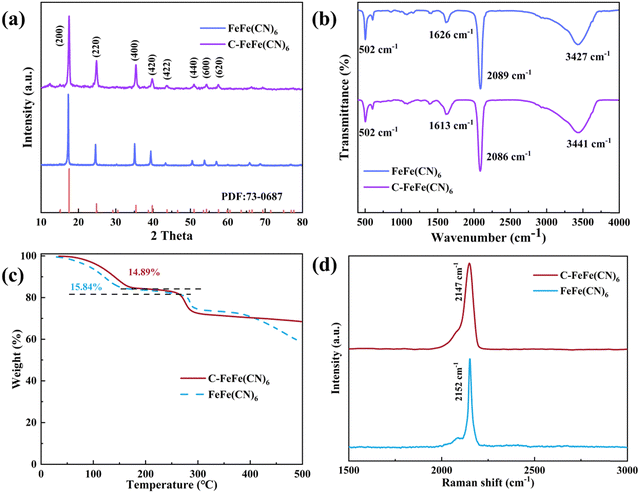 | ||
| Fig. 2 Physical properties of C-FeFe(CN)6 and FeFe(CN)6 samples. (a) XRD patterns; (b) FT-IR spectra; (c) TG curves; (d) Raman spectra. | ||
Fig. 3a displays the XPS full spectra of two samples, revealing the presence of C, N, O and Fe elements in both materials. Moreover, the detailed Fe 2p spectrum (Fig. 3b) shows two distinctive peak groups for Fe 2p3/2 at 708.58 eV and Fe 2p1/2 at 721.48 eV. The Fe 2p3/2 peak can be deconvoluted into two distinct peaks corresponding to C–Fe3+ and N–Fe3+, while the Fe 2p1/2 peak can be deconvoluted into three separate peaks corresponding to C–Fe3+, N–Fe3+, and a satellite signal peak.33 Additionally, Fig. 3c depicts the N2 adsorption–desorption isotherms of C-FeFe(CN)6 and FeFe(CN)6, with the adsorption capacity of C-FeFe(CN)6 notably surpassing that of FeFe(CN)6. The specific surface area of FeFe(CN)6 is measured at 28.143 m2 g−1, whereas that of C-FeFe(CN)6 reaches as high as 406.625 m2 g−1. C-FeFe(CN)6 predominantly demonstrates mesoporous characteristics with pore sizes ranging from 2 to 10 nm (Fig. 3d), and its average pore diameter is 2.472 nm, approximately half that of FeFe(CN)6 (5.056 nm) (Table S1, ESI†). The increased specific surface area of FeFe(CN)6, along with reduced pore size attributed to the addition of citric acid, significantly boosts its electrochemical performance.
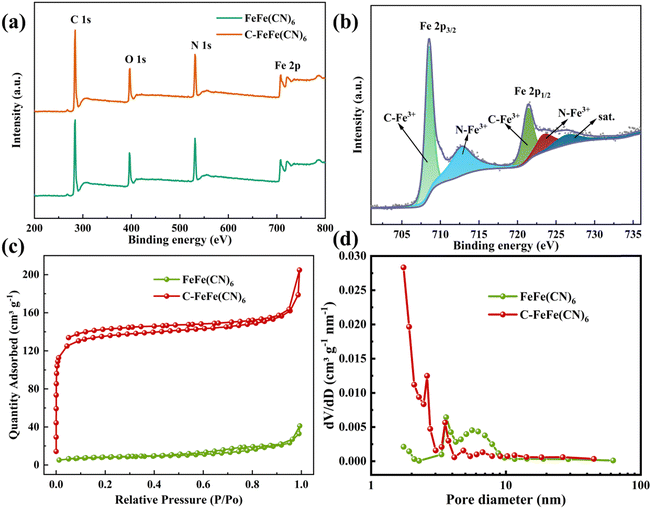 | ||
| Fig. 3 (a) The full XPS spectra; (b) high resolution Fe 2p spectrum of C-FeFe(CN)6; (c) nitrogen adsorption–desorption isotherms; (d) pore sizes distribution. | ||
Based on the results obtained from ICP-OES, elemental analysis, and TG (Table S2, ESI†), the precise chemical compositions of FeFe(CN)6 and C-FeFe(CN)6 can be expressed as Fe[Fe(CN)6]0.69·□0.31·2.80H2O and K0.18Fe[Fe(CN)6]0.80·□0.20·2.19H2O, respectively, in which □ denotes Fe(CN)6 vacancy (defect). It is evident that C-FeFe(CN)6 has a lower defect of 20% than 31% of FeFe(CN)6, which might be helpful to improve the electrochemical performances.34 The decrease of Fe(CN)6 vacancy could lead to the decrease of bound water in material lattice. The scanning electron microscope (SEM) image depicted in Fig. 4 reveals that the C-FeFe(CN)6 crystals are uniformly dispersed and arranged in a regular pattern. It is apparent that the FeFe(CN)6 crystal grains are relatively large, exhibiting a rough surface, and forming large agglomerated clusters. The particle size distribution of FeFe(CN)6 ranges from 300 to 800 nm, with an average particle size of 535 nm. On the other hand, the particle size distribution of C-FeFe(CN)6 ranges from 120 to 220 nm, with an average particle size of 168 nm. Notably, the presence of citric acid is shown to play a pivotal role in the formation of nanocrystals. Its strong chelating ability enables complexation with Fe3+ ions, thereby retarding the precipitation rate of Fe3+ with Fe(CN)63−, subsequently slowing down crystal nucleation and growth. This mechanism leads to the development of smaller particle-sized C-FeFe(CN)6 crystals.
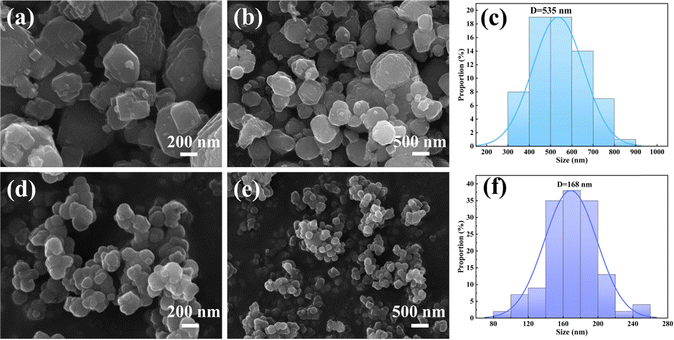 | ||
| Fig. 4 SEM images and crystallite size and distribution of FeFe(CN)6 (a)–(c) and C-FeFe(CN)6 (d)–(f) at different magnification. | ||
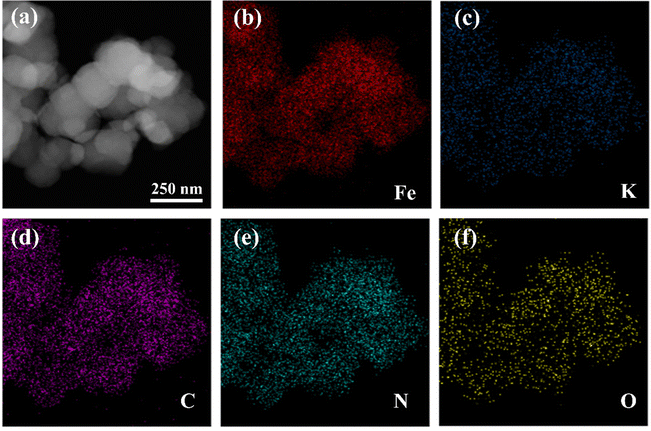
To further examine the morphology, structural characteristics, and surface elemental composition of the C-FeFe(CN)6 material, TEM and EDS techniques were employed for sample characterization. As illustrated in Fig. 5, energy dispersive X-ray spectroscopy (EDS) mapping confirmed the homogeneous distribution of K, Fe, C, N, and O elements in C-FeFe(CN)6. The EDS diagram of FeFe(CN)6 confirms the uniform distribution of Fe, C, N, and O elements in the sample (Fig. S5, ESI†). The findings suggest that reducing the nucleation rate contributed to more thorough growth of the C-FeFe(CN)6 crystal, leading to a smoother surface and reduced resistance to ion insertion. This indicates that C-FeFe(CN)6 demonstrates excellent performance over extended cycling periods.
2.2 The electrochemical performances
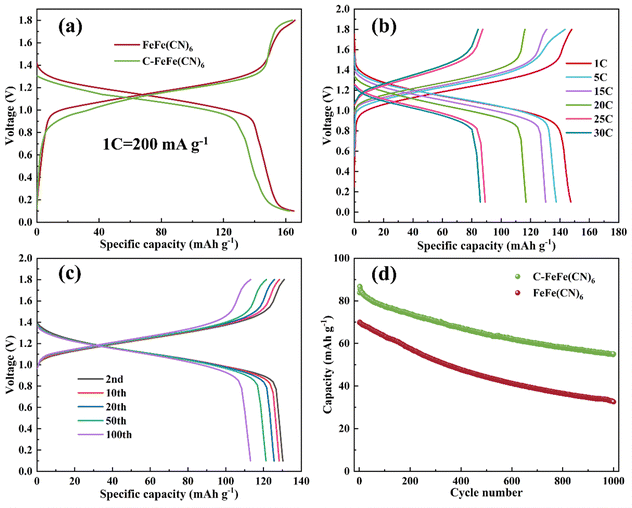
The FeFe(CN)6 and C-FeFe(CN)6 were used as cathode materials for sodium storage in zinc–sodium hybrid battery systems, in which 0.1 M ZnSO4 + 1 M Na2SO4 mixed solution was used as the electrolyte, and zinc was employed as the anode. In the previous work, we have compared the electrochemical performance of C-FeFe(CN)6 in aqueous zinc-ion and sodium-ion batteries, and compared with aqueous zinc–sodium mixed batteries, their capacity and cycle performance are limited.32 In the GCD process, the cells were discharged to 0.1 V initially, then charged to 1.8 V, followed by cycling. Fig. 6a illustrates the discharge–charge curves of C-FeFe(CN)6 and FeFe(CN)6 electrodes at a current density of 0.1C, ranging from 0.1 to 1.8 V. The potential plateau appears at 1.1–1.2 V, which corresponds to the redox reaction of Fe2+/Fe3+ pairs. The second platform may be attributed to the pseudo-capacitance effect, which occurs under low current conditions. The initial discharge and charge capacities of C-FeFe(CN)6 are 162.5 and 164.2 mA h g−1, respectively, and the coulomb efficiency is high up to 99%. Based on the chemical formula, K0.18Fe[Fe(CN)6]0.80·□0.20·2.19H2O has a theoretical capacity of 197.1 mA h g−1. The specific discharge capacity of 162.5 mA h g−1 reaches approximately 82.4% of the theoretical capacity, corresponding to a maximal stoichiometry of 1.65 Na+ insertion in one C-FeFe(CN)6 unit to form C–Na1.65FeFe(CN)6. The initial discharge specific capacity of FeFe(CN)6 is 165.2 mA h g−1. According to the chemical formula, the theoretical capacity of Fe[Fe(CN)6]0.69·□0.31·2.80H2O is 212.2 mA h g−1. The discharge specific capacity of 165.2 mA h g−1 corresponds to approximately 77.8% of the theoretical capacity, which corresponds to the insertion of 1.56 Na+ into one FeFe(CN)6 unit to form Na1.56FeFe(CN)6. Therefore, more Na+ ions (1.65 Na+) enter the C-FeFe(CN)6 lattice. This notable capacity utilization and coulomb efficiency can likely be attributed to the superior crystal structure of the material, which provides sufficient interstitial sites for reversible Na+ insertion. Although there isn't a significant difference between the small current charge and discharge, the addition of citric acid enhances the fast charge performance of C-FeFe(CN)6, due to the improved structure of C-FeFe(CN)6 and the reduction of grain size. The charge/discharge curves of Zn//C-FeFe(CN)6 at various rates are depicted in Fig. 6b. At current densities of 1, 5, 15, 20, 25, and 30C, the reversible discharge/charge specific capacities are 147.4/148, 137.5/143.4, 130.3/131, 116.9/116.2, 89.1/87.4 and 85.8/84.3 mA h g−1, respectively. Fig. S1a (ESI†) shows the discharge–charge curves of FeFe(CN)6 electrode at different current densities. The discharge capacities are 154.9, 139.1, 135.1, 126.7 and 70 mA h g−1 at different current densities of 0.5C, 1C, 2C, 15C and 25C, respectively. It can be seen from this that with the increase in current density, the electrochemical polarization of the FeFe(CN)6 electrode becomes more pronounced, leading to a significant decrease in specific capacity. The high-rate capability of the C-FeFe(CN)6 material can be attributed to its smaller grain size and higher specific surface area, which shorten the diffusion path of Na+ ions in the crystal structure. Moreover, it exhibits fewer defects and a more stable structure, enabling rapid insertion/extraction reactions of Na+ ions.The GCD curves of the C-FeFe(CN)6 electrode in different cycles (2nd, 10th, 20th, 50th, and 100th) at a current density of 15C are presented in Fig. 6c. It can be observed that the battery maintains similar charge–discharge curves from the second cycle to the 100th cycle, indicating excellent cycle performance. Fig. S1b (ESI†) demonstrates the charge–discharge curves of FeFe(CN)6 electrode at the 2nd, 10th, 20th, 50th and 100th cycles at 15C. The FeFe(CN)6 platform shows a slight decrease, while the C-FeFe(CN)6 platform maintains good discharge performance. Furthermore, as depicted in Fig. 6d, long-term cycling performance is assessed at a high current density of 45C over 1000 cycles. The reversible discharge specific capacity decreased from 83.8 to 55.1 mA h g−1, which corresponds to a capacity retention rate of about 65.8%. The factors leading to the capacity attenuation may include the following aspects: incomplete removal of embedded ions during the cycle, the decay of C-FeFe(CN)6 structure, etc. However, for FeFe(CN)6 sample synthesized without citric acid, the capacity significantly decreases after 1000 cycles, retaining only 46.7% of its initial capacity. This is because when Na+ ions are transported in the cathode materials with relatively large grain size, the longer diffusion length and lower material utilization efficiency of Na+ ions lead to sluggish kinetics, which is not conducive to ion transport. This results in poor electrochemical performance of the battery.35–37 The addition of citric acid in the synthesis process slows down the crystal nucleation rate, reduces the crystalline water content, and decreases crystal defects. As a result, it allows for obtaining C-FeFe(CN)6 materials with smaller grain size and higher specific surface area. The results demonstrate that, compared to the original materials, it enhances cycling stability and enables a highly reversible Na+ storage reaction.
Self-discharge rate is an important property for batteries in practical application. To study the self-discharge of Zn//C-FeFe(CN)6, the battery was fully charged at 1C current density and then stood for 24 h before discharging. Fig. S2a and b (ESI†) show the voltage-time and voltage-specific capacity curves of the battery without rest, in which the discharge specific capacity is 117.6 mA h g−1 (Fig. S2b, ESI†). After standing for 24 h, the voltage decays to 1.31 V (Fig. S2c and d, ESI†). It is worth noting that the battery still maintains a high capacity of 103.6 mA h g−1. Therefore, the self-discharge rate of C-FeFe(CN)6 is 0.50% h−1, which is much lower than that of FeFe(CN)6 under the same conditions (Fig. S3, ESI,† self-discharge rate: 1.32% h−1). Due to the mesoporous structure of C-FeFe(CN)6, it is more suitable for storing Na+ ions and can better maintain the stability of the Na+ embedding structure. Zn//C-FeFe(CN)6 battery has a low self-discharge rate, indicating that it has excellent electrochemical performance.
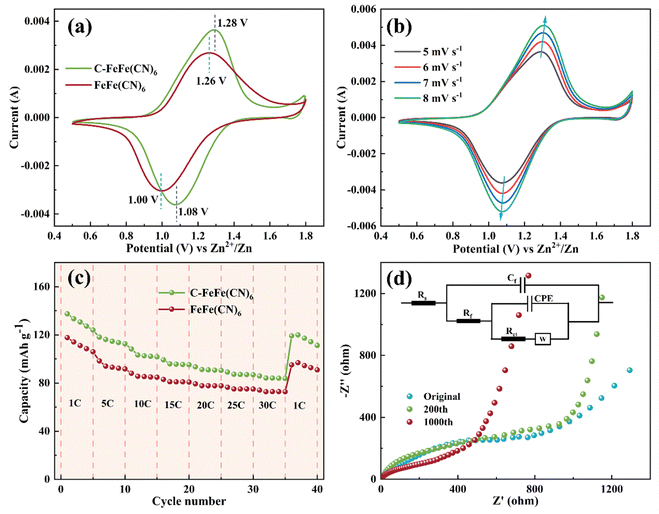
According to Fig. 7a, both the CV curves of FeFe(CN)6 and C-FeFe(CN)6 show a sharp symmetric Fe2+/Fe3+ redox peak. The peak of FeFe(CN)6 is located at 1.00/1.26 V, while the peak of C-FeFe(CN)6 is located at 1.08/1.28 V. Fig. 7b displays cyclic voltammetry curves of Zn//C-FeFe(CN)6 battery at different scanning speeds. With the increase of scanning rate from 5 to 8 mV s−1, the peak current intensity increases significantly, while the peak potential shifts slightly. In addition, Fig. 7c illustrates the rate capacity of C-FeFe(CN)6 and FeFe(CN)6 electrodes. The specific discharge capacities of C-FeFe(CN)6 electrode at 1, 5, 10, 15, 20, 25 and 30C are 130.6, 115.0, 103.6, 96.3, 91.3, 87.5, 84.4, and 116.4 mA h g−1 (average values), respectively. The specific discharge capacities of FeFe(CN)6 electrode at 1, 5, 10, 15, 20, 25, 30 and 1C are 111.5, 93.9, 85.8, 81.4, 78.1, 75.4, 73.1 and 94.0 mA h g−1, respectively. Under the same charging rate, the specific capacity of the C-FeFe(CN)6 electrode is significantly greater than that of the FeFe(CN)6 electrode. Notably, when the rate is reduced from 30 to 1C, the capacity of C-FeFe(CN)6 electrode recovers to 116.4 mA h g−1, which is 89.15% of the initial value, demonstrating good rate performance. Fig. 7d exhibits the EIS curves of Zn//C-FeFe(CN)6 in the initial, 200th and 1000th cycles, and the arc in the mid-frequency region represents the charge transfer resistance (Rct). The EIS data are fitted by the Zsimpwin software, and the values are presented in Table S4 (ESI†). The initial Rct value is 804.5 Ω. With the cycling, Rct drops to 548.7 and 244.0 Ω after the 200th and 1000th cycles, respectively. Based on the cycling process, it is evident that the Rct value gradually decreases, indicating that the insertion of Na+ ions significantly stabilizes the material structure, thereby mitigating the collapse and damage of the crystal structure during cycling. Conversely, Fig. S4 (ESI†) exhibits the EIS curves of Zn//FeFe(CN)6 at different cycles. The initial Rct value is 500.7 Ω (Table S5, ESI†). As the cycle progresses, the Rct value decreases to 356.7 Ω after the 200th cycle and then increases to 1112 Ω after the 1000th cycle. The results indicate that the introduction of Na+ ions disrupt the crystal structure, resulting in unsatisfactory cycling performance. In Fig. 9d, the XRD spectrum and SEM images of both uncycled and cycled 1000th C-FeFe(CN)6 electrode slices are presented. Following 1000 cycles, the XRD spectrum of the C-FeFe(CN)6 cathode retains its face-centered cubic phase, while the SEM image displays a well-defined nano-cubic morphology, providing further evidence of the remarkable stability exhibited in the repetitive Na+ insertion/extraction reaction within the C-FeFe(CN)6 framework. Fig. S6 (ESI†) displays the XRD and SEM patterns of FeFe(CN)6 electrodes before and after 1000 cycles. Following 1000 cycles, the XRD pattern of the FeFe(CN)6 cathode continues to exhibit the face-centered cubic phase, while the SEM image reveals partial structural damage, suggesting varying degrees of crystal structure impairment due to ion embedding and extraction.
2.3 Mechanism
To investigate the insertion and extraction mechanism of Na+ ions in the crystal structure, ex-situ XRD and XPS tests were conducted on the C-FeFe(CN)6 cathode. The ex situ XRD patterns and XPS spectra of the C-FeFe(CN)6 cathode in various charge–discharge states are illustrated in Fig. 8. Fig. 8a presents the XRD curves of the C-FeFe(CN)6 cathode in the initial state, discharged to 0.1 V, and charged to 1.8 V, demonstrating that the material maintains structural stability and retains a face-centered cubic structure throughout the charge–discharge process. The inset in Fig. 8a provides a schematic diagram of the C-FeFe(CN)6 structure. The internal ion channel size of C-FeFe(CN)6 is 5.08 Å, which reduces to 3.6 Å after excluding the radii of C–Fe and N–Fe atoms.38 Due to the smaller hydration radius of Na+ ions compared to Zn2+ ions, Na+ ions tend to preferentially insert into the crystal structure.39 The (200) crystal face, as locally magnified from Fig. 8a, demonstrates that the (200) peak shifts to a lower 2θ value when the battery is fully discharged to 0.1 V, then returns to its original position upon full charging, indicating the expansion and recovery of the lattice spacing of C-FeFe(CN)6. This confirms the reversible insertion and extraction of Na+ ions during the discharge and charge processes. In Fig. 8c and d, the complete XPS spectra and high-resolution Fe 2p spectra of C-FeFe(CN)6 in various discharge and charge states are presented, confirming the oxidation–reduction reaction of Fe elements throughout the constant current charge–discharge process. The XPS full spectrum reveals the coexistence of Na+ and Zn2+ ions on the surface of the C-FeFe(CN)6 cathode following complete discharge and charge (Fig. 8c). This suggests that both Na+ and Zn2+ ions can be incorporated into the lattice of C-FeFe(CN)6 during the discharge process. Nevertheless, a small amount of Na+ and Zn2+ ions persist in the lattice during the charge process. The high-resolution XPS spectrum of Fe 2p illustrates the variation in the valence state of Fe elements during charge and discharge processes, indicating whether the Fe element is oxidized or reduced at different potentials. In Fig. 8d, for the original C-FeFe(CN)6, the Fe 2p peak at 708.68 eV corresponds to FeIII. Following complete discharge of the electrode, the binding energy of Fe 2p decreases, suggesting the presence of FeII (707.58 eV) in C-FeFe(CN)6, which then oxidizes to FeIII (708.98 eV) after full charge.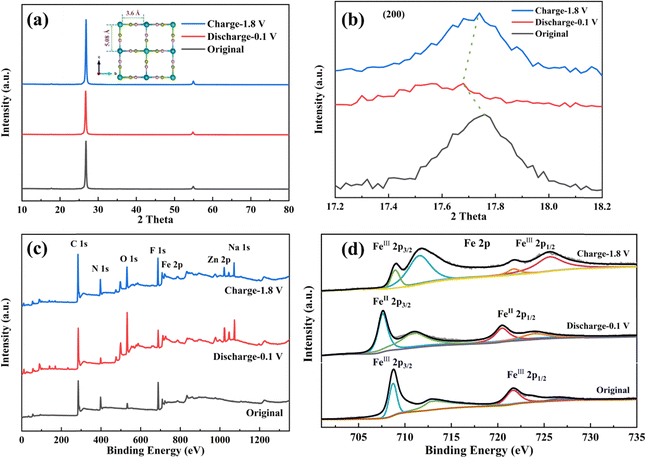 | ||
| Fig. 8 Characterization of C-FeFe(CN)6 electrode at different states. (a) XRD patterns; (b) the magnifications of (200) peak; (c) the full XPS spectra; (d) high-resolution XPS spectra of Fe 2p. | ||
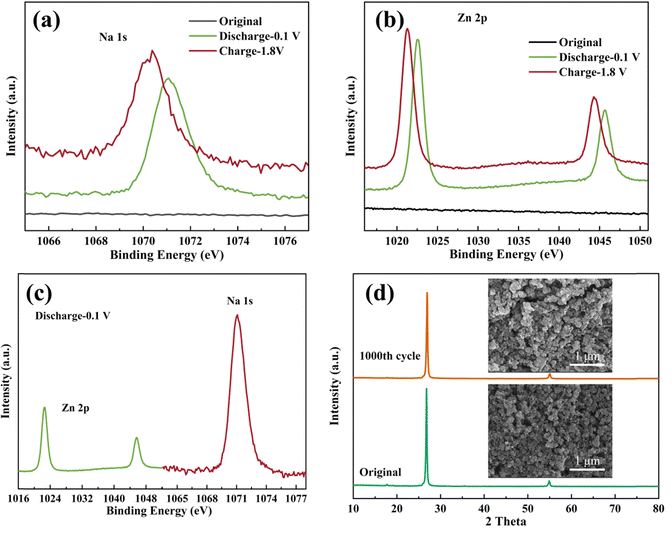
The high-resolution XPS spectra of Na 1s and Zn 2p in various charge–discharge states are illustrated in Fig. 9. The findings suggest that the level of Na+ ion insertion surpasses that of Zn2+ ions, establishing the insertion and extraction of Na+ ions as the predominant processes. We roughly calculated the capacity contribution of Na+ and Zn2+ based on their embeddings, which are 63.8% and 34.3%, respectively. Consequently, the electrochemical reaction of the Zn//C-FeFe(CN)6 battery can be succinctly outlined as:
| Cathode: C-FeFe(CN)6 + 1.65Na+ + 1.65e− ↔ C–Na1.65FeFe(CN)6 | (1) |
| Anode: 0.82Zn ↔ 0.82Zn2+ + 1.65e− | (2) |
| Total: C-FeFe(CN)6 + 1.65Na+ + 0.82Zn ↔ C–Na1.65FeFe(CN)6 + 0.82Zn2+ | (3) |
3. Conclusion
In summary, with citric acid as an additive, low-defect C-FeFe(CN)6 with small grain size and high specific surface area was successfully prepared using a controlled crystallization method. The specific surface area was 406.625 m2 g−1, and the vacancy defect was 20%. The diffusion path of Na+ ions embedded in the crystal structure of C-FeFe(CN)6 shortened, and the inserted Na+ ions stabilized the material structure, thereby slowing down the collapse and damage of the cathode structure during the cycling process. This is conducive to the reversible Na+ ion insertion/extraction reaction, significantly improving the electrochemical performance of zinc–sodium hybrid batteries. Excellent electrochemical performance was demonstrated by CV, EIS, and other electrochemical tests in the electrolyte of 0.1 M ZnSO4 + 1 M Na2SO4, showing a high specific capacity of 162.5 mA h g−1, outstanding rate capability, and cycling stability with a capacity retention of 88% after 500 cycles. Furthermore, ex situ test results indicate that Na+ ion insertion is the main process in zinc–sodium hybrid batteries, elucidating the electrochemical reaction mechanism of the battery. These findings provide valuable insights into the storage mechanism of sodium in aqueous solutions and make significant contributions to the development of high-performance zinc–sodium hybrid batteries.Conflicts of interest
The authors declare that there is no conflict of interest regarding the publication of this paper.Acknowledgements
This work is financially supported by Guizhou Provincial Key Laboratory of Coal Clean Utilization (qiankehepingtairencai [2020]2001); The Liupanshui Science and Technology Foundation (52020-2018-04-01); Science and Technology Creative Team Project of Liupanshui Normal University (LPSSYKJTD201908); Scientific Research Fund for High-level Talents of Liupanshui Normal University (LPSSYKYJJ201908); Liupanshui Normal University Scientific Research and Cultivation Projects (LPSSYLPY202225); Scientific Research Cultivation Project (LPSSY2023KJZDPY02); Materials and Chemicals Direction Team (LPSSY2023XKTD06); Carbon Neutral Engineering Research Center of Guizhou colleges and universities in Coal Industry (Qian Jiao Ji [2023] no. 044).References
- Y. Zhao, J. Peng, K. Chen, L. Luo, H. Chen, H. Zhang, S. Chou, X. Feng, W. Chen, R. Cao, X. Ai, Y. Fang and Y. Cao, Boosting the sodium storage performance of Prussian blue analogues via effective etching, Sci. China: Chem., 2023, 66, 3154–3160 CrossRef CAS.
- Y. Fang, L. Xiao, Z. Chen, X. Ai, Y. Cao and H. Yang, Recent Advances in Sodium-Ion Battery Materials, Electrochem. Energy Rev., 2018, 1, 294–323 CrossRef CAS.
- Y. Fang, X.-Y. Yu and X. W. (David), Lou, Nanostructured Electrode Materials for Advanced Sodium-Ion Batteries, Matter, 2019, 1, 90–114 CrossRef.
- J. Zou, K. Yuan, J. Zhao, B. Wang, S. Chen, J. Huang, H. Li, X. Niu and L. Wang, Delithiation-driven topotactic reaction endows superior cycling performances for high-energy-density FeS(1 ≤ x ≤ 1.14) cathodes, Energy Storage Mater., 2021, 43, 579–584 CrossRef.
- T. Zhou, L. Zhu, L. Xie, Q. Han, X. Yang, L. Chen, G. Wang and X. Cao, Cathode materials for aqueous zinc-ion batteries: A mini review, J. Colloid Interface Sci., 2022, 605, 828–850 CrossRef CAS PubMed.
- T. Zhou, L. Xie, Q. Han, X. Yang, L. Zhu and X. Cao, Investigation of Na6V10O28 as a promising rechargeable aqueous zinc-ion batteries cathode, Chem. Eng. J., 2022, 445, 136789 CrossRef CAS.
- G. Zampardi and F. La Mantia, Prussian blue analogues as aqueous Zn-ion batteries electrodes: Current challenges and future perspectives, Curr. Opin. Electrochem., 2020, 21, 84–92 CrossRef CAS.
- F. Tang, J. Gao, Q. Ruan, X. Wu, X. Wu, T. Zhang, Z. Liu, Y. Xiang, Z. He and X. Wu, Graphene-Wrapped MnO/C Composites by MOFs-Derived as Cathode Material for Aqueous Zinc ion Batteries, Electrochim. Acta, 2020, 353, 136570 CrossRef CAS.
- F. Tang, X. Wu, Y. Shen, Y. Xiang, X. Wu, L. Xiong and X. Wu, The intercalation cathode materials of heterostructure MnS/MnO with dual ions defect embedded in N-doped carbon fibers for aqueous zinc ion batteries, Energy Storage Mater., 2022, 52, 180–188 CrossRef.
- L. Chen, Z. Yang, H. Qin, X. Zeng and J. Meng, Advanced electrochemical performance of ZnMn2O4/N-doped graphene hybrid as cathode material for zinc ion battery, J. Power Sources, 2019, 425, 162–169 CrossRef CAS.
- H. Chen, S. Cai, Y. Wu, W. Wang, M. Xu and S.-J. Bao, Successive electrochemical conversion reaction to understand the performance of aqueous Zn/MnO2 batteries with Mn2+ additive, Mater. Today Energy, 2021, 20, 100646 CrossRef CAS.
- X. Guo, J. Zhou, C. Bai, X. Li, G. Fang and S. Liang, Zn/MnO2 battery chemistry with dissolution-deposition mechanism, Mater. Today Energy, 2020, 16, 100396 CrossRef.
- N. Zhang, Y. Dong, M. Jia, X. Bian, Y. Wang, M. Qiu, J. Xu, Y. Liu, L. Jiao and F. Cheng, Rechargeable Aqueous Zn–V2O5 Battery with High Energy Density and Long Cycle Life, ACS Energy Lett., 2018, 3, 1366–1372 CrossRef CAS.
- P. Hu, T. Zhu, X. Wang, X. Wei, M. Yan, J. Li, W. Luo, W. Yang, W. Zhang, L. Zhou, Z. Zhou and L. Mai, Highly Durable Na2V6O16·1.63H2O Nanowire Cathode for Aqueous Zinc-Ion Battery, Nano Lett., 2018, 18, 1758–1763 CrossRef CAS PubMed.
- B. Sambandam, V. Soundharrajan, S. Kim, M. H. Alfaruqi, J. Jo, S. Kim, V. Mathew, Y. Sun and J. Kim, K2V6O16·2.7H2O nanorod cathode: an advanced intercalation system for high energy aqueous rechargeable Zn-ion batteries, J. Mater. Chem. A, 2018, 6, 15530–15539 RSC.
- Z. Liu, G. Pulletikurthi and F. Endres, A Prussian Blue/Zinc Secondary Battery with a Bio-Ionic Liquid–Water Mixture as Electrolyte, ACS Appl. Mater. Interfaces, 2016, 8, 12158–12164 CrossRef CAS PubMed.
- D. Kundu, P. Oberholzer, C. Glaros, A. Bouzid, E. Tervoort, A. Pasquarello and M. Niederberger, Organic Cathode for Aqueous Zn-Ion Batteries: Taming a Unique Phase Evolution toward Stable Electrochemical Cycling, Chem. Mater., 2018, 30, 3874–3881 CrossRef CAS.
- X. Xie, N. Wang and W. Hu, Hierarchical Flower-Like VS2 Nanosheets Cathode for High-Performance Aqueous Zn-ion Batteries, J. Phys.: Conf. Ser., 2023, 2468, 012034 CrossRef.
- H. Li, Q. Yang, F. Mo, G. Liang, Z. Liu, Z. Tang, L. Ma, J. Liu, Z. Shi and C. Zhi, RETRACTED: MoS2 nanosheets with expanded interlayer spacing for rechargeable aqueous Zn-ion batteries, Energy Storage Mater., 2019, 19, 94–101 CrossRef.
- Y. Xu, S. Zheng, H. Tang, X. Guo, H. Xue and H. Pang, Prussian blue and its derivatives as electrode materials for electrochemical energy storage, Energy Storage Mater., 2017, 9, 11–30 CrossRef.
- A. Kumar, S. M. Yusuf and L. Keller, Structural and magnetic properties of Fe[Fe(CN)6]·4H2O, Phys. Rev. B: Condens. Matter Mater. Phys., 2005, 71, 054414 CrossRef.
- Y. Lu, L. Wang, J. Cheng and J. B. Goodenough, Prussian blue: a new framework of electrode materials for sodium batteries, Chem. Commun., 2012, 48, 6544 RSC.
- C. Yan, A. Zhao, F. Zhong, X. Feng, W. Chen, J. Qian, X. Ai, H. Yang and Y. Cao, A low-defect and Na-enriched Prussian blue lattice with ultralong cycle life for sodium-ion battery cathode, Electrochim. Acta, 2020, 332, 135533 CrossRef CAS.
- X. Guo, Z. Wang, Z. Deng, X. Li, B. Wang, X. Chen and S. P. Ong, Water Contributes to Higher Energy Density and Cycling Stability of Prussian Blue Analogue Cathodes for Aqueous Sodium-Ion Batteries, Chem. Mater., 2019, 31, 5933–5942 CrossRef CAS.
- X. Wu, M. Sun, S. Guo, J. Qian, Y. Liu, Y. Cao, X. Ai and H. Yang, Vacancy-Free Prussian Blue Nanocrystals with High Capacity and Superior Cyclability for Aqueous Sodium-Ion Batteries, ChemNanoMat, 2015, 1, 188–193 CrossRef CAS.
- X. Wu, C. Wu, C. Wei, L. Hu, J. Qian, Y. Cao, X. Ai, J. Wang and H. Yang, Highly Crystallized Na2CoFe(CN)6 with Suppressed Lattice Defects as Superior Cathode Material for Sodium-Ion Batteries, ACS Appl. Mater. Interfaces, 2016, 8, 5393–5399 CrossRef CAS PubMed.
- Y. Liu, Y. Qiao, W. Zhang, Z. Li, X. Ji, L. Miao, L. Yuan, X. Hu and Y. Huang, Sodium storage in Na-rich NaxFeFe(CN)6 nanocubes, Nano Energy, 2015, 12, 386–393 CrossRef CAS.
- R. Chen, Y. Huang, M. Xie, Z. Wang, Y. Ye, L. Li and F. Wu, Chemical Inhibition Method to Synthesize Highly Crystalline Prussian Blue Analogs for Sodium-Ion Battery Cathodes, ACS Appl. Mater. Interfaces, 2016, 8, 31669–31676 CrossRef CAS PubMed.
- F. Ma, X. Yuan, T. Xu, S. Zhou, X. Xiong, Q. Zhou, N. Yu, J. Ye, Y. Wu and T. Van Ree, A High-Quality Monoclinic Nickel Hexacyanoferrate for Aqueous Zinc–Sodium Hybrid Batteries, Energy Fuels, 2020, 34, 13104–13110 CrossRef CAS.
- X. Yuan, F. Ma, X. Chen, R. Sun, Y. Chen, L. Fu, Y. Zhu, L. Liu, F. Yu, J. Wang and Y. Wu, Aqueous zinc–sodium hybrid battery based on high crystallinity sodium–iron hexacyanoferrate, Mater. Today Energy, 2021, 20, 100660 CrossRef CAS.
- S. Liu, T. Lei, Q. Song, J. Zhu and C. Zhu, High Energy, Long Cycle, and Superior Low Temperature Performance Aqueous Na–Zn Hybrid Batteries Enabled by a Low-Cost and Protective Interphase Film-Forming Electrolyte, ACS Appl. Mater. Interfaces, 2022, 14, 11425–11434 CrossRef CAS PubMed.
- C. Yang, S. Ding, Y. Zhao, J. Zhou, L. Li and J. Fan, High specific capacity FeFe(CN)6 as the cathode material in aqueous rechargeable zinc–sodium hybrid batteries, Dalton Trans., 2023, 52, 16984–16992 RSC.
- P. Tan, Active phase, catalytic activity, and induction period of Fe/zeolite material in nonoxidative aromatization of methane, J. Catal., 2016, 338, 21–29 CrossRef CAS.
- L. Wang, Y. Lu, J. Liu, M. Xu, J. Cheng, D. Zhang and J. B. Goodenough, A Superior Low-Cost Cathode for a Na-Ion Battery, Angew. Chem., 2013, 125, 2018–2021 CrossRef.
- J. Zhang, F. Wu, X. Dai, Y. Mai and Y. Gu, Enhancing the High-Voltage Cycling Performance and Rate Capability of LiNi0.8Co0.1Mn0.1O2 Cathode Material by Codoping with Na and Br, ACS Sustainable Chem. Eng., 2021, 9, 1741–1753 CrossRef CAS.
- J. Li, H. Li, W. Stone, R. Weber, S. Hy and J. R. Dahn, Synthesis of Single Crystal LiNi0.5Mn0.3Co0.2O2 for Lithium Ion Batteries, J. Electrochem. Soc., 2017, 164, A3529–A3537 CrossRef CAS.
- J. Zhu and G. Chen, Single-crystal based studies for correlating the properties and high-voltage performance of Li[NixMnyCo1−x−y]O2 cathodes, J. Mater. Chem. A, 2019, 7, 5463–5474 RSC.
- E. R. Nightingale, Phenomenological Theory of Ion Solvation. Effective Radii of Hydrated Ions, J. Phys. Chem., 1959, 63, 1381–1387 CrossRef CAS.
- G. Ni, Z. Hao, G. Y. Zou, F. H. Cao, L. Qin and C. G. Zhou, High-Performance Aqueous Rechargeable K/Zn Hybrid Batteries Based on Berlin Green Cathode Materials, ChemElectroChem, 2022, 9, e202101351 CrossRef CAS.
Footnote |
| † Electronic supplementary information (ESI) available. See DOI: https://doi.org/10.1039/d4ma00303a |
| This journal is © The Royal Society of Chemistry 2024 |

