 Open Access Article
Toll like receptor-based electrochemical sensors via N-heterocyclic carbene-modified surfaces: towards improved sensing of DNA molecules†
Dianne S.
Lee
 a,
Mir Pouyan
Zarabadi
a,
Hridaynath
Bhattacharjee
a,
Lin
Qi
b,
Jennifer F.
McLeod
a,
Kasra
Saeedfar
a,
Ishwar
Singh
a,
April
Woods
b,
Anastasia
Messina
a,
Viola I.
Birss
a,
Mir Pouyan
Zarabadi
a,
Hridaynath
Bhattacharjee
a,
Lin
Qi
b,
Jennifer F.
McLeod
a,
Kasra
Saeedfar
a,
Ishwar
Singh
a,
April
Woods
b,
Anastasia
Messina
a,
Viola I.
Birss
 *b,
Cathleen M.
Crudden
 *a and
Zhe
She
 *a
*a
aDepartment of Chemistry, Queen's University, Kingston, Ontario K7L 3N6, Canada. E-mail: zhe.she@queensu.ca
bDepartment of Chemistry, University of Calgary, Calgary, Alberta T2N 1N4, Canada
First published on 18th April 2024
Abstract
Pathogen detection on gold surfaces using N-heterocyclic carbenes (NHCs) functionalized with amine tags along with an organic linker, bis(sulfosuccinimidyl)suberate sodium salt (BS3) to chemically bind toll-like receptor 9 (TLR9) to gold electrodes, is reported here for the first time. TLRs are essential components of the early warning system of the human innate immune response, with TLR9 being a DNA sensing receptor that specifically detects DNA viruses. To enhance sensor consistency compared to previous literature, two distinct types of NHCs were used to minimize challenges associated with non-specific adsorption. Gold electrodes functionalized with TLRs via NHCs have the potential to operate as broad-spectrum biosensors, as evidenced by their ability to identify biological pathogens based on alterations in resistance and pattern recognition.
Introduction
The global threats of pandemic and epidemic outbreaks (MERS, Ebola, Zika, SARS-1, and SARS-2 (COVID)) are on the rise, driven by increased global mobility and global warming. Controlling and containing these outbreaks is extremely challenging without diagnostic biosensors capable of reliable pathogen detection.1,2 Detection, identification, and monitoring capabilities are the key aspects of any biosensing system.While sensing transducers such as surface plasmon resonance (SPR)3,4 and quartz crystal microbalance (QCM)5 are often employed with the biological recognition elements (BRE), electrochemical methods are more convenient due to their compact size, robustness, low power consumption, and low cost.6,7 Common BREs include nucleic acids8–10 and proteins,11–13 and their use in sensors provides accurate detection of pathogens with great specificity and sensitivity. However, highly optimized and single pathogen specific sensors do not detect a breadth of analytes. This approach is not suited for applications where the pathogen is unknown.
A unique class of proteins called toll-like receptors (TLRs) are rare among BREs as they can detect various classes of biological pathogens using a pattern recognition approach, allowing for the identification of key conserved structures present in pathogen classes.14 For instance, TLR4 identifies lipopolysaccharide (LPS), TLR5 recognizes flagellin, TLR7 recognizes single-stranded RNA, and TLR9 recognizes and binds to DNA fragments belonging to a foreign DNA derived from bacteria and viruses.15,16 The utilization of a single sensor decorated with different TLR BREs will be significant for the identification of unknown pathogens.17,18
The robustness of such sensors under different environmental and chemical conditions, the sensitivity that can be achieved, and the ability to store the sensors without loss of activity are key issues for their further development.19–21 Most electrochemical BRE-on-metal sensors are typically fabricated by employing thiol-based self-assembled monolayers (SAMs) to link the BRE to the underlying electrode, typically gold, and enable the translation of pathogen recognition into a readable signal.11,17 However, commonly employed thiol SAMs are known to degrade even under ambient conditions,22 effectively limiting their use to laboratory environments.
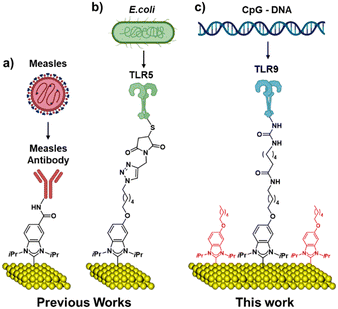
Recent discoveries have shown that N-heterocyclic carbenes (NHCs) bind to metals via strong carbon-to-metal bonds, providing a highly robust linkage to the surface.23–25 This led to the development of an antibody-based NHC-SAM sensor for the measles virus (Fig. 1a), showing exceptional response and stability.26 In 2021, we described the first example of an NHC linked TLR-based pathogen detection system (Fig. 1b) using a similar strategy of Michael addition as described by Workentin and co-workers on gold nanoparticles.27,28 Although effective, the use of an NHC with a maleimide end group for immobilization of the TLR protein moiety through Michael addition reaction required the use of thiol nucleophiles that provided a point of potential instability due to reversible reactions.27,29 Despite the current precedents, such as DNA hybridization,30–32 nanobeads,33 or a reverse method of using DNA platform to detect proteins,34 there has not yet been a reported example of electrochemical biosensors using organic ligand SAM technology along with TLRs to detect DNA molecules.
Here, we report a secure and faster strategy to build TLR-based sensors on gold surfaces (Fig. 1c), employing amide couplings to react an amine-containing NHC with TLR9 via a homo-bifunctional crosslinker, bis(sulfosuccinimidyl)suberate sodium salt (BS3).35 BS3 is known to bind irreversibly to its conjugate molecules and is incorporated into this sensor design in the hopes of securely binding the NHCs and TLRs together, resulting in a very stable sensor platform. The time required for protein immobilization has been significantly lowered from 72 h to 24 h as a result of this improved binding strategy in comparison with previous reports. His-tag modification is not needed for the new strategy, which makes this new design simpler for a wide range of applications. Although BS3 was employed in this study, any crosslinker molecule allowing amide couplings may theoretically be utilized with the sensor system described in this work to tailor the monolayer thickness without having to synthesize alternative NHC molecules.
Furthermore, we also report a new strategy for lowering the risks of non-specific adsorption while minimizing unreacted substrate exposure by using two distinct NHCs. The present study shows significant improvements over prior work,27 including its shorter synthetic route with better overall yield as well as better sensor design and replicability. The new molecule and sensor design also enables more selective detection of TLR9-based agonists.
Results and discussion
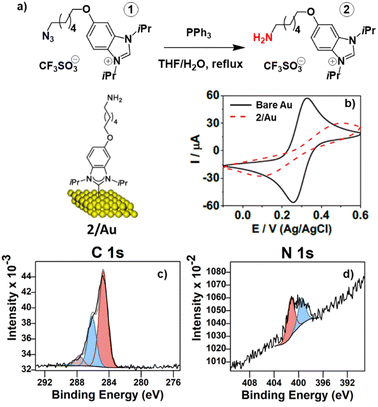
The synthesis of amine tagged NHC precursor 2 builds on the known preparation of NHC precursor 1, which has a terminal azide group. 1 was prepared according to the published procedure (Fig. 2a),27 then reduced to the desired amine (2) by a Staudinger reaction with PPh3 in refluxing THF/H2O (Fig. 1a and ESI†).36 SAMs from NHC 2 were then formed by immersing cleaned gold surfaces in a 10 mM methanolic solution of NHC precursor 2 for 44 h. The NHC SAMs (2/Au) were interrogated by cyclic voltammetry (CV) in an electrolyte solution containing 5 mM/5 mM Fe(CN)63−/4− as the redox couple, as shown in Fig. 2b. Initially, the bare gold surface shows the highest oxidation and reduction currents with a peak separation of approximately 75 mV in 1 M NaClO4. After NHC SAM formation, the redox peaks are notably suppressed, and the peak separation widens.SAMs of 2 on Au were also characterized using high-resolution X-ray photoelectron spectroscopy (XPS). As seen in Fig. 2c, the C 1s region indicates the presence of aliphatic carbon along with C–N, C–O, and C![[double bond, length as m-dash]](https://www.rsc.org/images/entities/char_e001.gif) C species. The N 1s region provides conclusive evidence for the presence of NHC on the surface. Consistent with what has been previously reported for NHC SAMs, the N 1s XPS region in Fig. 2d was characterized by two peaks in an approximately 2
C species. The N 1s region provides conclusive evidence for the presence of NHC on the surface. Consistent with what has been previously reported for NHC SAMs, the N 1s XPS region in Fig. 2d was characterized by two peaks in an approximately 2![[thin space (1/6-em)]](https://www.rsc.org/images/entities/char_2009.gif) :
:![[thin space (1/6-em)]](https://www.rsc.org/images/entities/char_2009.gif) 1 ratio at 401.3 eV and 399.5 eV, respectively, assigned to bound NHC and amine functional groups.
1 ratio at 401.3 eV and 399.5 eV, respectively, assigned to bound NHC and amine functional groups.
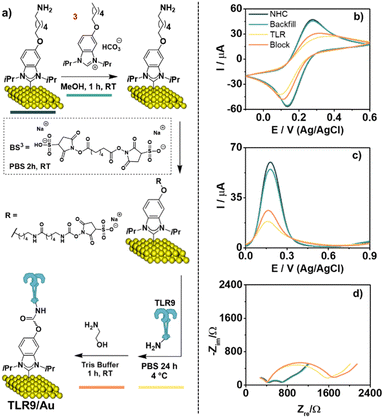
Prior to the introduction of the TLR, the NHC SAM is backfilled with NHC precursor 3 to block any gaps on the surface and minimize non-specific adsorption that may lead to a “false positive” response (Fig. 3a).37–39 While we typically find that NHC-based SAMs are dense packed‡, this procedure addresses the possibility of defects left by physisorption of NHC 2 through the primary amine.
The modified surface was then exposed to a solution of BS3 in phosphate buffer saline (PBS) for 2 h at room temperature. Next, we treated the surface with a PBS solution of TLR9 at 4 °C. TLRs possess readily available primary amines found in the amino acid residues and the N-terminus of each polypeptide chain.40 Any remaining succinimide esters were then deactivated with ethanolamine in Tris buffer for 1 h at room temperature. This deactivation process, also known as the blocking stage, prevents chemical derivatization of the sensor by the analyte, reducing the possibility of a false positive response and increasing the specificity of analyte interactions with the BRE.37
After each stage of sensor modification, the surface was examined by CV, square wave voltammetry (SWV), and electrochemical impedance spectroscopy (EIS) (Fig. 3). These analyses demonstrate that the suppression of current output takes place at each step of surface functionalization. Fig. 3d shows the Nyquist plots for the modified gold electrodes at each stage of surface functionalization, where an increase in charge transfer resistance (Rct) was observed in each case, but the largest increase in seen after the attachment of TLR9, with the insertion of the blocker then making little difference. Creating sensors with identical resistance baselines is a challenge associated when employing self-assembled systems. Therefore, we chose to employ normalized detection signals from triplicate runs to understand biosensor reproducibility.
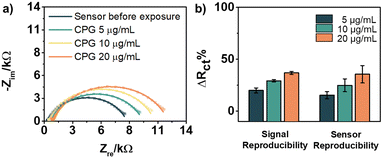
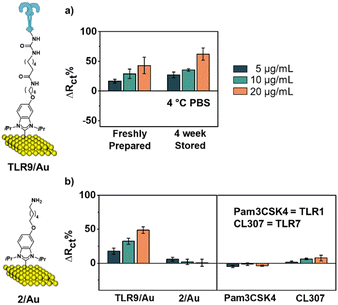
Biosensing experiments were performed on the resulting TLR9 sensor, employing cytosine–phosphorothioate–guanine oligodeoxynucleotide (CpG ODN) type B, an agonist of TLR9, as the analyte.15 The increase in Rct as the concentration of CpG increases confirmed the response of the sensor to the analyte, which in this case is known to induce dimerization of TLR9 (Fig. 4a).41 We envision this dimerization to be enabled through the flexibility of the alkyl chain and BS3 unit binding the TLR to the surface. As shown in Fig. 4b, the normalized responses (ΔRct%) increased as the concentration of CpG increased (16 ± 4%, 25 ± 6%, and 36 ± 8%). Overall, the limit of detection (LOD) of the sensor TLR9/Au was found to be 5 μg mL−1, with a p-value of 0.007, indicating a statistically significant difference from the sensor measurement before exposure. We also tested the performance of the sensor with CpG after its storage in PBS solution at 4 °C for four weeks (Fig. 5a).21 The sensor showed no loss in response compared to the freshly prepared versions (p-value > 0.05).
Next, we compared our TLR9/Au NHC-based sensor with a traditional thiol-based TLR9/Au sensor in which TLR9 was immobilized to Au using 1-lipoic acid n-hydroxysuccinimide ester SAM21 (Scheme S2, ESI†). While both the thiol and NHC linker molecules immobilize TLR9 proteins via the same amide-coupling reaction, the two linker molecules have significant different headgroups, SAM density and chain lengths. After TLR9 immobilization, ethanolamine was used to deactivate any of the remaining succinimide ester as a blocking stage, same steps used to construct TLR9/Au sensor. At this stage, a considerable drop in the impedance was detected for the thiolate SAM, suggesting TLR9 loss from the surface. Since thiolate-based SAMs have previously been reported for the immobilization of related proteins, we suspect that the reduced time for chemisorption of TLR9 to the modified surface (24 h vs. 72 h in prior studies21) may result in incomplete chemisorption onto thiol-based SAMs. The higher end group density typical in thiolate-SAMs may hinder complete reaction at these shorter reaction times. Consistent with this, after treatment with ethanolamine, the resistance (Rct) of the thiol-TLR9 surface returns to the value obtained prior to TLR introduction.
For the thiol-based sensor, a negligible change in the Rct signal was observed after exposure to the analyte. Together with the higher resistance of the baseline, this yielded much smaller ΔRct% value of 0.2 ± 6, 1 ± 3, and −3 ± 6% for CpG concentrations of 5, 10, and 20 μg mL−1, respectively (Fig. S5, ESI†). Overall, these results show that the NHC-based sensor has superior TLR9-based sensor capabilities than traditional thiol systems, with NHC-based SAMs requiring less optimization to achieve comparable or improved results.38,39
To verify the specificity of our NHC sensor TLR9/Au, a control experiment was performed with 2/Au for comparison. As shown in Fig. 5b, 2/Au produced low ΔRct%, ranging from 5 ± 3%, 2 ± 4%, and 0.7 ± 5%, based on the three repeat measurements. On the other hand, the TLR-containing sensor showed a more reliable and positive response to CpG. For all of the CpG concentrations examined, the calculated p-values were found to be less than 0.05, indicating that the response contrast between the sensor and 2/Au is significantly different (Table S1, ESI†). This control study demonstrated the importance of having TLR9 on the surface for effective recognition of CpG.
The sensor was also examined against other types of TLR agonists to confirm its specificity. For this study, TLR1 and TLR7's agonists, Pam3CSK4 and CL307, were used. In all cases, the sensor showed insignificant responses toward the other agonists (p-value < 0.05). Additionally, these results demonstrated that non-specific adsorption of the other agonists did not occur, as the Rct would then have increased significantly, giving a false positive.§ This is very promising for the use of this sensor in real-world settings for CpG-specific performance.
Experimental
Materials and methods
Reactions were performed with reagent grade solvents with the exception of CH2Cl2 and THF, which were distilled from calcium hydride and sodium benzophenone ketyl, respectively, under an argon atmosphere prior to use. 4-Amino-3-nitrophenol was purchased from Alfa Aesar, while trifluoromethanesulfonyl anhydride, chloroform-d, methylene chloride-d2 acetonitrile-d3, and methanol-d4 were purchased from Sigma-Aldrich. CpG oligodeoxynucleotides mouse sequence type b was purchased from Novus Biologicals. NHC 3 was synthesized following a previously published procedure.42Synthetic procedures
The key compound 1 was synthesized following the published procedure (Scheme S1, ESI†).27Surface functionalization
![[thin space (1/6-em)]](https://www.rsc.org/images/entities/char_2009.gif) :
:![[thin space (1/6-em)]](https://www.rsc.org/images/entities/char_2009.gif) H2O2 = 3
H2O2 = 3![[thin space (1/6-em)]](https://www.rsc.org/images/entities/char_2009.gif) :
:![[thin space (1/6-em)]](https://www.rsc.org/images/entities/char_2009.gif) 1 v/v) for 30 s. The electrodes were rinsed thoroughly with Milli-Q (MQ) water. Electrode surfaces were further cleaned by mechanical polishing using a figure-eight polishing motion.44 Different sizes of alumina powder (0.3 μm and 0.05 μm) were selected to prepare alumina suspensions in MQ water. Any retained alumina powder on the gold electrode was removed by ultrasonication in MQ water, then absolute ethanol and again MQ water, each for 10 minutes. The electrodes were further electrochemically cleaned to remove absorbed species from the polishing procedure. The electrodes were then electrochemically cleaned by running 100 CV cycles in 0.5 M KOH between 0 V and 2 V at a scan rate of 0.5 V s−1 and then 100 CV cycles in 0.5 M H2SO4 between 0 V and 1.5 V at the same scan rate.
1 v/v) for 30 s. The electrodes were rinsed thoroughly with Milli-Q (MQ) water. Electrode surfaces were further cleaned by mechanical polishing using a figure-eight polishing motion.44 Different sizes of alumina powder (0.3 μm and 0.05 μm) were selected to prepare alumina suspensions in MQ water. Any retained alumina powder on the gold electrode was removed by ultrasonication in MQ water, then absolute ethanol and again MQ water, each for 10 minutes. The electrodes were further electrochemically cleaned to remove absorbed species from the polishing procedure. The electrodes were then electrochemically cleaned by running 100 CV cycles in 0.5 M KOH between 0 V and 2 V at a scan rate of 0.5 V s−1 and then 100 CV cycles in 0.5 M H2SO4 between 0 V and 1.5 V at the same scan rate.
Lipoic acid n-hydroxysuccinimide ester biosensor formation. Thiol based TLR9 biosensor was prepared following the published procedure (Scheme S2, ESI†).17,21
Conclusions
Here, we report a new synthetic approach to the preparation of an amine functionalized N-heterocyclic carbene (NHC) 2, then attaching TLR9 protein to the NHC via amide coupling with the homo-bifunctional cross linker, BS.3 Additionally, a hydrophobic NHC, 3, was employed to lower the risk of non-specific adsorption. The final sensor demonstrated a positive response towards the typical TLR9 agonist, CpG, introduced at concentrations of 5–20 μg mL−1, which is the concentration range necessary for CpGs to activate TLR9 in the human immune response system.45 The importance of the presence of TLR9 to achieve a reliable sensor response was demonstrated through a control study. The sensor also showed selectivity towards CpG when compared to agonists of other TLR proteins, such as Pam3CSK4 and CL307. The NHC-based sensors also demonstrated no loss of sensitivity, even after 4 weeks of storage. Finally, the developed sensor design was compared to a similar and more traditional thiol-based sensor design, with the NHC-based sensor greatly outperforming the thiol-based sensor.TLR9/Au sensor development and design to detect the presence of CpG DNA has various ramifications for biological and biotechnological applications. First, the method of detecting DNA molecules developed here could have potential applications as detection of therapeutic agents for a number of disorders, such as cancers,16 allergies,46 and infections.15 Furthermore, our new sensor design enables the integration of various types of proteins or biomolecules with an accessible primary amine, such as antibodies, enzymes, or receptors, thus potentially broadening the range of analytes detectable by NHC-based biosensors.
Author contributions
CMC, ZS, and VB conceived the original idea. HB developed the synthesis of 2. DL obtained and analysed the data, along with writing the original draft. KS, MZ, JM, AW and DL contributed to the development of the sensor platform. IS assisted with the analysis of XPS. LQ and AM carried out additional electrochemistry experiments to optimize the sensor design.Conflicts of interest
There are no conflicts to declare.Acknowledgements
CMC, ZS, VB would like to thank the Natural Sciences and Engineering Research Council of Canada, the Canada Research Chairs program, Canada Foundation for Innovation, and the Department of National Defence Canada for their financial supports.Notes and references
- F. Ramírez-Castillo, A. Loera-Muro, M. Jacques, P. Garneau, F. Avelar-González, J. Harel and A. Guerrero-Barrera, Pathogens, 2015, 4, 307–334 CrossRef PubMed.
- E. B. Mohsen Poursadeqiyan and M. F. Arefi, J. Edu. Health Promot., 2020, 9, 250 CrossRef PubMed.
- C. M. Crudden, J. H. Horton, M. R. Narouz, Z. Li, C. A. Smith, K. Munro, C. J. Baddeley, C. R. Larrea, B. Drevniok and B. Thanabalasingam, Nat. Commun., 2016, 7, 12654 CrossRef CAS PubMed.
- M. Malmqvist, Nature, 1993, 361, 186–187 CrossRef CAS PubMed.
- J. L. Casteleiro-Roca, J. L. Calvo-Rolle, M. C. Meizoso-Lopez, A. Piñón-Pazos and B. A. Rodríguez-Gómez, Sens. Actuators, A, 2014, 207, 1–9 CrossRef CAS.
- A. Singh, A. Sharma, A. Ahmed, A. K. Sundramoorthy, H. Furukawa, S. Arya and A. Khosla, Biosensors, 2021, 11, 336 CrossRef CAS PubMed.
- M. Sahar Sadat, F. Sarah Elizabeth and M. Sara, Biosens. Bioelectron., 2021, 176, 112905 CrossRef PubMed.
- M. Pedrero, S. Campuzano and J. M. Pingarrón, Anal. Methods, 2011, 3, 780–789 RSC.
- D. Saakshi and J. Swati, Biosens. Bioelectron., 2013, 41, 54–64 CrossRef PubMed.
- K. M. Abu-Salah, M. M. Zourob, F. Mouffouk, S. A. Alrokayan, M. A. Alaamery and A. A. Ansari, Sensors, 2015, 15, 14539–14568 CrossRef CAS PubMed.
- R. M. Mayall, M. Renaud-Young, E. Gawron, S. Luong, S. Creager and V. I. Birss, ACS Sens., 2019, 4, 143–151 CrossRef CAS PubMed.
- K. Bonroy, F. Frederix, G. Reekmans, E. Dewolf, R. De Palma, G. Borghs, P. Declerck and B. Goddeeris, J. Immunol. Methods, 2006, 312, 167–181 CrossRef CAS PubMed.
- S. Juliana Coatrini, S. Andrey Coatrini, P.-N. Mario, P. Fernando Vieira, N. O. Osvaldo and M. Luiz Henrique Caparelli, Sensors and Actuators Reports, 2022, 4, 100083 CrossRef.
- S. R. El-Zayat, H. Sibaii and F. A. Mannaa, Bull. Natl. Res. Cent., 2019, 43 Search PubMed.
- A. A. Ashkar and K. L. Rosenthal, Curr. Mol. Med., 2002, 2, 545–556 CrossRef CAS PubMed.
- A. S. Sameer and S. Nissar, BioMed Res. Int., 2021, 1–14 Search PubMed.
- Z. She, K. Topping, T. Ma, T. Zhao, W. Zhou, A. Kamal, S. Ahmadi and H.-B. Kraatz, Anal. Chem., 2017, 89, 4882–4888 CrossRef CAS PubMed.
- Z. She, K. Topping, M. H. Shamsi, N. Wang, N. W. C. Chan and H.-B. Kraatz, Anal. Chem., 2015, 87, 4218–4224 CrossRef CAS PubMed.
- G. Poirier, M. Tarlov and H. Rushmeier, Langmuir, 1994, 10, 3383–3386 CrossRef CAS.
- N. T. Flynn, T. N. T. Tran, M. J. Cima and R. Langer, Langmuir, 2003, 19, 10909–10915 CrossRef CAS.
- J. McLeod, C. Park, A. Cunningham, L. O'Donnell, R. S. Brown, F. Kelly and Z. She, Analyst, 2020, 145, 6024–6031 RSC.
- C. Vericat, M. E. Vela, G. Benitez, P. Carro and R. C. Salvarezza, Chem. Soc. Rev., 2010, 39, 1805 RSC.
- C. M. Crudden, J. H. Horton, I. I. Ebralidze, O. V. Zenkina, A. B. McLean, B. Drevniok, Z. She, H.-B. Kraatz, N. J. Mosey, T. Seki, E. C. Keske, J. D. Leake, A. Rousina-Webb and G. Wu, Nat. Chem., 2014, 6, 409 CrossRef CAS PubMed.
- A. V. Zhukhovitskiy, M. J. MacLeod and J. A. Johnson, Chem. Rev., 2015, 115, 11503–11532 CrossRef CAS PubMed.
- G. Kaur, R. L. Thimes, J. P. Camden and D. M. Jenkins, Chem. Commun., 2022, 58, 13188–13197 RSC.
- R. M. Mayall, C. A. Smith, A. S. Hyla, D. S. Lee, C. M. Crudden and V. I. Birss, ACS Sens., 2020, 5, 2747 CrossRef CAS PubMed.
- I. Singh, D. S. Lee, S. Huang, H. Bhattacharjee, W. Xu, J. F. McLeod, C. M. Crudden and Z. She, Chem. Commun., 2021, 57, 8421 RSC.
- M. Workentin and P. Gobbo, Synlett, 2016, 1919–1930 Search PubMed.
- W. Huang, X. Wu, X. Gao, Y. Yu, H. Lei, Z. Zhu, Y. Shi, Y. Chen, M. Qin, W. Wang and Y. Cao, Nat. Chem., 2019, 11, 310–319 CrossRef CAS PubMed.
- D. Kato, K. Goto, S.-I. Fujii, A. Takatsu, S. Hirono and O. Niwa, Anal. Chem., 2011, 83, 7595–7599 CrossRef CAS PubMed.
- J. J. Gooding, Electroanalysis, 2002, 14, 1149–1156 CrossRef CAS.
- A. Sedighi, P. C. H. Li, I. C. Pekcevik and B. D. Gates, ACS Nano, 2014, 8, 6765–6777 CrossRef CAS PubMed.
- N. Soda, Z. J. Gonzaga, A. S. Pannu, N. Kashaninejad, R. Kline, C. Salomon, N.-T. Nguyen, P. Sonar, B. H. A. Rehm and M. J. A. Shiddiky, Cancers, 2021, 13, 3787 CrossRef CAS PubMed.
- D. Kang, C. Parolo, S. Sun, N. E. Ogden, F. W. Dahlquist and K. W. Plaxco, ACS Sens., 2018, 3, 1271–1275 CrossRef CAS PubMed.
- M. J. E. Fischer, Amine Coupling Through EDC/NHS: A Practical Approach, in Surface Plasmon Resonance, ed. N. Mol and M. Fischer, Methods in Molecular Biology, Humana Press, 2010, vol. 627, pp. 55–73 Search PubMed.
- M. Kleoff, J. Schwan, L. Boeser, B. Hartmayer, M. Christmann, B. Sarkar and P. Heretsch, Org. Lett., 2020, 22, 902–907 CrossRef CAS PubMed.
- J. Y. Lichtenberg, Y. Ling and S. Kim, Sensors, 2019, 19, 2488 CrossRef CAS PubMed.
- Z. She, M. R. Narouz, C. A. Smith, A. MacLean, H.-P. Loock, H.-B. Kraatz and C. M. Crudden, Chem. Commun., 2020, 56, 1275–1278 RSC.
- D. T. Nguyen, M. Freitag, M. Körsgen, S. Lamping, A. Rühling, A. H. Schaefer, M. H. Siekman, H. F. Arlinghaus, W. G. van der Wiel and F. Glorius, Angew. Chem., Int. Ed., 2018, 57, 11465–11469 CrossRef CAS PubMed.
- K. Motokawa, S. K. Hahn, T. Nakamura, H. Miyamoto and T. Shimoboji, J. Biomed. Mater. Res., Part A, 2006, 78A, 459–465 CrossRef CAS PubMed.
- A. Comberlato, M. M. Koga, S. Nüssing, I. A. Parish and M. M. C. Bastings, Nano Lett., 2022, 22, 2506–2513 CrossRef CAS PubMed.
- C. M. Crudden, J. H. Horton, M. R. Narouz, Z. Li, C. A. Smith, K. Munro, C. J. Baddeley, C. R. Larrea, B. Drevniok, B. Thanabalasingam, A. B. McLean, O. V. Zenkina, I. I. Ebralidze, Z. She, H.-B. Kraatz, N. J. Mosey, L. N. Saunders and A. Yagi, Nat. Commun., 2016, 7, 12654 CrossRef CAS PubMed.
- G. R. Fulmer, A. J. M. Miller, N. H. Sherden, H. E. Gottlieb, A. Nudelman, B. M. Stoltz, J. E. Bercaw and K. I. Goldberg, Organometallics, 2010, 29, 2176–2179 CrossRef CAS.
- N. Elgrishi, K. J. Rountree, B. D. McCarthy, E. S. Rountree, T. T. Eisenhart and J. L. Dempsey, J. Chem. Educ., 2017, 95, 197–206 CrossRef.
- Nuvusbio, CpG Oligodeoxynucleotides Mouse NBP2-31142 https://www.novusbio.com/PDFs2/NBP2-31142.pdf, (accessed 05-16, 2023).
- S. C. Gangloff and M. Guenounou, Clin. Rev. Allergy Immunol., 2004, 26, 115–125 CrossRef CAS PubMed.
Footnotes |
| † Electronic supplementary information (ESI) available. See DOI: https://doi.org/10.1039/d4ma00188e |
| ‡ Although the direct measurement of NHC density was not carried out in this study, prior work has estimated the coverage as ca. 3–3.5 molecules nm−2.23,42 |
| § Negative ΔRct% value means the sensor baseline Rct was reduced possible due to some non-specific interactions. However, statistical test shows that the changes triggered by the agonists (control) are statistically insignificant with p-value < 0.05. |
| This journal is © The Royal Society of Chemistry 2024 |

