 Open Access Article
Creative Commons Attribution 3.0 Unported Licence
Variations in γ′ formers and refractory elements for enhanced creep resistance and phase stability of an advanced Ni-based superalloy†‡
Rui
Feng
ab,
Chang-Yu
Hung
ab,
Stoichko
Antonov
a,
Jonathan D.
Poplawsky
 c,
Ke
An
 d,
Paul D.
Jablonski
a and
Martin
Detrois
 *a
*a
aNational Energy Technology Laboratory, 1450 Queen Avenue SW, Albany, OR 97321, USA. E-mail: martin.detrois@netl.doe.gov
bNETL Support Contractor, 1450 Queen Avenue SW, Albany, OR 97321, USA
cCenter for Nanophase Materials Sciences, Oak Ridge National Laboratory, 1 Bethel Valley Road, Oak Ridge, TN 37831, USA
dNeutron Scattering Division, Oak Ridge National Laboratory, 1 Bethel Valley Road, Oak Ridge, TN 37831, USA
First published on 16th October 2024
Abstract
The strong demands on increasing fuel efficiency have continuously driven the optimization of superalloys for high-performance applications. In this study, modifications to the chemistry and heat treatment of HAYNES® 282® alloy (H282) were performed by varying γ′ formers and refractory elements. It was found that increasing Ti and substituting W for some of the Mo in the newly designed alloy (Q) resulted in a significant improvement of creep resistance, up to 130% increase in creep life, compared to standard H282. It was found that Orowan loops and dislocation climb were the dominant creep deformation mechanisms in alloy Q, while extensive dislocation tangling as an additional configuration was observed in the baseline alloy. Moreover, phase stability investigations for up to 5000 h at 800 °C and 900 °C revealed a reduced formation of detrimental σ and μ phases in alloy Q when compared to H282. Atom-probe tomography (APT) revealed that the formation and growth of those phases were responsible for a decrease in Mo content in the matrix, thereby leading to a decrease in solid-solution strengthening in H282 over time. Furthermore, the coarsening of γ′ precipitates was retarded by the substitution of W for Mo, particularly under creep stress. The theoretical and experimental understanding of precipitation strengthening unraveled that higher optimal strengthening occurs at larger particle size for alloy Q, compared to the commercial formulation, further explaining the origin of enhanced creep resistance in the modified alloy.
1. Introduction
Nickel-based superalloys have been widely used to manufacture turbine blades and discs for use in both aero- and land-based gas turbines due to their remarkable high-temperature strength, creep resistance, and oxidation and corrosion resistance.1 The exceptional mechanical properties of Ni-based superalloys at high temperatures are primarily governed by a microstructure consisting of L12-ordered γ′ precipitates coherently embedded in the face-centered cubic (FCC) γ matrix. To further enhance the performance of Ni-based superalloys, many efforts have been made to optimize their chemical compositions and tailor microstructural features such as the γ′ precipitate size, volume fraction, and morphology.2–9 An example can be seen in HAYNES® 282® alloy (H282), whose chemical composition was designed to achieve a favorable combination of creep strength, thermal stability, fabricability, and weldability.2,3 In the alloy-design principles of H282, the γ′ forming elements (i.e., Ti and Al) are balanced to obtain a relatively low γ′ volume fraction (∼19%) for improved fabricability. Moreover, an optimal content of Mo (∼8.5 wt%) is added to provide significant solid-solution strengthening and retain high creep strength, because of its relatively large atomic size and slow diffusion kinetics in Ni.3,10,11Although H282 exhibits attractive fabricability compared to other superalloys, its creep performance still needs further improvement to meet the increasing global demands for energy efficiency and potential use in next-generation energy systems, such as those using hydrogen as fuel. To this end, research efforts have been spurred to further optimize the chemical composition of H282 to enhance its creep strength while still maintaining its exceptional fabricability. In this regard, varying the concentration of γ′ forming elements, Al and Ti, has been explored as the ratio between these element is crucial for maintaining a low γ/γ′ misfit and thus enhancing the stability of γ′ at high temperatures.6,12 According to a previous report, it was observed that a low Ti/Al ratio (1.26) H282 variant coarsens more rapidly than a high Ti/Al ratio (1.748) variant.6 Another common strategy for improving the creep resistance is to add refractory elements, such as Mo, W, Ta or Re, because these refractory elements can effectively enhance the thermal stability and solid-solution strengthening due to their sluggish diffusivities in Ni and large atomic sizes.13 For example, Re can significantly enrich the γ phase and thus obviously strengthen it, while also stabilizing the γ/γ′ interfaces.8,14,15 Although primarily used for single-crystal superalloys, Wadowski et al.16 studied the effect of Re addition on the atomic interactions in H282 by ab initio calculations. They found that the addition of Re to H282 can preserve the character of the atomic interactions in the alloy,16 however, the effect of Re on creep resistance and thermal stability has not been reported for H282 yet. More importantly, Re is a scarce strategic element, which can lead to high alloy costs despite small additions in Ni-based superalloys.17 More common solid-solution strengtheners for polycrystalline Ni-based superalloys are Mo and W. Tungsten has the highest melting temperature and is among the slowest diffusers in Ni, which can not only impart significant solid-solution strengthening but also effectively reduce the γ′ precipitates’ growth and coarsening rate in Ni-based superalloys.18 To the best of our knowledge, no studies on the effect of W addition on the creep and thermal stability behaviors of H282 alloy have been reported so far.
Therefore, we designed variants of alloy H282 by increasing the content of γ′ formers and by substituting W for Mo. The present work provides a systematic study on understanding the role of Ti, Al, and W on the creep resistance and phase stability of H282. Specifically, using targeted Ti addition and W substitution, the creep life of the best performing alloy was increased by 130% compared to the commercial alloy tested at 760 °C and 259 MPa. The underlying creep deformation mechanisms were evaluated by examining the microstructures and dislocation configurations of the designed alloy variants. Moreover, the effect of W on the coarsening kinetics and thermal stability after thermal exposure up to 5000 h was investigated by characterizing the morphological evolution, spatial correlations, and temporal evolution of γ′ precipitates. The effects of W addition on the elemental partitioning, solid-solution strengthening, and precipitation strengthening were also analyzed by atom probe tomography (APT) and theoretical calculation. The insights obtained from this thorough study can provide valuable guidance to optimize the alloying design strategies in Ni-based superalloys for achieving enhanced long-term creep resistance.
2. Materials and methods
The alloys for this investigation were fabricated using vacuum induction melting (VIM). Three formulations are reported for this investigation, alloys STD (which is a nominal chemistry for H282), P, and Q. High-purity raw materials were used to cast 8 kg cylindrical ingots with a diameter of 75 mm. The phase diagrams of the three alloys were predicted by Thermo-Calc using TCNi8 to determine the liquidus and solidus temperatures. Melting was performed with 50 °C superheat above the Thermo-Calc predicted liquidus temperature and at a partial pressure of 200 Torr Ar. After casting, the top of each ingot was cut into 5 mm thick slices for chemistry analysis. Major elements were determined using X-ray fluorescence (XRF) on a Rigaku ZSX Primus II, while carbon (C) was measured using combustion analysis on LECO systems (Table 1). The ingots were homogenized using a computationally optimized homogenization heat treatment.19 Subsequently, the homogenized ingots underwent steps of hot forging and hot rolling to form plates with a thickness of approximately 10 mm. The standard aging heat treatment (referred to as SA) of 1010 °C/2 h + 788 °C/2 h as specified for H282 was used to heat treat the plates. It was later found that the first step of the heat treatment was too low for alloy Q as the solvus temperature of the γ′ phase increased which resulted in a bimodal precipitate size. Thus, the alternate single-step aging heat treatment (SSA) consisting of 800 °C for 4 h was also investigated for alloy Q. To investigate the phase stability and coarsening behavior, phase stability studies at 800 °C and 900 °C were conducted in air with exposure times of 100 h, 500 h, 1000 h, 2000 h, and 5000 h on the as-solutioned alloys.| Alloy | Ni | Mn | Si | Cr | Co | Mo | W | Ti | Al | C | B |
|---|---|---|---|---|---|---|---|---|---|---|---|
| STD | Bal. | 0.11 | 0.04 | 19.9 | 9.7 | 8.5 | — | 2.1 | 1.7 | 0.06 | 0.004 |
| P | Bal. | 0.20 | 0.05 | 19.9 | 9.7 | 8.5 | — | 2.5 | 2.1 | 0.06 | 0.004 |
| Q | Bal. | 0.21 | 0.05 | 19.9 | 9.8 | 4.5 | 3.85 | 2.5 | 1.7 | 0.06 | 0.004 |
The precipitates of the aged samples from at least three different grains were characterized on a JEOL JSM-IT700HR scanning electron microscope (SEM). The SEM specimens were prepared using standard metallographic techniques with a final vibratory polishing using 0.05 μm colloidal silica. Scanning/transmission electron microscopy (S/TEM) observations on γ′ precipitates and dislocation configurations were carried out on a JEOL 2100Plus TEM equipped with energy-dispersive X-ray spectroscopy (EDS) detector operated at 200 kV. Discs measuring 3 mm in diameter for TEM characterization were extracted from the thread region and gauge section of tensile samples for as-aged and interrupted crept conditions, respectively. The 3 mm diameter discs were mechanically thinned down to about 50 μm, followed by twin-jet electropolishing on a Struers TenuPol-5 with an electrolyte solution of 20% Perchloric acid and 80% Ethanol maintained at −16 °C and with an applied voltage of 20 V. The size, volume fraction, and spatial correlation of γ′ precipitates were determined from SEM or TEM images using ImageJ software analysis. The average γ′ precipitate size, d, was defined by an area-equivalent diameter (i.e.,  ). The volume fraction of precipitates, ϕ, was determined by ϕ = Af, where Af is the projected areal fraction of precipitates.20 The number density, nv, calculated by nv = na/d, where na is the areal density of precipitates.20
Time-of-flight (TOF) neutron diffraction measurements on the as-aged STD and Q samples were conducted on the VULCAN Engineering Materials Diffractometer at the Spallation Neutron Source (SNS) of the Oak Ridge National Laboratory (ORNL).21,22 Rietveld refinements on the diffraction profiles were performed to determine lattice parameters of γ′ precipitates and γ matrix.
The APT measurements were performed using a CAMECA LEAP 4000XHR local electrode atom probe.23 Sharp-tip specimens for APT were prepared using a FEI Nova 200 dual beam SEM/focused ion beam (FIB).24 The APT acquisition was performed in laser mode at 30 K with a pulse frequency of 200 kHz and a 60 pJ laser pulse energy. The APT data was reconstructed and analyzed using CAMECA's IVAS 3.8 software.
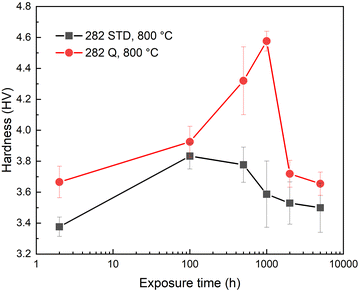
Creep testing was performed using constant load creep frames on specimens machined from the plates following aging. The overall length measured 76.2 mm with a gauge section of 31.75 mm and a reduced diameter of 6.25 mm. Testing was performed according to ASTM E-139 Standard.25 Interrupted creep tests were carried out at 760 °C and 259 MPa, and the samples were cooled under load to preserve the dislocation structures. Vickers hardness was performed at room temperature (RT) on the 800 °C aged samples with different aging times, using a Buehler Micromet II Microhardness Tester. The testing load was 300 gf with a holding time of 10 s. Measurements were repeated eight times at different regions to ensure repeatability.
3. Results
3.1. Phase diagram prediction
Fig. 1 shows the predicted phase fractions as a function of temperature and the values of liquidus, solvus temperatures and γ′ fractions at selected temperatures are listed in Table 2. Alloy P was designed so that the fraction of γ′ precipitates at 900 °C in P equals that in alloy STD at 800 °C. The predictions, however, revealed a higher fraction of γ′ precipitates in P at 900 °C compared to STD at 800 °C, which was attributed to the fact that the simulations were performed using the measured, and not nominal, alloy compositions. The solvus temperatures for γ′ and μ phases slightly increased in alloy P, compared to alloy STD. Alloy Q was designed not only to increase the fraction of γ′ precipitates but also to improve the phase stability of the alloy. Compared to alloy STD, only the Ti content was increased by 0.4 wt% and 3.85 wt% W was substituted for Mo. This led to a predicted fraction of γ′ in Q in between those for STD and P. The similar liquidus temperatures were predicted between STD and Q, while higher solvus temperatures of γ′ and μ were predicted for alloy Q compared to STD, particularly for μ phase (246 °C higher). It is noted that a major difference between the predicted phase diagrams is the absence of σ phase in alloy Q compared to alloys STD and P. The predicted fraction of topologically close-packed (TCP) phases (σ, μ) was less in alloy Q compared to the other alloys, however, the solvus temperature of the μ phase was higher in alloy Q. The predicted compositions of the precipitate phases σ, μ, and M23C6 are listed in Table 3 for each alloy. | ||
| Fig. 1 Thermo-Calc phase prediction for mole fraction between 0.001 and 1 and temperature between 600 °C and 1400 °C for alloys (a) STD, (b) P, and (c) Q. | ||
| Alloy | Liquidus (°C) | γ′ Solvus (°C) | μ Solvus (°C) | γ′ at 800 °C (%) | γ′ at 900 °C (%) |
|---|---|---|---|---|---|
| STD | 1366 | 1010 | 940 | 18.8 | 13.3 |
| P | 1355 | 1051 | 975 | 25.3 | 20.0 |
| Q | 1365 | 1026 | 1186 | 21.6 | 16.2 |
| Alloy | Phase | Temperature (°C) | Ni | Cr | Co | Mo | W | C |
|---|---|---|---|---|---|---|---|---|
| STD | σ | 800 | 28 | 38 | 6.9 | 27 | — | — |
| μ | 920 | 22 | 33 | 12 | 33 | — | — | |
| M23C6 | 800 | 2.8 | 66 | 0.7 | 9.5 | — | 21 | |
| P | σ | 800 | 27 | 41 | 8.5 | 24 | — | — |
| μ | 960 | 21 | 34 | 12 | 33 | — | — | |
| M23C6 | 800 | 2.5 | 67 | 0.7 | 9.4 | — | 21 | |
| Q | μ | 900 | 11 | 35 | 8 | 31 | 14 | — |
| M23C6 | 800 | 2.5 | 69 | 0.5 | 6.9 | 0.4 | 21 |
3.2. Microstructural phase stability
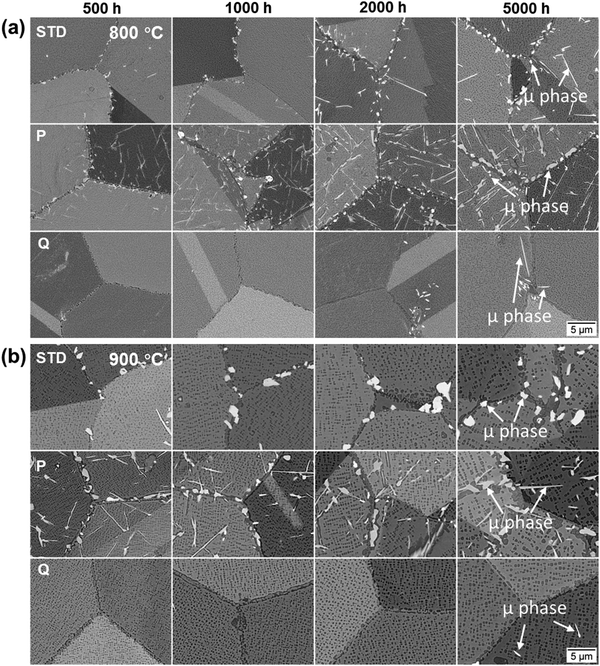
Fig. 2 presents the SEM microstructures of STD, P, and Q alloys at their triple junctions of GBs after aging at 800 °C and 900 °C for different durations. It can be found that a higher amount of TCP phases – Mo-rich μ phase (bright contrast) and occasionally Mo-rich σ phase (also bright contrast) – is precipitated in alloy P compared to STD and Q (EDS analysis for specimens exposed to 800 °C for 5000 h is given in the ESI‡). Overall, it can be concluded that phase stability was significantly improved in alloy Q, i.e., reducing the formation of TCP phases, using the addition of W and by lowering the Mo content. The extensive formation of the TCP phase in alloys STD and P after 2000 h exposure at 800 °C is a result of more Mo diffusing from the γ matrix to GBs, which can easily trigger the formation of the TCP phase. In alloy P, the addition of Ti and particularly Al, promoted the formation of γ′ precipitates, which resulted in a matrix with lower Ni, or in other words more TCP phase forming elements, e.g., Cr, Mo, compared to the matrix of alloy STD. TCP phases are detrimental to the thermomechanical properties of Ni-based superalloys and are generally avoided.26 Due to the poor phase stability results of alloy P, this formulation was not explored further. Furthermore, one can notice that some differences indeed exist between the experimental results and predicted phase diagrams, which could be due to inaccurate predictions from available databases.3.3. Microstructures
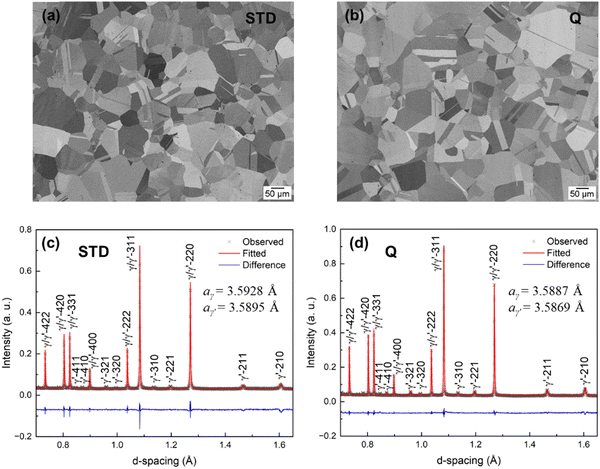
Fig. 3(a) and (b) show the representative grain microstructures of alloys STD and Q. Both alloys have equiaxed grains with similar grain sizes of about 68 ± 12 μm for alloy STD and 65 ± 6 μm for alloy Q, measured using the linear intercept technique. The neutron diffraction patterns at the high-resolution detector bank for both alloys are given in Fig. 3(c) and (d). According to the indexed Braggs peaks, γ′ (L12) and γ (FCC) structures are identified in both alloys, while no other precipitated phases are detected. Using Rietveld refinement, the lattice parameters of the γ′ and γ phases are determined to be 3.5895 Å and 3.5928 Å, respectively, for alloy STD, and 3.5869 Å and 3.5887 Å, respectively, for alloy Q. As a result, the lattice misfits, δ, between the γ′ and γ phases are calculated as −0.09% for alloy STD and −0.05% for alloy Q using the following equation: | (1) |
To identify γ′ precipitates and quantify their size, TEM was performed for both alloys in their as-aged and crept (gauge section) conditions with the SA heat treatment for alloy STD and SSA for alloy Q. Fig. 4(a) and (c) display the representative TEM dark-field (DF) images of the γ′ precipitates in both alloys in their as-aged conditions, exhibiting the spherical shape. From the precipitate size distribution analysis (Fig. 4(b) and (d)), the average particle size for alloy STD (∼19.6 ± 5.1 nm) is about half that of alloy Q (∼38.6 ± 5.5 nm). In addition, the γ′ precipitates after 1000 h in creep at 259 MPa and 760 °C were also characterized. As shown in Fig. 4(e)–(h), coarser and unimodal spherical γ′ precipitates (∼70.1 ± 21.0 nm) are uniformly dispersed in the γ matrix in alloy Q. In contrast, a bimodal γ′ precipitate distribution is observed in alloy STD, comprising fine spherical γ′ precipitates of about 53.4 ± 5.5 nm and coarse cuboidal γ′ precipitates of about 202.1 ± 4.8 nm, implying lower resistance to coarsening during creep for alloy STD compared to alloy Q. The bimodal γ′ size distribution is likely related to the formation of secondary γ′ precipitates upon cooling from 760 °C to room temperature at the end of the interrupted creep test.
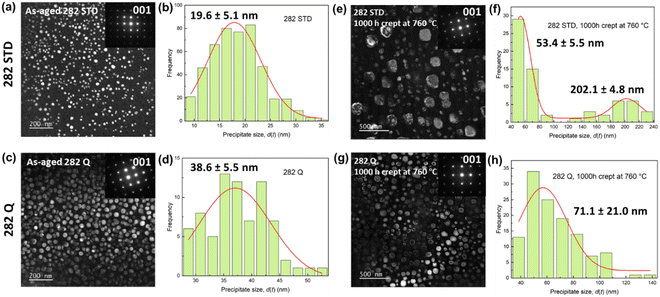 | ||
| Fig. 4 TEM DF images and γ′ precipitate size distributions of the alloys STD (a)–(d) and Q (e)–(h) in their as aged conditions and their 1000 h crept at 259 MPa and 760 °C conditions, respectively. | ||
3.4. Coarsening behavior of γ′ precipitates
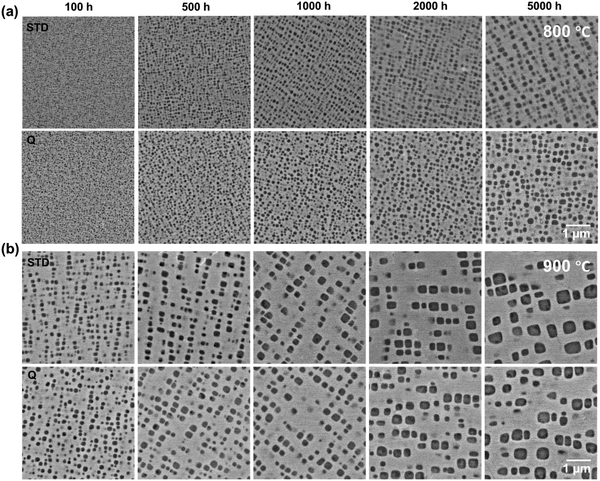 | ||
| Fig. 5 BSE SEM images of γ′ precipitates in both alloys STD and Q after exposure to 800 °C (a) and 900 °C (b) for 100, 500, 1000, 2000, and 5000 h. | ||
| Alloy | Temperature (°C) | Time (h) | d (nm) | ϕ (%) | N v × 1020 (m−3) |
|---|---|---|---|---|---|
| STD | 800 | 100 | 47.8 ± 4.1 | 23.7 ± 0.1 | 28.7 ± 2.4 |
| 500 | 71.6 ± 6.0 | 23.9 ± 0.3 | 8.3 ± 0.7 | ||
| 1000 | 94.9 ± 7.0 | 23.2 ± 0.4 | 3.5 ± 0.3 | ||
| 2000 | 114.5 ± 9.0 | 22.7 ± 0.6 | 1.9 ± 0.2 | ||
| 5000 | 144.5 ± 13.2 | 23.0 ± 1.2 | 0.9 ± 0.1 | ||
| 900 | 100 | 134.0 ± 10.7 | 18.6 ± 0.3 | 1.06 ± 0.08 | |
| 500 | 193.5 ± 15.4 | 18.6 ± 0.5 | 0.32 ± 0.02 | ||
| 1000 | 226.8 ± 18.3 | 17.8 ± 0.9 | 0.20 ± 0.02 | ||
| 2000 | 275.2 ± 21.7 | 18.5 ± 1.3 | 0.11 ± 0.01 | ||
| 5000 | 349.1 ± 35.4 | 17.1 ± 1.6 | 0.05 ± 0.005 | ||
| Q | 800 | 100 | 48.4 ± 4.5 | 23.6 ± 0.1 | 28.5 ± 2.49 |
| 500 | 73.4 ± 7.1 | 24.5 ± 0.3 | 6.85 ± 0.66 | ||
| 1000 | 91.0 ± 7.6 | 22.2 ± 0.4 | 3.75 ± 0.31 | ||
| 2000 | 115.1 ± 10.3 | 24.4 ± 0.7 | 2.05 ± 0.18 | ||
| 5000 | 149.3 ± 13.8 | 25.6 ± 1.3 | 0.98 ± 0.09 | ||
| 900 | 100 | 126.7 ± 9.7 | 20.2 ± 0.4 | 1.27 ± 0.13 | |
| 500 | 191.2 ± 15.4 | 20.5 ± 0.6 | 0.37 ± 0.03 | ||
| 1000 | 225.4 ± 18.1 | 21.5 ± 0.9 | 0.24 ± 0.02 | ||
| 2000 | 264.2 ± 22.8 | 21.0 ± 1.3 | 0.15 ± 0.01 | ||
| 5000 | 334.7 ± 33.8 | 19.2 ± 1.1 | 0.07 ± 0.006 |
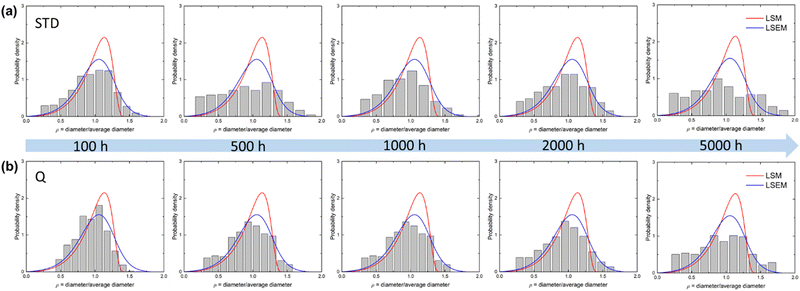
On the other hand, the number density of precipitates decreases as the exposure time increases, indicating the coarsening stage in both alloys. Specifically, the number density decreases from (2.8 ± 0.2) × 1021 m−3 to (8.8 ± 0.8) × 1019 m−3 and from (2.7 ± 0.2) × 1021 m−3 to (9.8 ± 0.9) × 1019 m−3 for STD and Q alloys, respectively, when the exposure time increases from 100 h to 5000 h at 800 °C. A similar decrease in number density can be also seen in both alloys after exposure to 900 °C with time increasing from 100 h to 5000 h (Table 4). In addition, the γ′ precipitates for alloy STD exposed to 800 °C for 100 h and 500 h appear spheroidal and uniformly distributed throughout the γ matrix, while the γ′ precipitates become cuboidal after exposure to 800 °C for 1000 h (Fig. 5(a)), indicating the onset of the elastically induced sphere-to-cube morphological transition. After 5000 h exposure to 800 °C, the precipitates in alloy STD start to show a more-faceted cube-like shape. The cuboidal precipitates align along the 〈100〉 matrix direction, which is the elastically soft crystallographic direction. In contrast, the γ′ precipitates in alloy Q remain spheroidal even after being exposed for 2000 h at 800 °C (Fig. 5(a)). Only after 5000 h exposure time the cuboidal morphology of the γ′ precipitates began to appear, but many particles still retain their spheroidal shape. The late onset of sphere-to-cube morphological transition in alloy Q compared to alloy STD was also present when exposing the specimens to 900 °C (Fig. 5(b)). For example, the γ′ precipitates remain spheroidal in alloy Q after 100 h, while the γ′ particles in alloy STD already show clearly faceted cuboids after 100 h. The different responses to sphere-to-cube morphological transition between the alloys suggest the difference in elastic strain energy controlled by lattice misfit in both alloys during coarsening.
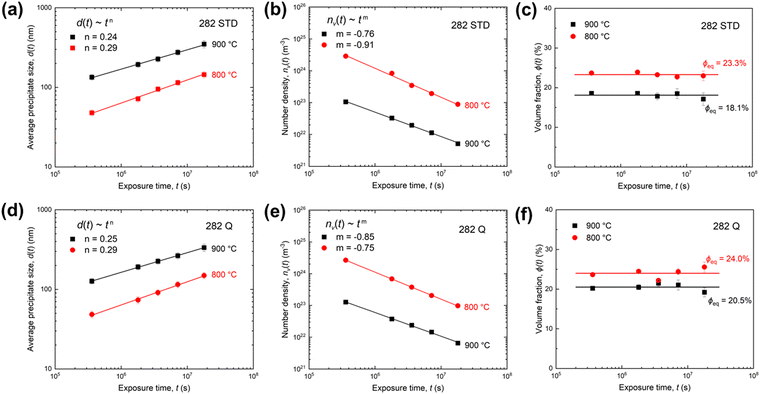
Fig. 7(b) and (e) plot the power-law relationship of precipitate number density, nv(t), as a function of the exposure time in STD and Q alloys at 800 °C and 900 °C. The precipitate number density, nv(t), decreases with exposure time, indicating that the alloys are well into the coarsening stage. The power-law exponents for nv(t) are determined to be −0.76 and −0.91 for alloy STD at 800 °C and 900 °C, respectively, and −0.85 and −0.75 for alloy Q at 800 °C and 900 °C, respectively. Similar temporal exponents for the number density have also been observed in other Ni-based superalloys.33
Fig. 7(c) and (f) display the evolution of volume fraction, ϕ(t), of γ′ precipitates as a function of exposure time. The values of ϕ(t) in both alloys are nearly constant with respect to exposure time from 100 h to 5000 h at each temperature, indicating that the alloys appear to be at their equilibrium value (ϕeq). Moreover, as the aging temperature increases from 800 °C to 900 °C, the equilibrium volume fractions (ϕeq) decrease from 23.3% to 18.1% and 24.0% to 20.5% for STD and Q alloys, respectively. The reached ϕeq also implies that the alloys are within the coarsening regime.
 , is plotted in Fig. 8(e), which is defined as
  , where Cγi and
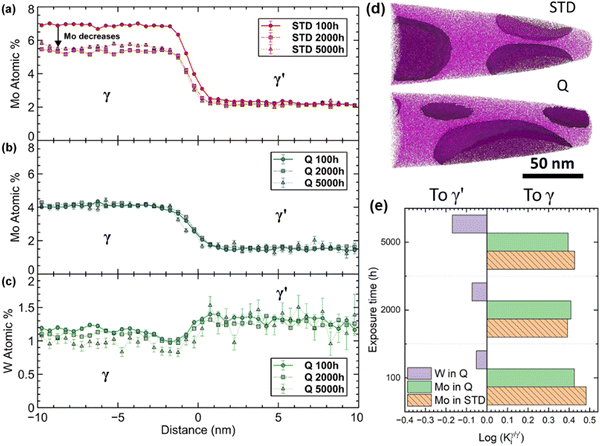
  represent the atomic concentrations of element i in the γ and γ′ phases, respectively. In Fig. 8(e), the columns on the left (right) mean that the element partitions to γ′ (γ) phase. Similarly, it can be clearly seen that W partitions to γ′ precipitates in alloy Q, while Mo is enriched in the γ matrix.
3.5. Creep properties
To examine the alloying effect on the designed H282 variant alloy Q, creep-rupture testing was performed in its standard and single-step aging conditions (SA and SSA, respectively). Fig. 10(a) exhibits the creep lives of STD and Q alloys in a Larson–Miller plot, which is defined by eqn (2), in comparison to that of the ORNL H282 code case,34| LMP = T[20 + log(t) × 103] | (2) |
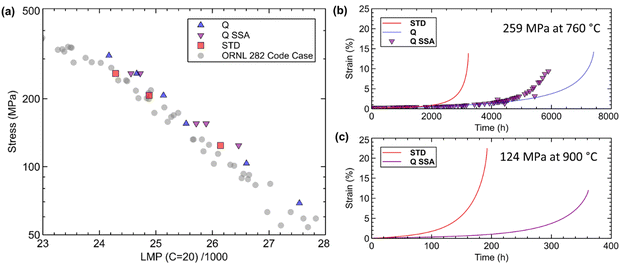 | ||
| Fig. 10 (a) Larson–Miller parameter plot for alloys STD, Q and the H282 code case.32 (b) and (c) Creep curves for creep testing at 760 °C and 259 MPa and 900 °C and 124 MPa, respectively. | ||
3.6. Creep deformation microstructures
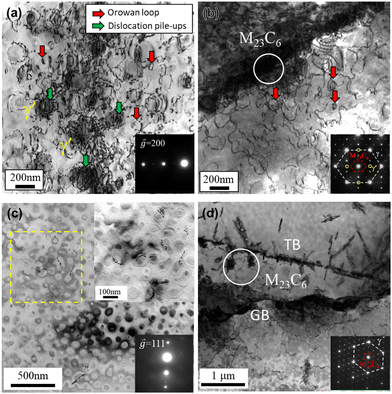
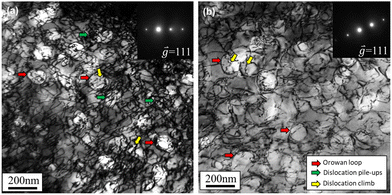
To understand the creep deformation mechanisms, TEM micrographs of dislocation configurations were imaged under two-beam conditions in both alloys after creep interrupted at 1000 h and ruptured at 760 °C and 259 MPa with a creep strain of ∼0.23%. Fig. 11 presents the bright-field (BF) TEM images of the dislocation configurations at the locations of grain interior and boundary in both alloys. In alloy STD, dislocation loops, marked by red arrows, were mainly observed within the grain interior and near the grain boundary (GB) after creep tests for 1000 h at 760 °C and 259 MPa (Fig. 11(a) and (b)). Orowan loops surrounding the γ′ precipitates are generated when the gliding dislocations in the γ matrix cannot shear into the γ′ precipitates but rather loop around them via the Orowan bypass process. Another feature of the dislocation sub-structure in STD alloy is the dislocation pile-ups lying on the γ/γ′ interface, indicated by the green arrows (Fig. 11(a)). The formation of dislocation pile-ups is a result of the reaction of activated dislocations when they glide into the γ/γ′ interface, which can serve to neutralize the misfit stress at the γ/γ′ interface and also promote dislocation climb during creep.35,36 In addition, dislocation pile-ups at GB and interacting dislocations with M23C6 carbides were also observed in alloy STD (Fig. 11(b)). Interestingly, very few bowed dislocations surrounding the γ′ precipitates in alloy Q were seen after creep, indicating a much stronger resistance to dislocation slip in the matrix of alloy Q than that in STD (Fig. 11(c)). Similarly, less dense dislocation pile-ups at GB were observed in alloy Q than in alloy STD (Fig. 11(d)), further correlating to the better creep resistance in alloy Q.Fig. 12 displays the dislocation configurations after creep rupture at 760 °C and 259 MPa in alloys STD (creep time 3240 h) and Q (creep time 7410 h). Extensive Orowan loops and dislocation climbing evident by dislocations with bent morphology can be observed in the creep-ruptured samples of both alloys. Compared to STD and Q specimens subjected to interrupted creep tests, the pronounced appearance of dislocation climb in the ruptured specimens is attributed to the longer creep time, allowing enough time for dislocations to climb over the γ′ precipitates. Moreover, in line with the TEM observation from the interrupted creep samples (Fig. 11), a distinct feature of dislocation tangles around the γ′ precipitates was present in alloy STD, while it was barely seen in alloy Q. The more extensive dislocation tangling, i.e., pile-ups, in alloy STD than that in alloy Q is likely resulting from the greater coarsening of the γ′ precipitates in alloy STD during creep (Fig. 2(e) and (f)), creating more intense interactions between dislocations and γ′ precipitates, as well as the larger γ/γ′ misfit magnitude in alloy STD.
4. Discussion
4.1. Morphological evolution
The morphological evolution of γ′ precipitates is critical to the mechanical performance of Ni-based superalloys during high-temperature service. The equilibrium morphology of γ′ precipitates is determined by the minimization of the interfacial free energy and elastic free energy arising from lattice misfit.37,38 Such a total free-energy minimization criterion gives a critical particle size, rcrit.38,39 When the precipitate size is smaller than rcrit, the morphology of γ′ precipitates is primarily dictated by the interfacial free energy, because the elastic strain energy caused by the lattice misfit between γ and γ′ phases is negligible or lower. As the γ′ precipitates grow larger than rcrit, elastic strain energy becomes more influential in determining the equilibrium shape of precipitates. The competition between the elastic energy and γ/γ′ interfacial energy can be quantified by a dimensionless parameter, L:40 | (3) |
 , where
  and aγ are the lattice parameters of the γ′ precipitate and γ matrix, respectively, C44 is an elastic constant for the γ matrix, r is the average precipitate radius, and σ is the interfacial energy between γ and γ′ phases. For a precipitate with a purely dilatational misfit in Ni-based superalloy systems, as the precipitate size increases, the equilibrium shape of precipitates undergoes a gradual transition from a sphere (L = 0) to a four-fold symmetric cuboid (L = 2–4), and further, at a critical value of L (>5.6) bifurcates to a two-fold symmetric shape, like a platelet.40–43
For the studied alloys STD and Q, ε = −0.09% and −0.05% at RT in their as-aged conditions, average precipitate radii of 19.6 nm and 38.6 nm for alloys STD and Q, respectively, C44 = 100.5 GPa44 and σ = 0.02 J m−245 (assuming they are the same for both alloys) are used to calculate the value of L. Therefore, L values of 0.08 and 0.05 are yielded for alloys STD and Q, respectively. Such small L values (close to 0) of alloys STD and Q in their as-aged conditions correspond to the spherical shape of γ′ precipitates, as shown in Fig. 2(a) and (c). After exposure to 800 °C for 5000 h, ε = −0.16% and −0.11% for alloys STD and Q, respectively, which were calculated based on APT phase chemistries in γ and γ′ phases along with Vegard's relation, and details can be seen in ref. 46, 47 After inserting average precipitate sizes of 144.5 nm (STD) and 149.3 nm (Q) into eqn (3), L values of 1.86 and 0.91 were obtained for alloys STD and Q, respectively, after exposure to 800 °C for 5000 h. For alloy STD, the calculated value of L to be 1.86 is in close agreement with the prediction of model for the four-fold symmetric cuboid, consistent with the experimental observation of cuboidal precipitates (Fig. 5(a)). For alloy Q, the yielded L value to be 0.91 also aligns with the observed spheroidal shape and the late onset of sphere-to-cube morphological transition (Fig. 5(b)), suggesting that interfacial energy is still dominated in favoring a four-fold symmetry. It should be noted that for alloys with negative lattice misfit at RT, it is expected that the magnitude of the misfit will increase (becoming more negative) at higher temperatures.48 The different L values of alloys STD and Q after being exposed to 800 °C for 5000 hours suggest that the distinct morphology evolutions of γ′ precipitates in these alloys primarily stem from differences in their lattice misfits. This discrepancy in lattice misfits is attributed to a notable compositional change in Mo in the matrix of alloy STD (approximately 1.5 at%), whereas there is minimal change in the composition of W and Mo in the matrix of alloy Q (Fig. 8). Therefore, it can be inferred that the partial substitution of W for Mo content can significantly improve the morphological resistance of γ′ precipitates to thermal exposure in H282.
4.2. Coarsening kinetics
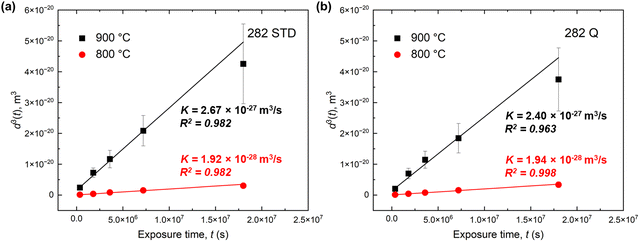
The coarsening kinetics and associated mechanisms of γ′ precipitates in Ni-based superalloys have been extensively studied.49–51 A classic theory to describe coarsening kinetics of γ′ precipitates is the LSW model, following the Ostwald ripening process, which can be expressed by the following power-law equation:| d3(t) − d3(t0) = K(t − t0) | (4) |
Fig. 13 plots the average precipitate size, (d3(t)), as a function of exposure time at 800 °C and 900 °C. Accordingly, the coarsening rates are determined from the slope values by linearly fitting to the experimental data using eqn (4). The measured data appear to be well fitted with the LSW model, giving the coarsening rate constants, K = 1.92 × 10⁻²⁸ m3 s−1 and K = 2.67 × 10⁻²⁷ m3 s−1 for alloy STD at 800 °C and 900 °C, respectively, and K = 1.94 × 10⁻²⁸ m3 s−1 and K = 2.40 × 10⁻²⁷ m3 s−1 for alloy Q at 800 °C and 900 °C, respectively. It is evident that the coarsening rate increases with exposure temperature for each alloy. At 800 °C, the coarsening rates are almost the same for both alloys. However, at 900 °C, the coarsening rate accelerates more rapidly in the STD alloy compared to alloy Q, suggesting the effective role of W addition in retarding the coarsening of γ′ precipitates at higher temperatures. It should be emphasized that the effectiveness of W addition in slowing down the coarsening of γ′ precipitates becomes more significant under creep stress, which has been demonstrated by the much smaller γ′ precipitate size in alloy Q than that in STD after 1000 h in creep at 259 MPa and 760 °C (Fig. 2).
In the diffusion-controlled coarsening mechanism, the diffusion species with the lowest mobility, in principle, govern the coarsening kinetics. Philippe and Voorhees (PV) extended the LSW model from the dilute binary systems to the multicomponent systems.52 Accordingly, the PV model describes the coarsening rate constant of γ′ precipitates as follows:52
 | (5) |
 , in which D0 is the pre-exponential factor and Q is the activation energy for diffusion of element i in the matrix. Inserting the Arrhenius equation into eqn (5), the activation energy for diffusion can be obtained from the fitted slope of ln(K·T) versus 1/T, assuming that Vm and equilibrium composition in γ and γ′ phases are temperature independent. Therefore, the element with the largest activation energy for diffusion is conducive to retard the coarsening process. In alloy STD, the controlling diffusing species should be Mo, considering its large diffusion activation energy (301.68 kJ mol−1).53 However, in alloy Q, W with the highest activation energy for diffusion (302.51 kJ mol−1) can be the controlling diffusing element,53 resulting in the enhanced coarsening resistance of γ′ precipitate.
4.3. Strengthening mechanisms
In γ′ precipitate strengthened Ni-based superalloys, the major strengthening mechanisms are solid-solution strengthening and precipitation strengthening.1,54 Solid-solution strengthening during exposure to service temperatures is mainly impacted by the alloying solutes in the γ matrix. The influence of alloying elements on the degree of solid-solution strengthening in the γ matrix (Δσγ) and γ′ precipitates (Δσγ′) can be expressed by the following equations:55,56 | (6) |
 | (7) |
 are the concentrations of element i in γ and γ′ phases, respectively. In alloy Q, the only noticeable change of alloying elements was observed for W in the γ phase from the APT results (∼0.25 at% decrease) after exposure to 800 °C for 5000 h. After employing the W strengthening constant of 977 MPa per atomic fraction1/2,55,56 the decrease in solid-solution strengthening is only about 49 MPa in alloy Q even following 5000 h exposure at 800 °C. Moreover, unlike in alloy STD in which Mo becomes part of TCP phase formation, a small amount of W in Q segregates to the γ′ phase from the γ matrix, as seen from the APT results shown in Fig. 8(e). This partitioning behavior can lead to an a slight increase in solid-solution strengthening within the γ′ phase, as the strengthening constants for W in Ni3Al are 25 MPa per at% compared to Mo's 16.8 MPa per at%.57 In alloy STD, the major variation of alloying element is the decrease of Mo in the γ matrix (up to 1.5 at% decrease) after exposure for 100 h to 5000 h. Such a significant decrease in Mo content in the γ matrix can lead to a matrix strength decrease of ∼124 MPa, after considering Mo's strengthening constant of ∼1015 MPa per atomic fraction1/2.55,56 This loss of solid-solution strengthening is directly related to the poor phase stability of alloy STD. As the TCP phases form over time, they deplete Mo from the γ matrix. As evident in the Fig. 11(a), the dislocations in the crept alloy STD interrupted at 1000 h at 760 °C undergo a sharp prefoliation in multiple slip planes due to the reduction of solid-solution strengthening, which facilitates easier dislocation glide in the matrix, and interact with each other into local dislocation pileups at γ/γ′ interface, leading to the formation of dislocation tangles surrounding the γ′. On the other hand, the superior phase stability in alloy Q preserves the refractory elements in solution and prevents a significant decrease in solid-solution strengthening over time. As such, dislocations with very low density induce less complex dislocation reactions and postpone the onset of “tertiary creep” stage (Fig. 11(c)).
In addition to solid-solution strengthening, precipitation strengthening is the primary strengthening mechanism in Ni-based superalloys, which can be divided into two categories, particle shearing or Orowan dislocation bypass mechanism.54
In Ni-based superalloys, the precipitate shearing mechanism, is controlled by anti-phase-boundary-coupled dislocation pairs, i.e., pairwise cutting mechanism.1,58,59 For small particles, dislocation pairs cutting through particles are usually weakly coupled, resulting in the ordering strength increment (ΔσOS) by the following equation:1,60
 | (8) |
 | (9) |
When the precipitates are sufficiently large or incoherent within the matrix, the Orowan dislocation bypass mechanism governs the strength increment, which can be calculated by the following equation:60
 | (10) |
 is the average precipitate diameter on the slip planes,66 and
  is the average edge-to-edge interparticle spacing.67
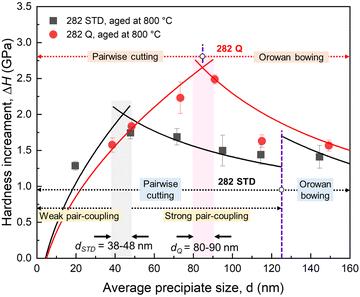
The calculated strengthening contributions from the pairwise cutting mechanism or the Orowan bowing mechanism (involving the loss of solid-solution strengthening effect) are compared with the measured hardness increments (ΔH) via the conversion by ΔH = αΔσ (α = 3 is the Tabor factor). Fig. 14 plots the measured and calculated hardness increments resulting from precipitation strengthening as a function of the average precipitate size (d) in alloys STD and Q during exposure to 800 °C. With a precipitate size of ∼50 nm (exposure duration of 100 hours), the hardness increment for alloy Q with alloying W is slightly higher than that in alloy STD. As the high-temperature exposure progresses, the hardness increment for alloy STD becomes less pronounced, while alloy Q, with W substitution, maintains a robust hardness increment. As a result, an optimal hardness increment can be achieved when alloy is exposed up to 1000 hours with a precipitate size of 80–90 nm, twice that in alloy STD (38–48 nm). According to the calculated hardness increments, the pairwise cutting mechanism by forming weakly and strongly coupling pairs can be the dominant strengthening mechanism in alloy STD when the particle size is smaller than ∼125 nm. When the precipitate size is larger than ∼125 nm, Orowan bowing becomes the controlled strengthening mechanism. In alloy Q, the pairwise cutting mechanism at a small particle size (<∼85 nm) and the Orowan bowing mechanism at a large particle size (>∼85 nm) are the governing mechanisms. Based on these, the lower hardness increment in alloy STD can be attributed to the less pronounced precipitation strengthening effect and the loss of solid-solution strengthening due to the gradual depletion of strengthening element Mo in γ matrix. In contrast, the robust hardness increment in alloy Q is due to the significant precipitation strengthening effect and the negligible loss of solid-solution strengthening because of the enhanced compositional stability of γ/γ′ by W substitution.
Note that the dominance of particle shearing at small particle sizes (<∼85 nm for alloy Q and <∼125 nm for alloy STD) is found in the hardness measurement at RT. However, during creep tests, particle shearing was not observed for the precipitates ranging from a few tens to one hundred nanometer regimes for both alloys (Fig. 11 and 12). Instead, dislocation bowing and its interaction with precipitates following Orowan bypass mechanism appears to be the major cause of the precipitate strengthening throughout the entire creep lifetime. This finding is consistent with previous reports that the deformation mode gradually transits from precipitate shearing at low temperatures to Orowan looping at high temperatures in various Ni-based superalloys, including H282.58,59,68 At high temperatures, precipitate coarsening negatively affects the γ/γ′ interface coherency leading to the change in deformation behavior aforementioned. The superior creep performance of alloy Q compared to alloy STD can be partly attributed to the presence of W, which did not contribute as strongly as Mo to TCP phase formation, providing (i) more stable solid-solution strengthening of the γ/γ′ microstructure, and (ii) slower diffusion kinetics in the γ matrix. As discussed in the section on solid-solution strengthening, the preservation of W in the matrix (in contrast to Mo in the matrix of STD) contributes to a more stable solid-solution strengthening of the matrix, rendering dislocation slip more challenging, as indicated by fewer observed dislocations in alloy Q during creep (Fig. 11 and 12). The high concentration of W in the γ′ phase, which increases with thermal exposure times also strengthens the precipitates, increasing resistance to dislocation shearing and leading to Orowan bowing as the rate-controlling deformation mechanism. This phenomenon also elucidates why a larger optimal precipitate size is observed in alloy Q compared to alloy STD. Finally, the stable W content in the matrix of Q maintains slow diffusion kinetics, which can reduce vacancy-mediated dislocation processes. In contrast, the depletion of Mo from STD during thermal exposure can increase diffusion kinetics while reducing the matrix strength, making dislocation slip more facile. These contribute to alloy Q's superior resistance to creep deformation compared to alloy STD.
5. Conclusion
In this study, variants to H282 alloy were designed by varying the concentration of γ′ formers and/or partially substituting W for Mo. The effects of variations in γ′ formers and refractory elements on creep resistance, phase stability, and coarsening kinetics were systematically investigated. Several key conclusions are found and summarized as follows.1. The increase of Ti and partial substitution of W for Mo in alloy Q resulted in a significant improvement of creep resistance, up to 130% increase in creep life, compared to the baseline alloy STD.
2. Orowan looping and dislocation climb were found to be the dominant creep deformation mechanism in alloy Q and STD, while extensive dislocation tangling was also observed in alloy STD.
3. Long-term phase stability investigations on alloys Q and STD were carried out at 800 °C and 900 °C (up to 5000 h), revealing the enhanced thermal stability in alloy Q from the reduced formation of detrimental TCP phases. The extensive formation of TCP phases in alloy STD led to a decrease in Mo content in the γ matrix and thus decreased amount of solid-solution strengthening and faster diffusion kinetics.
4. The investigation of coarsening kinetics of γ′ precipitates in both alloys established that the coarsening constant rate of γ′ precipitates was retarded by the partial substitution of W for Mo, which is particularly remarkable under creep stress.
5. The theoretical strengthening calculations found that the less pronounced loss of solid-solution strengthening and the significant precipitation strengthening with a larger optimal strengthening particle size due to the substitution of W for Mo, compared to alloy STD, further explain the origin of enhanced creep resistance in Q alloy. The addition of W and its preservation in the matrix during thermal exposure also served to improve creep resistance in Q alloy via maintaining slow diffusion kinetics and retarding dislocation climb.
Disclaimer
This project was funded by the United States Department of Energy, National Energy Technology Laboratory, in part, through a site support contract. Neither the United States Government nor any agency thereof, nor any of their employees, nor the support contractor, nor any of their employees, makes any warranty, express or implied, or assumes any legal liability or responsibility for the accuracy, completeness, or usefulness of any information, apparatus, product, or process disclosed, or represents that its use would not infringe privately owned rights. Reference herein to any specific commercial product, process, or service by trade name, trademark, manufacturer, or otherwise does not necessarily constitute or imply its endorsement, recommendation, or favoring by the United States Government or any agency thereof. The views and opinions of authors expressed herein do not necessarily state or reflect those of the United States Government or any agency thereof.Data availability statement
All relevant data that support the study are reported in the paper.Conflicts of interest
The authors declare the following competing interests: authors M. Detrois and P. D. Jablonski are inventors on U.S. Patent Application 18/194,447 assigned unto the United States Government on some of the alloy compositions presented and heat treatment. The present manuscript, however, describes the research and fundamental aspects related to microstructure – thermomechanical processing – mechanical property relationships.Acknowledgements
This work was performed in support of the US Department of Energy's Fossil Energy and Carbon Management Office's Advanced Energy Materials Research Program and executed through the National Energy Technology Laboratory Research & Innovation Center (Advanced Energy Materials MYRP-1025034). The authors would like to thank E. R. Argetsinger and J. A. Mendenhall for assistance in melting, C. D. Powell for mechanical testing, R. E. Chinn and C. McKaig for chemistry analysis. APT was conducted at Oak Ridge National Laboratory's (ORNL) Center for Nanophase Materials Sciences (CNMS), which is a U.S. DOE Office of Science User Facility. The authors would like to thank J. Burns for performing APT sample preparation and running the APT experiments. A portion of this research used resources at Spallation Neutron Source (SNS), a U.S. Department of Energy (DOE) Office of Science User Facility operated by the ORNL. The authors would like to thank Dr D. Yu for his help in neutron diffraction experiments.References
- R. C. Reed, The superalloys: fundamentals and applications, Cambridge University Press, 2008 Search PubMed.
- L. M. Pike, Asme, HAYNES (R) 282 (TM) alloy – A new wrought superalloy designed for improved creep strength and fabricability, Proceedings of the ASME Turbo Expo 2006, vol. 4, 2006, pp. 1031–1039.
- L. M. Pike, Development of a fabricable gamma-prime (gamma′) strengthened superalloy, Superalloys, 2008, 2008, 191–200 Search PubMed.
- Y. Amouyal, Z. Mao and D. N. Seidman, Effects of tantalum on the partitioning of tungsten between the γ- and γ′-phases in nickel-based superalloys: Linking experimental and computational approaches, Acta Mater., 2010, 58(18), 5898–5911 CrossRef.
- L. Pike, Long term thermal exposure of Haynes 282 alloy, Superalloy, 2010, 718, 644–660 Search PubMed.
- J. A. Hawk, T.-L. Cheng, J. S. Sears, P. D. Jablonski and Y.-H. Wen, Gamma prime stability in Haynes 282: Theoretical and experimental considerations, J. Mater. Eng. Perform., 2015, 24(11), 4171–4181 CrossRef.
- M. C. Hardy, M. Detrois, E. T. McDevitt, C. Argyrakis, V. Saraf, P. D. Jablonski, J. A. Hawk, R. C. Buckingham, H. S. Kitaguchi and S. Tin, Solving recent challenges for wrought Ni-base superalloys, Metall. Mater. Trans. A, 2020, 51(6), 2626–2650 CrossRef.
- F. Lu, S. Antonov, S. Lu, J. Zhang, L. Li, D. Wang, J. Zhang and Q. Feng, Unveiling the Re effect on long-term coarsening behaviors of γ′ precipitates in Ni-based single crystal superalloys, Acta Mater., 2022, 233, 117979 CrossRef.
- M. Detrois, P. D. Jablonski, S. Antonov, S. Li, Y. Ren, S. Tin and J. A. Hawk, Design and thermomechanical properties of a γ′ precipitate-strengthened Ni-based superalloy with high entropy γ matrix, J. Alloys Compd., 2019, 792, 550–560 CrossRef CAS.
- R. A. Swalin, A. Martin and R. Olson, Diffusion of magnesium, silicon, and molybdenum in nickel, JOM, 1957, 9(7), 936–939 CrossRef CAS.
- Z. Pei, S. Zhao, M. Detrois, P. D. Jablonski, J. A. Hawk, D. E. Alman, M. Asta, A. M. Minor and M. C. Gao, Theory-guided design of high-entropy alloys with enhanced strength-ductility synergy, Nat. Commun., 2023, 14, 2519 CrossRef CAS PubMed.
- G. Liu, L. Kong, X. Xiao and S. Birosca, Microstructure evolution and phase transformation in a nickel-based superalloy with varying Ti/Al ratios: Part 1 - Microstructure evolution, Mater. Sci. Eng., A, 2022, 831, 142228 CrossRef CAS.
- A. Jena and M. Chaturvedi, The role of alloying elements in the design of nickel-base superalloys, J. Mater. Sci., 1984, 19, 3121–3139 CrossRef CAS.
- E. Fleischmann, M. K. Miller, E. Affeldt and U. Glatzel, Quantitative experimental determination of the solid solution hardening potential of rhenium, tungsten and molybdenum in single-crystal nickel-based superalloys, Acta Mater., 2015, 87, 350–356 CrossRef CAS.
- C. Ai, Q. Li, J. Zhang, H. Su, W. Yang, L. Liu, Y. Ru, H. Zhang, Y. Song, Y. Chen, S. Li and S. Gong, Effect of substituting Mo for W on γ/γ′ partitioning behaviors of alloying elements in heat-treated second generation Ni based single crystal superalloys: An atom probe tomography study, Intermetallics, 2021, 134, 107198 CrossRef CAS.
- A. Wadowski, J. S. Wróbel, M. Koralnik and R. Sitek, Effect of the Addition of Re on the Microstructure and Phase Composition of Haynes 282: Ab Initio Modelling and Experimental Investigation of Additively Manufactured Specimens, Materials, 2023, 16(12), 4419 CrossRef CAS.
- P. J. Fink, J. L. Miller and D. G. Konitzer, Rhenium reduction—alloy design using an economically strategic element, JOM, 2010, 62(1), 55–57 CrossRef.
- C. K. Sudbrack, T. D. Ziebell, R. D. Noebe and D. N. Seidman, Effects of a tungsten addition on the morphological evolution, spatial correlations and temporal evolution of a model Ni–Al–Cr superalloy, Acta Mater., 2008, 56(3), 448–463 CrossRef.
- P. D. Jablonski and J. A. Hawk, Homogenizing advanced alloys: Thermodynamic and kinetic simulations followed by experimental results, J. Mater. Eng. Perform., 2017, 26(1), 4–13 CrossRef.
- E. Underwood, The mathematical foundations of quantitative stereology, Stereology and quantitative metallography, ASTM International, 1972, PA 19428-2959 DOI:10.1520/STP36841S.
- X. L. Wang, T. M. Holden, G. Q. Rennich, A. D. Stoica, P. K. Liaw, H. Choo and C. R. Hubbard, VULCAN—The engineering diffractometer at the SNS, Phys. B, 2006, 385–386(Part 1), 673–675 CrossRef.
- K. An, Y. Chen and A. D. Stoica, VULCAN: A “hammer” for high-temperature materials research, MRS Bull., 2019, 44(11), 878–885 CrossRef.
- M. Miller and K. Russell, Performance of a local electrode atom probe, Surf. Interface Anal., 2007, 39(2–3), 262–267 CrossRef.
- K. Thompson, D. Lawrence, D. J. Larson, J. D. Olson, T. F. Kelly and B. Gorman, In situ site-specific specimen preparation for atom probe tomography, Ultramicroscopy, 2007, 107(2), 131–139 CrossRef PubMed.
- A. International, Standard test methods for conducting creep, creep-rupture, and stress-rupture tests of metallic materials, ASTM e139–11.
- J. Belan, GCP and TCP phases presented in Nickel-base superalloys, Mater. Today: Proc., 2016, 3(4), 936–941 Search PubMed.
- D. J. Sauza, P. J. Bocchini, D. C. Dunand and D. N. Seidman, Influence of ruthenium on microstructural evolution in a model CoAlW superalloy, Acta Mater., 2016, 117, 135–145 CrossRef.
- M. Hillert, On the theory of normal and abnormal grain growth, Acta Metall., 1965, 13(3), 227–238 CrossRef.
- I. M. Lifshitz and V. V. Slyozov, The kinetics of precipitation from supersaturated solid solutions, J. Phys. Chem. Solids, 1961, 19(1), 35–50 CrossRef.
- C. Wagner, Theorie der Alterung von Niederschlägen durch Umlösen (Ostwald-Reifung), Zeitschrift für Elektrochemie, Ber. Bunsenges. Phys. Chem., 1961, 65(7–8), 581–591 CrossRef.
- C. K. L. Davies, P. Nash and R. N. Stevens, The effect of volume fraction of precipitate on Östwald ripening, Acta Metall., 1980, 28(2), 179–189 CrossRef.
- Y. Y. Zhao, H. W. Chen, Z. P. Lu and T. G. Nieh, Thermal stability and coarsening of coherent particles in a precipitation-hardened (NiCoFeCr)94Ti2Al4 high-entropy alloy, Acta Mater., 2018, 147, 184–194 CrossRef.
- D. Isheim, G. Hsieh, R. D. Noebe and D. N. Seidman, Nanostructural temporal evolution and solute partitioning in model Ni-based superalloys containing ruthenium, rhenium and tungsten, Solid-Solid Phase Trans, Inorg. Mater., 2005, 2005(2), 309–314 Search PubMed.
- B. A. Pint, H. Wang, C. S. Hawkins and K. A. Unocic, Technical Qualification of New Materials for High Efficiency Coal-Fired Boilers and Other Advanced FE Concepts: Haynes® 282® ASME Boiler and Pressure Vessel Code Case, Oak Ridge National Lab.(ORNL), Oak Ridge, TN (United States), 2020 Search PubMed.
- C. Carry and J. L. Strudel, Apparent and effective creep parameters in single crystals of a nickel base superalloy—II. Secondary creep, Acta Metall., 1978, 26(5), 859–870 CrossRef.
- T. M. Pollock and A. S. Argon, Creep resistance of CMSX-3 nickel base superalloy single crystals, Acta Metall. Mater., 1992, 40(1), 1–30 CrossRef.
- J. D. Eshelby, The determination of the elastic field of an ellipsoidal inclusion, and related problems, Proc. R. Soc. A, 1957, 376–396 Search PubMed.
- A. G. Khachaturyan, Theory of structural transformations in solids, Courier Corporation, 2013 Search PubMed.
- R. Feng, M. C. Gao, C. Zhang, W. Guo, J. D. Poplawsky, F. Zhang, J. A. Hawk, J. C. Neuefeind, Y. Ren and P. K. Liaw, Phase stability and transformation in a light-weight high-entropy alloy, Acta Mater., 2018, 146, 280–293 CrossRef.
- M. E. Thompson, C. S. Su and P. W. Voorhees, The equilibrium shape of a misfitting precipitate, Acta Metall. Mater., 1994, 42(6), 2107–2122 CrossRef.
- P. Fratzl, O. Penrose and J. L. Lebowitz, Modeling of phase separation in alloys with coherent elastic misfit, J. Stat. Phys., 1999, 95, 1429–1503 CrossRef.
- P. W. Voorhees, G. B. McFadden and W. C. Johnson, On the morphological development of second-phase particles in elastically-stressed solids, Acta Metall. Mater., 1992, 40(11), 2979–2992 CrossRef.
- E. A. Marquis and D. N. Seidman, Nanoscale structural evolution of Al3Sc precipitates in Al(Sc) alloys, Acta Mater., 2001, 49(11), 1909–1919 CrossRef.
- I. Nandi, N. Ahmad, N. Shamsaei and S. Shao, Revealing texture induced abnormal tensile deformation behavior in additively manufactured Haynes 282 using crystal plasticity simulations, 2022 International Solid Freeform Fabrication Symposium, 2022.
- M. G. Fahrmann and D. A. Metzler, Simulation of γ′ precipitation kinetics in a commercial Ni-base superalloy, JOM, 2016, 68(11), 2786–2792 CrossRef.
- S. Antonov, E. Sun and S. Tin, Synchrotron in-situ aging study and correlations to the γ′ phase instabilities in a high-refractory content γ-γ′ Ni-base superalloy, Metall. Mater. Trans. A, 2018, 49(9), 3885–3895 CrossRef.
- Y. Mishima, S. Ochiai and T. Suzuki, Lattice parameters of Ni(γ), Ni3Al(γ′) and Ni3Ga(γ′) solid solutions with additions of transition and B-subgroup elements, Acta Metall., 1985, 33(6), 1161–1169 CrossRef.
- H. Mughrabi, The importance of sign and magnitude of γ/γ′ lattice misfit in superalloys—with special reference to the new γ′-hardened cobalt-base superalloys, Acta Mater., 2014, 81, 21–29 CrossRef.
- C. K. Sudbrack, K. E. Yoon, R. D. Noebe and D. N. Seidman, Temporal evolution of the nanostructure and phase compositions in a model Ni–Al–Cr alloy, Acta Mater., 2006, 54(12), 3199–3210 CrossRef.
- J. Tiley, G. B. Viswanathan, R. Srinivasan, R. Banerjee, D. M. Dimiduk and H. L. Fraser, Coarsening kinetics of γ′ precipitates in the commercial nickel base Superalloy René 88 DT, Acta Mater., 2009, 57(8), 2538–2549 CrossRef.
- X. Li, N. Saunders and A. P. Miodownik, The coarsening kinetics of γ′ particles in nickel-based alloys, Metall. Mater. Trans. A, 2002, 33(11), 3367–3373 CrossRef.
- T. Philippe and P. W. Voorhees, Ostwald ripening in multicomponent alloys, Acta Mater., 2013, 61(11), 4237–4244 CrossRef.
- Q. Wu, S.-S. Li, Y. Ma and S.-K. Gong, First principles calculations of alloying element diffusion coefficients in Ni using the five-frequency model, Chin. Phys. B, 2012, 21(10), 109102 CrossRef.
- G. E. Dieter and D. J. Bacon, Mechanical metallurgy, McGraw-hill, New York, 1986 Search PubMed.
- Y. Mishima, S. Ochiai, N. Hamao, M. Yodogawa and T. Suzuki, Solid solution hardening of nickel – Role of transition metal and b-subgroup solutes, Trans. Jpn. Inst. Met., 1986, 27(9), 656–664 CrossRef.
- H. A. Roth, C. L. Davis and R. C. Thomson, Modeling solid solution strengthening in nickel alloys, Metall. Mater. Trans. A, 1997, 28(6), 1329–1335 CrossRef.
- S. Antonov, M. Detrois, D. Isheim, D. Seidman, R. C. Helmink, R. L. Goetz, E. Sun and S. Tin, Comparison of thermodynamic database models and APT data for strength modeling in high Nb content γ–γ′ Ni-base superalloys, Mater. Des., 2015, 86, 649–655 CrossRef.
- B. Reppich, Some new aspects concerning particle hardening mechanisms in γ′ precipitating Ni-base alloys—I. Theoretical concept, Acta Metall., 1982, 30(1), 87–94 CrossRef.
- B. Reppich, P. Schepp and G. Wehner, Some new aspects concerning particle hardening mechanisms in γ′ precipitating nickel-base alloys—II. Experiments, Acta Metall., 1982, 30(1), 95–104 CrossRef.
- A. Kelly and R. Nicholson, Strengthening methods in crystals, 1971 Search PubMed.
- C. Joseph, C. Persson and M. Hörnqvist Colliander, Influence of heat treatment on the microstructure and tensile properties of Ni-base superalloy Haynes 282, Mater. Sci. Eng., A, 2017, 679, 520–530 CrossRef.
- E. Chen, A. Tamm, T. Wang, M. E. Epler, M. Asta and T. Frolov, Modeling antiphase boundary energies of Ni3Al-based alloys using automated density functional theory and machine learning, npj Comput. Mater., 2022, 8(1), 80 CrossRef.
- A. B. Kamara, A. J. Ardell and C. N. J. Wagner, Lattice misfits in four binary Ni-Base γ/γ1 alloys at ambient and elevated temperatures, Metall. Mater. Trans. A, 1996, 27(10), 2888–2896 CrossRef.
- W. Hüther and B. Reppich, Interaction of dislocations with coherent, stress-free, ordered particles, Int. J. Mater. Res., 1978, 69(10), 628–634 CrossRef.
- K. Kruger, HAYNES 282 alloy, Materials for ultra-supercritical and advanced ultra-supercritical power plants, Elsevier, 2017, pp. 511–545 Search PubMed.
- P. Hirsch and F. Humphreys, Physics of strength and plasticity, MIT Press, Cambridge, 1969 Search PubMed.
- L. Brown and R. Ham, Strengthening methods in crystals, Appl. Sci., 1971, 9, 10–135 Search PubMed.
- P. Zhang, Y. Yuan, H. Yin, Y. Gu, J. Wang, M. Yang, G. Yang and X. Song, Tensile Properties and Deformation Mechanisms of Haynes 282 at Various Temperatures, Metall. Mater. Trans. A, 2018, 49(5), 1571–1578 CrossRef.
Footnotes |
| † This manuscript has been authored by UT-Battelle, LLC under contract no. DE-AC05-00OR22725 with the U.S. Department of Energy. The United States Government retains and the publisher, by accepting the article for publication, acknowledges that the United States Government retains a non-exclusive, paid-up, irrevocable, worldwide license to publish or reproduce the published form of this manuscript, or allow others to do so, for United States Government purposes. The Department of Energy will provide public access to these results of federally sponsored research in accordance with the DOE Public Access Plan (https://energy.gov/downloads/doe-public-access-plan). |
| ‡ Electronic supplementary information (ESI) available. See DOI: https://doi.org/10.1039/d4ma00334a |
| This journal is © The Royal Society of Chemistry 2024 |

