 Open Access Article
Novel biopolymer pectin-based hydrogel electrolytes for sustainable energy storage†
Nathan W.
Wilson
 and
Gerardine G.
Botte
 *
*
Institute for Sustainability and Circular Economy, Chemical Engineering Department, Texas Tech University, Lubbock, Texas, USA. E-mail: gerri.botte@ttu.edu
First published on 22nd August 2024
Abstract
Low degree of esterification (DE) pectin, a biopolymer found in plant waste, has been extracted from tomato pomace and soybean hull and compared to a commercially available citrus variety. Raising the pH during extraction increased pectin yield by 23% for soy and 116% for tomato sources while decreasing the DE. A hydrogel forms upon mixing with low concentrations of aqueous CaCl2, while monovalent salts were also added to improve results. Physical characteristics were investigated by X-ray diffraction (XRD), scanning electron microscopy (SEM), and thermogravimetric analysis (TGA). Electrochemical stability windows of 1.6–2.0 V are shown via linear sweep and cyclic voltammetry (CV), while transference numbers of 0.73–0.96 were measured by Wagner's DC Polarization method. The effect of salt concentration on ionic conductivity was determined and the highest conductive hydrogels showed values at room temperature of 1–250 mS cm−1 from electrochemical impedance spectroscopy (EIS), which is directly compared and on the same order of magnitude as the corresponding aqueous electrolytes. Each source of pectin performed similarly, while the change in salt had a much more prominent impact. CaCl2 was only incorporated in small amounts for its ability to structurally impact the polymer matrix, while monovalents salts at high concentration provided orders of magnitude better conductivity and ion mobility. Application of the best performing hydrogel in a coin cell supercapacitor was evaluated by EIS, galvanostatic charge–discharge cycling, and CVs, showing minimal specific capacitance loss over a long cycling period (5000 cycles). This work highlights the properties of novel biopolymer hydrogel electrolytes that deserve more investigation with the growing importance of sustainable energy storage mechanisms.
Introduction
The development of polymer electrolytes for energy storage devices has grown in popularity recently with applications in renewable energy, flexible or wearable electronics, and even biomedical devices.1 While polymer–salt complexes have often been investigated in solid state studies over the past 25 plus years, other polymer electrolyte classifications have emerged, such as composite, plasticized, and gel polymer electrolytes. Composite and plasticized polymer electrolytes are made by the incorporation respectively of either low molecular weight polymers to increase the amorphous nature of the host polymer matrix, or the addition of ceramic (inert inorganic filler) materials to raise the overall dielectric constant.2 Gel polymer electrolytes (GPEs) are made up of a polymer matrix scaffolding that supports an aqueous electrolyte, and can serve as both electrolyte and electrode separator in an electrochemical cell.Liquid electrolytes have been well-used for decades because of their typically high conductivities (10−1–10−3 S cm−1), but often pose significant safety hazards.3 Punctures can lead to leakage (often of toxic materials into the environment) and combustion of organic electrolytes can be caused by dendrite growth between electrodes leading the cell to short-circuit. While solid electrolytes (often thin solid state polymer membranes) can combat these safety concerns, they are limited by much lower ionic conductivities (10−5–10−8 S cm−1) and less ideal contact with electrodes.1,3 Polymer gel electrolytes incorporate the benefits of high conductivity with a structure that can prohibit dendrite growth and leakage. Hydrogel polymer electrolytes (which are loosely defined) can be created as a subset of GPE when the polymer network forms channels that retain a significant amount of water-based liquid electrolyte.
Polymer choice for use in gel electrolytes can be split into synthetic and natural polymer categories. Synthetic polymers have been extensively studied and implemented in hydrogel electrolytes due to their tunable properties and mechanical strength.4 Growing environmental concerns have prompted recent research into alternative biopolymers that are eco-friendly, renewable, and biodegradable.1 Some of the most common biopolymers investigated are agarose, alginate, cellulose, chitosan, and gelatin.5 Still relatively unexplored for GPE integration, pectin refers to a group of biopolymer polysaccharides comprised of a linear chain of poly(α-1,4-galacturonic acids) with –OH, –COOH, and –COOCH3 in varied amounts and locations along the molecular backbone. It can be found primarily in the plant cell wall, is abundant within citrus rinds (the main source of commercial pectins), and is also found in other fruits and vegetables such as tomato pomace (primarily the seeds and skins) and soybean hull.6,7
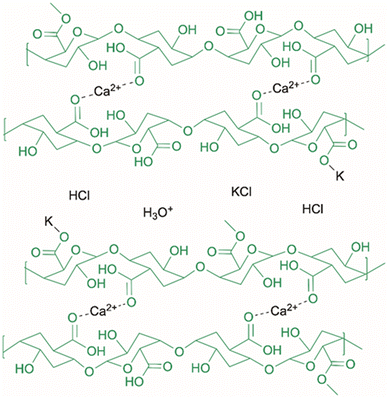
A proposed configuration and ion transport mechanism for the integration of pectin into a specific hydrogel electrolyte is shown in Fig. 1. Pectin with a low number of methyl esterified carboxyl functional groups can make use of the gelation mechanism known as “egg-box model” binding of adjacent polymer chains through strong and specific Ca2+ binding at very low concentration. Ion transport in low water content gels can be increased through the segmental movement of ions along the amorphous polymer chain.8 This hydrogel mechanism instead suggests the preferential binding of a monovalent cation to the polymer chains allowing for proton transport primarily though the aqueous electrolyte channels. A considerable issue of the food industry is the accumulation and disposal of food processing waste, including the 4–17 million tonnes of tomato pomace,9 5 million tonnes of citrus waste,10 and 18–20 million tonnes of soybean hull11 that are produced annually. This provides a promising opportunity for the valorisation of and integration into biopolymer electrolytes. Moreover, sustainable electrolytes implementing food waste also offer the potential to minimize carbon emissions when compared to synthetic polymer electrolytes. Life cycle analysis has shown a reduction of around 80% of equivalent CO2 emissions in the production of specific biopolymers as opposed to petroleum-based plastics.12 With the battery market expected to grow to 279.7 billion USD by 2027,13 the need for polymer-based electrolytes or synthetic separators will significantly grow. This could on the other hand be substituted by sustainable gel electrolytes, supporting both a carbon and polymer circular economy. With the annual global emissions of CO2 for cement production and combustion of fossil fuels reaching above 36 gigatons,14 CO2 reduction by electrochemical methods will also play a prominent role in greenhouse gas alleviation. Often relying on polymer electrolyte membranes (PEMs), CO2 reduction proves an attractive application not only to Earth's atmosphere. The in situ resource utilization process of transforming the Martian atmosphere (typically 95% CO2)15 into value-added chemicals, such as fuels for a return journey, is one of the best ways of improving the economic feasibility of inter-planetary human exploration. Food waste from tomato and soy sources are highlighted in this work as both understudied sources of pectin as well as plants of interest for long-term space flights.16 From electric vehicles to space travel, in wearable electronics or implantable electrochemical applications, biopolymer hydrogel electrolytes remain a novel solution to many problems.
This paper investigates the extraction and implementation of biopolymer pectin from food waste into hydrogel electrolytes for energy storage applications. The primary focus is on the incorporation of different salts, as it is expected that pectins from different sources but with similar characteristics will be comparable. The incorporation of different salts into the pectin structure is expected to have a significant impact on the ion conductivity mechanism in the electrolyte. Hydrogels that rely on a biopolymer matrix and others have been compared in Fig. 2 as shown in publications over a ten-year timeframe. After the Nobel Prize in Chemistry was awarded in 2000, which highlighted the hitherto unappreciated conductivity possibilities in polymers,17 there has been significant growth in the field of hydrogel polymers and especially in the last 12 years. Not only does the plotted data set a standard of conductivity for competitive electrolytes to achieve, but it also compares various biopolymer source material. The various sources tend to agglomerate around the 1–10 mS cm−1 region, which is representative of the bulk of high performing hydrogels of this type. A handful of other hydrogels have reported outliers such as one made recently with synthetic poly(3,4-ethylenedioxythiophene):poly(styrenesulfonate), abbreviated as PEDOT:PSS, that reach up to 47.4 mS cm−1 and involve transition from an ionic liquid form to a hydrogel by water exchange.18 Most other high-performing formulations require concentrated corrosive and dangerous chemicals, such as 8 M potassium hydroxide and PAA gels that can exhibit up to the order of 1 S cm−1 as shown by King and Botte.19
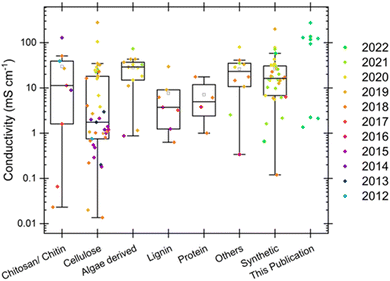 | ||
| Fig. 2 Ionic conductivity values compiled from several reviews,1,20,21 each stemming from original research papers on hydrogels made from different natural sources and some synthetic sources, all compared with values of ionic conductivity taken at room temperature for each of the three types of electrolyte and each of the three pectin sources shown in this publication. The publication date of each original paper is shown in the color scale of the points. The boxes represent the interquartile ranges, whiskers represent the total ranges, middle line in each box represents the median of each group, and the much smaller black boxes represent the means of each group as calculated by OriginPro. | ||
Beyond the valorisation of biopolymers from traditional waste streams, this paper also includes a method of pectin precipitation in an alkaline environment that is rarely ever incorporated in pectin extraction processes, and has not been adequately investigated. It is common practice to include small variations of pH from what is typically an acidic aqueous environment, but these changes are often on the range of two orders of magnitude less acidic. This study decreased the acidity of the precipitating solution by 9 orders of magnitude and noted the effect of the process on the functional properties of the increased pectin yields. Base properties of ionic conductivity and transport, electrochemical and thermal stability, mechanical durability, and chemical bonding, as well as proof-of-concept in an energy storage application are all elucidated further to build a picture of a sustainable future to come.
Materials and methods
All weights were measured on a Mettler Toledo MS104TS/00 analytical balance with an accuracy of ±0.0001 g. Dried tomato pomace (donated by Mesa Verde Trading Co.) and soy hull pellets (Mushroom Media Online 100% Soy Hull Pellets) were utilized as pectin source material. Hydrochloric acid (99.5%, Fisher Scientific), isopropanol (99.9%, Fisher Scientific), and NaOH (pellets, 97%, Fisher Scientific) were all used as part of the pectin extraction and precipitation process. CaCl2 (pellets, Spectrum Chemical CAS 10043-52-4), NaCl (crystalline, 99.0%, Fischer Scientific CAS 7647-14-5), and KCl (crystals, 99.0%, Fischer Scientific CAS 7447-40-7) were all used as dopant salts for the hydrogels. Nickel sheets (99.5% metals basis, Thermo Scientific Chemicals) were used as electrodes in some electrochemical testing. Low-methoxylated pectin (Modernist Pantry, LLC) and high methoxylated pectin (Spectrum Chemical, Fischer Scientific) were used as commercial comparisons for the in-house extracted biopolymer pectins. Finally, nickel foil (0.01 mm thick, MSE supplies) was utilized for coin cell electrode fabrication.Pectin extraction and purification
A method of pectin extraction from dried tomato pomace and soy hull pellets was adapted from previous work by Wilson and Botte.22 Biomass from each of these sources was finely ground (Avnicud spice grinder), sieved (No. 100 U.S.A. Standard mesh sieve, Cole Parmer), and mixed with 0.1 M hydrochloric acid at a ratio of 1![[thin space (1/6-em)]](https://www.rsc.org/images/entities/char_2009.gif) :
:![[thin space (1/6-em)]](https://www.rsc.org/images/entities/char_2009.gif) 20 w/w% to extract the pectin. After separation by centrifugation at 4000 × g for 15 minutes in a Heraeus Multifuge X1R, the aqueous phase with dissolved biopolymer was subjected to mixing with isopropanol and a pH change facilitated by 0.2 M aqueous NaOH to encourage precipitation. The initial method involved increasing pH from around 1.7 to 3.65 (Orion Dual Star pH/ISE Meter, ThermoScientific), identified in literature to being in the ideal range for pectin precipitation. On further testing, increasing the pH to 11 made a significant increase in the precipitated pectin from both sources. After precipitation while stirred overnight (12–14 hours), the pectin was isolated through two iterations of centrifugation (at 4000 × g for 15 minutes) and washing with isopropanol (70% and 100%, respectively) followed by drying in an oven at 75 °C (Model 30 Lab Oven, Quincy Lab Inc.) overnight (12–14 hours). Data for yield of pectin extracted was calculated by measuring the total initial weight of the SBH or TP sample and the final weight of extracted pectin. A standard w/w% equation was used:
20 w/w% to extract the pectin. After separation by centrifugation at 4000 × g for 15 minutes in a Heraeus Multifuge X1R, the aqueous phase with dissolved biopolymer was subjected to mixing with isopropanol and a pH change facilitated by 0.2 M aqueous NaOH to encourage precipitation. The initial method involved increasing pH from around 1.7 to 3.65 (Orion Dual Star pH/ISE Meter, ThermoScientific), identified in literature to being in the ideal range for pectin precipitation. On further testing, increasing the pH to 11 made a significant increase in the precipitated pectin from both sources. After precipitation while stirred overnight (12–14 hours), the pectin was isolated through two iterations of centrifugation (at 4000 × g for 15 minutes) and washing with isopropanol (70% and 100%, respectively) followed by drying in an oven at 75 °C (Model 30 Lab Oven, Quincy Lab Inc.) overnight (12–14 hours). Data for yield of pectin extracted was calculated by measuring the total initial weight of the SBH or TP sample and the final weight of extracted pectin. A standard w/w% equation was used: | (1) |
Gel preparation
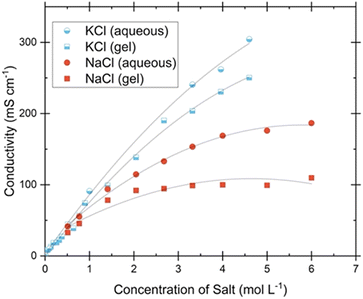
To prepare the biopolymer hydrogels, the proper salts were added to 10 mL of deionized water, and 1 g pectin from the proper source was dispersed in 5 mL of isopropanol. Every gel required some small amount (discussed further in the results section) of CaCl2 to form a stable pectin matrix, while some gels also incorporated either NaCl or KCl. Various amounts of salts were used for the preliminary tests (Fig. 3) in increasing increments ranging from 0 to 3.4280 g KCl and 0 to 3.5064 g NaCl. The final amounts of each salt used for all subsequent tests were as follows: 0.0140 g CaCl2, 2.9220 g NaCl, and 2.4770 g KCl. After stirring to appropriately dissolve the salts and disperse the pectin, both solutions were mixed and then heated above 50 °C while stirring until a homogenous gel formed. The gels were then poured (while still exhibiting some fluid properties) into a 3.5 mL polystyrene cuvette (Agilent Technologies) with 0.1 mm thick nickel sheet electrodes placed on opposing sides of the cuvette (this constitutes the two-electrode cell used for the electrochemical tests). The gel was allowed to cool down to room temperature (23 °C) before measurements were taken and then capped during storage to stop evaporation at the surface. To confirm the nature of the gel, each sample was inverted to assure that no flow occurred (refer to ESI† for more details).Physical characterization
Bonds and functional groups were analyzed with Fourier transform infrared spectroscopy (FTIR) using an Agilent Cary 630 FTIR Spectrometer over the range of 650–4000 cm−1 (each spectra comprised of 128 co-added scans at 4 cm−1 resolution). Crystallinity of the samples was measured with a Rigaku MiniFlex II powder diffractometer using CuKα radiation (λ = 1.5406) from 3° to 90°. Thermogravimetric analysis (TGA) was conducted with a Linseis high end Simultaneous Thermobalance STA PT 1600. In an alumina crucible, samples were weighed, then the chamber was flushed with nitrogen flowing at 50 sccm min−1. The temperature was increased from room temperature to 250 °C at 5° min−1. Crucibles were cleaned between runs with isopropanol and if necessary, by increasing the temperature gradually to 1000 °C in an air environment to burn off the residual carbon.Scanning electron microscopy (SEM) and (EDS) was performed on a Zeiss crossbeam 540 equipped with Oxford EDS system. Samples were frozen at −80 °C for 24 hours to maintain the polymer structure, then dried at −50 °C at near-vacuum pressure for 48 hours to remove moisture. A coating of about 4 nm thick Ir was applied before each polymer matrix was cut and imaged. Imaging was performed on citrus pectin gels of each salt type to determine the general structure and impact on addition of near-saturation levels of other monovalent salts. Rheological tests were performed on a Discovery HR20 Rheometer with a 25.0 mm stainless steel parallel plate geometry installed. Each test used a gap of 1000.0 μm between plates and the temperatures were held at 25 °C unless otherwise specified. Oscillation Amplitude (OA) tests were performed at a constant angular frequency of 10 rad s−1 and swept from an oscillation strain of 0.1–100%. Oscillation Frequency (OF) tests were performed over an angular frequency of 0.1–100 rad s−1 at a constant oscillation strain of 0.1%. Temperature ramp (TR) tests were conducted at a constant frequency of 10 rad s−1 and oscillation strain of 0.1% while the temperature was slowly increased from 25–100 °C over a period of about 15 minutes. Rheological tests were performed on soybean hull gels of each salt type to determine the basic viscoelastic characteristics of a pectin hydrogel and the impact of different salts on the structure.
Electrochemical characterization of the hydrogel
Electrochemical tests were performed with an Interface 1010E Potentiostat (Gamry Instruments). For electrochemical impedance spectroscopy (EIS) testing, a cell constant was experimentally calculated to incorporate the inherent resistances in the physical cell layout as well as the electric field pattern fringe effects of the blocking electrodes. The resistance (R) was measured for several standard aqueous solutions of 0.01, 0.1, and 1 M KCl with known conductivity (k) that allowed for the calculation of the cell constant (c, calculated from c = k × R).19,22 This allowed for calculation of gel conductivities in any given cell through measurements of the gel resistance. Resistance was obtained from the x-axis intercept measured on a Nyquist plot obtained over the frequency range of 100 kHz–0.2 Hz. Preliminary EIS tests shown in Fig. 3 were conducted on gels using commercially available pectin from citrus sources known as low-methoxylated pectin, which is designated as MP in any sample abbreviations. High-methoxylated pectin from citrus sources was used as a comparison in FTIR spectra. The temperature was regulated during EIS experiments using a Buchi heating bath, water, and a TG267 handheld FLIR Thermometer. For transference number measurements, a fixed DC voltage of 1.0 V was applied to the cell and the resulting current was measured every ten seconds until it reached a steady state. Linear sweep voltammetry (LSV) was conducted at a scan rate of 5 mV s−1, ranging from 0 to 1.2 V, while cyclic voltammetry (CV) analysis involved the 5th cycle (ensuring attainment of steady state) encompassing potential values from 0 V to 1 V, then from 1 V to −1 V, before returning to 0 V, at a scan rate of 20 mV s−1.Application in a supercapacitor
A coin cell supercapacitor was assembled (ESI†) by sandwiching the electrolyte between two identical electrodes composed of thin nickel foil coated with a slurry of activated carbon (AC), acetylene black, and PVDF (in an 80![[thin space (1/6-em)]](https://www.rsc.org/images/entities/char_2009.gif) :
:![[thin space (1/6-em)]](https://www.rsc.org/images/entities/char_2009.gif) 10
10![[thin space (1/6-em)]](https://www.rsc.org/images/entities/char_2009.gif) :
:![[thin space (1/6-em)]](https://www.rsc.org/images/entities/char_2009.gif) 10 ratio) according to a process described by Jafari and Botte (ESI†).23 The sheet of coated nickel foil was punched out in circles with a diameter of 11.11 mm. Active material loading on the electrode was measured by subtracting the weight of bare nickel foil, and then multiplying by 0.8 to account for the other slurry components. The active material on each identical 0.97 cm2 electrode was 1.36 mg. Each electrode was held in place with a stainless-steel spacer, and contact was assured by a small stainless-steel spring placed between the top spacer and the cap (coin cell cases, MTI). The whole assembly was crimped between the cell bottom and cap (MSK-110, MTI Corporation) and sealed at over 1200 psi. The thickness of hydrogel (from electrode to electrode) once the cell was crimped was measured to be at most 1.388 mm. The soybean hull pectin + KCl hydrogel was investigated in this supercapacitor assembly because of its superior conductivity and the stability of its electrochemical operating window. The hydrogel was used within 1 hour after cooling down to room temperature to ensure that it was properly hydrated upon addition and sealing into the coin cell. Once crimped in the cell, a waiting period of 24 hours allowed the gel to fully incorporate into the surface of the electrodes, increasing the utilized surface area.
10 ratio) according to a process described by Jafari and Botte (ESI†).23 The sheet of coated nickel foil was punched out in circles with a diameter of 11.11 mm. Active material loading on the electrode was measured by subtracting the weight of bare nickel foil, and then multiplying by 0.8 to account for the other slurry components. The active material on each identical 0.97 cm2 electrode was 1.36 mg. Each electrode was held in place with a stainless-steel spacer, and contact was assured by a small stainless-steel spring placed between the top spacer and the cap (coin cell cases, MTI). The whole assembly was crimped between the cell bottom and cap (MSK-110, MTI Corporation) and sealed at over 1200 psi. The thickness of hydrogel (from electrode to electrode) once the cell was crimped was measured to be at most 1.388 mm. The soybean hull pectin + KCl hydrogel was investigated in this supercapacitor assembly because of its superior conductivity and the stability of its electrochemical operating window. The hydrogel was used within 1 hour after cooling down to room temperature to ensure that it was properly hydrated upon addition and sealing into the coin cell. Once crimped in the cell, a waiting period of 24 hours allowed the gel to fully incorporate into the surface of the electrodes, increasing the utilized surface area.
The performance of the supercapacitor coin cell was measured with a Biologic SP-150 electrochemical workstation. CVs were performed over the range of 0–0.8 V and at rates from 20–500 mV s−1. A sustained periodic state was recorded by the 5th cycle of each test. EIS was performed over a frequency range from 200 kHz to 0.1 Hz with a sinusoidal amplitude of 10 mV at open circuit potential. Galvanostatic charge–discharge cycling between 0–0.8 V was measured over a current range of 0.5–10 A g−1.
Results and discussion
Yield and degree of esterification
While the available pectin in citrus peels remains more abundant, pectin yield from soybean hull and tomato pomace has been significantly improved from a previous method by altering the pH while precipitating the polymer. Though an increase in pH has shown to increase pectin yield by several studies,24,25 the precipitation step is usually kept below pH of 3.5–4. When instead raised to a pH of 11, the pectin yield substantially increased from benchmark tests at pH 3.65, while the DE decreased with the increase in pH (Table 1). The yield increases amount to a 23% increase in soybean hull pectin and a 116% increase in tomato pectin yield with the increase pH method. The decrease in degrees of esterification by 95% in soybean hull pectin and 84% in tomato pectin show a dramatic impact of alkaline pH in the available polymer functional groups.| Soybean hull pectin | Tomato pectin | Citrus (MP) | |||
|---|---|---|---|---|---|
| Extraction pH | 3.65 | 11 | 3.65 | 11 | N/A |
| Yield (w/w%) | 6.57 (± 0.06) | 8.08 (± 0.28) | 4.86 (± 0.30) | 10.52 (± 0.76) | N/A |
| DE (%) | 8.667 (± 0.630) | 0.401 (± 0.019) | 26.641 (± 0.386) | 4.323 (± 2.084) | 33.755 (± 0.298) |
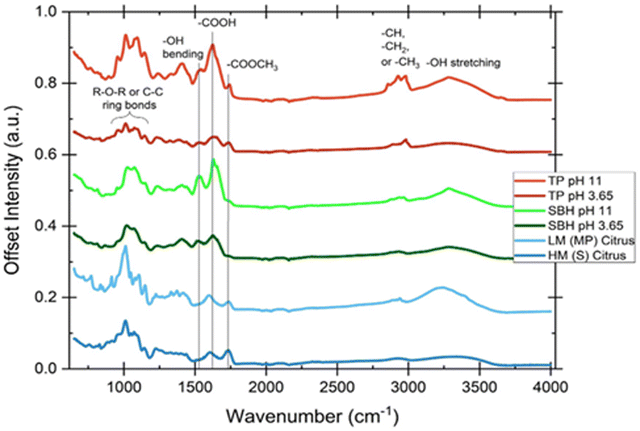
The degree of esterification is the most import functional aspect of the pectin polymer because it denotes the ratio of methyl-esterified to free carboxyl functional groups. The ratio of carboxyl functional groups is the determining factor in the method of gelation. Pectin is categorized as low DE (<50%, corresponding to the percentage of methyl-esterified groups) or high DE (>50%). There are a variety of ways to determine the DE of a particular pectin sample ranging from sodium hydroxide titration and saponification to isolate the unesterified and then total carboxyl concentrations, to a colorimetric method of estimating methanol, to an enzymatic process.26 The drawback to most of these approaches is their time-consuming nature and complex mechanism. Using Fourier transform infrared spectroscopy, Gnanasambandam and proctor as well as others have correlated the ratio of carboxyl peaks with DE (measured by gas chromatography, for example) through a process that is simple and non-destructive called DRIFTS (diffuse reflectance infrared Fourier transform spectroscopy).26–28 The correlation between traditional DE measurements and DRIFTS calculations exhibits a positive and strongly linear relationship, closely following the y = x line. This relationship is demonstrated in Table 2, where the correlation coefficient shows a slope of either 1 or 100 (when the units are decimals or percentages, respectively). Additionally, the y-intercepts tend to adjust the line closer to y = x.27–32 FTIR spectra peak areas for carboxyl groups were averaged from triplicate tests after baseline correction, Savitzky–Golay algorithm smoothing was applied, and peak isolation was performed with OriginPro software. This data (Table 1) is used as an estimate of esterification degree to confirm the designation of extracted pectin as low methyl-esterified. As with many natural sources, the structural diversity of the naturally derived polymers provides a difficult target for precise reproducibility, so some variation is expected.
| Reference | Trend line equation | R 2 value |
|---|---|---|
| Sinitsya et al.20,27 | y = 0.9716x + 0.9648 | 0.9887 |
| y = 0.9402x + 1.9702 | 0.9949 | |
| Pappas et al.20,28 | y = 89x | 0.98* (only R value) |
| Singthong et al.21,29 | y = 87.609x + 25.768 | 0.9852 |
| Monsoor et al.20,30 | y = 0.6087x + 26.123 | 0.9709 |
| Manrique and Iajolo31 | y = 124.7x + 2.2013 | 0.9967 |
| Kyomugasho et al.32 | y = 123.45x + 6.5914 | 0.958 |
| y = 1.0567x − 7.9666 | 0.916 |
Fourier transform infrared spectroscopy
As shown in Fig. 4, there are significant differences in the peak heights that correspond to the C![[double bond, length as m-dash]](https://www.rsc.org/images/entities/char_e001.gif) O stretching vibration33 of the esterified carboxyl groups (COOCH3) around 1740 cm−1, and the asymmetric vibrational stretching carbonyl (also C
O stretching vibration33 of the esterified carboxyl groups (COOCH3) around 1740 cm−1, and the asymmetric vibrational stretching carbonyl (also C![[double bond, length as m-dash]](https://www.rsc.org/images/entities/char_e001.gif) O) of the free carboxyl structure (COOH) around 1620 cm−1. The HM (high methyl esterified) citrus pectin is evident by a larger free carboxyl peak than esterified peak, corresponding to an estimated DE of 65%. The LM (low methyl esterified, estimated DE of 34%) citrus pectin naturally has a reciprocal relation, while both commercial citrus pectins exhibit characteristic peaks that manifest in the SBH and TP sources as well. What is known as the “fingerprint region” of the pectin polysaccharide family (the 950–1200 cm−1 wavelength range) is indicative of unique and complex combinations of vibrations in the repeating ring section of polysaccharide polymers that can be used to identify pectin regardless of source.26,31,34 Other notable peaks in the spectra include a region between 2800–3000 cm−1 that refers to C–H stretching and bending vibrational modes that become muddled by the wide band of O–H stretching that occurs between 2500–3700 cm−1. The galacturonic acid methyl ester O–CH3 group can be found here, but the spectra are not clear enough to provide adequate information.
O) of the free carboxyl structure (COOH) around 1620 cm−1. The HM (high methyl esterified) citrus pectin is evident by a larger free carboxyl peak than esterified peak, corresponding to an estimated DE of 65%. The LM (low methyl esterified, estimated DE of 34%) citrus pectin naturally has a reciprocal relation, while both commercial citrus pectins exhibit characteristic peaks that manifest in the SBH and TP sources as well. What is known as the “fingerprint region” of the pectin polysaccharide family (the 950–1200 cm−1 wavelength range) is indicative of unique and complex combinations of vibrations in the repeating ring section of polysaccharide polymers that can be used to identify pectin regardless of source.26,31,34 Other notable peaks in the spectra include a region between 2800–3000 cm−1 that refers to C–H stretching and bending vibrational modes that become muddled by the wide band of O–H stretching that occurs between 2500–3700 cm−1. The galacturonic acid methyl ester O–CH3 group can be found here, but the spectra are not clear enough to provide adequate information.
X-ray diffraction
Phase analysis of the amorphous/crystalline nature of the hydrogels is shown by the X-ray diffraction patterns in Fig. 5. The broad peak based around 2θ = 20° in each plot is a typical pectin peak that indicates the amorphous structure of the biopolymer.8,35 This amorphous nature is due to the localized arrangements of pectin molecules at short ranges. While the overall lack of significant peaks in the CaCl2 gels indicates that the pectin matrix in the hydrogel properly incorporates the dissolved ions, the patterns for NaCl and KCl show clearly that the peaks of each monovalent salt vastly overshadow the amorphous signal shown from pectin. This confirms the fact that while some ions may be incorporated into the pectin matrix, the majority exist in the aqueous channels that make up most of the hydrogel volume. These physically supported ions are free to dissociate and transfer protons through the electrolyte. Plasticizers such as glycerol are often added to improve the amorphous character of a gel, since that is an indication of improved ionic conductivity through segmental motion of inter and intra-chain bonds. An improvement through increased amorphous characteristics is typically sought after in regular gels and not hydrogels as the physical characteristics would be detrimentally changed if a thin film or membrane displayed too much of a rigid crystal structure. The increased liquid content in a hydrogel allows for a higher concentration of dissolved salts without drastically changing the physical characteristics.Thermogravimetric analysis
Thermal degradation and water retention were investigated through thermogravimetric analysis by measuring the weight change as a function of increasing temperature shown in Fig. 6. The significant water loss in the gels began above 50 °C and they did not reach a completely depleted stage until the 100–130 °C range. Significant reduction in residual mass was observed in the SBH and TP gels that only incorporated CaCl2, as well as a slightly earlier progression to steady state. The larger number of ionic species accessible to bond and the electrostatic attractions present in the monovalent aqueous solution contained within the polymer matrix appears to provide a slight increase in thermal stability as well as weight retention.Scanning electron microscope imaging
The microstructure and morphology of the polymer matrix has been examined through scanning electron microscopy (SEM) coupled with energy dispersive X-ray spectroscopy (EDS). Polymer matrices with microscale pores can be observed in Fig. 7. The hydrogel with a minimal amount of CaCl2 should typify the base structure of each gel with smooth polymer walls and widely variable pore sizes from the micron level up to channels that measure several hundred micrometers. No large crystals appear to be occluding the polymer structure in either gel that included a near-saturation level of monovalent aqueous salt, but the process of lyophilization appears to have accumulated the aqueous salts on the walls of each pore (supported by the even crystal distribution and lack of large faceted species). The overwhelming nature of the salts in the NaCl and KCl hydrogels corroborates the XRD peaks, where the crystallinity of each aqueous salt far overshadowed and ordered nature of the polymer.Rheology
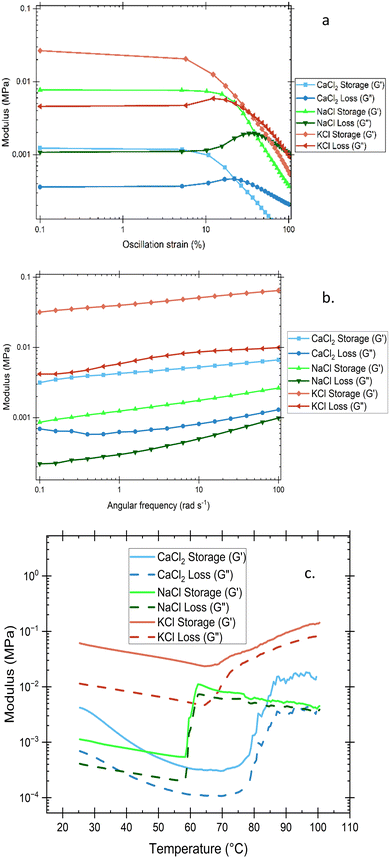
The effect of different salts on citrus pectin hydrogel viscoelastic properties is seen in Fig. 8. Oscillating strain placed on the hydrogel yields information on the storage modulus (G′) of the material, which represents its elastic properties, and the loss modulus (G′′), which represents the viscous properties of the material. The most distinctive information generally provided by these values is the phase transition between the liquid and solid-like gel state known as the gelation point. Also known as the sol–gel transition, it is identified as by the intersection of G′ and G′′ values where the storage modulus overtakes the loss modulus and elastic properties dominate the solution. Cross-linking promoted in the solution during the initial gelation process is primarily either categorized by physical network formation through molecular entanglement or secondary forces (such as hydrogen bonding, ionic bonding, or hydrophobic forces), or by chemical bond formation through strong and often irreversible covalent bonds.36Amplitude sweeps, shown in Fig. 8(a), display linear viscoelastic regions (LVE regions) up until ∼10% oscillation strain which highlight the maximum amplitude that can be applied to the structures before destruction of the structure. The plateaus in the LVE region determine reasonable stress boundaries that will constrain any subsequent oscillatory testing and show that each hydrogel is classified as a viscoelastic solid or gel-like structure under the applied conditions (G′ > G′′). The point at which the LVE region starts to curve downward is termed the yield point, while the successive crossover of G′ and G′′ (known as the flow point) indicates the transition of the material into a viscoelastic liquid state. The CaCl2 gel was the most easily deformed, followed by KCl, and then NaCl. By performing a sweep of angular frequency with a stable strain, Fig. 8(b) shows roughly an order of magnitude increase in both storage and loss modulus from the NaCl gel to the CaCl2 gel, and from the CaCl2 gel to the KCl gel. Storage modulus, which represents the energy stored and recovered during the deformation of a material, is shown to have a positive correlation with frequency. This suggests an increased gel strength at higher frequency, resistance to deformation, and improved mechanical integrity. In Fig. 8(c), the viscoelastic properties over a range of temperatures are investigated primarily to determine where, if any, exists a glass or melting temperature where the properties of the gel begin to soften and then transform into a viscoelastic liquid. No intersection points exist within the same sample, meaning that up until the point that the water has been evaporated off from this sample, there is no phase transition, and the G′′ values end higher than they start. There is a sharp transition around 60 °C for the NaCl and KCl gels, while the CaCl2 gel crest begins above 75 °C, but the absence of transition over the given temperature range reinforces the OF findings of permanently chemical crosslinking in the network that only yields under a high applied strain.
Voltammetry
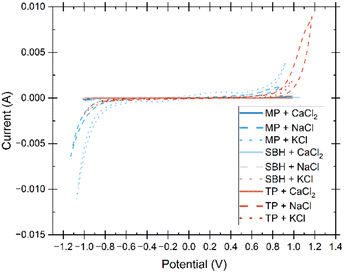
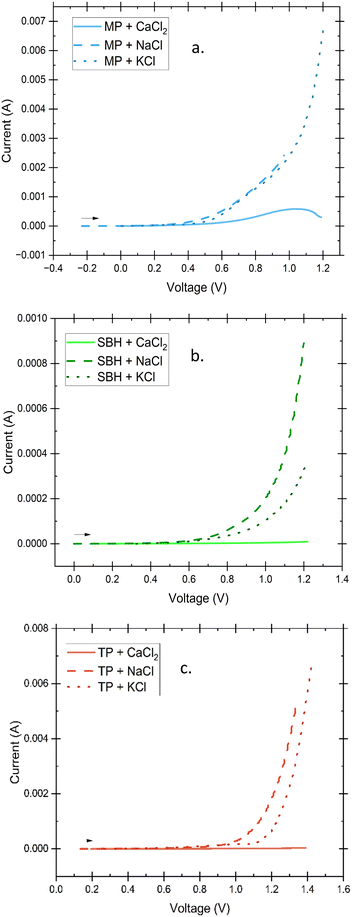
The electrochemical stability window was initially examined through the implementation of linear sweep voltammetry (LSV), followed by cyclic voltammetry (CV) to establish a comprehensive understanding of the reactivity of the electrolyte within the designated potential range. The obtained data is presented in Fig. 9 and 10, outlining the optimal electrochemical stability of the electrolyte up to the onset of the hydrogen evolution reaction, which poses a notable challenge in hydrogel electrolyte fabrication.The presence of water and its subsequent splitting into hydrogen is an inherent consequence of high-water content electrolytes. However, through careful consideration of the gel's structure, the electrochemical stability window can be incrementally expanded.37 Both LSV and CV tests demonstrate that gels containing solely CaCl2 exhibit insignificant peaks within the examined potential range. This observation suggests that the amorphous hydrogel may possess weakened intermolecular bonding, have lower H+ transfer kinetics, and thus delay the electrolyte decomposition.37,38 The increased hydrogen mobility and activity of the gels containing monovalent salts could be caused by the replacement of dissociated protons from functional alcohol, carboxylic acids, and ethers of the polymer chain by Na+ and K+ ions, causing a larger free H+ concentration and less hindrance. Electrochemical stability of hydrogel electrolytes in literature show common ranges of 1.6–1.8 V5,39 but include methods to increase the window of stability such as an ultra-high concentration of conductive salts in what is termed a “water-in-salt” electrolyte where the water activity is reduced enough to facilitate a 2.6–3 V stability window.1,37
Electrochemical impedance spectroscopy
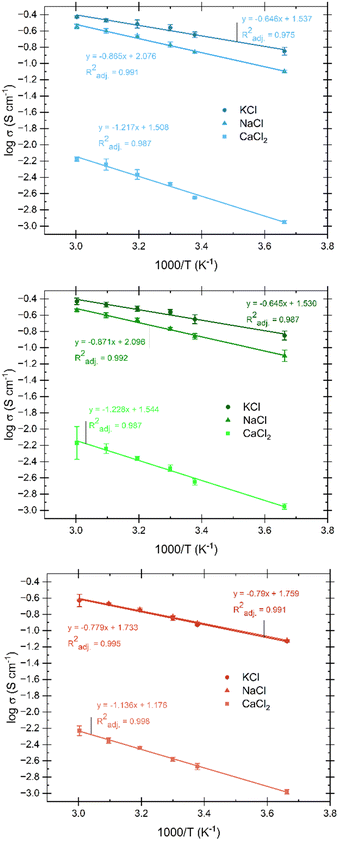
Preliminary tests were conducted to explore the optimal conductivity of gel electrolytes while maintaining hydrogel-like properties. These tests involved varying the concentration and type of salt added to the electrolyte. The addition of CaCl2 was found to have a significant impact on polymer chain interactions compared to monovalent salts like NaCl and KCl. Therefore, the acceptable range of CaCl2 incorporation, which allows gel formation without causing syneresis, is relatively narrow. It should be noted that CaCl2 contributes only a small fraction to ion mobility and conductivity, while monovalent ions predominantly act as charge carriers in the system. The optimal amount of CaCl2 to induce gelation in these conditions was determined to be 0.0140 g, and the conductivity of a gel with CaCl2 as the primary salt was a mere 1.53 mS cm−1. Once the ideal amount of CaCl2 for gelation of the aqueous pectin solution was determined, NaCl and KCl were incrementally added to the other necessary gel components. The addition continued until either the solubility limit of these salts in the liquid was approached, resulting in visible salt crystals in the gel, or the salts failed to fully dissolve before gelation. As the quantity of monovalent ions neared solubility limits there was a noticeable decrease in gel stability, causing the gels to exhibit slight flow when inverted. Fig. 3 compares aqueous electrolytes with gel electrolytes, where the only difference is the addition of pectin (dispersed in isopropanol) and subsequent temperature changes for gelation. This figure demonstrates the conductivity of the resulting gel electrolytes and provides a direct comparison to liquid electrolytes, showing that the pectin hydrogel electrolyte achieves conductivity on the same order of magnitude as the liquid electrolytes (typically exhibiting around 80–90% of the comparable liquid conductivity) in these cases. The range of conductivities was from 10−3 to 10−1 S cm−1 for all aqueous and gel samples with maximum conductivities of 186.51 mS cm−1 (NaCl gel) and 250.21 (KCl gel) were exhibited. Although slightly higher conductivities were shown, care was taken to choose the maximum concentration of salts that still showed gel-like physical characteristics without exhibiting any visible salt crystallization for further testing. These ideally selected values are 0.0140 g CaCl2, 2.9220 g NaCl, and 2.4770 g KCl. Literature shows that polymer hydrogel conductivity at room temperature is considered high when above 1 mS cm−1, with most reported maximum conductivities falling into the 1–100 mS cm−1 range40–43 and only a very few reaching into the 100–300 mS cm−1 window.1 At room temperature, pectin-based hydrogels in this study show conductivities of 1.36–2.24 mS cm−1 for CaCl2 based electrolytes, 94–137 mS cm−1 with the addition of NaCl, and 118–226 mS cm−1 with the addition of KCl for the various sources of pectin. The thermal dependence of conductivity was investigated at temperatures ranging from 0–60 °C. The Arrhenius plots shown in Fig. 11 exhibit a linear relationship between conductivity and temperature, represented by the logarithm of conductivity into the activation energy and pre-exponential factor associated with the Arrhenius relationship. The lack of significant deviation from the linear Arrhenius dependence indicates that our pectin hydrogel electrolytes exhibit both amorphous and crystalline phase ion conduction mechanisms.2 Temperature is known to exert significant influence on ion conduction in hydrogels. The diffusion of ions within hydrogels is accelerated with increasing temperature due to improved kinetic energy. This, in turn, facilitates faster ion transport through channels present in the gel matrix. Additionally, temperature influences the mobility of polymer chains, promoting segmental motion and facilitating ion diffusion. The swelling behavior of hydrogels, which can vary with temperature, affects the availability of water molecules, thereby influencing the ionic environment and altering ion concentration and mobility. Moreover, changes in polymer interactions induced by temperature can create larger channels for ion movement within the hydrogel, further facilitating conduction.1 More in-depth study of the proton conduction of the pectin biopolymer electrolytes was performed through ion transference testing.Transference number
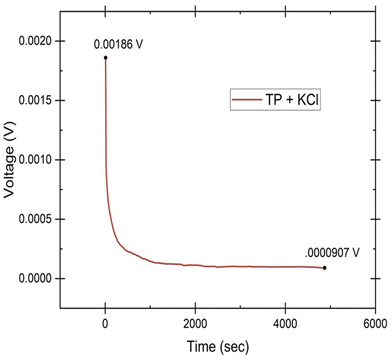
To evaluate the primary species responsible for ionic transport in the hydrogel system, Wagner's DC polarization method was performed. Fig. 12 shows the DC polarization graph of the tomato pomace and KCl sample with the initial measurement (0.00186 V) and the final steady state measurement (0.0000907 V) highlighted. When the fixed voltage is applied to the electrodes, the initial current (Ii, in A) drops as the migration of ions occurs until a final residual current is reached under steady state (If, in A) and the cell is considered polarized.35 These numbers can be used to calculate the cationic (t+) and anionic (t−) transference numbers through the equations: | (2) |
The cationic transfer number refers to the percentage of total ionic transfer that is accomplished by positive ions while the anionic transfer number is the alternative. Other important transfer parameters are the diffusion coefficients (D+ and D−) and mobilities (m+ and m−) of the cationic and anionic species, which can be calculated through the following equations:
 | (3) |
 | (4) |
| Sample | t + | t − | μ + (cm2 V−1 s−1) | μ − (cm2 V−1 s−1) | D + (cm2 s−1) | D − (cm2 s−1) |
|---|---|---|---|---|---|---|
| MP + CaCl2 | 0.92 | 0.08 | 5.53 × 10⁻⁷ | 4.73 × 10⁻⁸ | 1.42 × 10⁻⁸ | 1.22 × 10⁻⁹ |
| MP + NaCl | 0.91 | 0.09 | 3.51 × 10⁻⁵ | 3.29 × 10⁻⁶ | 9.03 × 10⁻⁷ | 8.46 × 10⁻⁸ |
| MP + KCl | 0.85 | 0.15 | 7.49 × 10⁻⁵ | 1.29 × 10⁻⁵ | 1.93 × 10⁻⁶ | 3.33 × 10⁻⁷ |
| SBH + CaCl2 | 0.88 | 0.12 | 3.18 × 10⁻⁷ | 4.47 × 10⁻⁸ | 8.18 × 10⁻⁹ | 1.15 × 10⁻⁹ |
| SBH + NaCl | 0.88 | 0.12 | 2.33 × 10⁻⁵ | 3.09 × 10⁻⁶ | 6.00 × 10⁻⁷ | 7.94 × 10⁻⁸ |
| SBH + KCl | 0.85 | 0.15 | 4.32 × 10⁻⁵ | 7.33 × 10⁻⁶ | 1.11 × 10⁻⁶ | 1.89 × 10⁻⁷ |
| TP + CaCl2 | 0.73 | 0.27 | 4.13 × 10⁻⁷ | 1.53 × 10⁻⁷ | 1.06 × 10⁻⁸ | 3.94 × 10⁻⁹ |
| TP + NaCl | 0.96 | 0.04 | 3.31 × 10⁻⁵ | 1.42 × 10⁻⁶ | 8.52 × 10⁻⁷ | 3.64 × 10⁻⁸ |
| TP + KCl | 0.95 | 0.05 | 4.37 × 10⁻⁵ | 2.24 × 10⁻⁶ | 1.12 × 10⁻⁶ | 5.76 × 10⁻⁸ |
Supercapacitor performance
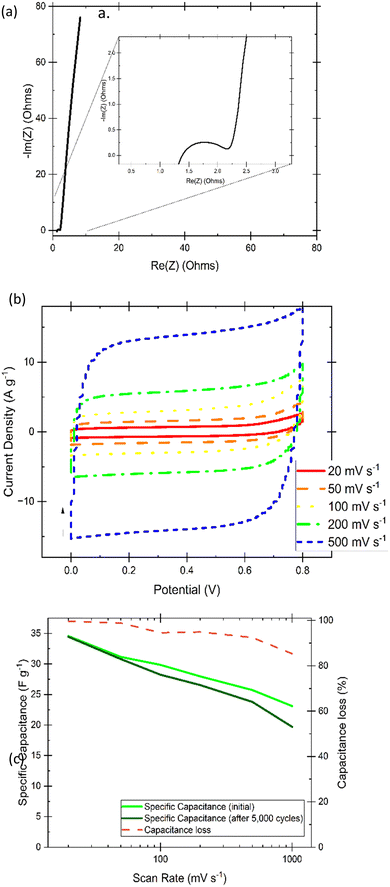
As a proof-of-concept for performance in an electrochemical energy storage device, the best performing hydrogel in this study was tested as both electrolyte and separator in a coin cell with identical AC-coated nickel electrodes.EIS (Fig. 13(a)) analysis of a two-electrode electrochemical capacitor, provides information on the resistance of charge transfer (RCT) in the high-frequency (typically as a semi-circle) followed by a low-frequency line that represents mass transfer resistance. Resistance for the system (including contacts, housing, spacers, spring, and electrodes) is calculated from the x-intercept at the high-frequency side of the semi-circle, while electrolyte resistance can be calculated from the x-intercept of the mass transfer line where it meets the semicircle. This resistance can be converted to ionic conductivity through the following equation:
 | (5) |
Fig. 13(b) shows steady-state cyclic voltammograms displaying curves that approach the box-like ideal nature of a capacitor, with only a slight curve upwards that nonetheless signified a lack of faradaic processes in the selected potential range. It is noted that the increasing scan rate likely displays some mass transport limitations that account for the small delay in reaching a sustained current density at the beginning of each charging or discharging phase when at the higher scan rates. The area under the curve was used to calculate specific capacitance before and after running 5000 cycles of galvanostatic charging and discharging to 10 A g−1, which is shown in Fig. 13(c) along with the comparison of capacitance loss at increasing scan rates. The final CVs for comparison, as well as the specific current calculated before the 5000 cycles via analysis of discharge rates of GCD are included in the ESI.† Galvanostatic cycling using various currents has been investigated in Fig. 14(a), shows very little noticeable IR drop on switching over to the discharge mode, and shows relatively quick discharge speeds. Only below 1 A g−1 does the ideal shape shift slightly as finished fully charging. The Ragone plot in Fig. 14(b) was calculated using the EC-Lab software that controls and analyses outputs of the BioLogic potentiostat and compares the specific energy density and power density of the applied hydrogel in the identical electrode coin cell system. Power density in the thousands and energy density in the units falls within expected values for electrochemical capacitors but highlights that further experimentation to apply pectin-based hydrogels in coin cell supercapacitors would be an excellent future research progression. Further confirmation of the cyclability of the supercapacitors is given by a coulombic efficiency that averaged 99.7% over the length of the test shown in Fig. 14(c).
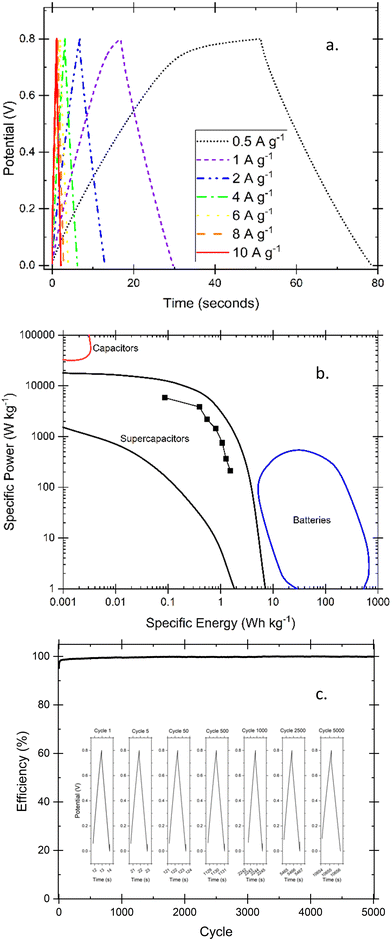 | ||
| Fig. 14 Galvanostatic charge and discharge (GCD) tests provides insight into the nature of the cycling ability of the supercapacitor through comparison of GCD at different specific currents (a) as well as a Ragone plot showing specific power and energy values common of electrochemical supercapacitors compared with common regions49 of other energy storage devices (b). The coulombic efficiency over the 5000-cycle test is shown in (c) with an inset showing individual curves over the range of the test. | ||
Conclusion
Increasing the pH of pectin extraction from soybean hull and tomato pomace resulted in notably higher yields and lower DE. These pectins and commercial citrus pectin incorporated into a hydrogel electrolyte have shown competitive conductivities close to liquid electrolytes. The ionic conductivities measured obey the Arrhenius relation and at 60 °C exhibited conductivities of 6.7, 286.1, and 373.6 mS cm−1 for CaCl2, primarily NaCl, and primarily KCl hydrogels respectively. While CaCl2-only gels had lower ionic mobility, they also showed an increase in electrochemical stability as compared to the monovalent salts. The gels showed promising overall data for electrochemical and thermal stability. Cationic transfer values were almost all in the high 80's and 90's, and the inclusion of monovalent charge carriers improved ion mobility, diffusion coefficients, and conductivity by orders of magnitude. Microscopic morphologies were analysed with SEM, and rheological tests showed that KCl-based gels were about an order of magnitude stronger and even became more resilient under applied angular frequency. Finally, the Pectin + KCl hydrogel was proven as a separator and electrolyte in a supercapacitor setup. Specific capacitance retention was negligible at low scan rates and still close to 90% at 100 mV s−1, EIS gave a clear capacitive response and good conductivity of 63.74 mS cm−1, and close to ideal responses were recorded for CV and GCDs over a wide range of scan rates and specific currents, respectively. While the high-water content poses some specific limitations, biopolymer-based hydrogel electrolytes provide a promising avenue for safe, biodegradable, and sustainable energy storage.Author contributions
Nathan W. Wilson: conceptualization, methodology, investigation, formal analysis, writing – original draft preparation. Gerardine G. Botte: conceptualization, methodology, supervision, funding acquisition, writing – review and editing.Data availability
Data will be available upon request.Conflicts of interest
There are no conflicts to declare.Acknowledgements
This material is based upon work supported by the National Aeronautics and Space Administration under grant no. 80NSSC20K1460 issued through the NASA Fellowship Activity and funded by MUREP. The research was also partially supported by the Chemical and Electrochemical Technology and Innovation Laboratory (CETI) at Texas Tech University and the National Science Foundation, EEC Division of Engineering Education and Centers, NSF Engineering Research Center for Advancing Sustainable and Distributed Fertilizer production (CASFER), NSF 20-553 Gen-4 Engineering Research Centers award # 2133576.Notes and references
- T. Xu, K. Liu, N. Sheng, M. Zhang, W. Liu, H. Liu, L. Dai, X. Zhang, C. Si, H. Du and K. Zhang, Energy Storage Mater., 2022, 48, 244–262 CrossRef.
- S. B. Aziz, T. J. Woo, M. F. Z. Kadir and H. M. Ahmed, J. Sci.: Adv. Mater. Devices, 2018, 3, 1–17 Search PubMed.
- X. Cheng, J. Pan, Y. Zhao, M. Liao and H. Peng, Adv. Energy Mater., 2018, 8, 1702184 CrossRef.
- U. S. Madduma-Bandarage and S. V. Madihally, J. Appl. Polym. Sci., 2021, 138, 50376 CrossRef.
- C.-H. Lin, P.-H. Wang, W.-N. Lee, W.-C. Li and T.-C. Wen, J. Power Sources, 2021, 494, 229736 CrossRef CAS.
- R. Gnanasambandam and A. Proctor, Food Chem., 1999, 65, 461–467 CrossRef CAS.
- M. Del Valle, M. Cámara and M. E. Torija, J. Sci. Food Agric., 2006, 86, 1232–1236 CrossRef CAS.
- M. Muthukrishnan, C. Shanthi, S. Selvasekarapandian, R. Manjuladevi, P. Perumal and P. Chrishtopher Selvin, Ionics, 2019, 25, 203–214 CrossRef CAS.
- S. Lu, S. Chen, H. Li, S. Paengkoum, N. Taethaisong, W. Meethip, J. Surakhunthod, B. Sinpru, T. Sroichak, P. Archa, S. Thongpea and P. Paengkoum, Animals, 2022, 12, 3294 CrossRef PubMed.
- S. Suri, A. Singh and P. K. Nema, Appl. Food Res., 2022, 2, 100050 CrossRef CAS.
- S. H. Nile, B. Venkidasamy, R. Samynathan, A. Nile, K. Shao, T. Chen, M. Sun, M. U. Khan, N. Dutta, M. Thiruvengadam, M. A. Shariati, M. Rebezov and G. Kai, J. Agric. Food Chem., 2022, 70, 6849–6863 CrossRef CAS.
- J. Yu and L. X. L. Chen, Environ. Sci. Technol., 2008, 42, 6961–6966 CrossRef CAS PubMed.
- Y.-K. Sun, ACS Energy Lett., 2022, 7, 1774–1775 CrossRef CAS.
- Z. Liu, Z. Deng, S. Davis and P. Ciais, Nat. Rev. Earth Environ., 2023, 4, 205–206 CrossRef PubMed.
- M. G. Trainer, M. H. Wong, T. H. McConnochie, H. B. Franz, S. K. Atreya, P. G. Conrad, F. Lefèvre, P. R. Mahaffy, C. A. Malespin and H. L. Manning, J. Geophys. Res.: Planets, 2019, 124, 3000–3024 CrossRef CAS.
- M. H. Perchonok, M. R. Cooper and P. M. Catauro, Annu. Rev. Food Sci. Technol., 2012, 3, 311–330 CrossRef CAS.
- J. W. Moore, J. Chem. Educ., 2001, 78, 8 CrossRef CAS.
- Y. Liu, J. Liu, S. Chen, T. Lei, Y. Kim, S. Niu, H. Wang, X. Wang, A. M. Foudeh and J. B.-H. Tok, Nat. Biomed. Eng., 2019, 3, 58–68 CrossRef CAS PubMed.
- R. L. King and G. G. Botte, J. Power Sources, 2011, 196, 2773–2778 CrossRef.
- E. Lizundia and D. Kundu, Adv. Funct. Mater., 2021, 31, 2005646 CrossRef.
- R. Ma, Z. Xu and X. Wang, Energy Environ. Mater., 2023, 6, e12464 CrossRef.
- N. W. Wilson and G. G. Botte, presented in part at the International Astronautical Congress 2022, Paris, France, September 21, 2022.
- M. Jafari and G. G. Botte, ACS Omega, 2024, 9, 13134–13147 CrossRef PubMed.
- R. S. Faravash and F. Z. Ashtiani, Int. J. Food Sci. Technol., 2007, 42, 1177–1187 CrossRef CAS.
- U. Kalapathy and A. Proctor, Food Chem., 2001, 73, 393–396 CrossRef CAS.
- R. Gnanasambandam and A. Proctor, Food Chem., 2000, 68, 327–332 CrossRef CAS.
- A. Sinitsya, J. Čopíková, V. Prutyanov, S. Skoblya and V. Machovič, Carbohydr. Polym., 2000, 42, 359–368 CrossRef CAS.
- C. S. Pappas, A. Malovikova, Z. Hromadkova, P. A. Tarantilis, A. Ebringerova and M. G. Polissiou, Carbohydr. Polym., 2004, 56, 465–469 CrossRef CAS.
- J. Singthong, S. W. Cui, S. Ningsanond and H. Douglas Goff, Carbohydr. Polym., 2004, 58, 391–400 CrossRef.
- M. A. Monsoor, U. Kalapathy and A. Proctor, J. Agric. Food Chem., 2001, 49, 2756–2760 CrossRef PubMed.
- G. D. Manrique and F. M. Lajolo, Postharvest Biol. Technol., 2002, 25, 99–107 CrossRef.
- C. Kyomugasho, S. Christiaens, A. Shpigelman, A. M. Van Loey and M. E. Hendrickx, Food Chem., 2015, 176, 82–90 CrossRef.
- M. Vahini, M. Muthuvinayagam and M. I. N. Isa, Polym. Sci., Ser. A, 2019, 61, 823–831 CrossRef CAS.
- J. R. Andrade, E. Raphael and A. Pawlicka, Electrochim. Acta, 2009, 54, 6479–6483 CrossRef CAS.
- P. Perumal, P. Christopher Selvin and S. Selvasekarapandian, Ionics, 2018, 24, 3259–3270 CrossRef CAS.
- R. Parhi, Adv. Pharm. Bull., 2017, 7, 515–530 CrossRef CAS PubMed.
- T.-C. Liu, S. Sutarsis, X.-Y. Zhong, W.-C. Lin, S.-H. Chou, N. Kirana, P.-Y. Huang, Y.-C. Lo, J.-K. Chang, P.-W. Wu and S.-Y. Chen, Energy Storage Mater., 2021, 38, 489–498 CrossRef.
- C. Fu, Y. Wang, C. Lu, S. Zhou, Q. He, Y. Hu, M. Feng, Y. Wan, J. Lin, Y. Zhang and A. Pan, Energy Storage Mater., 2022, 51, 588–598 CrossRef.
- T. Wei, Y. Ren, Z. Li, X. Zhang, D. Ji and L. Hu, Chem. Eng. J., 2022, 434, 134646 CrossRef CAS.
- F. Tao, L. Qin, Z. Wang and Q. Pan, ACS Appl. Mater. Interfaces, 2017, 9, 15541–15548 CrossRef CAS.
- T. Winie and A. K. Arof, Ionics, 2006, 12, 149–152 CrossRef CAS.
- C.-J. Lee, H. Wu, Y. Hu, M. Young, H. Wang, D. Lynch, F. Xu, H. Cong and G. Cheng, ACS Appl. Mater. Interfaces, 2018, 10, 5845–5852 CrossRef.
- J. Wang, Y. Huang, B. Liu, Z. Li, J. Zhang, G. Yang, P. Hiralal, S. Jin and H. Zhou, Energy Storage Mater., 2021, 41, 599–605 CrossRef.
- Z. Zheng, W. Shi, X. Zhou, X. Zhang, W. Guo, X. Shi, Y. Xiong and Y. Zhu, iScience, 2023, 26, 106437 CrossRef.
- K. Leng, G. Li, J. Guo, X. Zhang, A. Wang, X. Liu and J. Luo, Adv. Funct. Mater., 2020, 30, 2001317 CrossRef.
- C. Y. Chan, Z. Wang, Y. Li, H. Yu, B. Fei and J. H. Xin, ACS Appl. Mater. Interfaces, 2021, 13, 30594–30602 CrossRef CAS.
- R. Tiwari, D. K. Verma, D. Kumar, S. Yadav, K. Kumar, P. Adhikary and S. Krishnamoorthi, Energy Fuels, 2022, 36, 6459–6467 CrossRef CAS.
- M. M. Nofal, J. M. Hadi, S. B. Aziz, M. A. Brza, A. S. Asnawi, E. M. Dannoun, A. M. Abdullah and M. F. Kadir, Materials, 2021, 14, 4859 CrossRef CAS.
- T. S. Mathis, N. Kurra, X. Wang, D. Pinto, P. Simon and Y. Gogotsi, Adv. Energy Mater., 2019, 9, 1902007 CrossRef CAS.
Footnote |
| † Electronic supplementary information (ESI) available: Notes and pictures on gel formation, the electrochemical setups, supercapacitor cell. See DOI: https://doi.org/10.1039/d4ma00387j |
| This journal is © The Royal Society of Chemistry 2024 |

