
 Open Access Article
 This Open Access Article is licensed under a Creative Commons Attribution-Non Commercial 3.0 Unported Licence
Nitrophenylfurfural grafted amino functionalized silica nanoparticles for adsorptive removal of tartrazine dye from water†
Syed Salman
Shafqat
 *a,
Bushra
Zafar
b,
Syeda Amna
Masood
c,
Syed Rizwan
Shafqat
d,
Hafeez Ullah
Khan
c,
Asad
Syed
e,
Ali H.
Bahkali
e,
Sadaf
Mutahir
f,
Muhammad Asim
Khan
f,
Guobao
Xu
gh and
Muhammad Nadeem
Zafar
*hi
*a,
Bushra
Zafar
b,
Syeda Amna
Masood
c,
Syed Rizwan
Shafqat
d,
Hafeez Ullah
Khan
c,
Asad
Syed
e,
Ali H.
Bahkali
e,
Sadaf
Mutahir
f,
Muhammad Asim
Khan
f,
Guobao
Xu
gh and
Muhammad Nadeem
Zafar
*hi
aDepartment of Chemistry, Division of Science and Technology, University of Education, Lahore 54770, Pakistan. E-mail: salman.shafqat@ue.edu.pk
bDepartment of Chemistry and Forensics, Nottingham Trent University, Nottingham NG11 8NS, UK
cDepartment of Pharmaceutics, College of Pharmacy, University of Sargodha, Sargodha 40100, Pakistan
dDepartment of Chemistry, University of Sialkot, Sialkot 51300, Pakistan
eDepartment of Botany and Microbiology, College of Science, King Saud University, PO Box 2455, Riyadh 11451, Saudi Arabia
fSchool of Chemistry and Chemical Engineering, Linyi University, Linyi 276005, China
gSchool of Applied Chemistry and Engineering, University of Science and Technology of China, No. 96 Jinzhai Road, Hefei, Anhui 230026, People's Republic of China
hState Key Laboratory of Electroanalytical Chemistry, Changchun Institute of Applied Chemistry, Chinese Academy of Sciences, 5625 Renmin Street, Changchun, 130022, People's Republic of China
iDepartment of Chemistry, University of Gujrat, Gujrat 50700, Pakistan. E-mail: znadeempk@gmail.com; nadeem.zafar@uog.edu.pk
First published on 8th August 2024
Abstract
In the present study, the synthesis of novel nitrophenylfurfural grafted silica nanoparticles (NPF–SiNPs) having multifunctional properties is reported. Using a sol–gel process, the silica nanoparticles were functionalized with amino groups to develop amino functionalized silica nanoparticles (AFSi-NPs). Nitrophenylfurfural derivatives (para, ortho, and meta) were further grafted onto the AFSi-NP surface to prepare the NPF–SiNPs using a post-grafting approach. X-ray diffraction (XRD), Fourier transform infrared (FTIR) spectroscopy, transmission electron microscopy (TEM), scanning electron microscopy (SEM), thermogravimetric analysis (TGA), and Brunauer–Emmett–Teller (BET) analysis were used for characterization of obtained AFSi-NPs and NPF–SiNPs. The FTIR and XRD results revealed the presence of furfural derivatives on the silica surface and BET analysis revealed a remarkable surface area of 80 m2 g−1 for NPF–SiNPs especially when p-nitrophenylfurfural was used for modification of AFSi-NPs. TEM/SEM images depicted the spherical mesoporous morphology of as-prepared NPF–SiNPs having a size of 700–800 nm. The material (NPF–SiNPs) was then effectively applied for the adsorptive removal of tartrazine (TTZ) dye from wastewater. Out of the three adsorbents (p-NPF–SiNPs, o-NPF–SiNPs, and m-NPF–SiNPs), the p-NPF–SiNPs showed higher activity towards TTZ removal. The influence of well-established adsorption parameters, including pH, p-NPF–SiNP amount, temperature, TTZ concentration, and contact time, was studied. Langmuir and Freundlich adsorption isotherm models were applied to simulate the equilibrium data. The equilibrium sorption data were better matched to the Langmuir isotherm model, as evidenced by the higher values of r2 (nearly 1), which indicated the presence of an adsorption monolayer of TTZ on the surface of p-NPF–SiNPs. The maximum Langmuir adsorption capacity was found to be 203.5 mg g−1 at 323 K. The adsorption kinetic data for adsorption of TTZ onto p-NPF–SiNPs were correlated well with the pseudo-2nd (PS)-order model. In addition, TTZ adsorption onto p-NPF–SiNPs was investigated on the molecular level using Monte Carlo and molecular dynamics simulations.
1. Introduction
Various physical, chemical and biological processes, for example, coagulation–flocculation, evaporation, oxidation, pickering emulsion membrane technology, and photocatalysis, have been employed for synthetic dyes removal from wastewater. Despite being effective, these methods also present some setbacks in terms of their sustainability in the long run.1–5 Hence there is a need to broaden and exploit state-of-the-art technologies to deal with this menace. One such promising technology would be adsorption and the various adsorbents used previously include mesoporous silica,6 modified silica,7 silica microsphere8 activated alumina,9 activated carbon,10–12 activated clay,13 zeolites,14 metallic nanoparticles,15 and agricultural waste.16 One of the most commonly utilized adsorbents for treatment of various pollutants is nano-silica. This is due to the fact that nano-silica has low toxicity, low cost, inertness, high storage capacity, high porosity, permeability, thermal and chemical stability, non-explosive nature, and the ability to be reused after desorption.17Monodisperse mesoporous silica nanoparticles (Si-NPs) are extensively used in various studies due to their unique structural properties, including high surface area, large pore size, biocompatibility, biodegradability, and stable water dispersibility. These properties made them suitable for a wide range of applications in different fields of research and development.18–22 One of the structural features of Si-NPs is that they are hydrophilic in nature, providing strong interaction with polar moieties through hydrogen bonding (present in the effluent stream). This hydrophilicity is attributed to the existence of a number of silanol groups on the silica surface.23 However hydrophilicity of Si-NPs could be tuned to high hydrophobicity, either through post-modification or in situ modification of the silica surface with various active functional groups as well as molecules.24 This signifies that incorporation of suitable functional groups on the silica surface increases the degree of adsorption of hydrophobic as well as hydrophilic moieties.
Ionic liquid modified silica nanoparticles and silane coupling agents ((R/O)3SiR) have been extensively explored to modify the silica surface in Si-NPs, which contain alkoxysilane monomers such as amine, chloro, methacryloxy, vinyl, glycidyloxy etc.17,25–27 These organically modified Si-NPs have found applications in the fields of adsorption,28 catalysis,29 biological science,30 enhanced oil recovery (EOR), etc.31 In the present era, owing to their high porosity and stability, mesoporous Si-NPs have drawn considerable attention as an adsorbent. It is established that morphology and surface characteristics have a great impact on adsorption performance. Excellent dye adsorption capacity is also associated with the complex surface structures of adsorbents having a large surface area and numerous readily available active sites for organic pollutants.32
This work aims to discuss the synthesis and characterization of amino functionalized silica nanoparticles (AFSi-NPs) and nitrophenylfurfural grafted silica nanoparticles (NPF–SiNPs) and their application in the adsorptive removal of tartrazine (TTZ) dye from aqueous media. TTZ is a synthetic lemon-yellow azo dye that contains sulphonic acid. It is an important constituent of shells of medicinal capsules as well as hair products and is also used in food processing.33 Azo dyes typically resist oxidation, ozone, biodegradation, temperature changes, and light.34 Due to these characteristics, dyes can accumulate in living things, which can cause serious illnesses and functional problems. TTZ is regarded as harmful to people because of its hyperactive effects, which can result in eczema, thyroid cancer, asthma, migraines, and other behavioral issues.35 However, despite the breakthrough in the application of adsorptive technology in the removal of various organic pollutants, a thorough literature survey shows that the modification by grafting of nitrophenylfurfurals onto a silica network has not been reported to date and studies on the adsorptive removal of TTZ from wastewater using modified nanomaterials are rare.
However, in contrast to the reported materials, our synthesized material stands out due to its unique blend of multiple functionalities. Our aim was to develope a hybrid material incorporating heterocyclic and homocyclic rings, alongside nitro and hydroxyl functional groups, an approach rarely encountered in existing materials. This pursuit was driven by the aspiration to engineer a material versatile enough for diverse applications. In our study, we focused on synthesizing this material to explore its potential in various applications. Initially, we conducted a wastewater treatment application taking TTZ as the target pollutant to gauge its performance. Moreover, our investigation will extend to biomedical sensing as well as water splitting applications. Moving forward, we anticipate that this material holds promise for an array of applications, such as catalysis, energy storage, and sensing. Our preliminary assessments indicate its potential in these domains, prompting further exploration and in-depth studies to harness its capabilities.
So keeping this in mind, in the present study the amino group was selected to modify the silica surface and in the next step, this amino group assisted the chemical grafting of nitrophenylfurfurals on the silica surface.34 On the other hand, the triphasic nature (aromatic, aldehyde and ethereal) of furfural35 has drawn the author's attention towards its grafting on nano-silica in order to enhance the hydrophobic and hydrophilic characteristics of nano-silica. Furthermore, the affinity of nano-silica for complex materials was enhanced by fusion of the nitrophenyl group with furfural prior to being grafted onto silica. The nitrophenyl group together with the furfural ring have plenty of π-electronic clouds. Thus, the product synthesized by combining different functional groups would be able to adsorb hydrophobic, hydrophilic and complex moieties present in the media. AFSi-NPs and NPF–SiNPs were characterized using various techniques and applied for the adsorptive removal of TTZ from water. The effects of well-established parameters, for example, pH, mass of p-NPF–SiNPs, initial concentration of TTZ, and contact time, were applied to evaluate the TTZ removal efficiency of NPF–SiNPs.
2. Materials and methods
2.1. Chemicals
Chemicals used in the present study include furfural, tetraethoxysilane, p-nitroaniline, o-nitroaniline, m-nitroaniline, ammonia (NH3), cupric chloride (CuCl2), 3-aminopropyltriethoxysilane ((C2H5O)3Si(CH2)3NH2), sodium hydroxide (NaOH), hexadecyltrimethylammonium chloride (C16TMACl) and hydrochloric acid (HCl), which were obtained from Sigma-Aldrich (99% or higher) and were used after necessary purification processes. The model dye TTZ was received as a kind gift from Stylers International, Lahore.2.2. Synthesis of NPF–SiNPs
Three steps were necessary to graft nitrophenylfurfurals onto the silica surface: (i) adding amino groups to the silica surface via an aqueous silane coupling reaction; (ii) making nitrophenylfurfurals; and (iii) using a simple condensation reaction heated under reflux to react the amino groups of silica and nitroarylfurfural.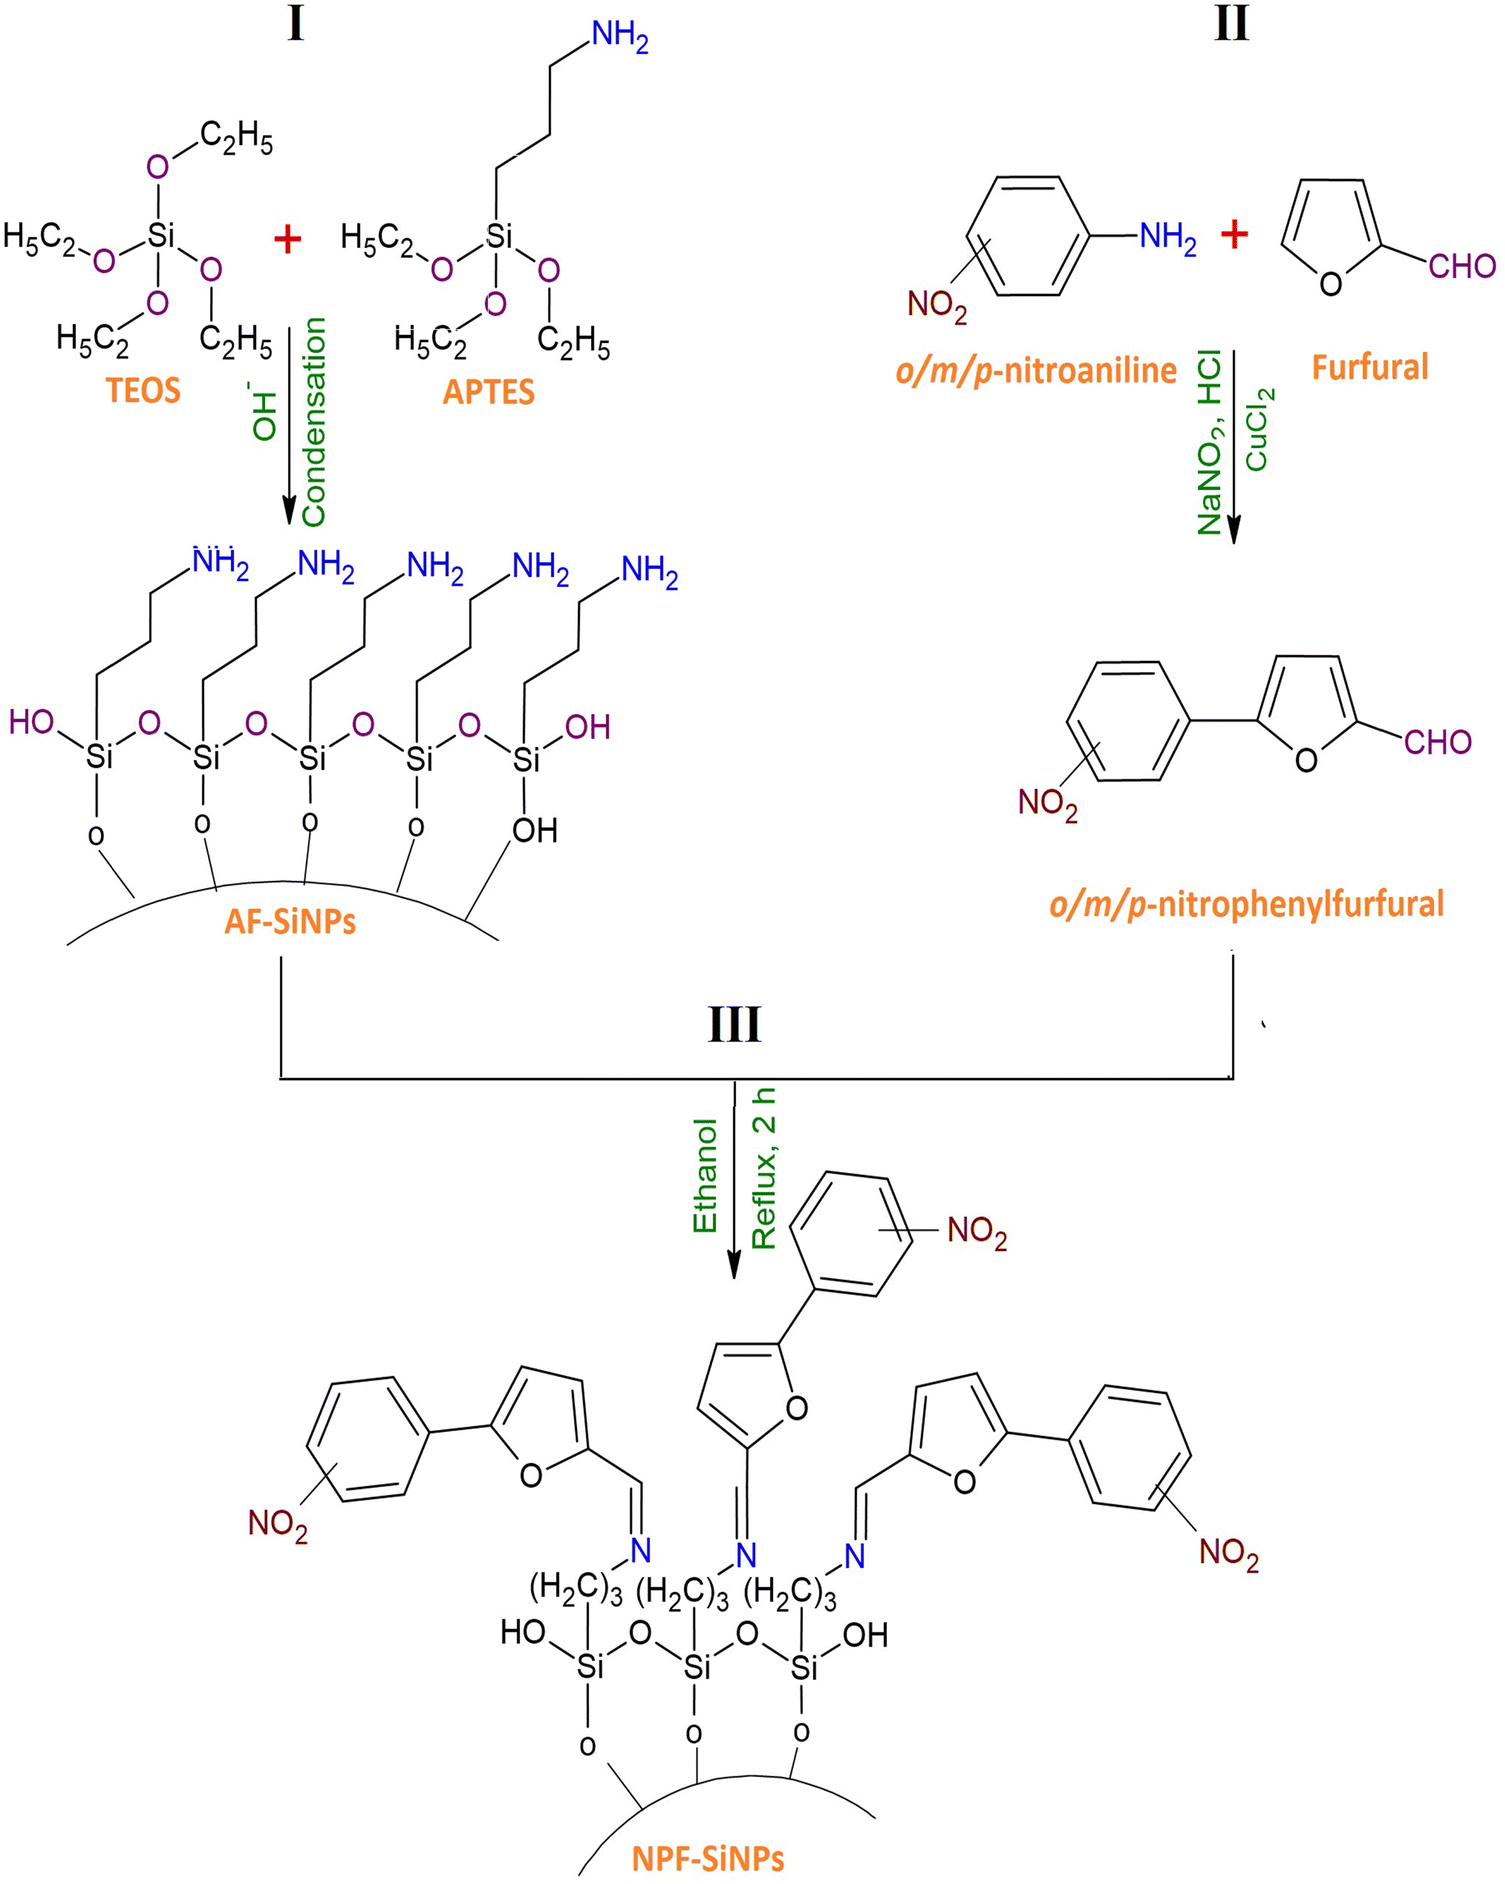 | ||
| Scheme 1 (I) Synthesis of AFSi-NPs, (II) synthesis of o/m/p-nitrophenylfurfural, and (III) synthesis of NPF–SiNPs. | ||
By employing this general procedure, p/o/m-nitrophenylfurfurals were treated with AFSi-NPs separately. A Schiff base linkage was developed between the silica and furfural derivatives because reactive groups taking part in the reaction in each case were similar to aldehyde (–CHO) from nitrophenylfurfurals and amino (–NH2) from AFSi-NPs. The chemical characteristics of these obtained products were similar to each other due to a similar chemistry of these reactions and a similar composition of reactants and products. However, there is a difference in the reactivity of nitrophenylfurfurals due to the different positions of the NO2 group and consequently it has an effect on the reaction rate and physical and chemical compositions of the products. These factors are explained in detail in Section 3.2.7.
2.3. Characterization of nitrophenylfurfurals, AFSi-NPs and NPF–SiNPs
Nitrophenylfurfurals, AFSi-NPs and NPF–SiNPs were purified and characterized. GC-MS and MS of nitrophenylfurfurals were recorded on GC-MS (Shimadzu QP2010) and mass spectrometers (MAT312 Model). A Siemens D 5000 diffractometer with Cu-K radiation (λ = 1.54060 Å), at room temperature (298 K), was used to analyze the XRD patterns of AFSi-NPs and NPF–SiNPs. Fourier transform infrared (FTIR) spectroscopy of nitrophenylfurfurals, AFSi-NPs and NPF–SiNPs was performed on a PerkinElmer FTIR (spectrum RXI) spectrometer. FTIR spectra assisted in finding changes in the functional groups of pre- and post-grafted silica. SEM and TEM were used to analyse the surface morphology and particle size of AFSi-NPs and NPF–SiNPs using a JEOL JSM-6390LA SEM and a JEOL 1010 TEM. The surfaces of synthesized materials were coated with gold by sputtering in an inert environment before the measurements. Using a TGA Universal Analyzer (2000 with Universal V4.7A software), the thermal stability of AFSi-NPs and NPF–SiNPs was investigated using thermogravimetric analysis (TGA). A Belsorp-mini II (BEL Japan) was used to assess the N2-adsorption–desorption isotherms at 323 K. Before measurement, the sample was evacuated at 100 °C under 103 mm Hg. Using adsorption data at P/P0 and considering the linearity of the Brunauer–Emmett–Teller (BET) plot, the specific surface areas were computed together with the pore diameters using the Barrett–Joyner–Halenda (BJH) technique.2.4. Batch adsorption studies
To examine the effects of well-known factors such as pH, p-NPF–SiNP amount, agitation speed, temperature, starting concentration of TTZ, and contact duration, the TTZ adsorption study was performed using a batch adsorption technique. Each solution was manually shaken using a water bath shaker (Wisd, WiseShake SHO-2D, Seoul, South Korea) at a constant speed of 150 rpm. Once equilibrium had been reached, the samples were removed, and the solution was filtered to remove the adsorbent. Using a double beam UV-visible spectrophotometer, the remaining concentration of TTZ in the supernatant was measured at 425 nm. Initial TTZ concentration (20–120 mg L−1), contact duration (5–90 minutes), pH variation (2–12), shaking speed (50–200 rpm), temperature (303–323 K), and the amount (0.05–0.1 g/250 mL) of p-NPF–SiNPs were some of the variables examined. The sample shaking duration of 90 min was chosen to reach equilibrium in all experiments. After the accomplishment of the adsorption process, the sample was filtered using an ordinary filter paper. The quantity of TTZ adsorbed onto NPF–SiNPs and TTZ removal percentage were calculated using equations (S1) and (S2) as presented in the ESI† (Section S1).3. Results and discussion
3.1. Characterization of synthesized nitrophenylfurfurals
In the FTIR spectra of o/m/p-nitrophenylfurfurals shown in Fig. S1–S3 (ESI†), stretching at ∼3100 cm−1 was assigned to aromatic C–H and a peak at ∼2800 cm−1 was related to aliphatic C–H stretching. Another absorption peak observed at around 1600 cm−1 allowed for the identification of the carbonyl group. The presence of NO2 in these compounds was indicated by peaks around ∼1570 cm−1 and ∼1500 cm−1.37 MS of purified o-nitrophenylfurfural (Fig. S4, ESI†) and GC-MS of m/p-nitrophenylfurfural were also obtained and are presented in Fig. S5 and S6 (ESI†). MS of o-nitrophenylfurfural exhibited a base peak at 217 related to its molecular weight. In the chromatogram of m-nitrophenyfurfural, peak 2 showed the maximum area and height as mentioned at the base of the chromatogram. The database suggested a hit at a molecular weight of 217 with the molecular formula C11H7NO4, which resembled 89% of the expected product m-nitrophenyfurfural. Peak 3 in the chromatogram of p-nitrophenyfurfural showed the maximum area and height as mentioned at the base of the chromatogram. The library suggested a hit at a molecular weight of 217 with the molecular formula C11H7NO4, which resembled 92% of the expected product. The molecular ion peak observed in mass fragmentation patterns of all three products was at 190, which was also the base peak. The second peak at 171 was observed after the removal of the NO2 group. The molecular mass of nitrobenzene, which corresponded to the second-highest peak at 115, demonstrated the breakdown of nitrobenzene from furfural.38p/o/m-Nitrophenylfurfurals were further characterized by recording their melting points. The characteristic properties along with melting points of all the furfural derivatives synthesized during this study are presented in Table S1 (ESI†). It can be observed that p-nitrophenylfurfural had a higher melting point due to intermolecular hydrogen bonding, which was not present in o-nitrophenylfurfural and m-nitrophenylfurfural. Due to intramolecular hydrogen bonding in o-nitrophenylfurfural, its modification on silica nanoparticles was poor compared to the other derivatives. Furthermore, m-nitrophenylfurfural had a weaker acidic character compared to p-nitrophenylfurfural. Among the three nitrophenylfurfurals, p-nitrophenylfurfural had strong modification on silica nanoparticles. So due to this reason, p-nitrophenylfurfural was further characterized. The 1H NMR spectrum of p-nitrophenylfurfural was recorded in DMSO and is presented in Fig. S7 (ESI†). The types of H atoms present in the molecule and labelling of these protons are presented in Fig. S8 and Section S2 (ESI†).383.2. Characterization of AFSi-NPs and NPF–SiNPs
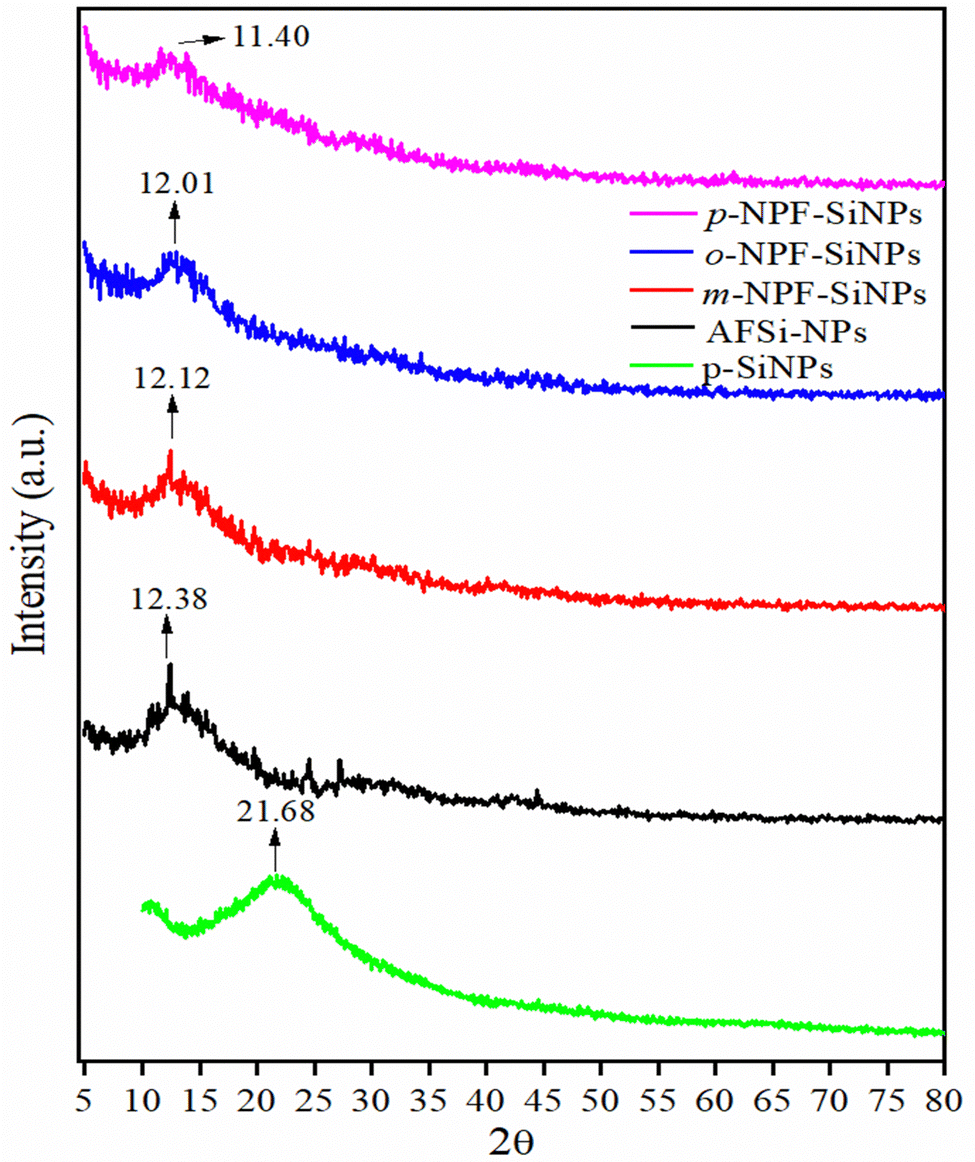 | ||
| Fig. 1 XRD spectra of p-SiNPs, AFSi-NPs, and p/o/m-NPF–SiNPs. | ||
All these peaks had lower angles than those of normal silica with a slight difference in the intensity of curves. The height of intensity of peaks is in the order m > o > p-NPF–SiNPs. This order is also reliant on the reactivity of reactants and the most depressed peak at 11.40 was observed in the case of p-nitrophenylfurfural, which reveals a higher loading of the para derivative, as further explained in Section 3.2.7. The decrease may possibly be due to the destruction of the crystal regularity in NPF–SiNPs as compared to pure silica. It was determined that the degree of meso-porosity had decreased in modified SiNPs. Overall the XRD pattern is evidence of the highest loading of p-nitrophenylfurfural on the surface of silica.36,41
![[double bond, length as m-dash]](https://www.rsc.org/images/entities/char_e001.gif) N and aromatic CC stretching frequencies respectively. The silanol peak at 1639 cm−1 (Fig. 2a) had been replaced by the carbonyl (CO) peak at 1674 cm−1 (Fig. 2b–2d). This indicated the presence of nitrophenylfurfural molecules on the exterior of AFSi-NPs. Furthermore, this also indicated that the –NH2 group had reacted with the –CHO group of nitrophenylfurfural and had been converted to a Schiff base (CN–). The peak observed at 3115 cm−1 was linked to aromatic C–H stretching. Two peaks at 2948 cm−1 and 2850 cm−1 were assigned to the C–H stretching. Furthermore, the two peaks observed at 1367 cm−1 1245 cm−1 were related to the N–O and C–N stretching frequencies respectively.43
N and aromatic CC stretching frequencies respectively. The silanol peak at 1639 cm−1 (Fig. 2a) had been replaced by the carbonyl (CO) peak at 1674 cm−1 (Fig. 2b–2d). This indicated the presence of nitrophenylfurfural molecules on the exterior of AFSi-NPs. Furthermore, this also indicated that the –NH2 group had reacted with the –CHO group of nitrophenylfurfural and had been converted to a Schiff base (CN–). The peak observed at 3115 cm−1 was linked to aromatic C–H stretching. Two peaks at 2948 cm−1 and 2850 cm−1 were assigned to the C–H stretching. Furthermore, the two peaks observed at 1367 cm−1 1245 cm−1 were related to the N–O and C–N stretching frequencies respectively.43
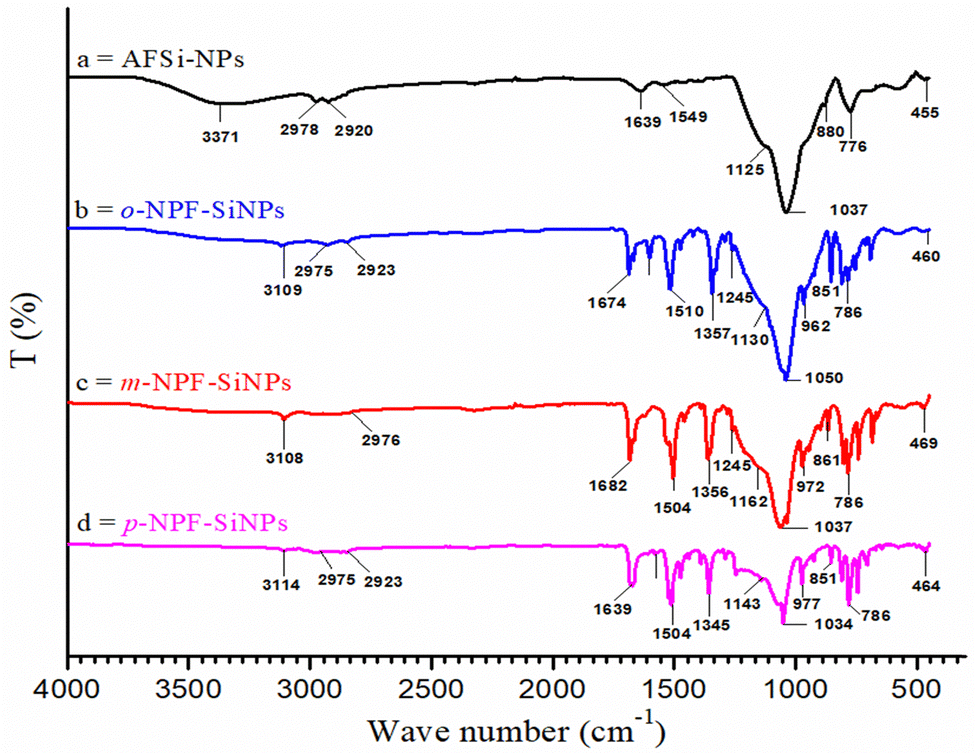 | ||
| Fig. 2 FTIR spectra of AFSi-NPs and p/o/m-NPF–SiNPs. | ||
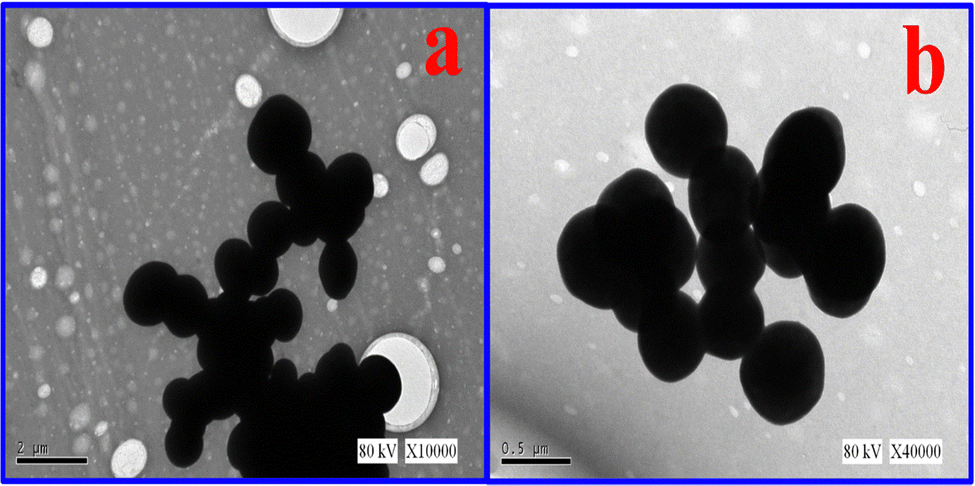 | ||
| Fig. 3 TEM images of p-NPF–SiNPs at low magnification (a) and high magnification (b). | ||
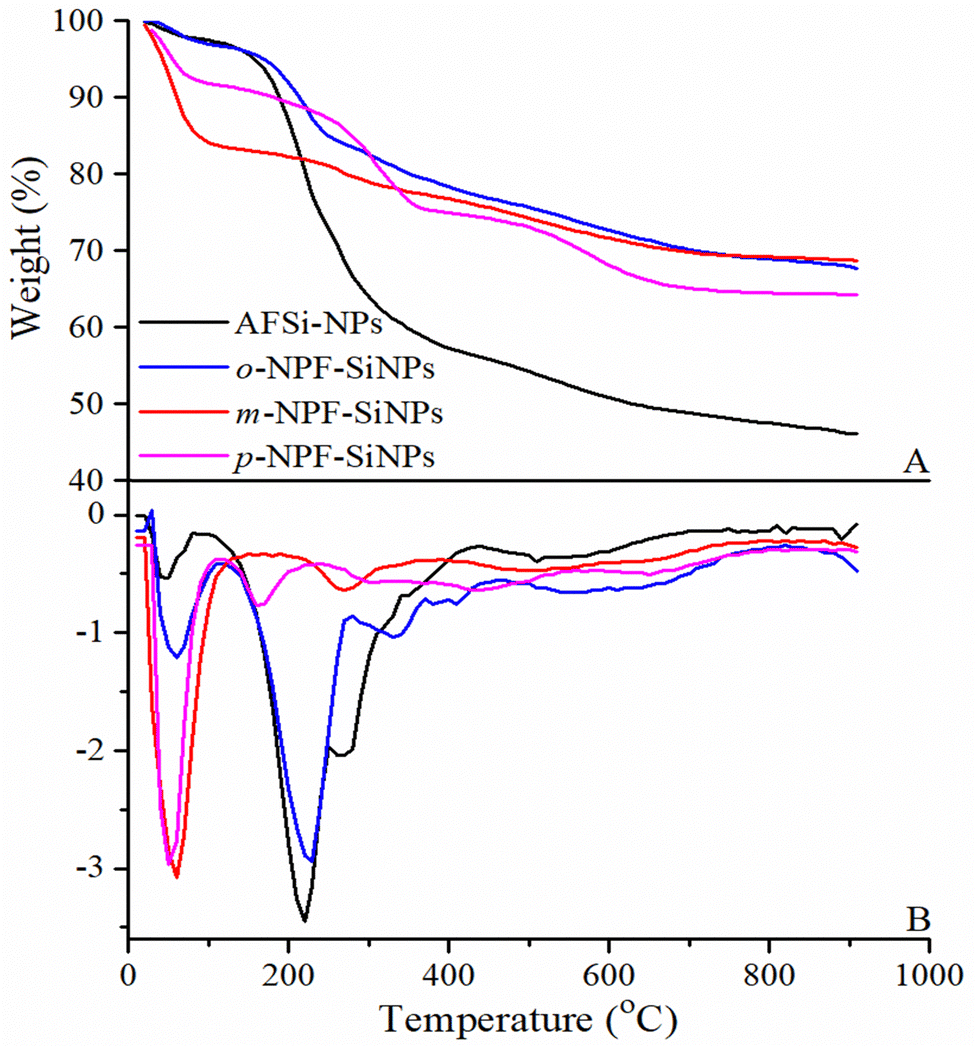 | ||
| Fig. 4 (A) TGA and (B) DTG curves of AFSi-NPs and p/o/m-NPF–SiNPs. | ||
In contrast, o-NPF–SiNPs showed four decomposition steps at 28–100 °C (2 wt%), 100–250 °C (6 wt%), 251–434 °C (6.8 wt%) and 437–700 °C (8%) as observed from TGA and DTG curves in Fig. 4A and B (blue lines). TGA and DTG curves (red lines in Fig. 4A and B) of m-NPF–SiNPs also showed four decomposition steps with a slight difference in the temperature range as follows: 28–120 °C (4 wt%), 121–275 °C (5 wt%), 276–46 °C (7 wt%) and 447–700 °C (9 wt%). The removal of adsorbed water and carbon dioxide is found to be the initial step. Due to the nitro group's breakdown in the second phase, volatile molecules such as water, propenal, nitrogen, and nitrogen oxides were released. The breakdown of the phenyl and furan rings and the ether bond resulted in the production of ketone, 2-pentanone, and methyl isobutyl ketone in the third phase. The fourth phase was mostly attributable to the degradation of the propyl group into CO, H2O, C2H4, and CH4.
In contrast to o/m-NPF–SiNPs, thermal decomposition curves of p-NPF–SiNPs had one additional decomposition step as shown by TGA and DTG curves in Fig. 4A and B (pink lines). This additional decomposition step may be evidence of higher loading of p-nitrophenylfurfural onto AFSi-NPs. This trend of loading of nitrophenylfurfural onto AFSi-NPs is further explained in Section 3.2.7. The decomposition steps are as follows: 30–89 °C (2 wt%), 90–168 °C (5 wt%), 169–372 °C, 372–480 °C (6 wt%), and 481–700 °C (9 wt%). The removal of adsorbed water was found to be the initial stage. The second stage produced flammable substances, including carbon dioxide and water. Due to the nitro group's breakdown in the third phase, propenal, nitrogen, and nitrogen oxides were produced. After the phenyl and furan rings and the ether connection were broken down in the fourth step, ketone, 2-pentanone, and methyl isobutyl ketone were formed. The breakdown of the propyl group was primarily responsible for the fifth step's release of CO, H2O, C2H4, and CH4.33,34
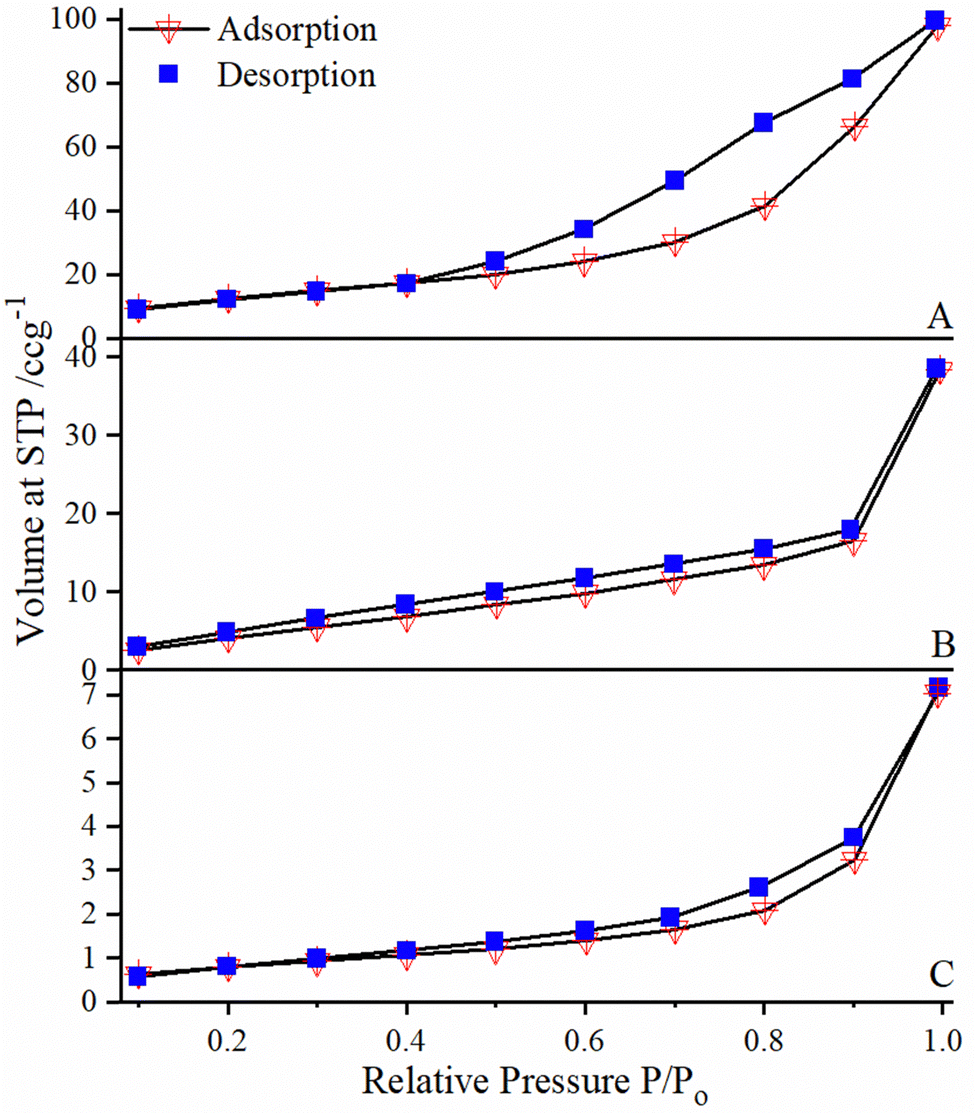 | ||
| Fig. 5 Adsorption/desorption isotherms of (A) o-NPF–SiNPs, (B) m-NPF–SiNPs and (C) p-NPF–SiNPs. | ||
At a relative pressure (P/P0) of 0.61, threshold capillary condensation had been found to generate a fast rise in the volume of the adsorbed quantity. As a result, there was maximum pressure (P/P0 = 1) extremely close to the horizontal branch. At this stage the liquid had been absorbed into all of the pores. It has been noted that the sample with p-nitrophenylfurfural (Fig. 5C) attained a saturation pressure within a very limited time as compared to the samples with o-nitrophenylfurfural (Fig. 5A) and m-nitrophenylfurfural (Fig. 5B). In addition, the abrupt jump above P/P0 = 0.9 (in the case of B and C) typically represents the accomplishment of the monolayer adsorption. At this stage, the adsorption starts to progress beyond the monolayer to enable multilayer adsorption. This helps to record the specific surface area of the material by analyzing the monolayer adsorption data before the multilayer adsorption begins. These claims are also in good agreement with the outcomes previously obtained from SEM analysis, as they also indicate that small size particles have higher adsorption capacity. In general, high adsorption capacity is found for gases and very much linked to a large volume capacity (i.e. pore volume) and pore shape.
Surface area analysis is shown in Table S4 (ESI†), and the results indicated that the specific surface area of the furfural grafted silica (NPF–SiNPs) as determined by the BET method was less than the specific surface area of AFSi-NPs. Furthermore, p-NPF–SiNPs had a high surface area (80 m2 g−1) among all NPF–SiNPs (47 m2 g−1 for o-NPF–SiNPs and 21 m2 g−1 for m-NPF–SiNPs). The less surface area of p-NPF–SiNPs (80 m2 g−1) as compared to AFSi-NPs (148 m2 g−1) is due to grafting of p-NPF on the silica surface, which causes pore blockage and results in reduced surface area as reported in our previous study.46 The higher surface area of p-NPF–SiNPs as compared to those of o/m derivatives is related to the higher reactivity of p-nitrophenyl furfural. p-NPF chemically reacted with AFSi and caused less blockage of pores and had a higher surface area as compared to the other derivatives. The reduced surface area in the case of m-NPF–SiNPs and o-NPF–SiNPs may be attributed to the lower reactivity of o/m-NPFs and their physical deposition on the silica surface, which causes pore blockage and hence reduced surface area.
Additionally, the pore volume and pore diameter of p-NPF–SiNPs were also estimated using the BJH model and found to be 0.721 cm3 g−1 and 18 nm (Table S4, ESI†).47
O carbon and the rate of reaction is increased, resulting in more loading of arylfurfural on silica. In the case of m-nitrophenylfurfural, the –NO2 group does not create a positive charge on carbonyl (CO) carbon and the rate of reaction becomes slow and there is less loading of arylfurfural on silica.
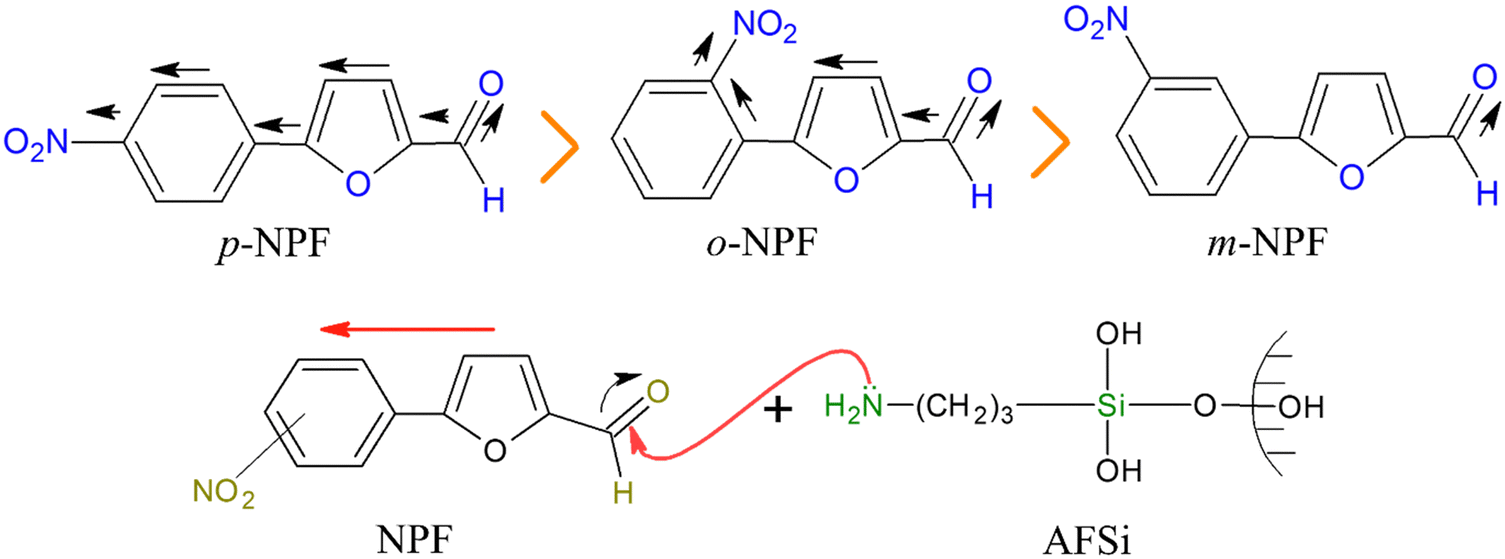 | ||
| Scheme 2 Electron withdrawing and loading trends of nitrophenylfurfurals. | ||
3.3. Adsorptive study of TTZ onto NPF–SiNPs
The synthesis of Si-NPs grafted with nitrophenylfurfurals was achieved for the first-time using condensation reaction. After characterization, the p-NPF–SiNPs, o-NPF–SiNPs and m-NPF–SiNPs were used as adsorptive catalysts for the removal of TTZ from synthetic TTZ solutions.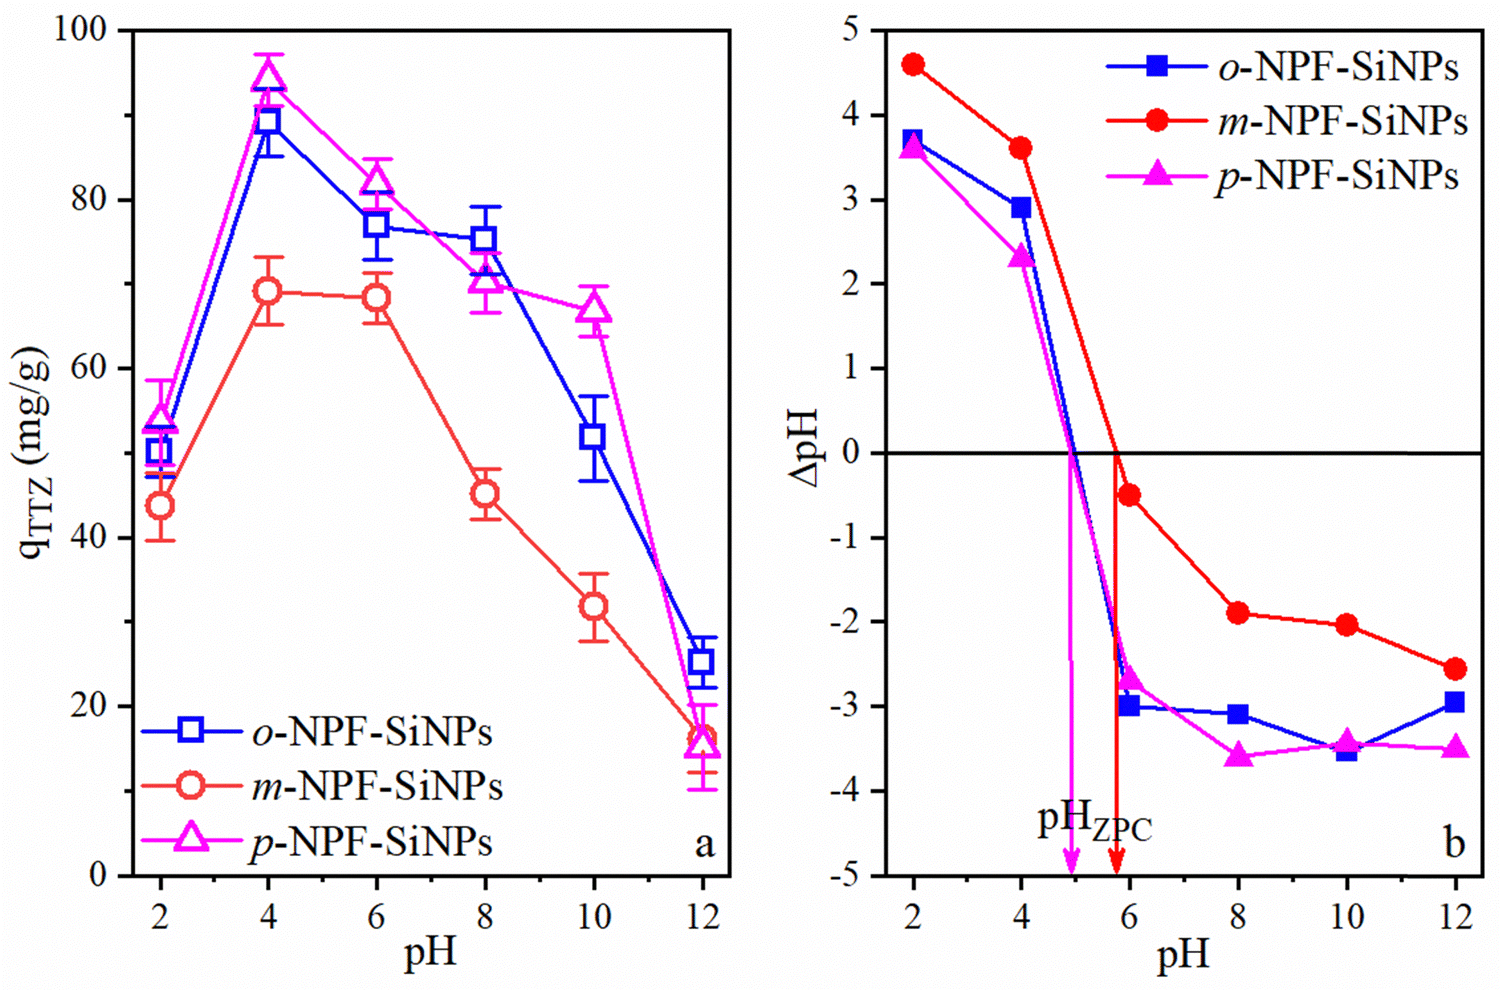 | ||
| Fig. 6 Effect of pH on adsorption of TTZ onto p/o/m-NPF–SiNPs (a) and pH vs. ΔpH graphs of p/o/m-NPF–SiNPs (b). | ||
The decrease in adsorption capacity at extreme acidic pH may be attributed to competition of H+ ions and the positive surface of NPF–SiNPs. When the pH was increased to 4, the electrostatic interactions between NPF–SiNPs+ (ZPC = 4.9–5.8) and dye-SO3− increased due to low hydrogen ion (H+) concentration resulting in highest adsorption of TTZ. Additionally, non-polar interactions were also responsible for enhanced removal. The decrease in the removal of TTZ under far acidic/neutral conditions is assumed to be due to decreased electrostatic forces between negatively charged NPF–SiNPs− (ZPC = 4.9–5.8) and dye-SO3−. Furthermore, the exponential decrease at basic pH could be due to two factors: (1) very weak electrostatic forces or electrostatic repulsion between negatively charged NPF–SiNPs and TTZ and (2) high concentration of OH−, which can compete with TTZ. Both conditions prevent the system from adsorbing the anionic dye. Moreover, variation in pH has an impact on the adsorptive process because it triggers the functional groups on the adsorbent's surface to dissociate, which in turn tends to change the equilibrium conditions of the adsorption process.
Fig. 6a also shows the comparison of all three adsorbents for the removal of TTZ. From Fig. 6a, it can be seen that p-NPF–SiNPs had the highest adsorption capacity for TTZ. In this regard p-NPF–SiNPs were selected for further adsorption studies. The reason for the high efficiency of p-NPF–SiNPs and low efficiency of m-NPF–SiNPs was explained in Section 3.2.7. Furthermore, NPF–SiNPs have multi-functional groups having hydrophilic interior and hydrophobic exterior and contain the nitrophenylfurfural moiety with excess of π-electrons as presented in Scheme 3. Hence, NPF–SiNPs, especially p-NPF–SiNPs, have more capacity to trap and adsorb all three types of materials (hydrophilic, hydrophobic as well as complex organic and inorganic molecules) present in the aqueous media. In this case, the interactions between the sulphonic acid and hydroxyl groups of TTZ with the nitro and hydroxyl groups of NPF–SiNPs exhibit robust hydrogen bonding. Moreover, the phenyl and furfural groups within the structure have affinity for the phenyl groups present in TTZ, further contributing to the adsorption mechanism. These interactions collectively suggest a multifaceted binding scenario that enhances the effectiveness of NPF–SiNPs in capturing TTZ type pollutants as demonstrated in Scheme 3.
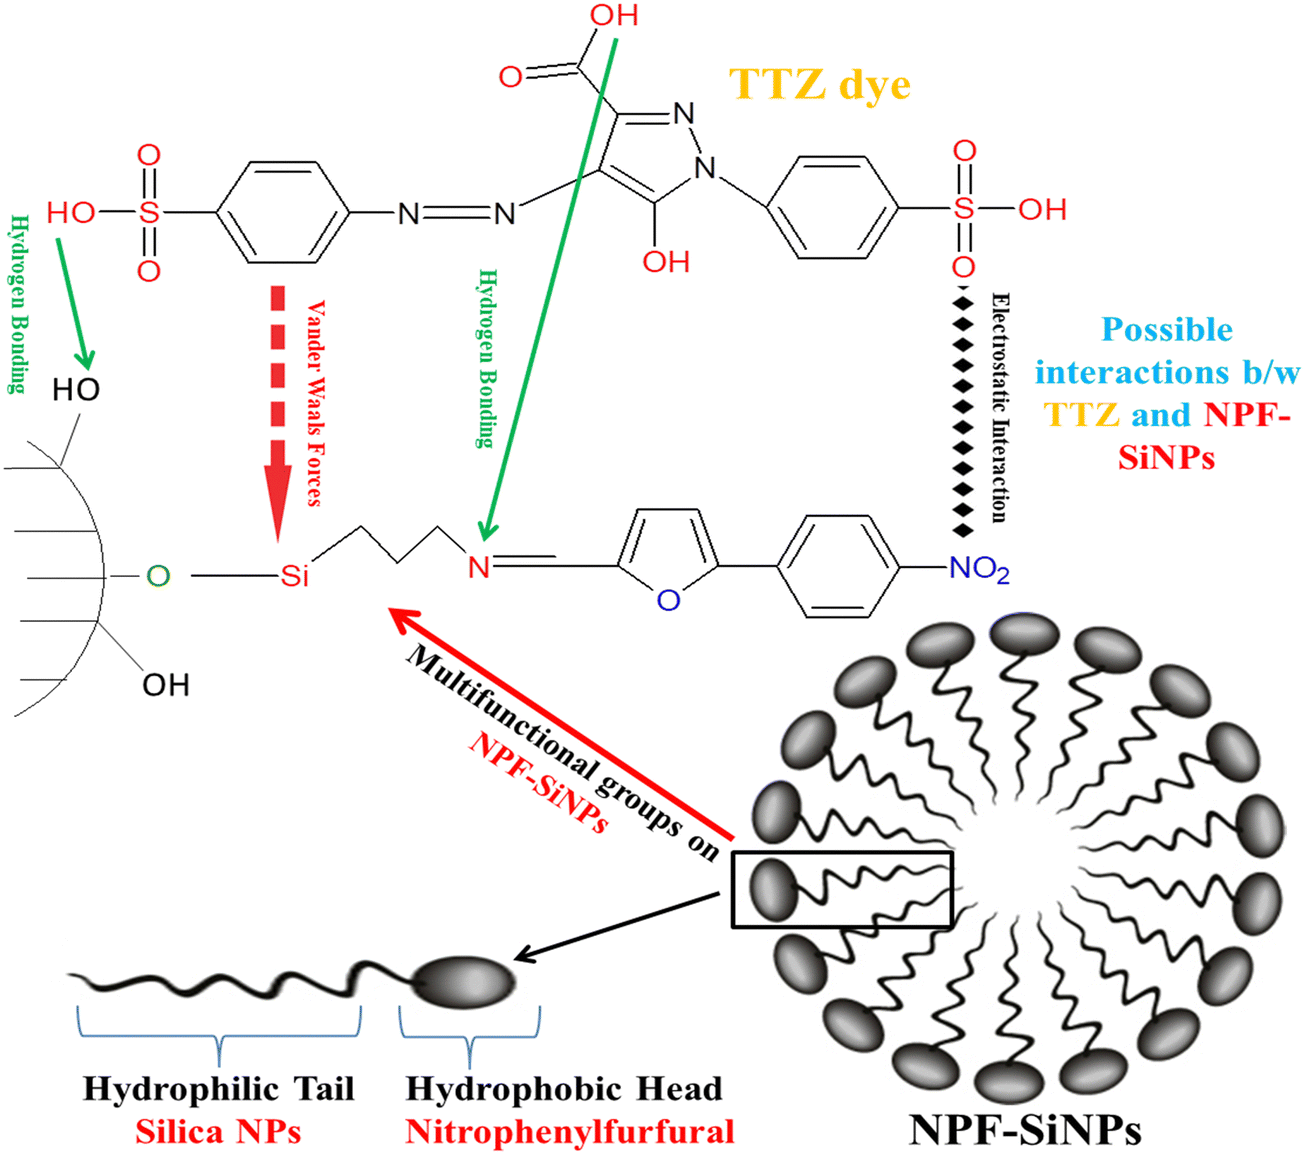 | ||
| Scheme 3 Mechanism of micelle formation and TTZ interactions with NPF–SiNPs. | ||
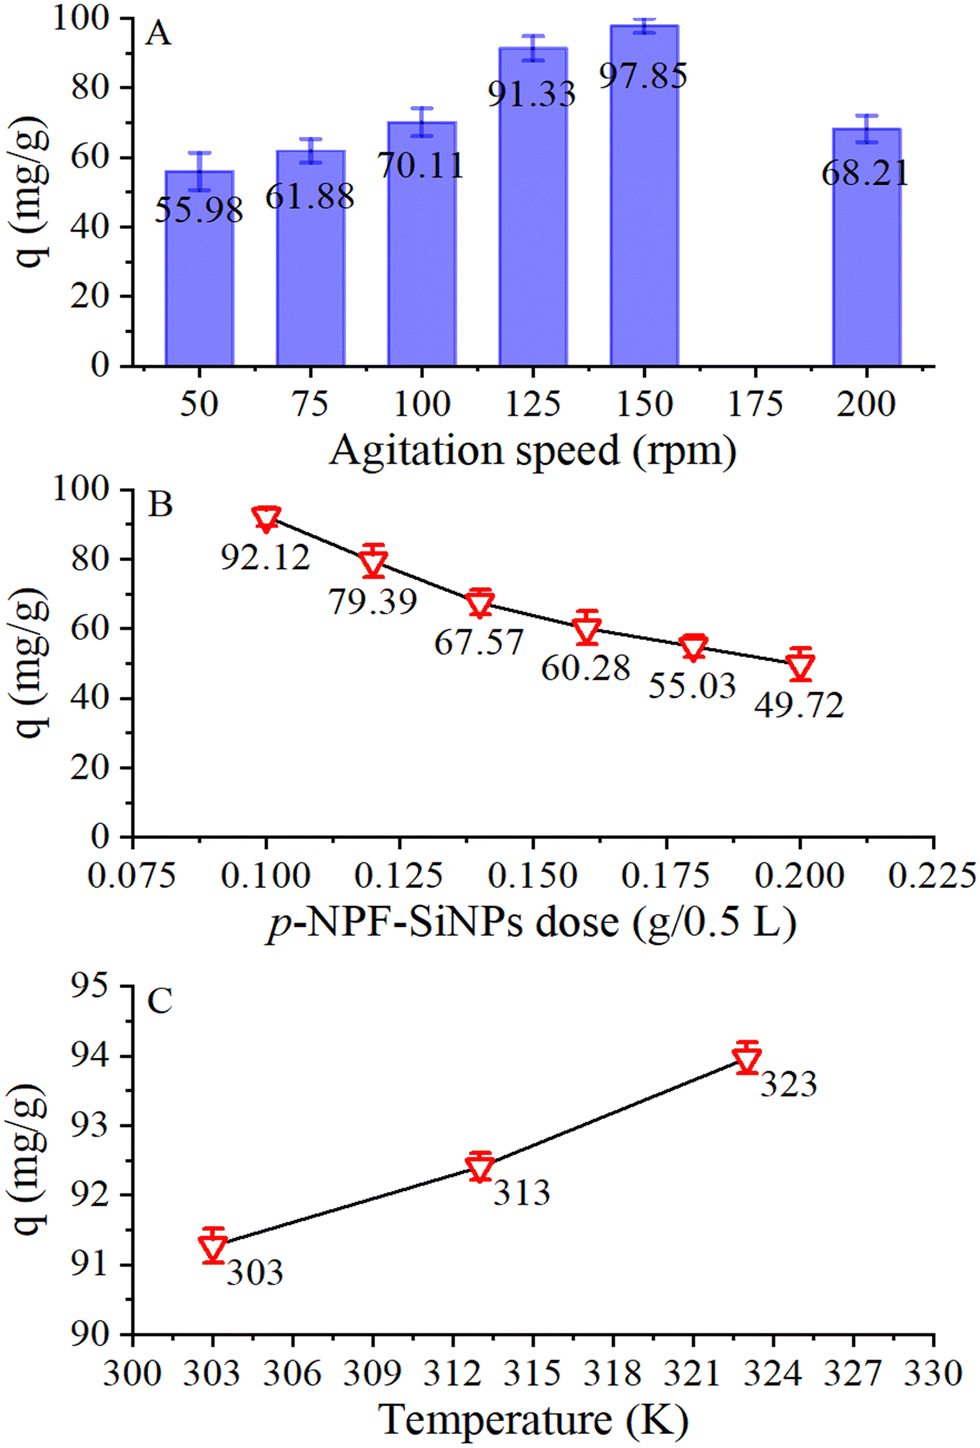 | ||
| Fig. 7 Effects of agitation speed (A), p-NPF–SiNP amount (B), and temperature (C) on adsorption of TTZ p-NPF–SiNPs. | ||
3.4. Study of adsorption isotherms for TTZ removal by p-NPF–SiNPs
For application of isotherm models, the experiments of initial TTZ concentrations were performed at three different temperatures (303, 313, 323 K) using the following conditions: p-NPF–SiNP amount, 20 mg; volume of each TTZ solution, 100 mL; pH, 4; TTZ concentration, 20–100 mg L−1. In Fig. S12 (ESI†), the results of these experiments are presented, which revealed that the removal of TTZ increased with the increase of TTZ initial concentration. Furthermore, it can be seen that the increase in temperature from 303 to 323 K resulted in a slight increase of TTZ adsorption, a similar behavior to that shown in Fig. 7C. To examine the adsorption behavior and the level of interaction between p-NPF–SiNPs (adsorbent) and TTZ (adsorbate), the two most common isotherm models (Langmuir and Freundlich) were applied. A brief description and nonlinear equations of these models are provided in Section S3 (ESI†).The non-linear fitting was used to compute the parameters as well as the coefficient of determination (r2) for both Langmuir and Freundlich models. The bL in L g−1 (Langmuir rate constant) and Qth in mg g−1 (theoretical adsorption capacity) were estimated from non-linear fitting of the Langmuir model (Fig. S13, ESI†), whereas KF in (mg g−1)(mg L−1)1/n and 1/n (adsorption intensity) were determined from non-linear fitting of the Freundlich model (Fig. S13, ESI†). The calculated values of parameters and r2 at 303 to 323 K are provided in Table 1. The r2 values obtained by fitting of the Langmuir model (0.9793 to 0.9921) were higher compared to those obtained by fitting of the Freundlich model (0.9359 to 0.9525), which reflected that the Langmuir model was well fitted to describe the mechanism of TTZ adsorption onto p-NPF–SiNPs at 303, 313, and 323 K. These results demonstrated that monolayer adsorption was predominant on the homogeneous surface of p-NPF–SiNPs. Additionally, the estimated values of n (6.292 to 8.132) were less than 10, which is a clear indication of favorable adsorption of TTZ onto p-NPF–SiNPs. Besides, q and Qth were in close agreement, which also demonstrated favorable monolayer adsorption of TTZ onto p-NPF–SiNPs.
| T (K) | Langmuir | Freundlich | |||||||||
|---|---|---|---|---|---|---|---|---|---|---|---|
| q | Q Th | b L | r 2 | RMSE | χ 2 | K F | n | r 2 | RMSE | χ 2 | |
| q (experimental adsorption capacity) in mg g−1; QTh (theoretical adsorption capacity) in mg g−1; bL in L mg−1; KF in (mg g−1)(mg L−1)1/n; RMSE = root mean square deviation; χ2 = chi square. | |||||||||||
| 303K | 190.2 | 197.3 | 0.526 | 0.9793 | 9.905 | 4.289 | 103.3 | 6.292 | 0.9390 | 17.09 | 13.46 |
| 313K | 198.5 | 198.0 | 1.156 | 0.9921 | 6.371 | 1.432 | 119.6 | 7.567 | 0.9525 | 15.59 | 10.68 |
| 323K | 202.5 | 203.5 | 1.396 | 0.9859 | 8.754 | 2.936 | 127.6 | 8.132 | 0.9359 | 18.72 | 15.08 |
To further confirm the validity of both models, the root mean square error (RMSE) and chi square (χ2) were calculated and are presented in Table 1. The lower values of χ2 (1.432 to 4.289) and RMSE (6.371 to 9.905) for the Langmuir model compared to those for the Freundlich model (χ2 10.68 to 15.08 and RMSE 15.59 to 18.72) again confirmed the suitability of the Langmuir model to explain the behavior of TTZ adsorption onto p-NPF–SiNPs.
3.5. Kinetics study of TTZ removal by p-NPF–SiNPs
For application of kinetics models, the kinetic experiments were performed at three different TTZ concentrations (20, 40, and 60 mg L−1) in the time range of 5 to 90 min by applying the following conditions (p-NPF–SiNP amount: 20 mg and volume of each TTZ solution: 100 mL, pH 4). The results of these experiments are presented in Fig. S12 (ESI†). Fig. S12 (ESI†) reveals that there was a linear increase in the adsorption of TTZ onto p-NPF–SiNPs when the time was increased from 5 to 25 min for all three concentrations, and thereafter equilibrium was established, and a high removal rate was not observed up to 90 min. Various kinetic models have been developed to understand the adsorption process and have a better description of rate controlling steps involved in adsorption. For the present study, the Lagergren pseudo-first (PF)-order and pseudo-second (PS)-order models as well as the intraparticle-diffusion (ID)-model were selected to interpret the rate of adsorption of TTZ onto p-NPF–SiNPs. The equations along with a brief description of the above-mentioned models are presented in Section S4 (ESI†).The linear fitting was used to calculate the parameters as well as the coefficient of determination (r2) for both models. The PF-order constants, K1 and qt1, were estimated from the slope and intercept of the plot between log (q–qt) and t (Fig. S14a, ESI†), whereas the PS-order constants, K2 and qt2, were computed from the intercept and slope of the plot between t/qt and t (Fig. S14b, ESI†). The calculated values of parameters and r2 at 20, 40 and 60 mg L−1 TTZ are provided in Table 2. The higher values of r2 (0.9995 to 0.9998) from the PS-order at all three TTZ concentrations indicated the best fitting of this model to data. Furthermore, the qt2 and qt values obtained using the PS-order model are in close agreement. Both these findings suggested that the PS-order model displayed a good fit to the experimental data obtained for TTZ adsorption onto p-NPF–SiNPs, indicating chemical adsorption as the rate limiting step. Moreover, the lower values of the PS-order constant, K2 (0.0081, 0.0036, and 0.0042 for 20, 40, and 60 mg L−1 TTZ) suggested smaller competition of surface sites for TTZ adsorption at low concentrations. Generally, the adsorption depends on both the adsorbent and the adsorbate involving chemisorption in addition to physisorption.
| Models | Parameters | Values | |||
|---|---|---|---|---|---|
| TTZ conc. (mg L−1) → | 20 | 40 | 60 | ||
| Pseudo 1st order | q t1 (mg g−1) | 11.48 | 38.56 | 26.08 | |
| K 1 (1 min−1) | −0.0852 | −0.0748 | −0.0617 | ||
| r 2 | 0.6787 | 0.9232 | 0.8271 | ||
| Experimental | q t (mg g−1) | 91.15 | 179.5 | 192.8 | |
| Pseudo 2nd order | q t2 (mg g−1) | 93.46 | 185.2 | 196.1 | |
| K 2 (g mg−1 min−1) | 0.0081 | 0.0036 | 0.0042 | ||
| r 2 | 0.9995 | 0.9998 | 0.9998 | ||
| Intraparticle diffusion | Region I | K i (mg g−1 min−0.5) | 4.755 | 10.65 | 10.87 |
| C | 64.85 | 121.7 | 134.9 | ||
| Region II | K i (mg g−1 min−0.5) | 0.052 | 0.868 | 0.380 | |
| C | 90.68 | 171.7 | 189.1 | ||
When TTZ in solution was mixed with p-NPF–SiNPs, the TTZ molecules were transported by diffusion into the pores of p-NPF–SiNPs through the interface between the solution and adsorbent. This diffusion mechanism can be explained through the ID-model, whose constants Ki and C were calculated from the slope and intercept of the qtvs. t1/2 graph (Fig. 8). The values of the ID-model are tabulated in Table 2. The plot of qtvs. t1/2 is not linear instead it has two linear regions, which indicated that other mechanisms are involved in addition to intraparticle diffusion. The first region indicated external surface adsorption/boundary layer effects, where a large amount of TTZ was rapidly adsorbed on the exterior surface of p-NPF–SiNPs. The higher values of C indicated the same predominant boundary effect. The second region illustrated slow TTZ adsorption onto p-NPF–SiNPs, which involved intraparticle or pore diffusion. Additionally, the linear line in the ID-model plot did not pass through the origin, which again confirmed that more than one process is involved in TTZ adsorption.
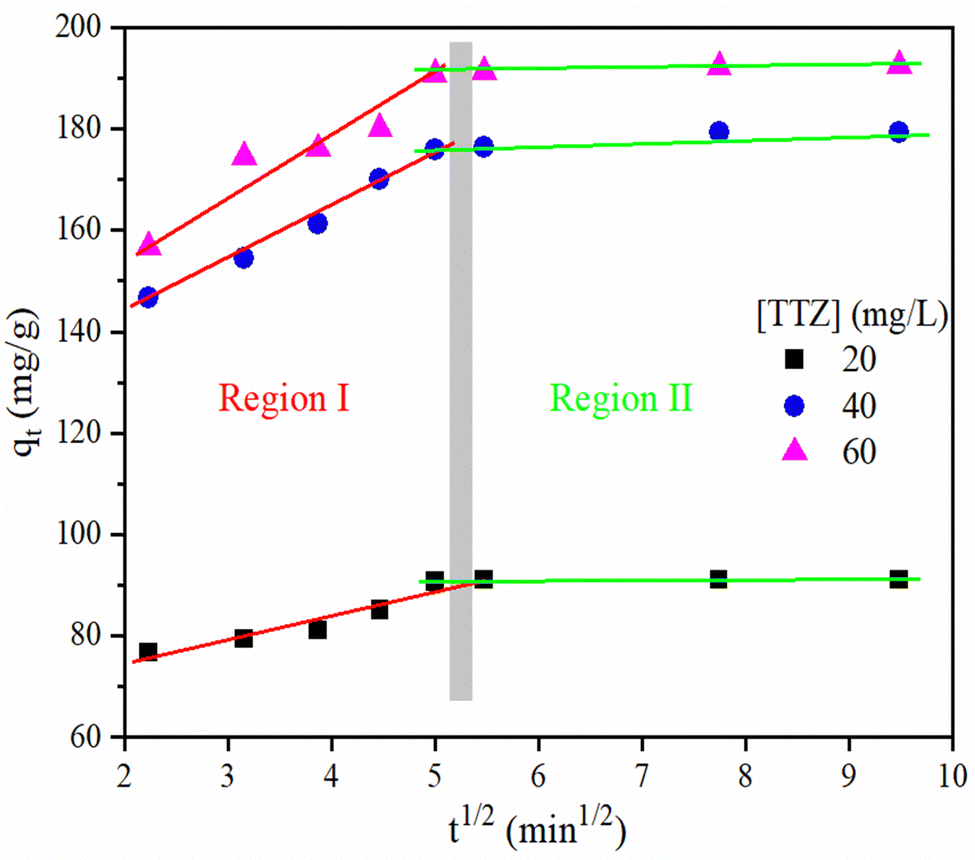 | ||
| Fig. 8 Application of the ID-model to TTZ adsorption data using p-NPF–SiNPs. | ||
3.6. Adsorption thermodynamics study
The effect of temperature on adsorption of TTZ onto p-NPF–SiNPs was determined by performing adsorption experiments at 303, 313, and 323 K under optimized conditions (p-NPF–SiNP amount: 20 mg, volume of each TTZ solution: 100 mL, and pH: 4). The results showed that when the temperature increased from 313 to 323 K, a slight increase in the adsorption capacity of p-NPF–SiNPs for TTZ removal was observed as shown in Fig. S12 (ESI†). The mounting adsorption tendency at higher temperatures depicted that the adsorption of TTZ followed the endothermic process, suggesting a predominant chemisorption phenomenon.Obtained TTZ adsorption data at different temperatures were further used to determine thermodynamic parameters, such as enthalpy (ΔH), entropy (ΔS), and standard Gibbs free energy (ΔG°), to investigate the feasibility, nature, and thermodynamic behavior of TTZ adsorbed onto NPF–SiNPs. The thermodynamic parameters were computed using equations presented in Section S5 (ESI†). The slope and intercept of the plot of Kdvs. 1/T (Fig. S15, ESI†) were used to estimate the values of ΔH and ΔS respectively, whereas equation (S8) as presented in Section S5 (ESI†) was applied to calculate the values of ΔG°. To make Kd dimensionless, the Langmuir constant (L mg−1) was first converted to L mol−1 and then these values were put in equation (1) as discussed in ref. 51.
| Kd = molecular weight of TTZ × 55.51 (mol L−1) × bL × 1000 | (1) |
| Parameters | Temperature (K) | |
|---|---|---|
| ΔH (kJ mol−1) | 39.85 ± 4.74 | |
| ΔS (J mol−1 K−1) | 269.9 ± 16.1 | |
| ΔG° (kJ mol−1) | 303 | −41.69 ± 0.164 |
| 313 | −45.12 ± 0.257 | |
| 323 | −47.06 ± 0.486 |
Table S5 (ESI†) displays a comparison of the adsorption uptake capacity of p-NPF–SiNPs for TTZ with other modified/unmodified materials. It is obvious that p-NPF–SiNPs exhibited a higher and comparable affinity for TTZ as compared with the majority of the modified adsorbents used for TTZ adsorption. This depicts the potential application of p-NPF–SiNPs as an efficient adsorbent for the removal of TTZ from contaminated wastewater as well as provides different ways to modify the nanomaterials with different organic entities to enhance the properties of nanocatalysts.
3.7. Adsorption mechanism
TTZ adsorption onto p-NPF–SiNPs was investigated on the molecular level using Monte Carlo and molecular dynamic simulations. Frenkel and Smit have provided descriptions of the fundamental ideas behind MC and MD simulations.54 The p-NPF–SiNPs' TTZ desorption sites were located using the MC simulation. The MD simulations of the MC's lowest-energy structures were carried out in explicit water to determine how the solvent molecules in the environment would affect the TTZ adsorption.Fig. 9a depicts the TTZ's dry solution surface adsorption on p-NPF–SiNPs (no solvent). Because p-NPF–SiNPs have several HB donor and acceptor sites, the TTZ molecule has created numerous hydrogen bonds with the hydroxide or –NH groups on its surface. The hydroxyl hydrogen atoms on the p-NPF–SiNP surface interacted with the oxygen and nitrogen atoms of the amino group to generate HBs. In addition, hydroxyl hydrogen atoms, amine nitrogen atoms, and hydroxyl oxygen atoms with keto groups have been used to generate intramolecular HBs within TTZ. The adsorption of TTZ was analyzed using the two-layer model shown in Fig. 9b to determine whether TTZ can bind to the Si ions of the adsorbent. The Si ions have a variety of free connections in the two layer model. Si ions with different free connections can be found at each sheet's edge. For instance, there are no free bonds, two free bonds, and three free bonds on metal ion-containing edges, respectively. Additionally, it was demonstrated that the functional groups of TTZ molecules create intramolecular hydrogen interactions with one another.
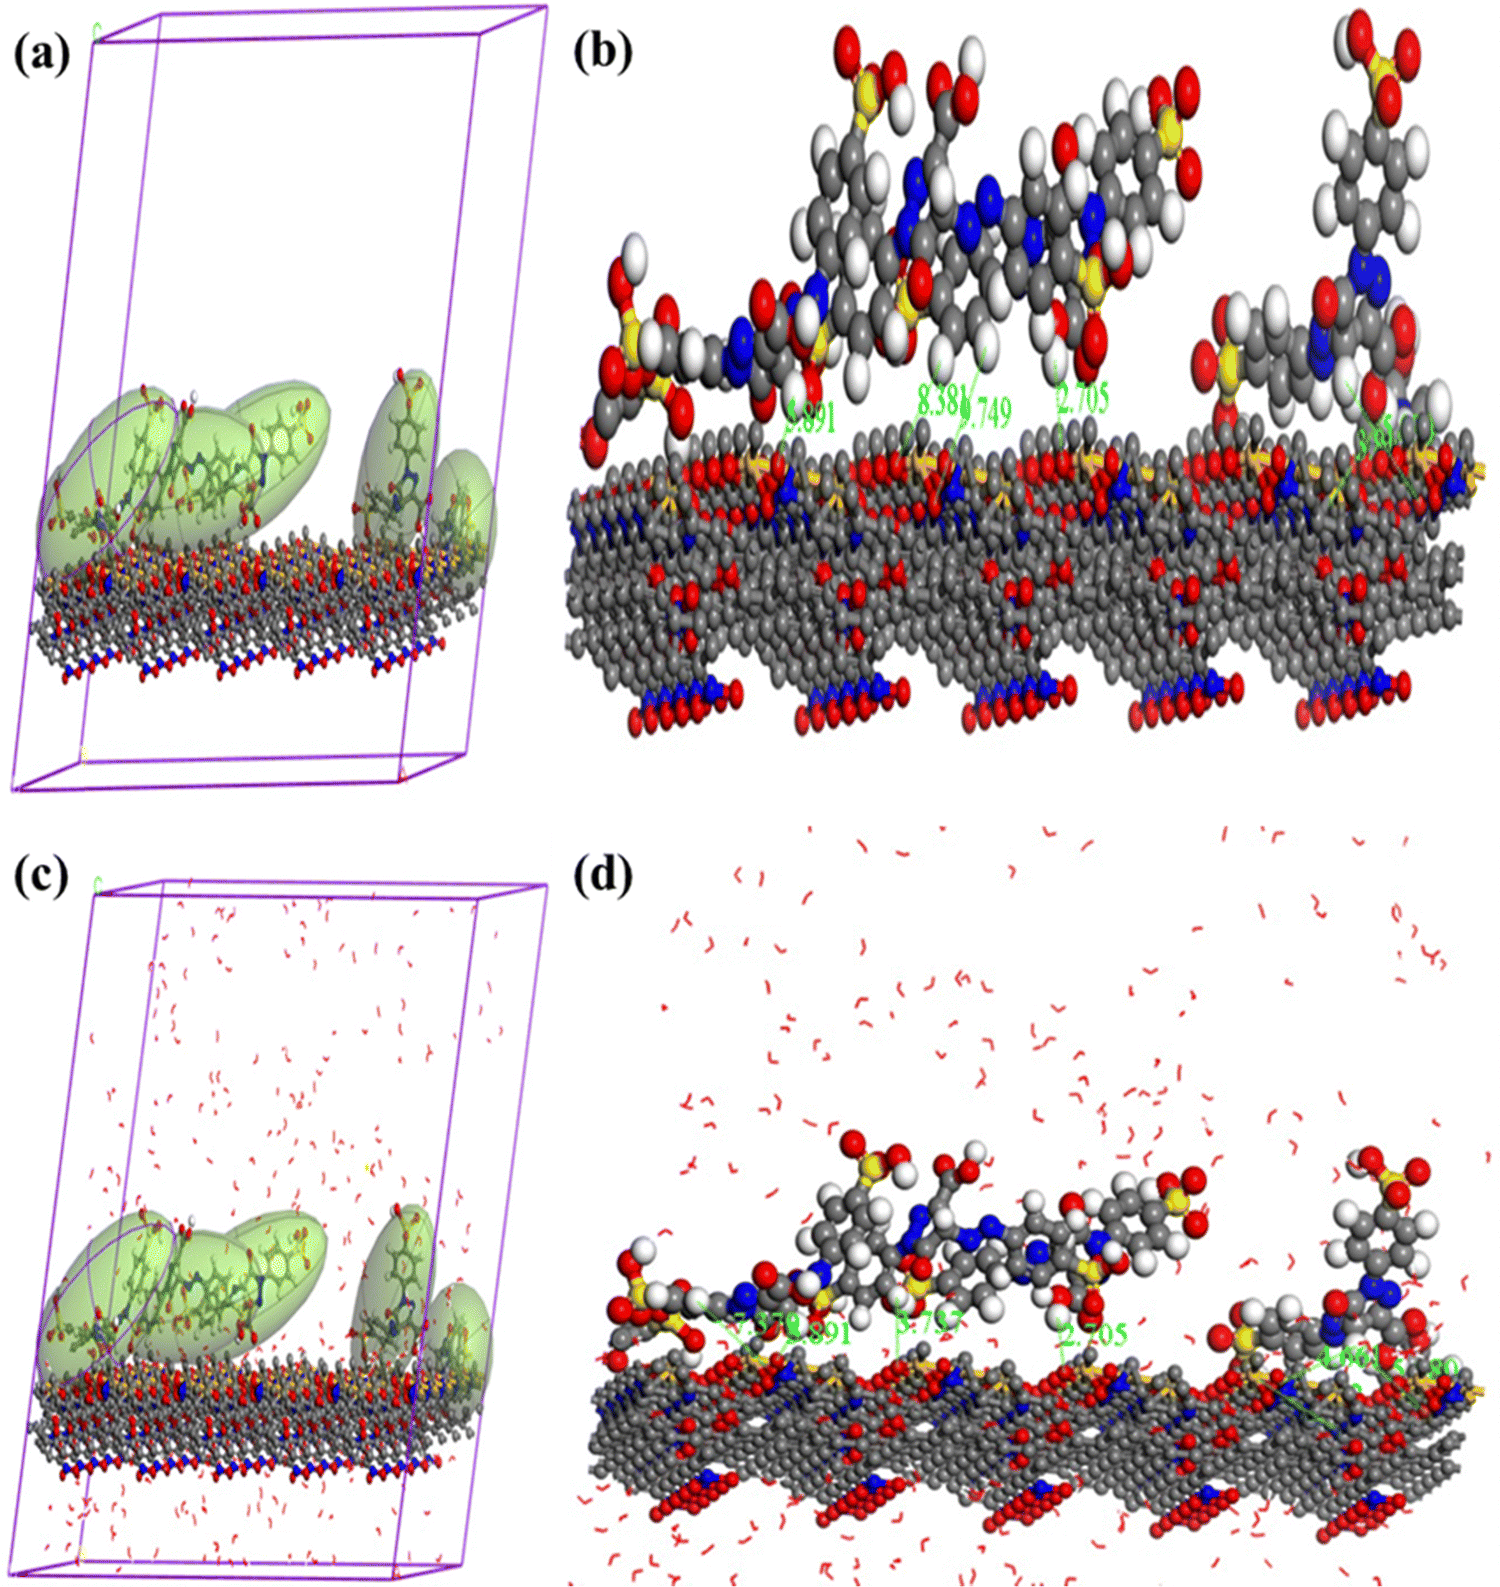 | ||
| Fig. 9 The lowest-energy configurations of the TTZ molecule on the p-NPF–SiNPs' surface under dry condition (a) and (b) and MD images of the TTZ molecule being adsorbed on the p-NPF–SiNPs' surface in water (c) and (d). For clarity, TTZ is presented in polyhedron form and the bond length is given in angstroms. | ||
Fig. 9c depicts TTZ adsorption on the p-NPF–SiNP surface in the presence of water as well as MD snapshots for the two-layer models. The HO–Zn groups, keto, and hydroxyl groups of the TTZ molecule form HBs when it adheres to the p-NPF–SiNP surface in water (Fig. 9c). The tertiary and primary amine groups do not generate HBs on the p-NPF–SiNP surface. The coordination connections that the TTZ molecule made with Zn2+ atoms in water are shown in Fig. 9d. Both intramolecular and intermolecular HBs between the functional groups of the TTZ molecule and the water molecules in both water systems were observed. In light of this, the MD simulations show that TTZ interacts with p-NPF–SiNPs even in the presence of water molecules.55
4. Conclusion
Nitrophenylfurfural (a heterocyclic organic molecule) was successfully incorporated onto the AFSi-NPs to form hybrid, multifunctional, and narrow dispersed nanoparticles (NPF–SiNPs). XRD, FTIR, TGA and elemental analysis results revealed that the maximum loading of nitrophenylfurfural onto the silica surface was observed in the case of p-nitrophenylfurfural due to the higher reactivity of the para substituent. The adsorption isotherm curves as revealed by BET results showed that all samples exhibited a noticeably long straight-line segment, suggesting monolayer adsorption phenomenon domination, which further confirmed the completion of monolayer after modification (a high surface area of 80 m2 g−1 for p-NPF–SiNPs). The particle size of the monolayer formed was between 600 and 750 nm before grafting and between 700 and 850 nm after grafting of p-nitrophenylfurfural as reflected by the SEM image, signifying the presence of modified silica necessary for effective adsorption. A further study was conducted to determine the adsorptive potential of modified silica nanoparticles for adsorptive removal of TTZ from aqueous media. The high surface area of p-NPF–SiNPs (80 m2 g−1) with higher adsorption capacity was found to be due to the presence of multifunctional groups on them. The highest adsorption of TTZ onto p-NPF–SiNPs was found at pH 4, a shaking speed of 150 rom, a p-NPF–SiNP amount of 0.1 g/0.5 L, and a temperature of 323 K. The maximum Langmuir adsorption capacity was estimated to be 203.5 mg g−1 at 323 K for TTZ removal by p-NPF–SiNPs. The adsorption process was followed by Langmuir and PS-order models. p-NPF–SiNPs have three different types of functional characteristics. Their interior is hydrophilic and exterior is hydrophobic in nature and they contain the nitrophenylfurfural moiety with excess of π-electrons. Hence, p-NPF–SiNPs have more capacity to trap and adsorb all three types of materials (hydrophilic, hydrophobic as well as complex organic and inorganic molecules) present in the aqueous media. It can thus be concluded that the excellent adsorption performance in the case of TTZ reveals that as prepared multifunctional p-NPF–SiNPs have promising applications in efficient wastewater treatment.Author contributions
Syed Salman Shafqat: writing – original draft, methodology; Bushra Zafar: investigation; Syeda Amna Masood: writing – reviewing and editing; Syed Rizwan Shafqat: data curation; Hafeez Ullah Khan: software; Asad Syed: funding acquisition; Ali H. Bahkali: validation; Sadaf Mutahir: visualization; Muhammad Asim Khan: formal analysis; Guobao Xu: resources, writing – reviewing and editing; Muhammad Nadeem Zafar: conceptualization, supervision, project administration.Data availability
The authors confirm that the data supporting the findings of this study are available within the article and its ESI.†Conflicts of interest
The authors declare no competing interest.Acknowledgements
We gratefully acknowledge Higher Education Commission Pakistan for supporting this work under the grant no. SRGP 1390. The authors extend their appreciation to the Researcher Supporting Project number (RSP2024R15), King Saud University Riyadh, Saudi Arabia. We are grateful for financial support from the Chinese Academy of Sciences (CAS) President's International Fellowship Initiative (PIFI) program for Visiting Scientists (Grant No. 2024PVB0003). MNZ acknowledges the CAS for the grant of the “President's International Fellowship Initiative (PIFI)” award.References
- T. W. Seow and C. K. Lim, Removal of dye by adsorption: a review, Int. J. Appl. Eng. Res., 2016, 11, 2675–2679 Search PubMed.
- M. Manyangadze, N. H. M. Chikuruwo, T. B. Narsaiah, C. S. Chakra, M. Radhakumari and G. Danha, Enhancing adsorption capacity of nano-adsorbents via surface modification: A review, S. Afr. J. Chem. Eng., 2020, 31, 25–32 Search PubMed.
- Z. Gricius and G. Øye, Recent advances in the design and use of Pickering emulsions for wastewater treatment applications, Soft Matter, 2023, 19, 818–840 RSC.
- R. V. Kandisa, K. V. N. Saibaba, K. B. Shaik and R. Gopinath, Dye removal by adsorption: a review, J. Biorem. Biodegrad., 2016, 7, 1000371 Search PubMed.
- E. Forgacs, T. Cserháti and G. Oros, Removal of synthetic dyes from wastewaters: a review, Environ. Int., 2004, 30, 953–971 CrossRef CAS PubMed.
- C. H. Lin, J. R. Deka, C. E. Wu, C. H. Tsai, D. Saikia, Y. C. Yang and H. M. Kao, Bifunctional Cage-Type Cubic Mesoporous Silica SBA-1 Nanoparticles for Selective Adsorption of Dyes, Chem. – Asian J., 2017, 12, 1314–1325 CrossRef CAS.
- J. O. D. Malafatti, F. A. Tavares, T. R. Neves, B. C. Mascarenhas, S. Quaranta and E. C. Paris, Modified Silica Nanoparticles from Rice Husk Supported on Polylactic Acid as Adsorptive Membranes for Dye Removal, Materials, 2023, 16, 2429 CrossRef CAS.
- A. Salama, Novel Cellulose/Silica Microspheres as Sustainable and Efficient Adsorbents for Methyl Orange Removal, Fibers Polym., 2023, 24, 1333–1343 CrossRef CAS.
- A. Wasti and M. Ali Awan, Adsorption of textile dye onto modified immobilized activated alumina, J. Assoc. Arab Univ. Basic Appl. Sci., 2016, 20, 26–31 Search PubMed.
- H. Mahilary and A. Dey, Preparation and application of carboxylated and mechanically attrited carbon for adsorptive removal of crystal violet dye, Environ. Sci.: Water Res. Technol., 2023, 9, 861–882 RSC.
- B. Wang, J. Lan, C. Bo, B. Gong and J. Ou, Adsorption of heavy metal onto biomass-derived activated carbon, RSC Adv., 2023, 13, 4275–4302 RSC.
- J. U. Ani, K. G. Akpomie, U. C. Okoro, L. E. Aneke, O. D. Onukwuli and O. T. Ujam, Potentials of activated carbon produced from biomass materials for sequestration of dyes, heavy metals, and crude oil components from aqueous environment, Appl. Water Sci., 2020, 10, 69 CrossRef CAS.
- A. Kausar, M. Iqbal, A. Javed, K. Aftab, H. N. Bhatti and S. Nouren, Dyes adsorption using clay and modified clay: A review, J. Mol. Liq., 2018, 256, 395–407 CrossRef CAS.
- S. P. Markandeya, N. Shukla, D. Dhiman, G. C. Mohan and S. R. Kisku, An Efficient Removal of Disperse Dye from Wastewater Using Zeolite Synthesized from Cenospheres, J. Hazard., Toxic Radioact. Waste, 2017, 21, 04017017 CrossRef.
- M. N. Zafar, Q. Dar, F. Nawaz, M. N. Zafar, M. Iqbal and M. F. Nazar, Effective adsorptive removal of azo dyes over spherical ZnO nanoparticles, J. Mater. Res. Technol., 2019, 8, 713–725 CrossRef CAS.
- I. Anastopoulos and G. Z. Kyzas, Agricultural peels for dye adsorption: a review of recent literature, J. Mol. Liq., 2014, 200, 381–389 CrossRef CAS.
- T. Ribeiro, C. Baleizão and J. P. S. Farinha, Functional films from silica/polymer nanoparticles, Materials, 2014, 7, 3881–3900 CrossRef.
- J. P. Matinlinna, C. Y. K. Lung and J. K. H. Tsoi, Silane adhesion mechanism in dental applications and surface treatments: A review, Dent. Mater., 2018, 34, 13–28 CrossRef CAS.
- Y. Wang, Q. Zhao, N. Han, L. Bai, J. Li, J. Liu, E. Che, L. Hu, Q. Zhang and T. Jiang, Mesoporous silica nanoparticles in drug delivery and biomedical applications, Nanomedicine, 2015, 11, 313–327 CrossRef CAS.
- P. Aggarwal, R. P. Singh and Y. Aggarwal, Use of nano-silica in cement based materials—A review, Cogent Engineering, 2015, 2, 1078018 CrossRef.
- Z. Li, Y. Zhang and N. Feng, Mesoporous silica nanoparticles: synthesis, classification, drug loading, pharmacokinetics, biocompatibility, and application in drug delivery, Expert Opin. Drug Delivery, 2019, 16, 219–237 CrossRef CAS.
- A. Behzadi and A. Mohammadi, Environmentally responsive surface-modified silica nanoparticles for enhanced oil recovery, J. Nanopart. Res., 2016, 18, 266 CrossRef.
- R. F. Mansa, C. S. Sipaut, I. A. Rahman, N. S. M. Yusof and M. Jafarzadeh, Preparation of glycine–modified silica nanoparticles for the adsorption of malachite green dye, J. Porous Mater., 2016, 23, 35–46 CrossRef.
- J. T. Park, J. A. Seo, S. H. Ahn, J. H. Kim and S. W. Kang, Surface modification of silica nanoparticles with hydrophilic polymers, J. Ind. Eng. Chem., 2010, 16, 517–522 CrossRef.
- T. Jesionowski and A. Krysztafkiewicz, Preparation of the hydrophilic/hydrophobic silica particles, Colloids Surf., A, 2002, 207, 49–58 CrossRef.
- Y. Lei, G. Yang, Q. Huang, J. Dou, L. Dai, F. Deng, M. Liu, X. Li, X. Zhang and Y. Wei, Facile synthesis of ionic liquid modified silica nanoparticles for fast removal of anionic organic dyes with extremely high adsorption capacity, J. Mol. Liq., 2022, 347, 117966 CrossRef CAS.
- E. Da’na, Nano-Silica Modified with Diamine for Capturing Azo Dye from Aqueous Solutions, Molecules, 2022, 27, 3366 CrossRef.
- T. D. Pham, V. P. Bui, T. N. Pham, T. M. D. Le, K. T. Nguyen, V. H. Bui and T. D. Nguyen, Adsorptive Removal of Anionic Azo Dye New Coccine Using Silica and Silica-gel with Surface Modification by Polycation, Polymers, 2021, 13, 1536 CrossRef CAS.
- A. Erigoni and U. Diaz, Porous Silica-Based Organic-Inorganic Hybrid Catalysts: A Review, Catalysts, 2021, 11, 79 CrossRef CAS.
- V.-C. Niculescu, Mesoporous Silica Nanoparticles for Bio-Applications, Front. Mater., 2020, 7, 36 CrossRef.
- E. N. Ngouangna, M. A. Manan, J. O. Oseh, M. N. A. M. Norddin, A. Agi and A. O. Gbadamosi, Influence of (3–Aminopropyl) triethoxysilane on silica nanoparticle for enhanced oil recovery, J. Mol. Liq., 2020, 315, 113740 CrossRef.
- J. Chen, Y. Sheng, Y. Song, M. Chang, X. Zhang, L. Cui, D. Meng, H. Zhu, Z. Shi and H. Zou, Multimorphology mesoporous silica nanoparticles for dye adsorption and multicolor luminescence applications, ACS Sustainable Chem. Eng., 2018, 6, 3533–3545 CrossRef.
- H. O. Chukwuemeka-Okorie, F. K. Ekuma, K. G. Akpomie, J. C. Nnaji and A. G. Okereafor, Adsorption of tartrazine and sunset yellow anionic dyes onto activated carbon derived from cassava sievate biomass, Appl. Water Sci., 2021, 11, 27 CrossRef.
- B. Liu and Z. Zhang, One-Pot Conversion of Carbohydrates into Furan Derivatives via Furfural and 5-Hydroxylmethylfurfural as Intermediates, ChemSusChem, 2016, 9, 2015–2036 CrossRef PubMed.
- M. M. Varshney, A. Husain and V. Parcha, Synthesis, characterization, in vitro antimicrobial, and anthelmintic evaluations of 2-(4-chloro-3-methylphenoxy)-N′-[{5′-(substituted aryl)-furan-2′-yl}-methylidene]-acetohydrazides, Med. Chem. Res., 2014, 23, 4034–4041 CrossRef CAS.
- T. M. Suzuki, T. Nakamura, K. Fukumoto, M. Yamamoto, Y. Akimoto and K. Yano, Direct synthesis of amino-functionalized monodispersed mesoporous silica spheres and their catalytic activity for nitroaldol condensation, J. Mol. Catal. A: Chem., 2008, 280, 224–232 CrossRef CAS.
- M. M. Varshney, A. Husain and V. Parcha, Synthesis and characterization of 5-(substituted phenyl)-2-furfuraldehydes from substituted anilines, World J. Pharmacy Pharm. Sci., 2013, 2, 1802–1806 CAS.
- M. A. Wani, J. A. Farooqi and W. A. Shah, Synthesis and antimicrobial activity of some furfural substituted bisdimedone derivatives, J. Pharm. Appl. Chem., 2016, 2, 89–93 Search PubMed.
- O. Sadek, S. Reda and R. Al-Bilali, Preparation and Characterization of Silica and Clay-Silica Core-Shell Nanoparticles Using Sol-Gel Method, Adv. Nanoparticles, 2013, 2, 165–175 CrossRef.
- X. Wang, K. S. Lin, J. C. Chan and S. Cheng, Direct synthesis and catalytic applications of ordered large pore aminopropyl-functionalized SBA-15 mesoporous materials, J. Phys. Chem. B, 2005, 109, 1763–1769 CrossRef CAS PubMed.
- B. M. Estevão, I. Miletto, N. Hioka, L. Marchese and E. Gianotti, Mesoporous silica nanoparticles functionalized with amino groups for biomedical applications, ChemistryOpen, 2021, 10, 1251–1259 CrossRef PubMed.
- G. Shen, A. Horgan and R. Levicky, Reaction of N-phenyl maleimide with aminosilane monolayers, Colloids Surf., B, 2004, 35, 59–65 CrossRef.
- P. Vejayakumaran, I. Rahman, C. Sipaut, J. Ismail and C. Chee, Structural and thermal characterizations of silica nanoparticles grafted with pendant maleimide and epoxide groups, J. Colloid Interface Sci., 2008, 328, 81–91 CrossRef PubMed.
- V. Nairi, S. Medda, M. Piludu, M. F. Casula, M. Vallet-Regì, M. Monduzzi and A. Salis, Interactions between bovine serum albumin and mesoporous silica nanoparticles functionalized with biopolymers, Chem. Eng. J., 2018, 340, 42–50 CrossRef.
- L. Usgodaarachchi, C. Thambiliyagodage, R. Wijesekera and M. G. Bakker, Synthesis of mesoporous silica nanoparticles derived from rice husk and surface-controlled amine functionalization for efficient adsorption of methylene blue from aqueous solution, Curr. Res. Green Sustainable Chem., 2021, 4, 100116 CrossRef.
- S. S. Shafqat, A. A. Khan, M. N. Zafar, M. H. Alhaji, K. Sanaullah, S. R. Shafqat, S. Murtaza and S. C. Pang, Development of amino-functionalized silica nanoparticles for efficient and rapid removal of COD from pre-treated palm oil effluent, J. Mater. Res. Technol., 2019, 8, 385–395 CrossRef CAS.
- M. Naderi, Surface Area: Brunauer–Emmett–Teller (BET), in Progress in filtration and separation, Elsevier, 2015, pp. 585–608 Search PubMed.
- M. Wawrzkiewicz and Z. Hubicki, Removal of tartrazine from aqueous solutions by strongly basic polystyrene anion exchange resins, J. Hazard. Mater., 2009, 164, 502–509 CrossRef CAS PubMed.
- Y. C. Sharma, Optimization of parameters for adsorption of methylene blue on a low-cost activated carbon, J. Chem. Eng. Data, 2010, 55, 435–439 CrossRef CAS.
- E. Demirbas, M. Kobya and M. T. Sulak, Adsorption kinetics of a basic dye from aqueous solutions onto apricot stone activated carbon, Bioresour. Technol., 2008, 99, 5368–5373 CrossRef CAS.
- E. C. Lima, A. Hosseini-Bandegharaei, J. C. Moreno-Piraján and I. Anastopoulos, A critical review of the estimation of the thermodynamic parameters on adsorption equilibria. Wrong use of equilibrium constant in the Van't Hoof equation for calculation of thermodynamic parameters of adsorption, J. Mol. Liq., 2019, 273, 425–434 CrossRef CAS.
- M. Arshadi, F. SalimiVahid, J. Salvacion and M. Soleymanzadeh, Adsorption studies of methyl orange on an immobilized Mn-nanoparticle: kinetic and thermodynamic, RSC Adv., 2014, 4, 16005–16017 RSC.
- J. Shu, Z. Wang, Y. Huang, N. Huang, C. Ren and W. Zhang, Adsorption removal of Congo red from aqueous solution by polyhedral Cu2O nanoparticles: kinetics, isotherms, thermodynamics and mechanism analysis, J. Alloys Compd., 2015, 633, 338–346 CrossRef CAS.
- H. Ferkous, K. Rouibah, N.-E.-H. Hammoudi, M. Alam, C. Djilani, A. Delimi, O. Laraba, K. K. Yadav, H.-J. Ahn, B.-H. Jeon and Y. Benguerba, The Removal of a Textile Dye from an Aqueous Solution Using a Biocomposite Adsorbent, Polymers, 2022, 14, 2396 CrossRef CAS PubMed.
- M. Ikram, S. Mutahir, M. Humayun, M. A. Khan, J. Y. Al-Humaidi, M. S. Refat and A. S. Abouzied, Facile Synthesis of ZIF-67 for the Adsorption of Methyl Green from Wastewater: Integrating Molecular Models and Experimental Evidence to Comprehend the Removal Mechanism, Molecules, 2022, 27, 8385 CrossRef PubMed.
Footnote |
| † Electronic supplementary information (ESI) available. See DOI: https://doi.org/10.1039/d4ma00618f |
| This journal is © The Royal Society of Chemistry 2024 |