 Open Access Article
A step towards a green and sustainable method to understand the effect of glucose on a silica filled natural rubber composite
Abhijit
Bera†
a,
Masaki
Yamano†
b,
Seiichi
Kawahara‡
*b and
Santanu
Chattopadhyay
 *ab
*ab
aRubber Technology Centre, Indian Institute of Technology Kharagpur, Kharagpur, 721302, WB, India. E-mail: santanuchat71@yahoo.com; Tel: +91-9434055304
bDepartment of Materials Science and Bioengineering, Nagaoka University of Technology, Nagaoka, Niigata 940-2188, Japan. E-mail: kawahara@mst.nagaokaut.ac.jp
First published on 6th August 2024
Abstract
In the present scenario, the world is concerned about producing more environmentally friendly and sustainable products by reducing the carbon footprint, especially in elastomer products. Therefore, the incorporation of maximum naturally produced white fillers like silica into a naturally originated elastomer, i.e., natural rubber (NR), is the ultimate aim of most of the rubber industries. However, adding a bio-based carbohydrate (glucose) into a silica-filled NR matrix facilitates the dispersion of the silica filler into NR, making the product greener and more sustainable. The interaction between the functional groups (amine) of NR and carbonyl groups of glucose is known as the Maillard reaction, which interestingly exhibited a significant improvement in both mechanical and dynamic properties of the NR vulcanizates due to the superior dispersion of silica in the NR matrix, as confirmed by detailed FIB-SEM and AFM analyses. The contribution of the Maillard reaction to crosslinking and network formation between the polymer–polymer and polymer–filler is validated by an in-depth rubber state 13C NMR study.
1. Introduction
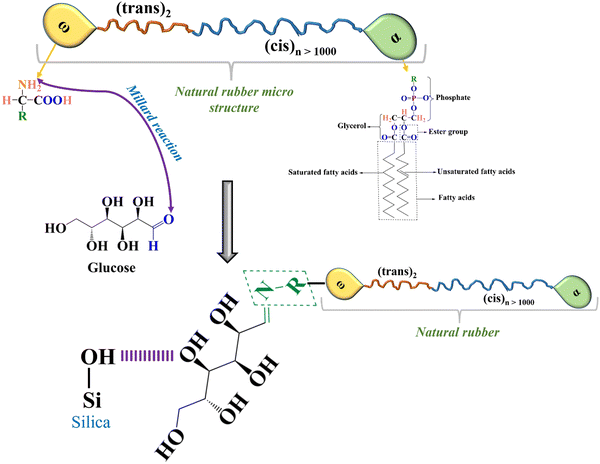
Natural rubber (NR) is purely a sustainable material since it is a green elastomer derived from mother nature (rubber tree: Hevea brasiliensis). This naturally occurring elastomer has superior dynamic and mechanical properties compared to synthetic elastomers, including green strength, tear strength, tensile strength, excellent growth resistance, and minimal heat buildup.1,2 The main factor contributing to the superior mechanical capabilities of NR is the development of strain-induced crystallization in the elastomer during the tensile test.3,4 According to the detailed analysis of the NR elastomer, the structure of rubber hydrocarbon starts with the ω-terminal coupled to two units of trans 1,4-isoprene, followed by a lengthy series pattern of cis 1,4-isoprene units (>1000 units), and finally the α-terminal. The long chain of fatty acid ester groups forms a chemical link between the phospholipid and α-terminal. On the other hand, the physical links make a bridge to join the protein and ω-terminal.5–8 In the case of the NR matrix, integration and dispersion of polar fillers like silica are exceedingly difficult due to the presence of the functional groups of proteins and phospholipids. The surface of amorphous silica particles is covered with silanol groups and siloxane bridges, causing them to aggregate through hydrogen bonding. Due to poor compatibility, silica does not mix with NR as easily as carbon black. To reduce flocculation and improve dispersion and filler–polymer interaction, coupling agents are used. These agents create bonds between silica and rubber, acting as interconnecting bridges.9–11 A more environmentally friendly and long-lasting rubber product is one wherein the silica filler has been used to replace as much carbon black (CB) as possible. Manufacturing green tyres, in particular, benefits greatly from the combination of improved dispersion and greater silica loading in terms of essential rubber product properties.12,13Many researchers have proposed various ideas and technologies over the past few decades to solve this critical problem and produce green tyres. One method involves forming a chemical attachment between silica and NR using alkoxyl, poly-sulphide, or alkoxyl–poly-sulphide bonds.14 Numerous coupling agents [such as TESPT bis(triethoxysilylpropyl) tetrasulphide, APTES (3-aminopropyltriethoxysilane), NXT (3-octanoylthio-1-propyltriethoxysilane), 3-mercaptopropyl-ethyoxyl-di(tridecylpentamethoxy) (Si747), superlink bis(tridecyl-pentaethoxy-siloxane), OCTEO (triethoxyoctylsilane) and TESPT in combination, etc.], particularly silane coupling agents, are used for this purpose.15–21 However, the cost of silane coupling agents is a concern for the rubber industry, and they often cause pre-scorching of the rubber compound due to sulfur release at processing temperatures. It is reported that HTNR (hydroxyl-terminated natural rubber), ENR (epoxidized NR), guayule rubber, and deproteinized NR show better silica dispersion, but they cannot replace pure natural rubber compounds when considering key physicomechanical properties.9,22–27 However, during the silanization process with silica particles, the functional groups of non-rubber elements compete with the coupling agent, compromising the silica filler's homogeneous dispersion in the NR matrix.9,28 Instead of getting rid of the proteins and phospholipids, the notion of introducing glucose as a blocking agent at the beginning of mixing was presented. Given that one of the internal sugars in tapped natural rubber latex is glucose, this monosaccharide sugar, the most common carbohydrate, plays a part in the biosynthesis of natural rubber (NR) latex from rubber trees and other NR latex-producing plants.29,30 In the past, Nimpaiboon et al. investigated how adding different sugars to fresh natural rubber, deproteinized natural rubber, and synthetic isoprene rubber affected their viscosity.2 The incorporation of sorbitol and sorbic acid was examined to facilitate silica dispersion in silica-filled natural rubber composites.7,13 However, due to the presence of an aldehyde group in glucose, it was not suitable for use in natural rubber. The aldehyde group of glucose can interact with the amine group present in natural rubber, causing the Maillard reaction. This reaction may result in the hardening of the rubber compound and deterioration of the properties of the final product. Nonetheless, a different hypothesis was proposed to further explore this assumption: using glucose as a blocking agent of the functional groups of natural rubber. This approach could also contribute to the uniform dispersion of silica. The Maillard reaction might also improve the composite's strength and modulus in a homogeneously silica-dispersed NR system. It is possible that the functional groups of glucose will partially block the functional groups of NR in the NR molecules at an early mixing stage. The functional groups of glucose will then act as dispersing and plasticizing agents during the inclusion of silica to create a silica NR composite.
In the current work, we will compare the mechanical and dynamic characteristics of silica-filled NR composites with a detailed morphological investigation of the elastomer vulcanizates to examine the impact of glucose on those materials. To understand the variations in crosslinking junctions at different loadings of glucose and the silica filler in the NR elastomer compound, a comprehensive rubber state 13C NMR investigation was carried out. Moreover, a detailed morphological analysis was executed to perceive the dispersion of silica in the NR matrix.
2. Materials and methods
2.1. Materials
The used compounding materials are as follows: natural rubber (NR) – Technically Specified Rubber (TSR-10) purchased from EQ Rubber. Highly dispersible silica (HD silica) [grade-160007/N2SA-182.54 (m2 g−1)] was supplied by Madhu Silica. Stearic acid, zinc oxide (ZnO), the curative – soluble sulfur, and the curing accelerator – N-tertiarybutyl-2-benzothiazole sulfenamide (TBBS) were purchased from local suppliers (analytical grade). Glucose, a 6-carbon carbohydrate used as the modifying or blocking agent, was procured from Sutaria Chemicals, Mumbai.2.2. Compound preparation
2.3. Testing and characterization of samples
The NR composite's rheological properties were tested at 160 °C for 30 minutes using the MDR (Alpha Technologies) to understand the cure characteristics. The hardness of all rubber vulcanizates was measured using a durometer A and an IRHD combined model hardness tester (Gibitre Instruments, Italy) according to the ASTM D 2240 test method. The results were reported as an average of four observations. Tear (angular) and tensile (dumbbell-shaped) specimens were punched out from the molded sheets using a hollow die punch (CEAST, Italy). The tests were performed in a universal testing machine (Zwick Roell Z010, Germany) at room temperature (25 ± 2 °C), at 500 mm min−1 crosshead speed. Tear and tensile tests were carried out in line with the ASTM D 624-99 and ASTM D 412-98 methods, respectively. The crosslink density of rubber vulcanizates was measured using the Flory–Rehner method using eqn (1) and (2). The samples were cut into round shapes (12.5 mm diameter discs) and weighed before and after being soaked in toluene for 72 hours, which ensured a swelling equilibrium. The crosslink density was calculated by using the Flory–Rehner equation (eqn (1)), given as: | (1) |
 | (2) |
Using rubber-state NMR (nuclear magnetic resonance) spectroscopy, the crosslinking junction structure of the natural rubber vulcanizates was determined. Prior to NMR tests, the vulcanizates of natural rubber were extracted using acetone for 48 hours using a Soxhlet system, and then they were dried for 72 hours in a vacuum oven. A JEOL ECA400 FT-NMR running at 99.55 MHz for 13C was used to conduct the rubber-state NMR experiments. The 13C NMR had a spinning rate of 18 ± 0.02 kHz, an accumulation of 40![[thin space (1/6-em)]](https://www.rsc.org/images/entities/char_2009.gif) 000 scans, and a pulse repetition duration of 5 s.
000 scans, and a pulse repetition duration of 5 s.
A FIB-SEM (SII SMI-3050SE) was used to observe the morphology of the silica-filled natural rubber vulcanizate at a 3 kV accelerating voltage. An extremely thin segment of the natural rubber vulcanizates was also formed using FIB-SEM (Focused Ion Beam-Scanning Electron Microscopy). A Sorvall Instruments MT6000 ultramicrotome operating at −80 °C was also utilized to prepare the ultra-thin portion of the polymer composite. After annealing the thin slices for 30 minutes at 353 K, they were dyed with either ruthenium tetroxide (RuO4) or osmium tetraoxide (OsO4).
Atomic force microscopy (AFM) analysis was performed using an Agilent 5500 (USA) instrument. The properly cleaned molded NR sheet samples were investigated to study the surface roughness of the vulcanizates and delineated as a phase morphology. The scanning of a 5 × 5 μm area was carried out using a SiN4 (silicon nitride) tip in tapping mode at a resonance frequency of 150 kHz and 42 N m−1 force constant, respectively.
3. Results and discussion
3.1. Cure characteristics
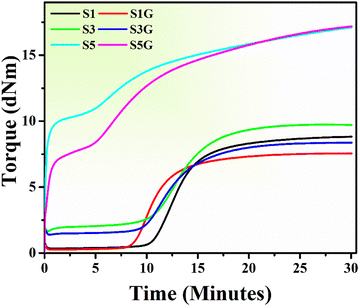
The cure curves and data of the natural rubber compounds are depicted in Fig. 1 and Table 2, respectively. It is well-known and proven that the presence of silica in rubber vulcanizates exhibits a retarding effect during vulcanization, which is attributed to the adsorption of curing accelerators and activators on the acidic surface of silica particles.31,32| Samples | T c90 (min)a | T s2 (min)b | M H (dNm)c | M L (dNm)d | M H − ML (dNm) |
|---|---|---|---|---|---|
| a T c90 – optimum cure time. b T s2 – scorch safety. c M H – maximum torque. d M L – minimum torque. | |||||
| S1 | 17.82 | 11.64 | 8.83 | 0.34 | 8.49 |
| S1G | 15.43 | 9.71 | 7.56 | 0.27 | 7.29 |
| S3 | 17.9 | 11.54 | 9.74 | 1.67 | 8.07 |
| S3G | 17.85 | 11.07 | 8.37 | 1.39 | 6.98 |
| S5 | 20.94 | 0.24 | 17.11 | 5.86 | 11.25 |
| S5G | 20 | 0.39 | 17.19 | 3.14 | 14.05 |
Therefore, the silica-incorporated standard compounds (i.e., S1, S3, and S5) displayed a comparatively higher optimum cure time (Tc90 – optimum cure time) compared to the glucose-treated compounds. The incorporation of glucose in silica-filled NR compounds interestingly resulted in a reduction in the Tc90 value, which may be due to the interaction between the amine groups of proteins present in NR and aldehyde groups of glucose, known as the Maillard reaction. Moreover, due to the maximum silica loading in samples S5 and S5G, the obtained initial torque was so high. Because of this, an initial hump can be observed in the cure curve of these 50 phr silica-loaded samples. As glucose has a plasticization effect, the initial torque of S5G was comparatively less than that of the S5 compound.
3.2. Mechanical and dynamic properties
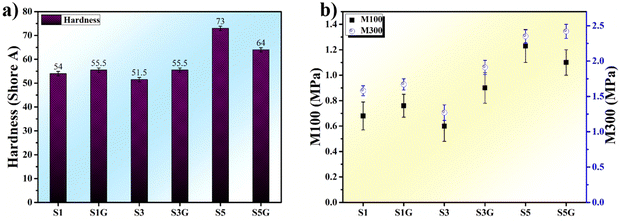
The hardness and modulus of the vulcanizates are depicted in Fig. 4a and b. A gradual increment in both hardness and modulus was observed with the loading of silica, except for a sudden drop in the hardness value of the glucose-treated 50 phr silica loaded sample. This might be because of the plasticization effect of glucose at higher silica loading, as the phr of the embedded glucose was enhanced with the increment of silica loading. Concurrently, the modulus of the same vulcanizate (S5G) interestingly followed its own path towards a higher value.This may be owing to the Maillard reaction (Fig. 2), which resulted in well-networked NR vulcanizates in comparison with the untreated standard samples (the mechanism of a well-networked natural rubber in the presence of glucose as well as the silica filler is revealed in Fig. 3). Also, the formation of a Schiff base complex due to interaction between MBT (2-mercaptobenzothiazole) originating from TBBS during vulcanization and the carbonyl group of glucose might be another reason.2
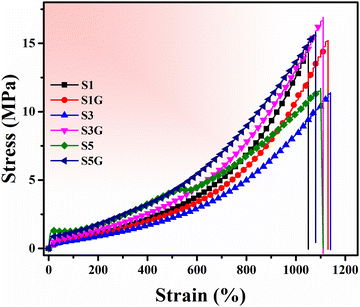
The stress vs. strain plot is shown in Fig. 5, where the glucose-treated compounds’ higher strength was evident. The tensile strength of the untreated vulcanizates was found to be maximum for the 10 phr silica-loaded compound. Thereafter, deterioration in the tensile strength was observed upon further addition of the silica filler due to the self-agglomeration of the silica particles in the NR matrix (Fig. 6a).20,33 However, on the other hand, the incorporation of a few phr of glucose exhibited a remarkable improvement in tensile strength compared to the untreated standard compounds, without much difference in elongation at break. This is attributed to a better polymer–filler interaction and silica dispersion in the presence of glucose.34–36
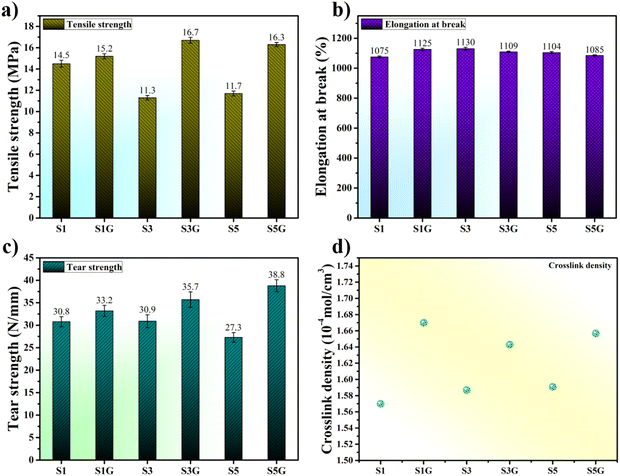 | ||
| Fig. 6 (a) Tensile, (b) elongation, (c) tear strength, and (d) crosslink density plots of the NR vulcanizates. | ||
A gradual rise in tear strength can be observed (Fig. 6c) in the case of glucose-incorporated NR vulcanizates. This improvement in tear strength is indeed another proof of facilitation of silica dispersion in the presence of glucose compared to the untreated standard compounds. Moreover, a well filler dispersed rubber composite system presents a higher crosslink density value. This is attributed to a superior polymer–filler interaction in silica-filled NR vulcanizates. Therefore, a similar kind of trend in crosslink density can be observed in Fig. 6d.28,37,38
Essential parameters like polymer–filler and filler–filler interactions affect the reinforcement in the rubber matrix. The filler–filler interactions can be determined from the variation of storage modulus with strain, which is generally measured as the Payne effect, and the same denotes the difference between storage modulus at minimum and maximum strains. A higher difference indicates a greater Payne effect value, which means a higher filler–filler interaction.
Fig. 7a, b and c, d present the strain sweep and ΔE′ (Payne effect) plots of the NR vulcanizates at room temperature and at 70 °C, respectively. As per the previous assumption from mechanical properties, it is now quite clear that the presence of glucose actually helped in dispersing the silica filler in the NR matrix. Therefore, a lower ΔE′ value can be noticed for the glucose-treated vulcanizates compared to the untreated standard compounds. This is ascribed to a superior polymer–filler interaction and comparatively uniform dispersion of the silica filler in the NR matrix compared to the untreated samples.20,39,40 The trend of the Payne effect at both room temperature and high temperature seems to be similar, which confirms the same effectiveness of glucose in the NR composite at high temperature as well.
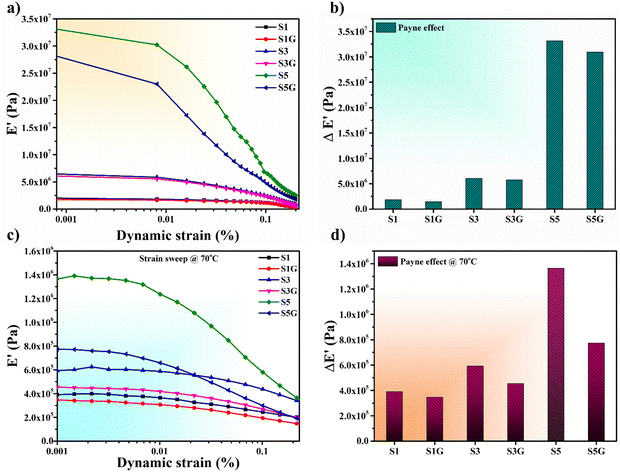 | ||
| Fig. 7 (a) Strain sweep, (b) Payne effect plot at room temperature and (c) strain sweep, (d) Payne effect plot at 70 °C of the NR vulcanizates. | ||
Dynamic mechanical analysis and temperature sweep plots are depicted in Fig. 8. In the case of tyre application to predict the rolling resistance and wet traction of the tyre compound on the lab scale, the tan![[thin space (1/6-em)]](https://www.rsc.org/images/entities/char_2009.gif) δ vs. temperature plot generated from DMA temperature sweep analysis is a general initial trend. The tan
δ vs. temperature plot generated from DMA temperature sweep analysis is a general initial trend. The tan![[thin space (1/6-em)]](https://www.rsc.org/images/entities/char_2009.gif) δ at 60 to 70 °C indicates the rolling resistance of a tyre, and tan
δ at 60 to 70 °C indicates the rolling resistance of a tyre, and tan![[thin space (1/6-em)]](https://www.rsc.org/images/entities/char_2009.gif) δ at 0 °C is used to assume the wet grip of the tyre. Thus, in accordance with the tan
δ at 0 °C is used to assume the wet grip of the tyre. Thus, in accordance with the tan![[thin space (1/6-em)]](https://www.rsc.org/images/entities/char_2009.gif) δ vs. temperature plot (Fig. 8a) it was clearly noticed that the tan
δ vs. temperature plot (Fig. 8a) it was clearly noticed that the tan![[thin space (1/6-em)]](https://www.rsc.org/images/entities/char_2009.gif) δ at 70 °C is actually reduced in the presence of glucose rather than the untreated standard sample. This signified a significant reduction in rolling resistance of the tyre tread compound. This is attributed to a better polymer–filler interaction, as confirmed by the strain sweep study of the NR vulcanizates. On the contrary, there is not much difference in tan
δ at 70 °C is actually reduced in the presence of glucose rather than the untreated standard sample. This signified a significant reduction in rolling resistance of the tyre tread compound. This is attributed to a better polymer–filler interaction, as confirmed by the strain sweep study of the NR vulcanizates. On the contrary, there is not much difference in tan![[thin space (1/6-em)]](https://www.rsc.org/images/entities/char_2009.gif) δ at 0 °C between the treated and untreated NR vulcanizates. However, the wet grip in the case of heavy vehicle tyres is a secondary concern, unlike light weight vehicle tyres like two wheeler or passenger car tyres. On the other hand, the storage modulus (E′) vs. temperature plot is shown in Fig. 8b. The stability of a heavy vehicle tyre is a very important factor, especially during the running condition of the vehicle. The storage modulus (E′) at high temperature (60 to 70 °C) signifies the same thing; a high value of E′ at high temperature indicates a superior stability of the tyre tread compound. However, in this study, a gradual rise of the E′ value was noticed with the enhancement of silica loading, which is owing to a higher restricted motion of the elastomer molecules in conjunction with the increment of silica loading. Moreover, the value of E′ at 70 °C for 10 phr and 50 phr silica-loaded compounds did not display any difference among the treated and untreated samples.33,39,41
δ at 0 °C between the treated and untreated NR vulcanizates. However, the wet grip in the case of heavy vehicle tyres is a secondary concern, unlike light weight vehicle tyres like two wheeler or passenger car tyres. On the other hand, the storage modulus (E′) vs. temperature plot is shown in Fig. 8b. The stability of a heavy vehicle tyre is a very important factor, especially during the running condition of the vehicle. The storage modulus (E′) at high temperature (60 to 70 °C) signifies the same thing; a high value of E′ at high temperature indicates a superior stability of the tyre tread compound. However, in this study, a gradual rise of the E′ value was noticed with the enhancement of silica loading, which is owing to a higher restricted motion of the elastomer molecules in conjunction with the increment of silica loading. Moreover, the value of E′ at 70 °C for 10 phr and 50 phr silica-loaded compounds did not display any difference among the treated and untreated samples.33,39,41
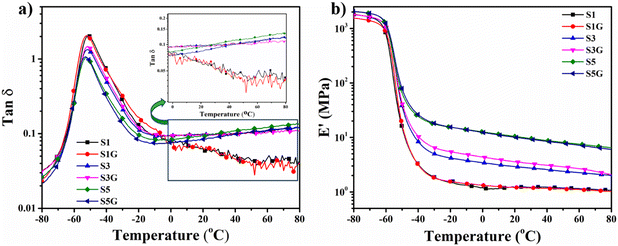 | ||
Fig. 8 DMA temperature sweep plot – (a) tan![[thin space (1/6-em)]](https://www.rsc.org/images/entities/char_2009.gif) δ vs. temperature plot and (b) storage modulus vs. temperature plot of the NR vulcanizates. δ vs. temperature plot and (b) storage modulus vs. temperature plot of the NR vulcanizates. | ||
Nonetheless, surprisingly the glucose-treated 30 phr silica loaded NR vulcanizate exhibited a slight upliftment of the E′ value at 70 °C compared to the standard compound. The better polymer–filler interaction can build a highly networked structure into the system, signifying a higher crosslink density value, which could be the major reason behind the mentioned incident.
Elastomer molecule confinement effects in composite systems can control composites’ characteristics and consequent uses. One of the main elements influencing mechanical characteristics in the presence of fillers is the orientation of elastomer chains. The confinement effect is directly related to the polymer's segmental and chain mobilities, which can be clearly understood from the temperature sweep plot (Fig. 8a) of DMA analysis. It is observed that the addition of silica filler resulted in the decrease in the magnitude of the tan![[thin space (1/6-em)]](https://www.rsc.org/images/entities/char_2009.gif) δ peak, indicating the restricted mobility of polymer chains. The NR chains’ confinement by silica fillers is responsible for the decrease of the tan
δ peak, indicating the restricted mobility of polymer chains. The NR chains’ confinement by silica fillers is responsible for the decrease of the tan![[thin space (1/6-em)]](https://www.rsc.org/images/entities/char_2009.gif) δ peak values in the NR composites. The confined fraction of NR chains varies depending on the weight percentage of the silica filler. A decrease in the values of the tan
δ peak values in the NR composites. The confined fraction of NR chains varies depending on the weight percentage of the silica filler. A decrease in the values of the tan![[thin space (1/6-em)]](https://www.rsc.org/images/entities/char_2009.gif) δ peak suggests that the NR–silica composites’ interfacial reinforcing has improved. However, the further reduction of the tan
δ peak suggests that the NR–silica composites’ interfacial reinforcing has improved. However, the further reduction of the tan![[thin space (1/6-em)]](https://www.rsc.org/images/entities/char_2009.gif) δ peak in the presence of glucose signifies the significant improvement in the interfacial reinforcement in the NR–silica composites, i.e., a better polymer–filler interaction compared to the composites without glucose.42–44
δ peak in the presence of glucose signifies the significant improvement in the interfacial reinforcement in the NR–silica composites, i.e., a better polymer–filler interaction compared to the composites without glucose.42–44
Compared to the low silica-filled NR composite, the log![[thin space (1/6-em)]](https://www.rsc.org/images/entities/char_2009.gif) E′ vs. temperature plot (Fig. 8b) of high silica-loaded NR composites provides valuable information concerning the rise in the storage modulus at the high-temperature area. The values of E′ climb when the amount of silica filler is increased, and the addition of glucose causes the storage modulus to rise more with each silica loading. This demonstrates unequivocally that the silica filler is evenly distributed throughout the NR matrix. This highlights that there is a good rubber–silica interaction and that the reinforcement is reasonably strong when silica and glucose are present, which limits the mobility of the chain segments.43–45
E′ vs. temperature plot (Fig. 8b) of high silica-loaded NR composites provides valuable information concerning the rise in the storage modulus at the high-temperature area. The values of E′ climb when the amount of silica filler is increased, and the addition of glucose causes the storage modulus to rise more with each silica loading. This demonstrates unequivocally that the silica filler is evenly distributed throughout the NR matrix. This highlights that there is a good rubber–silica interaction and that the reinforcement is reasonably strong when silica and glucose are present, which limits the mobility of the chain segments.43–45
3.3. Rubber state NMR
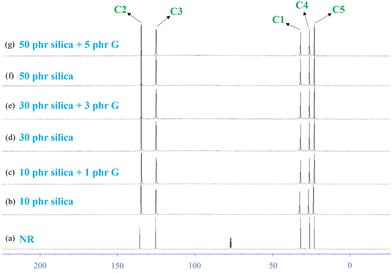
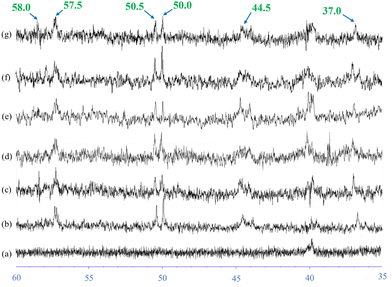
The Fig. 9 shows rubber state 13C-NMR spectra of silica-filled NR vulcanizates and silica–glucose filled NR vulcanizates together with the solution state 13C-NMR spectrum of unvulcanized NR. Large signals appeared at 23.4, 26.0, 32.0, 125.0, and 135.0 ppm (parts per million) in all spectra. These signals were assigned to C5, C4, C1, C3, and C2 of the cis-1,4-isoprene unit, according to previous reports. In addition, small signals appeared between 35 and 60 ppm for the NR vulcanizates, even though they did not appear for the unvulcanized NR.Fig. 10 shows the enlarged rubber state 13C-NMR spectra between 35 and 60 ppm. The small signals appeared at 37.0, 40.0, 44.5, 50.0, 50.5, 57.3, 58.0, and 58.5 ppm in the rubber state 13C-NMR spectra of the silica-filled NR vulcanizates and silica–glucose filled NR vulcanizates. These signals were assigned to carbons linked to sulfur as crosslinking junctions and their adjacent carbons, as shown in Fig. 11.
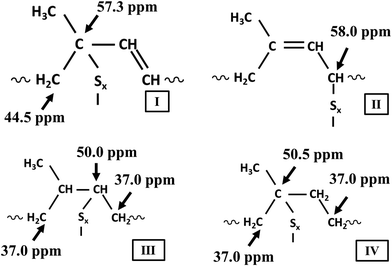 | ||
| Fig. 11 Assignment of signals in the rubber-state 13C NMR spectra of silica filled NR vulcanizates and silica–glucose filled NR vulcanizates. | ||
The signals at 50.0 and 50.5 ppm were assigned to quaternary carbon linked to sulfur (quaternary C–S) and tertiary carbon linked to sulfur (tertiary C–S), respectively, which were formed by direct addition of sulfur to the carbon–carbon double bond of the cis-1,4-isoprene unit. In contrast, the signals at 37.0 ppm were assigned to methylene groups adjacent to the quaternary C–S and tertiary C–S. In contrast, the signal at 57.3 ppm was assigned to quaternary allylic carbon linked to sulfur (quaternary allylic C–S), which was formed by recombination of the sulfur radical with the tertiary allylic carbon radical generated by abstracting hydrogen from allylic carbon at the 4th position (C4) of the cis-1,4-isoprene unit followed by conjugation, whereas the signals at 58.0 and 58.5 ppm were assigned to tertiary allylic carbon linked to polysulfide (tertiary allylic C–Sx) and tertiary allylic carbon linked to monosulfide (tertiary allylic C–Sm), respectively, which were formed by recombination of sulfur radicals with the secondary allylic carbon radicals generated by abstracting hydrogen from allylic carbon at the 1st position (C1) and 4th position (C4) of the cis-1,4-isoprene unit.46–48 The signals at 44.5 ppm were assigned to methylene groups adjacent to the quaternary allylic C–S, tertiary allylic C–Sx and tertiary allylic C–Sm, whereas the signal at 40 ppm was assigned to the methylene group (C1) of the trans-1,4-isoprene unit generated by cis–trans isomerization of the cis-1,4-isoprene unit as a side reaction. In the present study, we found that the signals at 37.0, 40.0, 44.5, 50.0, 50.5, 57.3, 58.0, and 58.5 ppm similarly appeared in the rubber state 13C-NMR spectra of silica-filled NR vulcanizates and silica–glucose filled NR vulcanizates. To be more exact, the signal at 58.0 ppm was more prominent for the silica-filled NR vulcanizates containing a larger amount of the tertiary allylic C–Sx, whereas the signal at 58.5 ppm was more prominent for the silica–glucose filled NR vulcanizates containing a larger amount of the tertiary allylic C–S.46,47
Rubber state NMR spectroscopy applied in the present study makes it possible to detect the gap of the energy levels split due to the Zeeman effect as a chemical shift value with respect to carbons and hydrogens in different chemical environments since a residual dipole–dipole interaction of the NR vulcanizates is eliminated by fast magic angle spinning of about 20 kHz. This implies that the carbons and hydrogens in the different chemical environments are quantitatively analyzed with intensities of signals appearing in the rubber state NMR spectra.49 Therefore, we estimated the intensity ratios of the signals at 50.0, 50.5, 57.3, 58.0 and 58.5 to the signal at 23.4 ppm (C5 of the cis-1,4-isoprene unit). Fig. 12 shows the estimated values of the intensity ratios of the signals at 50.0, 50.5, 57.3, 58.0, and 58.5 ppm for the silica-filled NR vulcanizates and silica–glucose filled NR vulcanizates. First, the intensity ratio value of the signal at 57.3 ppm, which was the largest among the intensity ratio values, was independent of amounts of silica and silica–glucose; that is, the intensity ratio value was almost the same for the silica-filled NR vulcanizates and silica–glucose filled NR vulcanizates. Second, the intensity ratio value of the signal at 58.0 ppm was the highest for the 50 phr silica-filled NR vulcanizate, whereas that of the signal at 58.5 ppm was high for the 30 phr silica–3 phr glucose-filled NR vulcanizate and the 50 phr silica–5 phr glucose filled NR vulcanizate. These correspond to the values of crosslink density.50–52
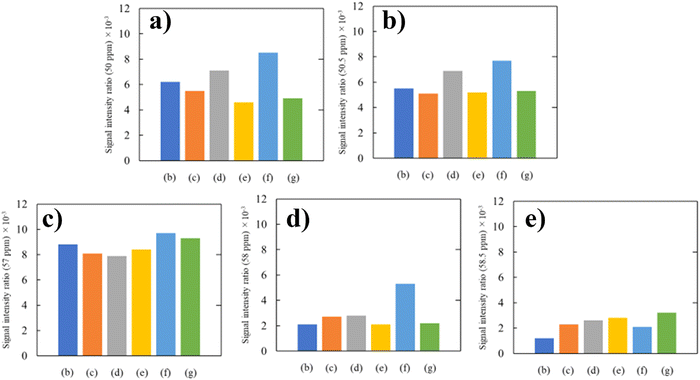 | ||
| Fig. 12 Intensity ratio of signals at (a) 50.0, (b) 50.5, (c) 57.3, (d) 58.0, and (e) 58.5 ppm in the rubber-state 13C-NMR spectra. | ||
Third, the intensity ratio values of the signals at 50 and 50.5 ppm were larger for silica 30 phr and silica 50 phr filled NR vulcanizates. In the previous study, Kashihara and collaborators reported that the signals at 50 and 50.5 ppm were partly assigned to episulfides or epipolysulfides formed by the direct addition of sulfur to the carbon–carbon double bond of the cis-1,4-isoprene unit, even though they were also assigned to the structures shown in Fig. 11.53,54 The formation of episulfides and epipolysulfides as heteroalkene rings implies that a large number of carbon–sulfur linkages may not contribute to crosslinking as crosslinking junctions, suggesting that the vulcanization is not performed efficiently. This corresponds to the fact that the tensile strength, tear strength, and crosslink density of the silica-filled NR vulcanizates were lower than those of the silica–glucose filled NR vulcanizates. These results show that the outstanding mechanical properties of silica–glucose filled NR vulcanizates were found to be due to the ability of glucose to promote the vulcanization of natural rubber efficiently.52–54
3.4. Morphology analysis
Fig. 13 shows FIB-SEM images of the 10 phr silica-filled NR vulcanizate and 10 phr silica–1 phr glucose-filled NR vulcanizate, for which elemental analysis was performed from the surface to inside after making a cross-section through FIB processing with the Ga ion. The red domains represent silicon, the yellow domains represent oxygen, and the green domains represent sulfur. As for the 10 phr silica-filled NR vulcanizate, concentrations of silicon, oxygen, and sulfur were higher on the vulcanizate's surface than inside, reflecting surface segregation of silica and sulfur-containing compounds due to their heterogeneous distributions. Furthermore, silicon, oxygen, and sulfur appeared at the same position in the FIB-SEM image. This may be explained to be due to adsorption of TBBS, a sulfur-containing compound, on the surface of SiO2, as reported by Choi and collaborators.55 By contrast, for the 10 phr silica–1 phr glucose-filled NR vulcanizate, silicon and oxygen existed sparsely on the surface of the vulcanizate as particles of approximately 0.1 μm in diameter at the same position, indicating that they are SiO2, but sulfur appeared evenly on the surface due to a good mixing. Comparing the FIB-SEM image of the 10 phr silica-filled NR vulcanizate with that of the 10 phr silica–1 phr glucose filled NR vulcanizate, we found that glucose played an important role in the dispersion of not only silica but also TBBS onto natural rubber. In particular, glucose prevented the adsorption of TBBS onto the surface of SiO2.55,56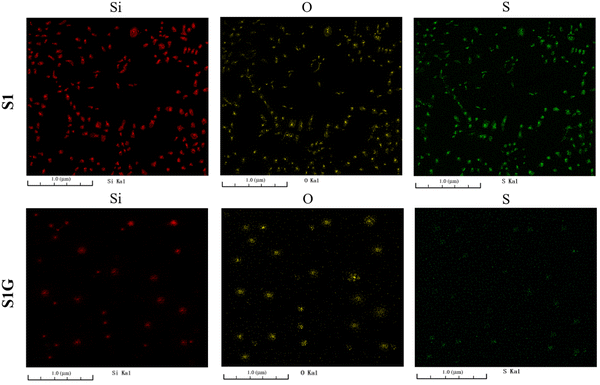 | ||
| Fig. 13 FIB-SEM images of the 10 phr silica filled NR vulcanizate (S1) and the 10 phr silica–1 phr glucose filled NR vulcanizate (S1G). | ||
Fig. 14 shows FIB-SEM images of the 30 phr silica filled NR vulcanizate and the 30 phr silica–3 phr glucose filled NR vulcanizate. For the 30 phr silica-filled NR vulcanizate, silica and TBBS adsorbed on silica aggregated to cover the surface of the vulcanizate. By contrast, for the 30 phr silica–3 phr glucose filled NR vulcanizate, silica particles with a diameter of about 0.2 μm existed sparsely on the surface of the vulcanizate, whereas sulfur was finely dispersed homogeneously.
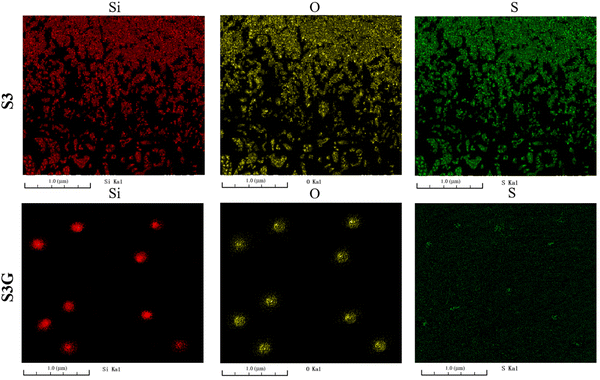 | ||
| Fig. 14 FIB-SEM images of the 30 phr silica filled NR vulcanizate (S3) and the 30 phr silica–3 phr glucose filled NR vulcanizate (S3G). | ||
Fig. 15 shows FIB-SEM images of the 50 phr silica filled NR vulcanizate and the 50 phr silica–5 phr glucose filled NR vulcanizate. For the 50 phr silica-filled NR vulcanizate, silica with TBBS (silica–TBBS) was densely aggregated to cover the surface of the vulcanizate, and the silica and TBBS were interconnected to each other. This corresponds to the fact that the hardness of the 50 phr silica-filled NR vulcanizate was the highest among the vulcanizates. By contrast, for the 50 phr silica–5 phr glucose filled NR vulcanizate, silica particles with a diameter of about 0.2 μm existed sparsely on the surface of the vulcanizate, whereas sulfur was finely dispersed as in the case of the 30 phr silica–3 phr glucose filled NR vulcanizate.56
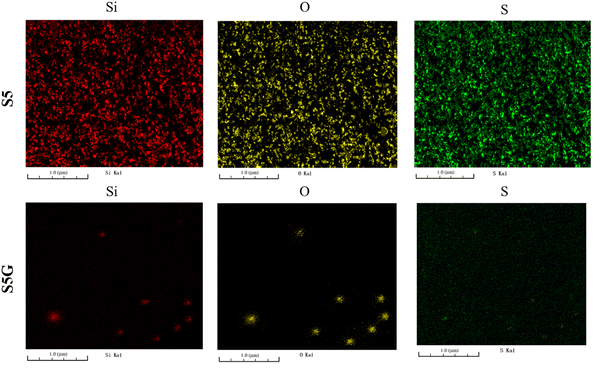 | ||
| Fig. 15 FIB-SEM images of the 50 phr silica filled NR vulcanizate (S5) and the 50 phr silica–5 phr glucose filled NR vulcanizate (S5G). | ||
These results imply that glucose was adsorbed on the surface of silica to prevent the adsorption of TBBS and to enable the homogeneous dispersion of silica in the NR vulcanizates. The vulcanization was, thus, promoted to form crosslinking junctions by suppressing side reactions that form episulfides and epipolysulfides as heteroalkene rings and dangling polysulfides, since TBBS efficiently formed a complex with Zn. The higher crosslink density and outstanding mechanical properties of silica–glucose filled NR vulcanizates were attributed to the ability of glucose to cover the surface of silica, which resulted in free TBBS to form a Zn complex, thus efficiently promoting the accelerated sulfur vulcanization of natural rubber. Furthermore, glucose contributed to the good dispersion of silica in the NR vulcanizates. The hardness of the silica-filled NR vulcanizates increased without glucose even though the amounts of sulfur were the same in the compounded NR.55
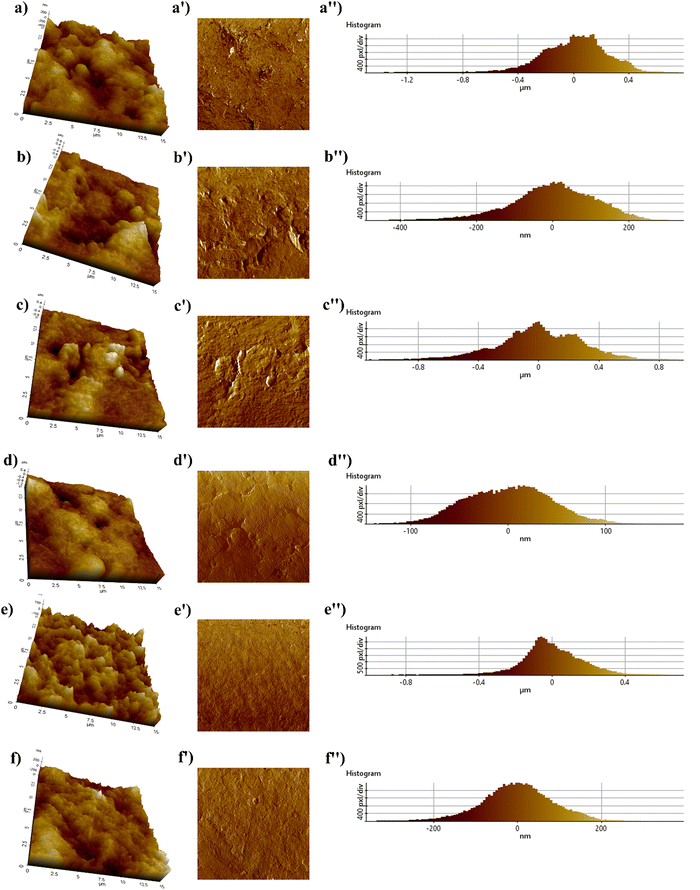
Fig. 16 depicts the AFM photomicrographs (left-height images and right-phase images) of the treated and untreated NR vulcanizates for a scan size of 15 μm × 15 μm. In 3D (height) images the light brown colour represents the hard silica particles, and the dark brown colour indicates the elastomer matrix region.57 However, a broader range of light colour regions can be clearly observed in the case of 3D photomicrographs of the untreated NR vulcanizates. This signifies a higher number of agglomerated silica particles in the untreated NR matrix, resulting in higher filler–filler interaction during dynamic testing, indeed supporting the results of strain sweep (Fig. 7).58,59 Concurrently, the shorter ranges of the light colour region in glucose-treated samples exhibited comparatively smoother surfaces compared to the untreated samples.
This is attributed to a homogeneous dispersion of silica particles and a better polymer–filler interaction in the presence of glucose in the silica-filled NR matrix.60,61 Therefore, a significant improvement in dynamic and mechanical properties was witnessed. A similar kind of trend can be observed in the phase images and histograms, which indeed support the trend of 3D images of AFM photomicrographs.
This work has significant potential for industrial applications. The compound can primarily be used as a tyre tread compound to produce green tyres, as it exhibits low rolling resistance along with excellent mechanical properties even at high silica loading. It is well known that glucose is an inexpensive carbohydrate, readily available in nature. Therefore, incorporating small amounts of glucose in silica-filled natural rubber results in a more homogeneous dispersion of the silica filler, compared to using costly chemicals or coupling agents. This formulation can be used for production trials by preparing a 70 kg batch-weight compound and mixing it in a large internal mixer. The only additional step is the inclusion of glucose during the mastication of rubber at the initial stage of mixing, which is a simple and easy process that significantly enhances the properties. The production process should be highly compatible with existing methods, as the presence of glucose also facilitates better processing due to its plasticizing nature.
4. Conclusions
The incorporation of glucose in a silica-filled natural rubber compound discloses a hidden way to improve silica dispersion in a natural rubber matrix. The investigation of natural rubber bio-chemistry revealed the microstructure of NR, where the functional groups like proteins and phospholipids are located at two opposite ends of the natural rubber microstructure. Now, the incorporation of glucose in a silica-filled NR compound results in the interaction between carbonyl groups of glucose and amine groups of proteins, which is known as the Maillard reaction. This is the primary reason for the reduction of Tc90 in the presence of glucose in NR vulcanizates. Additionally, a gradual enhancement in hardness and M300 (modulus at 300%) can be observed along with the increment of silica loading. Moreover, the incorporation of glucose exhibited comparatively higher values of both the hardness and modulus except for the hardness and M100 at 50 phr loading of silica. This is attributed to the plasticization effect of glucose at higher loading. A significant improvement in mechanical properties, like tensile strength, tear strength, and crosslink density, could be observed in the presence of glucose in every loading of silica due to the Maillard reaction. This assisted in a better silica dispersion in the NR matrix, resulting in a superior polymer–filler interaction. The Payne effect study showed the same in the presence of glucose, especially at higher loading. Moreover, the strain sweep analysis at high temperature (70 °C) exhibited a similar kind of improvement in polymer–filler interaction to that at room temperature, as confirmed by the Payne effect analysis. This confirms the effectiveness of glucose in NR vulcanizates even at high temperatures. DMA temperature sweep, another vital dynamic property, is an essential test for tyre applications, where the tan![[thin space (1/6-em)]](https://www.rsc.org/images/entities/char_2009.gif) δ at 70 °C indicates that the rolling resistance of a heavy vehicle tyre is found to be decreased for the glucose-incorporated compounds, without any deterioration in the storage modulus at high temperature. Moreover, a detailed rubber state 13C NMR study unveiled inefficient sulfur vulcanization of silica-filled NR compounds in the absence of glucose. This is attributed to the formation of episulfides and epipolysulfides as heteroalkene rings, implying that a higher number of C–S linkages may not contribute to crosslink or crosslinking junctions. On the other hand, an exceptional improvement in both mechanical and dynamic properties can be observed in the presence of glucose, as it promoted the vulcanization of the NR matrix efficiently. The homogeneous dispersion of the silica filler in the NR matrix is distinctly evident from the in-depth morphological analyses, i.e., FIB-SEM and AFM analyses.
δ at 70 °C indicates that the rolling resistance of a heavy vehicle tyre is found to be decreased for the glucose-incorporated compounds, without any deterioration in the storage modulus at high temperature. Moreover, a detailed rubber state 13C NMR study unveiled inefficient sulfur vulcanization of silica-filled NR compounds in the absence of glucose. This is attributed to the formation of episulfides and epipolysulfides as heteroalkene rings, implying that a higher number of C–S linkages may not contribute to crosslink or crosslinking junctions. On the other hand, an exceptional improvement in both mechanical and dynamic properties can be observed in the presence of glucose, as it promoted the vulcanization of the NR matrix efficiently. The homogeneous dispersion of the silica filler in the NR matrix is distinctly evident from the in-depth morphological analyses, i.e., FIB-SEM and AFM analyses.
This work unveils the significant contribution of glucose to the uniform dispersion of the silica filler. It also provides strong proof of the Maillard reaction between the amine groups of NR and carbonyl groups of glucose. Therefore, this simple and sustainable step of adding glucose in silica-filled natural rubber compounds opens a new door towards preparing green and sustainable tyre and non-tyre products.
Author contributions
Abhijit Bera: conceptualization, writing – original draft preparation, writing – reviewing and editing; Masaki Yamano: conceptualization, writing – original draft preparation, writing – reviewing and editing; Seiichi Kawahara: conceptualization, writing – reviewing and editing, and overall supervision; and Santanu Chattopadhyay: conceptualization, writing – reviewing and editing, and overall supervision.Data availability
Data will be available on special request.Conflicts of interest
The authors declare that there are no conflicts of interest to declare.Acknowledgements
The authors would like to thank the Japan Science and Technology Agency for accepting the research proposal for the SAKURA program to carry out the collaborative research work between India and Japan. The authors would like to acknowledge the Indian Institute of Technology Kharagpur and Nagaoka University of Technology for their financial support and all kinds of facilities. The authors are also thankful to the Department of Chemistry, Nagaoka University of Technology and Rubber Technology Centre, Indian Institute of Technology Kharagpur for carrying out the different characterization techniques and testing procedures of the samples. The authors acknowledge the Sakura Science Exchange Program (S2021F0800033), Japan Science and Technology, for funding and financial support during the course of this work.References
- Y. Zhou, K. Kosugi, Y. Yamamoto and S. Kawahara, Polym. Adv. Technol., 2017, 28, 159–165 CrossRef CAS.
- A. Nimpaiboon, M. Sriring, S. Kumarn and J. Sakdapipanich, J. Appl. Polym. Sci., 2020, 137, 1–11 CrossRef.
- A. G. Thomas and J. M. Whittle, Rubber Chem. Technol., 1970, 43, 222–228 CrossRef CAS.
- A. H. Eng, S. Kawahara and Y. Tanaka, Rubber Chem. Technol., 1994, 67, 159–168 CrossRef CAS.
- S. Kawahara, T. Kakubo, J. T. Sakdapipanich, Y. Isono and Y. Tanaka, Polymer, 2000, 41, 7483–7488 CrossRef CAS.
- A. Bera, D. Ganguly, J. P. Rath, S. Ramakrishnan, J. Kuriakose, S. K. P. Amarnath and S. Chattopadhyay, Mater. Chem. Phys., 2023, 295, 127151 CrossRef CAS.
- A. Bera, D. Ganguly, S. K. Ghorai, J. P. Rath, S. Ramakrishnan, J. Kuriakose, S. K. P. Amarnath and S. Chattopadhyay, Chem. Eng. J. Adv., 2022, 11, 100349 CrossRef CAS.
- A. Bera, B. Manna, D. Ganguly, S. K. P. Amarnath, S. Nanda, A. Ghosh and S. Chattopadhyay, ACS Appl. Polym. Mater., 2022, 5, 451 CrossRef PubMed.
- A. Bera, K. Sarkar, D. Ganguly, S. K. Ghorai, R. Hore, N. Kumar, S. K. P. Amarnath and S. Chattopadhyay, J. Polym. Res., 2024, 31, 1–21 CrossRef.
- Y. Xiao, Z. Xu, Z. Gong, B. Li, Y. Huang, H. Bian and C. Wang, J. Appl. Polym. Sci., 2023, 140, e54049 CrossRef CAS.
- P. Nuinu, C. Sirisinha, K. Suchiva, P. Daniel and P. Phinyocheep, J. Mater. Res. Technol., 2023, 24, 2155–2168 CrossRef CAS.
- A. Guchait, D. Ganguly, C. Sengupta, S. Chattopadhyay and T. Mondal, ACS Sustainable Chem. Eng., 2022, 10, 16780–16792 CrossRef CAS.
- A. Bera, M. Goswami, D. Ganguly, J. P. Rath, S. Ramakrishnan, J. Kuriakose, S. K. P. Amarnath and S. Chattopadhyay, J. Mater. Sci., 2023, 58, 996–1011 CrossRef CAS.
- W. Kaewsakul, K. Sahakaro, W. K. Dierkes and J. W. M. Noordermeer, Polym. Eng. Sci., 2015, 836–842 CrossRef CAS.
- T. Jiang, T. Kuila, N. H. Kim, B. C. Ku and J. H. Lee, Compos. Sci. Technol., 2013, 79, 115–125 CrossRef CAS.
- C. Hayichelaeh, L. A. E. M. Reuvekamp, W. K. Dierkes, A. Blume, J. W. M. Noordermeer and K. Sahakaro, Rubber Chem. Technol., 2020, 93, 195–207 CrossRef CAS.
- C. P. Tripp and M. L. Hair, J. Phys. Chem., 1993, 97, 5693–5698 CrossRef CAS.
- J. Zheng, D. Han, X. Ye, X. Wu, Y. Wu, Y. Wang and L. Zhang, Polymer, 2018, 135, 200–210 CrossRef CAS.
- S. Das, S. Chattopadhyay, S. Dhanania and A. K. Bhowmick, Polym. Eng. Sci., 2020, 60, 3115–3134 CrossRef CAS.
- W. Kaewsakul, K. Sahakaro, W. K. Dierkes and J. W. M. Noordermeer, Rubber Chem. Technol., 2013, 86, 313–329 CrossRef CAS.
- S. O. Movahed, A. Arsarifar and M. Song, Polym. Int., 2009, 58, 209–217 CrossRef CAS.
- T. Xu, Z. Jia, J. Li, Y. Luo, D. Jia and Z. Peng, Polym. Compos., 2018, 39, 377–385 CrossRef CAS.
- P. Manoharan and K. Naskar, Polym. Compos., 2019, 40, 871–883 CrossRef CAS.
- P. K. Chattopadhyay, U. Basuli and S. Chattopadhyay, Polym. Compos., 2010, 31, 835–846 CrossRef CAS.
- K. Katueangngan, T. Tulyapitak and A. Saetung, Procedia Chem., 2016, 19, 447–454 CrossRef CAS.
- S. S. Sarkawi, W. K. Dierkes and J. W. M. Noordermeer, Rubber World, 2012, 247, 26–31 CAS.
- D. Mahata, K. Sarkar, P. Mondal, O. Prabhavale, S. Dhanania, G. B. Nando and S. Chattopadhyay, Iran. Polym. J., 2020, 29, 393–401 CrossRef CAS.
- S. S. Sarkawi, W. K. Dierkes and J. W. M. Noordermeer, Eur. Polym. J., 2013, 49, 3199–3209 CrossRef CAS.
- A. Nimpaiboon and J. Sakdapipanich, Polym. Test., 2013, 32, 1408–1416 CrossRef CAS.
- X. Wang, Z. Luo, Y. Xu, J. Zhong, H. Zhang and J. Liang, J. Appl. Polym. Sci., 2023, 140, e53966 CrossRef CAS.
- Y. Wang, L. Liao, J. Zhong, D. He, K. Xu, C. Yang, Y. Luo and Z. Peng, J. Appl. Polym. Sci., 2016, 133, 1–9 Search PubMed.
- N. Rattanasom, T. Saowapark and C. Deeprasertkul, Polym. Test., 2007, 26, 369–377 CrossRef CAS.
- S. Prasertsri and N. Rattanasom, Polym. Test., 2011, 30, 515–526 CrossRef CAS.
- A. Kraibut, W. Kaewsakul, K. Sahakaro, S. Saiwari, J. W. M. Noordermeer and W. K. Dierkes, Mater., 2024, 17, 341 CrossRef CAS PubMed.
- Y. Jiang, S. Wang and Y. Zhang, Polym. Bull., 2023, 80, 12373–12392 CrossRef CAS.
- M. Sedlačík, B. You and S. Jin, Mater., 2024, 17, 3131 CrossRef PubMed.
- S. Prasertsri and N. Rattanasom, Polym. Test., 2012, 31, 593–605 CrossRef CAS.
- J. Y. Lee, N. Park, S. Lim, B. Ahn, W. Kim, H. Moon, H. J. Paik and W. Kim, Adv. Mater. Sci. Eng., 2016, 24, 711–727 Search PubMed.
- S. Sattayanurak, J. W. M. Noordermeer, K. Sahakaro, W. Kaewsakul, W. K. Dierkes and A. Blume, Adv. Mater. Sci. Eng., 2019, 2019, 1–8 CrossRef.
- H. Yao, G. Weng, Y. Liu, K. Fu, A. Chang and Z. R. Chen, J. Appl. Polym. Sci., 2015, 132(20) DOI:10.1002/APP.41980.
- Y. Li, B. Han, S. Wen, Y. Lu, H. Yang, L. Zhang and L. Liu, Composites, Part A, 2014, 62, 52–59 CrossRef CAS.
- C. M. Roland, Viscoelastic Behav. Rubbery Mater., 2011, 298–318 Search PubMed.
- V. Krikorian and D. J. Pochan, Macromolecules, 2004, 37, 6480–6491 CrossRef CAS.
- P. Bindu and S. Thomas, J. Phys. Chem. B, 2013, 117, 12632–12648 CrossRef CAS PubMed.
- L. Huang, F. Yu, Y. Liu, A. Lu, Z. Song, W. Liu, Y. Xiong, H. He, S. Li, X. Zhao, S. Cui and C. Zhu, Compos. Sci. Technol., 2023, 233, 109905 CrossRef CAS.
- T. Saito, M. Yamano, K. Nakayama and S. Kawahara, Polym. Test., 2021, 96, 107130 CrossRef CAS.
- NMR methods for characterization of synthetic and natural polymers, ed. R. Zhang, T. Miyoshi and P. Sun, Royal Society of Chemistry, 2019 Search PubMed.
- A. K. Mishra, S. Chattopadhyay, P. R. Rajamohanan and G. B. Nando, Polymer, 2011, 52, 1071–1083 CrossRef CAS.
- H. T. Luu and S. Kawahara, ACS Sustainable Chem. Eng., 2024, 12(8), 3279–3288 CrossRef CAS.
- Y. Iizuka, Y. Yamamoto and S. Kawahara, Colloid Polym. Sci., 2019, 297, 133–139 CrossRef CAS.
- Y. Akahori, M. Hiza, S. Yamaguchi and S. Kawahara, Rubber Chem. Technol., 2021, 94, 657–668 CrossRef CAS.
- M. Yamano, Y. Yamamoto, T. Saito and S. Kawahara, Polymer, 2021, 235, 124271 CrossRef CAS.
- N. T. Thuong, P. T. Nghia and S. Kawahara, J. Sci. Technol. – Eng. Technol. Sustain. Dev., 2022, 32(2), 008–015 Search PubMed.
- B. Kim, K. Boonkerd and S. Kawahara, Polym. Adv. Technol., 2023, 34, 3003–3010 CrossRef CAS.
- L. Fukuhara, K. Kosugi, Y. Yamamoto, H. Jinnai, H. Nishioka, H. Ishii, M. Fukuda and S. Kawahara, Colloid Polym. Sci., 2015, 293, 2555–2563 CrossRef CAS.
- L. Fukuhara, K. Kosugi, Y. Yamamoto, H. Jinnai, H. Nishioka, H. Ishii and S. Kawahara, Polymer, 2015, 57, 143–149 CrossRef CAS.
- Y. Xiao, H. Zou, L. Zhang, X. Ye and D. Han, Polym. Test., 2020, 81, 106195 CrossRef CAS.
- L. L. Johnson, Rubber Chem. Technol., 2008, 81, 359–383 CrossRef CAS.
- A. Bera, D. Ganguly, R. Hore, J. P. Rath, S. Ramakrishnan, J. Kuriakose, S. K. P. Amarnath and S. Chattopadhyay, J. Polym. Res., 2023, 30, 1–16 CrossRef.
- T. Karino, Y. Ikeda, Y. Yasuda, S. Kohjiya and M. Shibayama, Biomacromolecules, 2007, 8, 693–699 CrossRef CAS PubMed.
- S. Salina Sarkawi, W. K. Dierkes and J. W. M. Noordermeer, Rubber Chem. Technol., 2015, 88, 359–372 CrossRef.
Footnotes |
| † These authors contributed equally. |
| ‡ Senior contributing author. |
| This journal is © The Royal Society of Chemistry 2024 |

