 Open Access Article
Creative Commons Attribution 3.0 Unported Licence
DMD-based optical printing of PHEMA hydrogel gratings for sensitive and rapid alcohol sensing
Jing
Xu
 a,
Fanglei
Guo
 b,
Carmen
Bartic
 b,
Koen
Clays
 a and
Yovan
de Coene
 *a
*a
aMolecular Imaging and Photonics, Department of Chemistry, Katholieke Universiteit Leuven, Leuven, Belgium. E-mail: yovan.decoene@kuleuven.be
bSoft Matter and Biophysics, Department of Physics and Astronomy, Katholieke Universiteit Leuven, Leuven, Belgium
First published on 22nd August 2024
Abstract
A straightforward, controllable, and cost-effective system was developed for the optical printing of photosensitive polymers. By utilizing a digital micromirror device (DMD), the optical printing system enables the facile and rapid fabrication of photosensitive materials with any desired structures. As such, poly(2-hydroxyethyl methacrylate)(PHEMA)-based 1D and 2D diffraction gratings with high resolution and excellent optical performance were printed for use as alcohol sensors, where the diffraction efficiency would change due to the expansion of the hydrogel matrix upon exposure to alcohol solutions. During alcohol sensing measurements, both zero- and first-order optical powers of hydrogel gratings were recorded in response to various concentrations in the range of 0 to 50 vol% of ethanol, isopropanol, and methanol for the analysis of variations in diffraction efficiency. The sensing performance was explored across different crosslinking densities of PHEMA-based 2D gratings. Significant changes were observed, with a low detection limit of 1 vol% for methanol and ethanol in 2D gratings printed from a 98% HEMA solution. Moreover, sub-second response times were achieved in all the measurements, and the gratings demonstrated excellent recyclability. The proposed optical printing system offers advantages such as customization of microstructures, a wide choice of hydrogels, high efficiency, low cost and environmental friendliness. This versatile and powerful platform holds promise for developing highly sensitive and selective sensors for a wide array of applications in physical, chemical, and biological sensing.
Introduction
Stimuli-responsive hydrogels, characterized as smart materials, have been increasingly recognized as promising candidates for chemical and biological sensing, owing to their modifiable physicochemical properties which dynamically respond to alterations in environmental stimuli, such as variations in pH, temperature, pressure, and the presence of specific chemicals or biomolecules.1–3 Equipped with elaborately designed microstructures, these hydrogel-based devices find diverse utility across domains spanning biomedical diagnostics,4,5 environmental monitoring,6,7 wearable technology,8–10 and soft robotics.11,12 Among them, hydrogel grating sensors, combining hydrogel properties with diffraction grating technology, have gained attention for their high sensitivity, specificity, and versatility in biosensing and environmental monitoring. These sensors detect analytes like glucose, metal ions, and viruses13–16 by altering their grating structure in response to stimuli. They offer label-free detection and biocompatibility, making them suitable for biomedical applications.17,18 Despite their potential, challenges include achieving sensitivity and selectivity in complex environments and maintaining stability. Research aims to improve sensor reliability, scalability, and integration with technologies like nanomaterials and smart connectivity for broader applications.The successful integration of smart materials into practical applications relies heavily on the selection and utilization of fabrication techniques.19–22 As one of the mainstream techniques, mask-based photolithography has been widely employed. For instance, Han Yu Peng et al.23 developed a simple grating system for detecting ethanol concentrations using poly(NIPAM-co-AAm) hydrogel via microcontact printing, showing significant diffraction efficiency changes with ethanol concentrations between 0–30 vol% at various temperatures. Similarly, Ahmed et al.24 created a PHEMA-based alcohol sensor with an Aztec layer mask, achieving sensitivity to different alcohol concentrations with a 20-second response time and a 1 vol% detection limit for ethanol. However, mask-based techniques require intermediary media to transfer patterns, adding complexity and cost while limiting material and structural flexibility. Interferometric and holographic lithography offer alternatives for creating holographic sensors without intermediary masks, suitable for detecting analytes and physical parameters.25 R. Gupta et al.26 used laser interferometric lithography to fabricate poly(acrylamide) hydrogel gratings with fluorescein immobilized in alternating strips, enabling precise patterning for spectroscopic pH sensing. A. J. Marshall et al.27 demonstrated the use of holographic sensors to measure metabolites like urea and penicillin G by incorporating ionizable monomers into thin, polymeric hydrogel films to monitor the pH changes associated with specific enzymatic reactions. Although these techniques can produce precise and periodic patterns, they are hindered by complex setup requirements, the need for highly coherent light sources, and precise alignment. In contrast, additive manufacturing, commonly known as 3D printing, does not require complicated etching processes of masks and has the advantages of a wide range of material selection, ease of use, and low cost. Among all the different 3D printing techniques, VAT photopolymerization, which utilizes a light source to trigger polymerization in photosensitive materials,28 has attracted particular attention due to its high printing efficiency and high resolution.29,30 Additionally, maskless photolithography based on digital micromirror device (DMD) allows for pixel-level control over the light source distribution, enabling the fabrication of microstructures with exceptional precision and reproducibility.31,32 D. W. Yee et al.33 used digital light processing (DLP) printer to create stable genomic DNA-coated polymeric lattices that successfully captured doxorubicin from human serum. B. Zhang et al.34 developed highly stretchable and UV-curable hydrogels for high-resolution biostructures and tissues using DLP 3D printing, suggesting applications like 3D-printed contact lenses and flexible electronic boards with conductive hydrogel circuits. While commercial maskless photolithography systems based on DMD offer significant advantages, they also come with certain limitations and disadvantages, such as high cost, time-consuming processing, and restricted material flexibility.
In this work, we introduced a flexible and low cost optical printing system based on DMD to design and fabricate hydrogel microsensors with poly(2-hydroxyethyl methacrylate) (PHEMA). Our PHEMA-based hydrogel gratings not only exhibit excellent optical performance, but also show sensitive and rapid responses to various concentrations of methanol, ethanol, and isopropanol. PHEMA hydrogels are highly hydrophilic, enabling them to swell and alter their physical properties in the presence of alcohols, while their chemical stability ensures consistent performance and longevity across various solvents. Additionally, they are biocompatible, non-toxic, and cost-effective to synthesize, making them ideal for sensitive, reliable, and versatile alcohol sensors suitable for biological systems or environments. Both the crosslinking density and polymer chain structure significantly influence its sensing performance. Crosslinking density determines the hydrogel's rigidity and porosity: higher density results in a stiffer structure, while lower density enhances flexibility. The polymer chain structure, including length and flexibility, directly impacts sensitivity; longer and more flexible chains tend to increase alcohol absorption and sensor response. Achieving an optimal chain structure is crucial to balancing sensitivity with mechanical stability.23 The choice of hydrogel depends on the specific requirements of the sensor application, including sensitivity, response time, biocompatibility, and environmental stability. Other hydrogels with similar or tuneable properties, such as Poly(N-isopropylacrylamide) (PNIPAM) and Poly(acrylamide) (PAAm),23,35 could also be effectively used. However, the lower critical solution temperature (LCST) of PNIPAM and its sensitivity to temperature changes may affect its stability and performance. Additionally, the crosslinking process of PAAm can be more challenging, making it less easy to fabricate compared to PHEMA. Compared to traditional alcohol sensing methods,36–39 hydrogel sensors provide reliable detection of alcohol concentrations with high sensitivity and straightforward implementation. The use of hydrogel materials makes them suitable for various applications, including continuous monitoring in wearable devices, rapid testing in clinical settings, and environmental monitoring due to their biocompatibility and customizable properties.
Method and materials
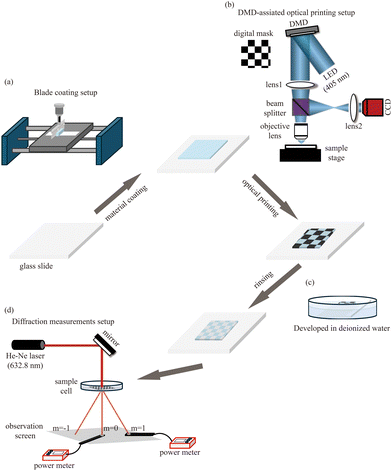
Initially, hydrogel materials are blade-coated onto a conventional glass slide by a home-built blade coating setup (Fig. 1(a)). Subsequently, various designed structures can be built up using a DMD-assisted optical printing technique (Fig. 1(b)). After a simple rinsing process to wash off the uncured hydrogel solution (Fig. 1(c)), the printing is completed. Once the desired microstructures are printed, sensing detection can be promptly implemented on a diffraction efficiency measurement setup (Fig. 1(d)).Optical printing setup
As Fig. 1(b) shows, the collimated LED light beam with the wavelength of 405 nm (Thorlabs, M405LP1-C1) is spatially modulated by the digital mask loaded on the DMD (Vialux, V7000) and directed by the reflection function of the DMD into a demagnification system which is configured by a bi-convex lens with focal length of 200 mm (Thorlabs, LB1945) and microscope objective lens (Olympus LUCPlanFL N 20x). The modulated light with the designed pattern will eventually be projected onto the hydrogel material. A beamsplitter allows the reflected light to be imaged by a CCD for feedback which is integrated into a microscope (Olympus IX71) in practice.Theory of diffraction efficiency changing
Optical diffraction gratings, characterized by their periodic structures that disperse light into multiple beams moving in diverse directions40 find application not solely in optical instruments like monochromators and spectrometers41 but also in the precise detection of various analytes.42–44 The diffraction equation can be expressed as:mλ = d(sin![[thin space (1/6-em)]](https://www.rsc.org/images/entities/char_2009.gif) θi − sin θi − sin![[thin space (1/6-em)]](https://www.rsc.org/images/entities/char_2009.gif) θd) θd) |
Additionally, according to grating theory, the diffraction efficiency (DE) can be approximately described by the following equation:45
| DE ∝ {[π(ng − ns)h]/2}2 |
Materials
2-Hydroxyethyl methacrylate (HEMA) (99%), ethyleneglycol dimethacrylate (EGDMA) (98%), lithium phenyl-2,4,6-trimethylbenzoylphosphinate (LAP) (99%), poly(allylamine hydrochloride)(PAH), methanol (≥99.9%), ethanol (≥99.8%), and isopropanol (99+%). All chemicals were purchased from Sigma-Aldrich and used as received.Experimental section
Fabrication of hydrogel-based grating sensors
To prepare the hydrogel solutions, the HEMA monomer and cross-linker EGDMA are mixed first. Different molar ratios of EGDMA to the mixed solution (2% EGDMA + 98% HEMA, 5% EGDMA + 95% HEMA, and 8% EGDMA + 92% HEMA) were prepared to investigate the influence of crosslinking density on alcohol sensing. Next, LAP (1% wt vol−1) (photo-initiator) was dissolved in deionized (DI) water (100 μl) by stirring for 30 min. Later, both solutions were mixed.Before the coating of the hydrogel solution, a thin layer of PAH solution was coated onto the substrate for 10 min to increase the adhesion between the glass substrate (Fisher, 1.0–1.2 mm, which was cleaned with ammonium peroxydisulfate acidic cleaning solution beforehand) and the polymer. A homemade blade coating device was employed for hydrogel solution (20 μl) coating which is equipped with a micrometer to control the thickness of the hydrogel layer. A 1D grating mask with periodic of 3.6 μm and a 2D diffraction grating mask with a periodic constant of 3.6 μm X 3.6 μm were designed and uploaded onto the DMD for printing. A 405 nm LED was used for triggering the polymerization of hydrogel since a visible light-sensitive photoinitiator LAP was mixed in the hydrogel solution. The optical power and exposure time for printing were 0.856 mW mm−2 and 50 seconds respectively. After washing off the unpolymerized hydrogel solution with DI water, a hydrogel-based grating sensor was created.
Crosslinking density of PHEMA measurements
Hydrogel solutions with molar ratios of EGDMA at 2%, 5%, and 8% were photopolymerized under identical conditions. The resulting samples were dried completely and weighed to obtain their initial dry weights. Each dried sample was then immersed in DI water and allowed to swell for 24 hours to reach equilibrium. After swelling, the samples were gently blotted to remove surface water and weighed again to measure the swollen weights.Optical characterizations of hydrogel gratings
The printed hydrogel grating was characterized by both optical microscopy (ZEISS Imager. M1) and scanning electron microscopy (JEOL, JSM-6010LV) to get the structural features. Under white light illumination (Ocean optics, Inc, LS1), a compacted spectrometer (Thorlabs, CCS200/M) was employed to capture the spectra of the first order which was diffracted from the gratings. To characterize the diffraction efficiency of the gratings, a red laser light with a wavelength of 632.8 nm (Uniphase 102-3 Helium-Neon Laser/4 mW) was used at normal incidence, and the periodic diffraction patterns were recorded at the plane which is 250 mm away from the sample plane. Moreover, the brilliant structural colors were captured by a smartphone.Diffraction efficiency measurements
The PHEMA hydrogel grating was simply integrated with a He-Ne laser (Uniphase 102-3 Helium-Neon Laser/4 mW), an optical mirror (Thorlabs, PF10-03-P01), a sample cell, and a power meter (Thorlabs, PM100D) to establish the alcohol-sensing platform. All components were meticulously positioned on an optical table to ensure consistent and stable sensing conditions. The hydrogel grating, printed on a glass plate, was submerged in the sample cell containing an aqueous solution with a specific alcohol concentration.The laser emitting light at a wavelength of 632.8 nm was employed to irradiate incident light perpendicularly onto the hydrogel grating. Concurrently, the power meter measured the transmitted optical powers of both the zero-order (I0) and first-order (I1) diffraction beams. To evaluate the alcohol-sensing capability, various concentrations ranging from 0 to 50 vol% of methanol, ethanol, and isopropanol were introduced to the PHEMA sensor. The initial transmitted powers and diffraction efficiency were determined by the transmitted powers through the grating sensor while immersed in DI water. Both the zero- and first-order diffraction powers were measured using the power meter. The DI water was then substituted with a 5 vol% ethanol solution, and the newly transmitted powers were recorded. This process was repeated with increasing concentrations, incrementing by 5 vol% up to 50 vol%. To eliminate the impact of the previous measurement, the sensor was dried by suction to remove any residual solution before introducing the new solution. The same detailed procedures were replicated for all other alcohol solutions. To investigate the threshold concentration, alcohol sensing with low concentration ranges from 0–5% were tested out on printed 1D and 2D PHEMA-gratings. The influence of the crosslinking density of hydrogels on alcohol sensing performance was investigated using 2D PHEMA-gratings printed with different molar ratios of EGDMA. Notably, the hydrogel gratings were stored in sealed Petri dishes and rehydrated with DI water before measurements. Each measurement was completed quickly (within 1–2 minutes) to minimize water evaporation from the hydrogels. All the measurements were performed in transmission mode as demonstrated in Fig. 1(d).
Response time and repeatability measurements
To evaluate the response time, a spectrometer (Ocean Optics, USB4000) was used to monitor the dynamic response process due to their ability to capture detailed spectral changes with high accuracy and precision. Before exposure to alcohol, the peak of the first-order dispersion spectra settled at a specific wavelength. As alcohol was introduced, the peak gradually shifted to longer wavelengths, returning to stability after interaction. The time interval between these transitions reflects the sensor's response time. Different alcohols including methanol, ethanol, and isopropanol with a concentration of 25% were tested. The changing rate of spectral shift represents the response time. The repeated alcohol sensing was achieved by simply washing PHEMA-gratings with DI water for alcohol removal, followed the addition of ethanol solution with 25% concentration for detection.Results and discussion
Optical characterizations of the printed hydrogel sensor
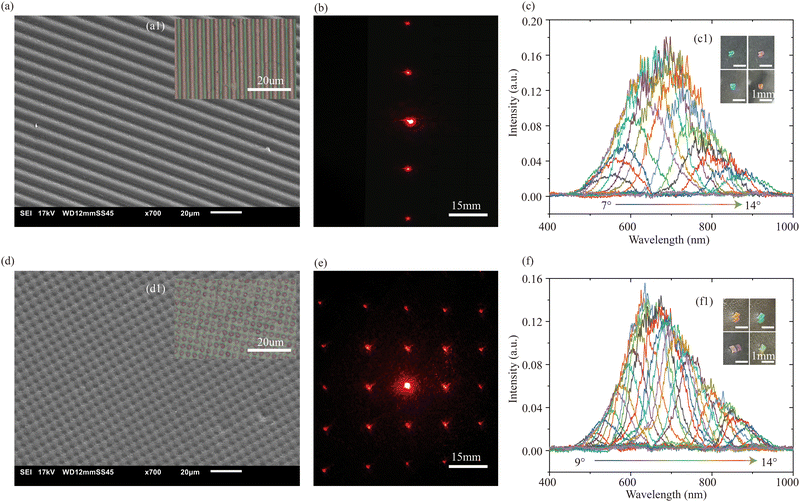
Fig. 2 shows the optical characterizations of 1D(a)–(c) and 2D(d)–(f) hydrogel gratings printed by DMD-assisted optical printing with HEMA hydrogel. Slightly expanded structural features with 3.8 μm for printed 1D PHEMA grating and 3.7 μm × 3.7 μm for printed 2D PHEMA grating were measured using SEM and optical imaging. Diffraction patterns of the printed PHEMA gratings are shown in Fig. 2(b) for 1D grating and Fig. 2(e) for 2D grating under the red laser illumination. Their dispersion abilities are verified not only by successfully splitting the broadband light into multiple monochrome beams but also by presenting bright structural colors, as shown in Fig. 2(c) for 1D PHEMA grating and Fig. 2(f) for printed 2D PHEMA grating.Alcohol sensing of the printed PHEMA-gratings
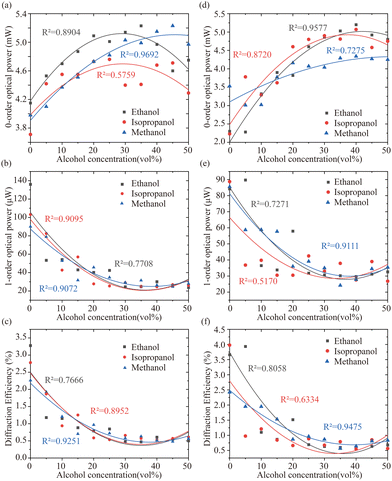
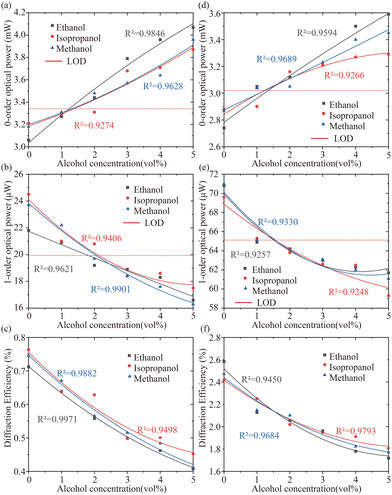
Since the PHEMA sensors have volumetric change when exposed to alcohol solutions, the effects of alcohol concentrations on the DE values are investigated by a diffraction efficiency measurement setup (shown in Fig. 1(d)) where the optical powers of zero-order (I0) and the first-order (I1) are recorded in respond to different concentrations of alcohol solutions. DE values are easily calculated by DE = I1/10 for analysis. Three alcohols including methanol, ethanol and isopropanol were studied on printed both 1D and 2D PHEMA-gratings. Fig. 3 shows the non-linear response of printed PHEMA-gratings (a–c for 1D grating and d–f for 2D grating) when exposed to alcohol solutions with concentration varying from 0–50 vol%. For either grating and each alcohol upon increasing concentration, there is a noticeable increase in the zero-order intensities I0, while the first-order intensities I1 display a declining trend, consequently resulting from a decrease in DE. Through comparison between Fig. 3(c) and Fig. 3(f), higher DE and larger changes were observed in the sensing with 2D grating, although both 1D and 2D gratings respond to different concentrations of alcohol solution in the same tendency.The results of printed 1D and 2D gratings at the low concentration range of 0–5% with a concentration difference of 1% were demonstrated in Fig. 4(a)–(c) for printed 1D PHEMA-grating and Fig. 4(d)–(f) for printed 2D PHEMA-grating. Using the equation SB + 3σB, where SB is the mean signal measurements of reagent blank, and σB is the standard deviation of responses of reagent blank, the estimated LOD values of zero-order powers are 3.34 mW and 3.02 mW for 1D and 2D sensors. For 1D grating, threshold sensing concentration of 2%, 2%, and 3% were determined for methanol, ethanol, and isopropanol, respectively. For the 2D grating, threshold sensing concentration of 1%, 1%, and 2% for methanol, ethanol, and isopropanol, respectively. For the first-order intensities, the estimated LOD values are 19.93 μW and 65.12 μW for 1D and 2D sensors. Threshold sensing concentration for methanol, ethanol and isopropanol remained the same as the results from zero-order. In addition, printed 2D PHEMA grating shows better diffraction efficiency and higher sensitivity which was found to agree with the above conclusion. Alcohol sensing threshold values for both 1D and 2D grating are summarised in Table 2 together with response time which is discussed consequently.
Fig. 5 shows the dynamic change in the first-order diffraction peak wavelength with time in aqueous solution with different alcohols ((a) for printed 1D PHEMA grating and (b) for printed 2D PHEMA grating). Upon addition of the alcohol solutions in the sample cell, a fast shift in the position of diffraction peak was observed. Remarkable response time of 870 ms, 631 ms, and 643 ms for methanol, ethanol, and isopropanol respectively are achieved in 1D grating sensing, while 550 ms, 541 ms and 527 ms are observed in 2D grating sensing. There are two main explanations for sub-second response time: (i) strong affinity between the hydrogel network and alcohol solutions due to hydrogen bonding and similar solubility parameters48 (values shown in Table 1), leading to rapid absorption and diffusion of alcohol; (ii) the short diffusion length of the micron-sized hydrogel-gratings, which allows quick diffusion and swelling equilibrium of alcohol molecules.
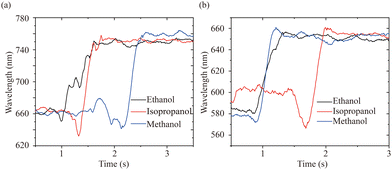 | ||
| Fig. 5 Time response of printed 1D PHEMA grating (a) and 2D PHEMA grating (b) to different alcohols. | ||
| Refractive index | Solubility [(cal cm−3)1/2] | |
|---|---|---|
| HEMA | 1.512 | 11.6 |
| Methanol | 1.328 | 14.5 |
| Ethanol | 1.361 | 12.9 |
| Isopropanol | 1.378 | 11.5 |
| Threshold concentration(vol%) | Response time (ms) | |||
|---|---|---|---|---|
| 1D grating | 2D grating | 1D grating | 2D grating | |
| Methanol | 2 | 1 | 870 | 550 |
| Ethanol | 2 | 1 | 631 | 541 |
| Isopropanol | 3 | 2 | 643 | 527 |
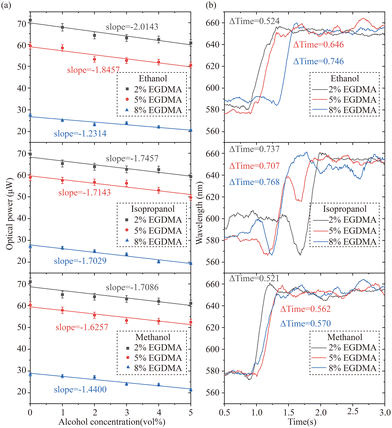
The swelling ratios (Q) were calculated using the formula Q = Wswollen − Wdry, where Wswollen and Wdry are the weights of the swollen and dry samples, respectively. Providing insights into the effect of crosslinking density on PHEMA properties. The higher the molar ratio of EGDMA, the higher the crosslinking density, resulting in a lower Q. When the molar ratio of EGDMA increased from 2% to 5% and 8%, the Q decreased from 1.56 to 1.37 and 1.35, respectively. The alcohol sensing performance of these PHEMA 2D gratings is shown in Fig. 6. The change of first-order optical powers of differently crosslinked PHEMA sensors in response to low concentrations of different alcohols was studied to compare the sensing sensitivity because first-order diffraction typically provides more specific and distinct information about the interaction of light with the analyte. The slopes of linear response represent the sensing sensitivity. Fig. 6(a) illustrates that, for each alcohol, sensitivity slightly decreased with increased crosslinking density. This indicates that higher crosslinking densities may restrict the swelling of the hydrogel, thereby reducing its responsiveness to alcohol concentration changes. As shown in Fig. 6(b), the response time was also influenced by the crosslinking density of PHEMA sensors, with a slightly slower response time observed as the ratio of EGDMA increased. The crosslinking density of the hydrogel plays a crucial role in determining the sensor's performance in terms of sensitivity and response time. Other factors, such as crosslinker concentration, different types of crosslinkers, chemical modifications, and polymerization conditions, can be varied to tailor the crosslinking density of PHEMA hydrogels to meet specific requirements for various applications, including alcohol sensing.
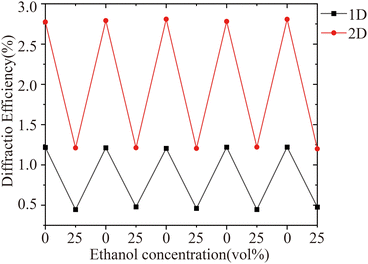
Moreover, the printed hydrogel sensors show great robustness, since the response–recovery cycles can be carried out repeatedly with highly consistent performance as illustrated in Fig. 7. The diffraction efficiency, calculated from the recorded I0 and I1 values, remained stable across repeated response-recovery cycles. The same 1D and 2D sensors were tested for measurements, including alcohol sensing in Fig. 3–5, and repeatability in Fig. 7, illustrating the sensors' high stability over extended periods of use.
Unlike other alcohol sensors whose fabrication may involve complicated design or high-cost fabrication procedures, the proposed hydrogel grating sensors, fabricated by a simple, rapid, and cost-efficient optical printing method, are capable of achieving reliable and instant alcohol sensing via a simple optical readout method. Furthermore, the alcohol-responsive hydrogel can be substituted with any other stimuli-responsive hydrogels for applications like remote sensing of glucose, pH, proteins, and various other analytes.
Conclusions
A straightforward and cost-effective system for printing photosensitive materials has been developed, utilizing a controllable digital micromirror device (DMD) to fabricate 1D and 2D hydrogel gratings with micrometer-sized features in a single, simple, and fast exposure step. These gratings, owing to the characteristics of PHEMA hydrogels, can be seamlessly integrated into optical detection systems for applications such as alcohol sensing. By varying the structures of hydrogel gratings, significant changes in diffraction efficiency (DE) and higher sensitivities are observed in 2D PHEMA sensors, making them highly responsive to alcohol concentrations with a threshold detection of 1 vol% response within a second. The molar ratios of EGDMA were varied to explore how the crosslinking density influenced the sensing performance. It was observed that a higher crosslinking density resulted in lower sensitivity and slower response time. In our studies, both 1D and 2D PHEMA sensors have demonstrated slightly higher selectivity to methanol and ethanol compared to isopropanol. The selectivity of PHEMA sensors to different alcohols may depend on their molecular sizes and refractive indexes. The smaller size of methanol and ethanol may penetrate the PHEMA structure more easily and cause larger refractive index contrasts compared to other alcohols, such as isopropanol and 1-butanol.The ease of manufacturing and deployment, coupled with the sub-second response time to alcohol, set PHEMA grating sensors apart from other types of alcohol sensors. Furthermore, this DMD-based optical printing system can theoretically achieve any design of microstructures, allowing flexible fabrication of smart hydrogels for various applications.
Author contributions
J. Xu: investigation, validation, data curation, writing – original draft, writing – review & editing. F. L. Guo: validation, data curation. C. Bartic: resources. Y. d. Coene: methodology, project administration, writing – review & editing. K. Clays: supervision, writing – review & editing.Data availability
Data for this article, including the spectra used to characterize the 1D and 2D PHEMA gratings, optical powers of zero and first diffraction orders recorded for alcohol sensing analyses, and spectra for dynamic monitor of alcohol response process are available at [hydrogel-alcohol-sensors] at https://github.com/jing-mmt/hydrogel-alcohol-sensors.git.Conflicts of interest
There are no conflicts to declare.Acknowledgements
J. X. and F. L. G. acknowledge the support from China Scholarship Council (CSC). Y. d. C. acknowledges the support from the Fund for Scientific Research-Flanders (FWO) (1234222N).References
- M. C. Koetting, J. T. Peters, S. D. Steichen and N. A. Peppas, Mater. Sci. Eng., 2015, 93, 1–49 CrossRef PubMed.
- I. Tokarev and S. Minko, Soft Matter, 2009, 5, 511–524 RSC.
- W. Wang, P.-F. Li, R. Xie, X.-J. Ju, Z. Liu and L.-Y. Chu, Adv. Mater., 2022, 34, 2107877 CrossRef CAS PubMed.
- Q. Shi, H. Liu, D. Tang, Y. Li, X. Li and F. Xu, NPG Asia Mater., 2019, 11, 64 CrossRef CAS.
- H. Zhou, Y. Zhu, B. Yang, Y. Huo, Y. Yin, X. Jiang and W. Ji, J. Mater. Chem. B, 2024, 12, 1748–1774 RSC.
- X. Li, B. Tang, B. Wu, C. Hsu and X. Wang, Ind. Eng. Chem. Res., 2021, 60, 4639–4649 CrossRef CAS.
- J. Qin, B. Dong, X. Li, J. Han, R. Gao, G. Su, L. Cao and W. Wang, J. Mater. Chem. C, 2017, 5, 8482–8488 RSC.
- Z. Chen, J. Liu, Y. Chen, X. Zheng, H. Liu and H. Li, ACS Appl. Mater. Interfaces, 2021, 13, 1353–1366 CrossRef CAS PubMed.
- Q. Guan, G. Lin, Y. Gong, J. Wang, W. Tan, D. Bao, Y. Liu, Z. You, X. Sun, Z. Wen and Y. Pan, J. Mater. Chem. A, 2019, 7, 13948–13955 RSC.
- H. Huang, L. Han, X. Fu, Y. Wang, Z. Yang, L. Pan and M. Xu, Adv. Electron. Mater., 2020, 6, 2000239 CrossRef CAS.
- H. Zeng, P. Wasylczyk, D. S. Wiersma and A. Priimagi, Adv. Mater., 2018, 30, 1703554 CrossRef.
- M.-Y. Chiang, Y.-C. Lo, Y.-H. Lai, Y.-Y. A. Yong, S.-J. Chang, W.-L. Chen and S.-Y. Chen, J. Mater. Chem. B, 2021, 9, 6634–6645 RSC.
- G. Ye and X. Wang, Biosens. Bioelectron., 2010, 26, 772–777 CrossRef CAS PubMed.
- W. Bai and D. A. Spivak, Angew. Chem., Int. Ed., 2014, 53, 2095–2098 CrossRef CAS PubMed.
- X. Wang, X. Liu and X. Wang, Sens. Actuators, B, 2014, 204, 611–616 CrossRef CAS.
- C. L. Chang, Z. Ding, V. N. L. R. Patchigolla, B. Ziaie and C. A. Savran, IEEE Sens. J., 2012, 12, 2374–2379 CAS.
- J. Tavakoli and Y. Tang, Polymers, 2017, 9, 364 CrossRef PubMed.
- G. Ye, C. Yang and X. Wang, Macromol. Rapid Commun., 2010, 31, 1332–1336 CrossRef CAS PubMed.
- M. Su and Y. Song, Chem. Rev., 2022, 122, 5144–5164 CrossRef CAS PubMed.
- M. Alizadehgiashi, C. R. Nemr, M. Chekini, D. Pinto Ramos, N. Mittal, S. U. Ahmed, N. Khuu, S. O. Kelley and E. Kumacheva, ACS Nano, 2021, 15, 12375–12387 CrossRef CAS PubMed.
- W. Gao, H. Chao, Y.-C. Zheng, W.-C. Zhang, J. Liu, F. Jin, X.-Z. Dong, Y.-H. Liu, S.-J. Li and M.-L. Zheng, ACS Appl. Mater. Interfaces, 2021, 13, 27796–27805 CrossRef CAS PubMed.
- J.-F. Xing, M.-L. Zheng and X.-M. Duan, Chem. Soc. Rev., 2015, 44, 5031–5039 RSC.
- H.-Y. Peng, W. Wang, F.-H. Gao, S. Lin, X.-J. Ju, R. Xie, Z. Liu, Y. Faraj and L.-Y. Chu, Ind. Eng. Chem. Res., 2019, 58, 17833–17841 CrossRef CAS.
- I. Ahmed, M. Elsherif, S. Park, A. K. Yetisen and H. Butt, ACS Appl. Nano Mater., 2022, 5, 7744–7753 CrossRef CAS.
- A. K. Yetisen, I. Naydenova, F. da Cruz Vasconcellos, J. Blyth and C. R. Lowe, Chem. Rev., 2014, 114, 10654–10696 CrossRef CAS.
- R. Gupta, S. El Sayed and N. J. Goddard, RSC Adv., 2021, 11, 40197–40204 RSC.
- A. J. Marshall, D. S. Young, J. Blyth, S. Kabilan and C. R. Lowe, Anal. Chem., 2004, 76, 1518–1523 CrossRef CAS PubMed.
- B. Yilmaz, A. Al Rashid, Y. A. Mou, Z. Evis and M. Koç, Bioprinting, 2021, 23, e00148 CrossRef.
- Z. Zhao, X. Tian and X. Song, J. Mater. Chem. C, 2020, 8, 13896–13917 RSC.
- R. Chaudhary, P. Fabbri, E. Leoni, F. Mazzanti, R. Akbari and C. Antonini, Prog. Addit. Manuf., 2023, 8, 331–351 CrossRef.
- D. Dudley, W. M. Duncan and J. Slaughter, MOEMS Display Imag. syst., 2003, 4985, 14–15 Search PubMed.
- Y.-X. Ren, R.-D. Lu and L. Gong, Ann. Phys., 2015, 527, 447–470 CrossRef.
- D. W. Yee, S. W. Hetts and J. R. Greer, ACS Appl. Mater. Interfaces, 2021, 13, 41424–41434 CrossRef CAS PubMed.
- B. Zhang, S. Li, H. Hingorani, A. Serjouei, L. Larush, A. A. Pawar, W. H. Goh, A. H. Sakhaei, M. Hashimoto, K. Kowsari, S. Magdassi and Q. Ge, J. Mater. Chem. B, 2018, 6, 3246–3253 RSC.
- M. A. Haq, Y. L. Su and D. J. Wang, Mater. Sci. Eng., C, 2017, 70, 842–855 CrossRef PubMed.
- A. S. Campbell, J. Kim and J. Wang, Curr. Opin. Electrochem., 2018, 10, 126–135 CrossRef CAS PubMed.
- S. K. Srivastava, R. Verma and B. D. Gupta, Sens. Actuators, B, 2011, 153, 194–198 CrossRef CAS.
- P. Wiśniewska, M. Śliwińska, T. Dymerski, W. Wardencki and J. Namieśnik, Crit. Rev. Anal. Chem., 2015, 45, 201–225 CrossRef PubMed.
- J.-J. Li, C.-X. Song, C.-J. Hou, D.-Q. Huo, C.-H. Shen, X.-G. Luo, M. Yang and H.-B. Fa, J. Agric. Food Chem., 2014, 62, 10422–10430 CrossRef CAS PubMed.
- C. Palmer and E. G. Loewen, Diffraction grating handbook, Newport Corporation, 2005 Search PubMed.
- T. K. Gaylord and M. G. Moharam, Proc. IEEE, 1985, 73, 894–937 Search PubMed.
- M. I. Lucío, A. H. Montoto, E. Fernández, S. Alamri, T. Kunze, M.-J. Bañuls and Á. Maquieira, Biosens. Bioelectron., 2021, 193, 113561 CrossRef.
- R. C. Bailey, J.-M. Nam, C. A. Mirkin and J. T. Hupp, J. Am. Chem. Soc., 2003, 125, 13541–13547 CrossRef CAS PubMed.
- V. K. S. Hsiao, W. D. Kirkey, F. Chen, A. N. Cartwright, P. N. Prasad and T. J. Bunning, Adv. Mater., 2005, 17, 2211–2214 CrossRef CAS.
- K. A. Nelson, R. Casalegno, R. J. D. Miller and M. D. Fayer, J. Chem. Phys., 1982, 77, 1144–1152 CrossRef CAS.
- I. Alenichev, Z. Sedláková and M. Ilavský, Polym. Bull., 2007, 58, 191–199 CrossRef CAS.
- P. W. Zhu and D. H. Napper, J. Colloid Interface Sci., 1996, 177, 343–352 CrossRef CAS.
- J. Liu, Y. Zhang, R. Zhou and L. Gao, J. Mater. Chem. C, 2017, 5, 6071–6078 RSC.
| This journal is © The Royal Society of Chemistry 2024 |

