 Open Access Article
Creative Commons Attribution 3.0 Unported Licence
Stimuli-responsive spin crossover behavior in 3D Fe(II) porous coordination polymers for guest molecules†
Li
Sun
a,
Xiaochun
Li
a,
Constance
Vandenbulcke
a,
Nour El Islam
Belmouri
 b,
Guillaume
Bouchez
b,
Koen
Robeyns
b,
Guillaume
Bouchez
b,
Koen
Robeyns
 a,
Aurelian
Rotaru
c,
Kamel
Boukheddaden
 b and
Yann
Garcia
 *a
*a
aInstitute of Condensed Matter and Nanosciences, Molecular Chemistry, Materials and Catalysis (IMCN/MOST), Université catholique de Louvain, Louvain-la-Neuve 1348, Belgium. E-mail: yann.garcia@uclouvain.be
bUniversité Paris-Saclay, UVSQ, CNRS, GEMAC UMR 8635, 45 Avenue des Etats Unis, Versailles Cedex F78035, France
cDepartment of Electrical Engineering and Computer Science and MANSiD Research Center, “Stefan cel Mare” University, University Street, 13, Suceava 720229, Romania
First published on 8th October 2024
Abstract
Structurally characterized porous spin crossover compounds are attractive types of materials due to their properties that can be regulated under several stimuli, resulting in drastic changes in their optical, electrical, and magnetic responses, leading to potential applications in chemical sensing, memory devices, actuators, etc. In this work, a new 3D FeII spin crossover porous coordination polymer, [Fe(tpe)2dca]ClO4·5CHCl3·3CH3OH (1, tpe = trans-1,2-bis(4-pyridyl)ethene; dca = N(CN)2−), which accommodates guest molecules in its cavities to modulate its magnetic and optical properties, was prepared. 1 was characterized by X-ray diffraction in its fully solvated form by flash cooling single crystals at 100 K, thermogravimetric analysis, elemental analysis and its spin crossover tracked by magnetic susceptibility, and studied by differential scanning calorimetry on single crystals. Compound 1 displays gradual and incomplete spin crossover behaviour with a transition temperature of T1/2 ∼ 155 K. An optical microscopy study carried out on one single crystal shows an abrupt transition around 180 K with a darkening of the crystal in the low-spin phase, although no clear evidence of an apparent size change was observed. When compound 1 loses its guest molecules partially, [Fe(tpe)2dca]ClO4·CHCl3·2H2O (2) is obtained in air atmosphere, which is paramagnetic. In addition, the complex [Fe(bpa)2(NCS)2]·solvent (bpa = 9,10-bis(4-pyridyl)anthracene, 3) remains paramagnetic down to 100 K, as confirmed by single crystal X-ray diffraction, due to the strong distortion of its octahedral coordination sphere as well as its rigid structure.
1. Introduction
Recently, the variable spin crossover (SCO) behaviour of coordination compounds caused by switching guest molecules has attracted many attention.1–4 Such compounds have indeed potential applications in the manufacture of functional devices such as high-density information storage, chromogenic devices, switching materials and chemical sensors, and are of great relevance for the development of new multifunctional materials.5,6 In addition, SCO complexes7 whose properties can be physically or chemically stimulated, by temperature, pressure, light and analytes, have been shown to induce significant changes in their optical (changing colour), magnetic (being in a diamagnetic t62ge0g (low-spin, LS) state or a paramagnetic t42ge2g (high-spin, HS) state), and mechanical properties.8–11 In addition, switching “on” and “off” the SCO behaviors by guest molecules is not only capable of storing information but is accompanied by a significant change in colour.12–14Not surprisingly, metal–organic frameworks (MOFs) and porous coordination polymers (PCPs) come readily to mind, which provide a versatile platform for building multi-responsive molecular switches because of their robust backbones and structural deformability. Among them, the most promising three-dimensional (3D) FeII SCO porous coordination polymers (PCPs) have been widely selected due to their porous structure that can encapsulate different analytes in various sides and amounts, enabling the formation of different interaction forces between host and guest molecules and thus modulating their magnetic and optical behaviours.15–18 For example, the orange 3D SCO compound, Fe(pyrazine)[Pt(CN)4], turned red and yellow after being in contact with CS2 and benzene, respectively, due to different host–guest interactions after absorption.19 Recently, replacing pyrazine with bztpy (bztpy = 1,2,4,5-tetra(4-pyridyl)benzene) afforded a 3D green–yellow PCP, [Fe(bztpy)Pt(CN)4]·0.5bztpy·CH3OH·3H2O, which showed different magnetic behaviours and colours with a different number of H2O molecules at room temperature (red for [Fe(bztpy)Pt(CN)4]·0.5bztpy·2H2O and yellow for [Fe(bztpy)Pt(CN)4]·0.5bztpy·H2O).13 Replacing pyrazine with bis(4-pyridyl) acetylene (bpac), which is rigid and longer, should improve the porosity of related PCP materials. Therefore, Fe(bpac)[Pt(CN)4]·H2O·0.71bpac was found to have a relatively large aperture compared to Fe(pyrazine)[Pt(CN)4], and a specific response to pyridine and pyrazine molecules, respectively, was observed.20 Host–guest interactions generally exist between the above-mentioned guest molecules and the host lattice (van der Waals forces, guest sizes, π–π interactions, hydrogen bonding interactions, etc.), which may not only change the transition temperature and degree of transformation but also modify the response type and the number of guest molecules.12,21,22
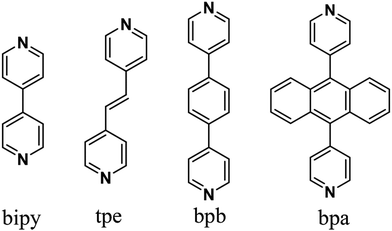
The central FeII ions of SCO PCPs are sensitive to external stimuli, as documented in our previous works23,24 ([Fe(bipy)2dca]ClO4·CHCl3·CH3OH, bipy = 4,4′-bipyridine, dca = [N(CN)2]−; [Fe(bpb)2dca]ClO4·0.5CH3OH·guest, bpb = 1,4-bis(4-pyridyl)benzene, guest = CHCl3 or CH2Cl2, Scheme 1). It was revealed that these clathrates are the best candidates for potential applications in sensors. Their advantages are listed as follows:13,21,25,26 (i) the structure and properties of 3D FeII SCO PCPs can be easily modified by changing the type of their ligand-linked functional group (changing the flexibility of ligands); therefore, variable organic ligands of 3D FeII SCO PCPs lead to structural and functional diversity, and the combination of different functional groups will significantly broaden the range of applications of 3D FeII SCO PCP materials. (ii) The dimensions of voids of PCPs with different ligand sizes are also variable, which can also change the specific response of SCO PCPs to different guest molecules or different numbers of guest molecules.
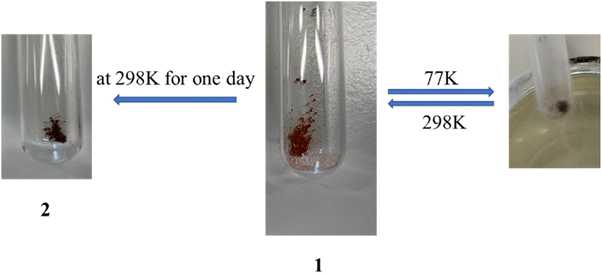
Herein, we report on two novel 3D FeII SCO PCPs, [Fe(tpe)2dca]ClO4·5CHCl3·3CH3OH (1, tpe = trans-1,2-bis(4-pyridyl)ethene) and a new 3D FeII PCP [Fe(bpa)2(NCS)2]·solvent (3, bpa = 9,10-bis(4-pyridyl)anthracene) (Scheme 1). The SCO properties of 1 were probed by magnetic susceptibility measurements, which revealed an incomplete SCO behaviour. In addition, the partial release of interstitial CHCl3 molecules from a crystal of 1, by drying at room temperature for one day, was accompanied by a colour change from red to dark brown, leading to [Fe(tpe)2dca]ClO4·CHCl3·2H2O (2) as well as change in magnetic properties. The thermochromism study shows that the colour of 1 switches from red (298 K) to almost black (77 K) in response to a thermal perturbation detected at low temperatures. However, there are no thermochromism for 2 and 3, nor the solvatochromic properties of complex 3. Therefore, PCP, 1, can be used as a detector or a colorimetric sensor for monitoring CHCl3 and potentially other volatile organic compounds (VOCs) that can be accommodated in its porous structure.
2. Results and discussion
2.1 Synthesis
In our previous work,24 [Fe(bipy)2dca]ClO4·CHCl3·CH3OH has shown a gradual one-step SCO well below room temperature and a thermal hysteresis loop (15 K) in a relatively higher temperature region (180 K to 195 K), with a very noticeable color change (orange, 298 K; dark brown, 77 K). To vary the pore dimension, bipy was replaced by extended ligands (Scheme 1). For instance, tpe was replaced in the crystal of [Fe(bipy)2dca]ClO4·CHCl3·CH3OH following similar syntheses conditions, which was expected to lead to a similar crystal structure with different SCO behaviours. Red colour single crystals of 1 were grown by diffusing a solution of tpe in CHCl3, layered by a solution of Fe(ClO4)2·6H2O, NaN(CN)2 (Nadca), and ascorbic acid in methanol at room temperature (298 K) for one day. When crystals of 1 (red, 298 K; almost black, 77 K, in Fig. 1) were left exposed to air at room temperature for one day, the colour changed progressively from red to dark brown (see Fig. 1), leading to [Fe(tpe)2dca]ClO4·CHCl3·2H2O (2). The formula of the compounds (1 and 2) was confirmed by single crystal X-ray diffraction, powder X-ray diffraction analysis, and elemental analysis, as a consequence of the replacement of chloroform and methanol by water molecules, from atmospheric humidity. Unfortunately, further extending the ligand size from tpe to bpa was unsuccessful, while a new 3D FeII PCP, [Fe(bpa)2(NCS)2]·solvent (3) was synthesized by liquid-to-liquid diffusion at room temperature. Synthesis of an iron complex with tpe and NCS anions did not yield single crystals.2.2 Single crystal X-ray structure
Diffraction data of 1 (Fig. 2) were successfully recorded at 100 K. The crystal quality was rather poor and a diffraction cut-off of 0.95 Å was imposed during integration, which is due to evaporation of the solvent molecules during crystal harvesting from the crystallization liquid. For the same reason, data collection under ambient conditions was unsuccessful, a situation which is not unexpected for chloroform containing FeII PCPs (see [Fe(bipy)2dca]ClO4·CHCl3·CH3OH).24Table 1 shows the main crystallographic parameters and refinement details of the SCO PCP 1. Compound 1 crystallizes in the monoclinic space group C2/m. All FeII atoms are crystallographically equivalent and situated in a distorted octahedron that is defined by a [FeN6] sphere as shown in Fig. 2. The octahedron around the FeII ion is formed by four nitrogen atoms from the tpe ligand to form a quadrilateral grid (Fig. 2c), and then, 2D [Fe(tpe)2]2− layers along the ac plane are formed. Meanwhile, the other two positions of FeII centers are bridged by the dca anion along the b-axis, forming a 3D PCP compound. At 100 K, the average Fe–N bond length is 1.972 Å, indicating that all FeII ions are in the LS state.27 In the 3D channels, comprising almost 2/3 of the unit cell volume, several non-coordinated CHCl3 molecules were located at discrete positions (Fig. 2a and b). Part of the disordered solvent molecule (CHCl3 and CH3OH) contribution was treated with the squeeze algorithm in PLATON.28 Thus, a large number of solvent guest molecules can be accommodated in the cavity, which is almost consistent with the elemental analysis results. These are part of an intermolecular contact network involving guest⋯guest and host⋯guest moieties (Fig. S1, ESI†).| Identification code | 1 | 3 | 3 |
|---|---|---|---|
| a Twin refinement (HFLF 5 formatted data, Merge 0). | |||
| Empirical formula | C26H20FeN7, 6(CHCl3), ClO4 [+solvent] | C50H32FeN6S2 [+solvent] | C50H32FeN6S2 [+solvent] |
| Formula weight | 1302.00 | 836.78 | 836.78 |
| T (K) | 100(2) | 100(2) | 298(2) |
| Wavelength (Å) | 0.71073 | 0.71073 | 0.71073 |
| Crystal system | Monoclinic | Orthorhombic | Orthorhombic |
| Space group | C2/m | Ibam | Ibam |
| Unit cell dimensions (Å) | a = 26.839(3) | a = 9.5529(2) | a = 9.59117(19) |
| b = 16.9029(16) | b = 18.9052(5) | b = 18.9464(4) | |
| c = 26.852(2) | c = 23.8392(5) | c = 23.8192(4) | |
| α = 90 | α = 90 | α = 90 | |
| β = 105.764(10) | β = 90 | β = 90 | |
| γ = 90 | γ = 90 | γ = 90 | |
| Volume (Å3) | 11![[thin space (1/6-em)]](https://www.rsc.org/images/entities/char_2009.gif) 724(2) 724(2) |
4305.32(17) | 4328.39(14) |
| Z | 8 | 4 | 4 |
| Density (calc.) (g cm−3) | 1.475 | 1.291 | 1.284 |
| Absorption coefficient (mm−1) | 1.162 | 0.489 | 0.487 |
| F(000) | 5184 | 1728 | 1728 |
| Crystal size (mm3) | 0.24 × 0.04 × 0.01 | 0.20 × 0.08 × 0.06 | 0.20 × 0.08 × 0.06 |
| Theta range for data collection (°) | 2.871 to 21.977 | 3.150 to 25.243 | 3.141 to 26.212 |
| Reflection collected | 7468 | 13![[thin space (1/6-em)]](https://www.rsc.org/images/entities/char_2009.gif) 548 548 |
14![[thin space (1/6-em)]](https://www.rsc.org/images/entities/char_2009.gif) 931 931 |
| Independent reflections | 7468 [R(int) = —]a | 1997 [R(int) = 0.0429] | 2220 [R(int) = 0.0287] |
| Completeness to (%) | 99.7 | 99.7 | 99.7 |
| Max. and min. transmission | 1.00000 and 0.30472 | 1.00000 and 0.95230 | 1.00000 and 0.87697 |
| Refinement method | Full-matrix least-squares on F2 | Full-matrix least-squares on F2 | Full-matrix least-squares on F2 |
| Data/restraints/parameters | 7468/762/652 | 1997/152/267 | 2220/73/179 |
| Goodness-of-fit on F2 | 1.344 | 1.062 | 1.077 |
| Final R indices [I > 2σ(I)] | R 1 = 0.1439, wR2 = 0.3139 | R 1 = 0.0338, wR2 = 0.0881 | R 1 = 0.0337, wR2 = 0.0875 |
| R indices (all data) | R 1 = 0.2262, wR2 = 0.3487 | R 1 = 0.0379, wR2 = 0.0909 | R 1 = 0.0383, wR2 = 0.0907 |
| Δρ(max, min) (e Å−3) | 1.044, −1.114 | 0.697, −0.500 | 0.274, −0.210 |
Unfortunately, no similar PCPs could be obtained with bpa mainly due to the steric hindrance effect that this bulkier ligand would impose. Yet, a new 3D FeII PCP, [Fe(bpa)2(NCS)2]·solvent (3) was synthesized by liquid-to-liquid diffusion at room temperature. This compound does not change its colour on cooling to 77 K, presumably due to the absence of SCO behavior. Single crystal X-ray diffraction analysis of the [Fe(bpa)2(NCS)2]·solvent shows that the crystal structure flash-cooled at 100 K is preserved after the same crystal is subsequently heated to 298 K and remeasured. Even at low temperature no discrete solvent molecules could be located and the disordered solvent contribution was treated with the squeeze algorithm in PLATON. Crystallographic and refinement details for the [Fe(bpa)2(NCS)2]·solvent are shown in Table 1. All FeII atoms are in a distorted [FeIIN6] octahedral coordination environment at 100 K and 298 K (Fig. 3a), the four equatorial positions are occupied by bpa ligands, to form 2D interpenetrating layers (Fig. 3b and c), and the two axial positions are occupied by nitrogen atoms from the bridging NCS− (Fig. 3a). At 100 K, the Fe–N bond length of bpa is 2.250(6) Å, and at 298 K, 2.262(1) Å, indicating HS FeII ions in the range of 100–298 K (the Fe–NCS distance is 2.110(4) Å at 100 K and 2.119(9) Å at 298 K). The low temperature structure is basically identical to the r.t. structure, while disorder was observed for the ligands when flash-cooled at low temperature, and heating the crystal to room temperature allowed the structure to relax, lifting the disorder. Therefore, the strong distortion of the octahedral coordination sphere in 3 as well as the rigid nature of the structure, due to interpenetrating layers, prevents the SCO transition to occur.
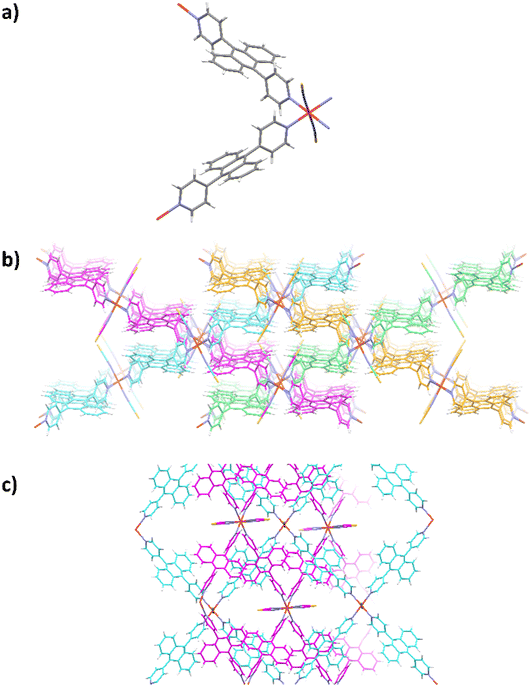 | ||
| Fig. 3 (a) Molecular view of 3. (b) Packing showing the 2D layers in different colours. (c) View perpendicular to the layers, showing the interpenetration. | ||
2.3 Powder X-ray diffraction (PXRD) analysis
Taking out of the mother liquor, the lattice of crystals of 1 readily undergoes desorption, losing CHCl3 molecules and provoking the partial loss of crystallinity and an apparent change of colour from red to dark brown. Fig. 4 displays the X-ray powder diffraction patterns of 1 recorded at 298 K together with the simulated one from single crystal X-ray data for 1 (100 K) depicted for comparison. This shows clearly the loss of crystallinity upon removal of the crystals from solution, resulting in a partially desolvated phase. After drying 1 at room temperature for one day, the X-ray powder diffraction pattern of 2 does not differ much from that of 1 (298 K), indicating that further departure of solvent molecules does not affect crystal packing. At this stage, it is worth mentioning that it is such crystals of 1 taken out of the mother liquor and characterized by elemental analysis, as [Fe(tpe)2dca]ClO4·5CHCl3·3CH3OH, that have been studied for magnetic, calorimetric and optical microscopy measurements, which will be discussed further.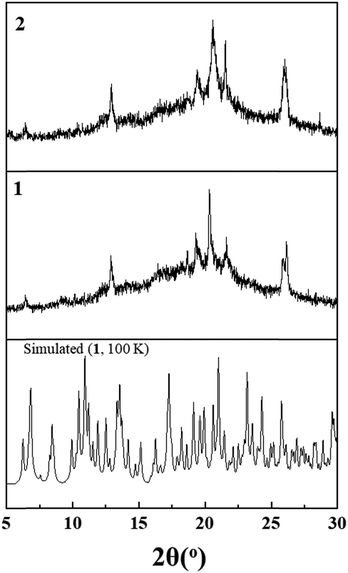 | ||
| Fig. 4 X-ray powder diffraction patterns of 1 and 2, collected at 298 K. The simulated pattern of solvated 1 (100 K) is also shown for comparison. | ||
2.4 Magnetic properties
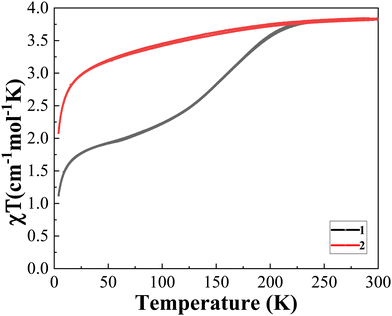
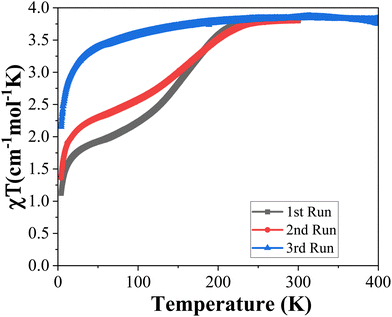
The temperature dependence of the χT product was recorded (where χ is the molar magnetic susceptibility and T is the temperature) for 1 by cooling and heating to study the guest effect on the SCO properties (Fig. 5). Crystalline 1 undergoes an incomplete spin transition in the range of 4 K to 300 K. In the cooling process, 1 retains the HS state to 226 K and then gradually decreases and reaches a plateau with a χT value of 2.00 cm3 mol−1 K at 63 K, with a T1/2 of ∼155 K (Fig. 5). No thermal hysteresis was detected in the SCO transition, even considering the heating process. The second run (4–300 K) of magnetic data decreases more slowly than the first run (4–300 K) and is more gradual and incomplete. When 1 was however heated at 400 K for 30 min, the SCO behavior becomes almost inactive (Fig. 6) matching the one of 2 (Fig. 5). The partial escape of solvent molecules is expected to reduce the interaction between guest⋯guest and host⋯guest molecules (Fig. S1, ESI†), resulting at the end in the disappearance of the SCO behavior. This result is confirmed by the magnetic data of 2, which shows that the FeII ion centers undergo a progressive SCO over the range of 4–300 K (Fig. 5, red line). The apparent discrepancy between the magnetic properties of 1 revealing an incomplete SCO and its crystal structure showing LS ions at 100 K is due to the fact that, for the crystal structure determination, crystals were flash cooled, thus keeping all solvent molecules (see Fig. 4 for a comparison between the diffraction patterns).2.5 Differential scanning calorimetry (DSC)
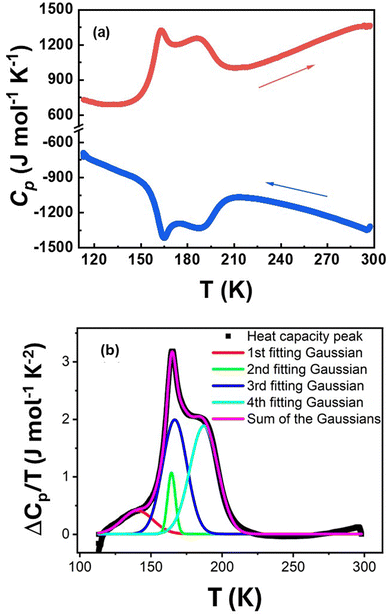
Differential scanning calorimetry (DSC) measurements were performed for 1 (Fig. 7) over the temperature range of 115–300 K in both cooling and warming modes, under a N2(g) atmosphere, at a scan rate of 2 K min−1. During the heating process, an endothermic peak was first observed at an onset temperature of T↑0 = 153 K, followed by a broad endothermic anomaly centered at 187 K. On cooling back from room temperature, a broad exothermic peak was observed too at 187 K along with a symmetric exothermic peak at T↓0 = 153 K, showing no hysteresis effect. The first peak is consistent with the magnetic data of 1 which revealed a spin state switching of FeII ions at a T1/2 of ∼ 155 K, without any hysteresis effect (Fig. 5). The determination of the thermodynamic parameters associated with these thermal anomalies is not trivial given the entanglement between the peaks and the unusual width of the second contribution, which may call for different origins. Therefore, a data deconvolution approach, as described below, was employed.The enthalpy change (ΔH = ∫ΔCpdT) and the entropy change ( ) of the total process were evaluated after subtracting the baseline of the raw heat capacity curve of Fig. 7a, whose contribution is attributed to lattice phonons and other degrees of freedom, which do not play a crucial role in the SCO phenomenon.29 The heat capacity excess, ΔCp, was deduced and the thermal evolution of the ratio
  , whose surface corresponds to the entropy variation, is displayed in Fig. 7b. These data were first fitted best with four contributions located at maximum values of T1 = 140 K, T2 = 164 K, T3 = 166 K and T4 = 187 K. The associated entropy variations are given by ΔS1 = 11 J mol−1 K−1, ΔS2 = 7.3 J mol−1 K−1, ΔS3 = 42.7 J mol−1 K−1 and ΔS4 = 46.5 J mol−1 K−1, whereas the respective enthalpy variations are ΔH1 = 1.5 kJ mol−1, ΔH2 = 1.2 kJ mol−1, ΔH3 = 7.1 kJ mol−1 and ΔH4 = 8.7 kJ mol−1. The total entropy change is estimated as ΔStot = 107.5 J mol−1 K−1. Given the proximity in temperature between T2 and T3, it is reasonable to restrict ourselves to three contributions (Fig. 7b): (i) a precursor effect to SCO located at T1 = 140 K. (ii) Two peaks located at T2–3 ∼ 165 K with ΔS2 + ΔS3 = 50 J mol−1 K−1. (iii) A third contribution found at T4 = 187 K. A fit considering directly three contributions located at T1 = 153 K, T2 = 164 K and T3 = 183 K provided the same total entropy with ΔStot = 107.7 J mol−1 K−1 (Fig. S3, ESI†), but the quality refinement was lower (Fig. S3, ESI†).
In order to correct the thermodynamic parameters associated with the SCO behaviour, it is necessary to consider the completeness of the transition given that it refers to the number of SCO sites that actively contribute to the total entropy. A careful look on magnetic measurements (Fig. 5) shows that only ∼50% of 1 switches between HS and LS. Considering the second contribution, a total entropy of 50 J mol−1 K−1 actually refers to half of the molecular mass. Therefore, the entropy associated with SCO is ΔSSCO = 100 J mol−1 K−1. Such entropy is larger than the characteristic value for the electronic contribution to the entropy, R·ln(5) = 13.33 J mol−1 K−1, typical for FeII SCO compounds.30 This is actually not surprising to obtain a total entropy that exceeds classic entropy values of SCO compounds (ΔSSCO = 50–80 J mol−1 K−1)31 given that the observed thermal anomaly reflects more than a simple SCO process and may imply lattice effects that are not seen in the SQUID measurement.
The first peak was attributed to a precursor effect to SCO, which was not seen in the Cpvs. T profile (Fig. 7a). As the second peak is concerned, it is no realistic to consider a solvent mixture, given the homogeneity of the composition of the sample. This would also result in a double step transition in the magnetic profile, which is not observed (Fig. 5). The third peak observed at 187 K, rather broad with an entropy value ΔS4 = 46.5 J mol−1 K−1, is more intriguing. It presumably corresponds to an order–disorder transition of chloroform and methanol molecules present in the cavities of compound 1.
2.6 Optical microscopy
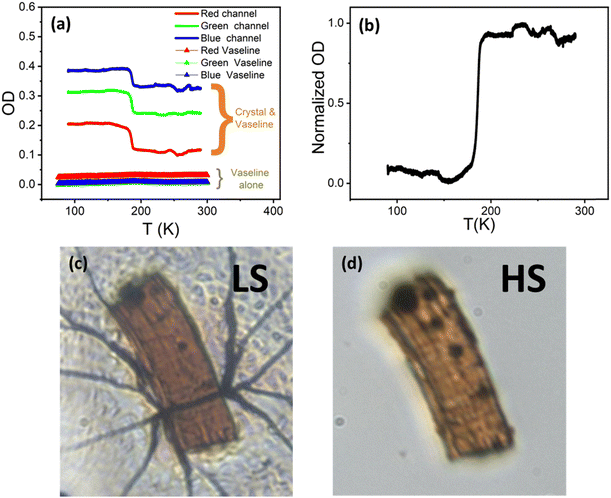
Cryogenic optical microscopy (OM) studies32–36 of selected single crystals of 1 and 2 were performed over the temperature range of 90–290 K, so as to monitor the colorimetric changes subsequent to the spin transition as well as the associated spatiotemporal properties accompanying the spin state changes. To perform this, and considering that the studies of such solvated compounds are performed in a vacuum, a Vaseline droplet was used to protect single crystals from desolvation.34Quantitative analysis of OM data was achieved by tracking the evolution of the transmitted light intensities in the three (RGB) channels, representing the respective three colours (red, green and blue) for each pixel, from which the averaged optical densities (OD) are derived (Fig. 8). Only the heating section given shows that data on cooling are not fully exploitable, due to defocusing caused by thermal contraction.
An abrupt transition was observed around 185 K, where the OD drops in the three channels simultaneously (Fig. 8a). This corresponds to the increase of the transmittance of the crystal increases during the LS to HS transition, which is seen from the crystal images in the LS (Fig. 8c) and HS phases (Fig. 8d). Surprisingly, large dark lines are observed in Fig. 8c, which are not seen in Fig. 8d. This corresponds to cracks in the Vaseline oil that are detected at 100 K on cooling (see Movie S1 in the ESI†) given that the Vaseline oil undergoes a glass transition around 220 K (in a vacuum at a pressure of 10−6 mbar).34 The cracks in the solid Vaseline observed at 100 K are most likely due to a misfit in the coefficients of thermal expansion of the Vaseline and the crystal, causing frustration in the solid oil and an accumulation of mechanical stress given the inability to contract, ultimately causing cracks.
To definitely exclude the possible hypothesis that the spin transition observed in the crystal is mainly due to Vaseline transformation, we also studied the thermal-dependence of a droplet of Vaseline by OM. Selected snapshots summarized in Fig. S5 (ESI†) clearly show that the glass transition of the isolated Vaseline is around 213 K, in fair agreement with the 220 K transition, obtained in Movie S1 (ESI†). The corresponding OD of the Vaseline alone is shown in Fig. 8a derived from the three-colour channels (RGB) as a function of temperature in cooling, showing a negligible contribution, compared to that of the SCO single crystal along the three channels. These results clearly indicate that the Vaseline's glass transition does not interfere with the SCO transition of the single crystal.
The OD was normalized in order to have values proportional to the HS fraction of the sample undergoing the spin transition,  through the following linear relationship:37
 | (1) |
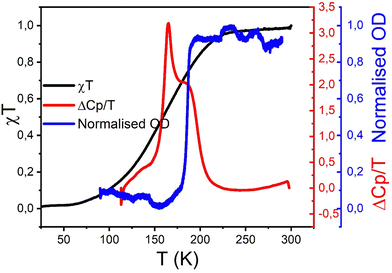
A rather abrupt thermally induced spin transition with an associated transition temperature T1/2 = 185 K was observed (Fig. 8b). The transition temperature apparently differs from that of the magnetic measurement T1/2 ∼ 155 K (Fig. 5), which is more gradual. The transition spreads over a wide temperature interval, between 118 and 204 K, whose average value is ∼161 K. It is however important to keep in mind that the OM measurement is performed on a unique single crystal whereas the results of the magnetic measurements correspond to a statistical average response obtained from a large number of microcrystals. Knowing that the SCO phenomenon is very sensitive to the shape, the size and the microstructure of the crystals,38 it is then not surprising to obtain different transition temperatures between the two set of experiments.
In addition, and more importantly, the influence of the solid Vaseline on the SCO behaviour should not be neglected. Indeed, during the glass transition of the Vaseline, the latter exerts a pressure on the SCO single crystal which results in an increase of its transition temperature from an ‘expected’ value of T1/2 ∼ 155 K, (resp. 165 K) according to magnetic (resp. calorimetric) measurements to T1/2 = 185 K observed in OM experiments. According to the Clapeyron law, the transition temperature under pressure is expressed as,  , and would shift by the following quantity ΔT = Teq(P) − Teq(0) with,
 | (2) |
 , were estimated to be ∼ 36.6 K kbar−1 for Z = 2 (and ∼9 K kbar−1 for Z = 8). Meanwhile, the former value is quite close to the usual 20–30 K kbar−1 values found for other SCO systems,39–43 and the latter is quite far. Interestingly, the obtained average value of
  forms these two results led to
  , which is in excellent agreement with the data of the literature. Nevertheless, the ∼36.6 K kbar−1 slope may not be totally discarded first because the Z value is not expected to vary during the spin transition, and secondly because it may express the important sensitivity to pressure of the present PCP system, due to its porous and compressible character. It would lead to an order of magnitude for the pressure due to Vaseline of
  , at around ∼30 MPa (resp. 83 MPa), when considering the shift of ΔT ∼ 11 K (resp. 30 K) between OM and calorimetry (resp. magnetism). Therefore, whatever the considered Z value, a weaker pressure is expected from the solid Vaseline, if one considers lower values of ΔT. Unfortunately, the loss of guest molecules from the structure of 1 for the experiments performed in a vacuum did not allow to determine the right value of ΔT for the single crystal, between its transitions in a vacuum and in the Vaseline oil. Therefore, such results should be considered as only an estimate of the order of magnitude of the pressure exerted by the glass transition of the Vaseline on the studied SCO single crystal. Interestingly, a transition temperature of 185 K exactly matches the one of the second peak derived from heat capacity measurements (Fig. 7b). However, the very gradual character of this second-order transition, with low values of the associated enthalpy and entropy changes, excludes the occurrence of a significant volume change as in most spin transitions. In addition, the cracks in the solid Vaseline that appeared at 100 K on cooling are affected by the spin transition at T1/2 = 185 K on heating (see Movie S2 in the ESI†), as a result of the mechanical stresses accompanying the volume expansion of the crystal, which is a strong signature of a spin transition. In contrast, no effect on the Vaseline nor on the crystal was detected around 150 K. Overall, these points, together with the color change of the crystal at 185 K observed in OM, support the conclusion that the observed change corresponds to the spin transition of the crystal.
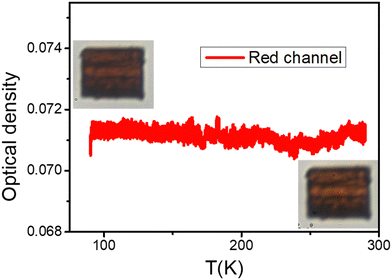
A second experiment was carried out in a vacuum on a different crystal of the same compound 1 of size 48 × 16 μm2. However, this time the sample was not protected with Vaseline oil. No colour change or phase transition was observed, neither on the OD nor on the crystals at both low and high temperatures (Fig. 9). Given that experiments were carried in a vacuum, it most likely caused the guest molecules to escape from the cavities of the sample. Consequently, the studied sample has similar characteristics to the converted sample 2, due to this loss, thus explaining the lack of transition and colour change along thermal cycling, an observation which also fits with magnetic measurements (Fig. 5).
2.7 Quantitative comparison between magnetism, DSC and OM
Although the previous presented data on the active SCO system 1 may appear as different at first glance, their quantitative comparison shows that they are in fact quite close. To perform such comparison, one has first to derive, from the magnetic data, the thermal-dependence of the HS fraction undergoing the spin transition, and then to subtract the ZFS contribution (see Fig. S4, ESI†). The latter is done by calculating this ZFS contribution based on the signal of compound 2 (the red curve in Fig. 5), which remains in HS at all temperatures. From this new magnetic response, the thermal-dependence of the associated HS fraction could be derived, which is compared in Fig. 10 to the HS fraction derived from OM on one single crystal as well as to the DSC measurement. Thus, we checked that the maximum value of the derivative peaks is ∼158 K, which is lower than that of OM for the reasons already explained above. Overall, to show the consistency of the data between the different techniques, we represent in Fig. 10 the graphs of ΔCp/T, χT and the normalized OD, whose comparison demonstrates that OM data fall very close with the second peak of ΔCp/T while the magnetic response leads to a large envelop which includes the calorimetric and OM responses. Thus, although sample 1 undergoes a complex behavior when it is not protected due to solvent loss, these behaviors clearly prove that this system exhibits a regular SCO transition, which can be characterized by different techniques.
3. Conclusions
In summary, we have reported a novel 3D FeII porous coordination polymer, [Fe(tpe)2dca]ClO4·5CHCl3·3CH3OH (tpe = trans-1,2-bis(4-pyridyl)ethene), 1, whose SCO behaviour is tuneable in the solid state by varying the composition of guest molecules due to host–guest and guest–guest interactions in the cavities of the crystals. Compound 1 features a gradual and incomplete spin transition behavior that extends over 170 K, whereas [Fe(tpe)2dca]ClO4·CHCl3·2H2O (2) remains in the high-spin state. Magnetic studies combined with single-crystal X-ray diffraction reveal the reason for the SCO-active/inactive of 1 and 2, which contributes to existing intermolecular interactions in the channel of compound 1. Optical microscopy investigations on a single crystal of 1 protected with Vaseline oil showed an abrupt spin transition around 185 K accompanied with a color change. Similar experiments conducted on a crystal of compound 1 under vacuum, causing the loss of the guest molecules, did not reveal neither color nor volume changes. This behaviour clearly corroborates the important role of the guest molecules in the occurrence of the spin transition through host–guest interactions in the cavities. Our in-depth analysis thus provides fundamental design principles for the development of 3D porous SCO porous coordination polymer materials that can effectively exploit the optical and magnetic property differences between the low-spin and high-spin states for the development of gas detection and molecular sensing and data storage equipment.4. Experimental section
Fe(ClO4)2·6H2O, NH4SCN, sodium dicyanamide, 9,10-bis(4-pyridyl)anthracene (bpa) and trans-1,2-bis(4-pyridyl)ethene (tpe) were purchased and used as received without further purification. Characterization details are shown in the ESI.†4.1 Syntheses
![[thin space (1/6-em)]](https://www.rsc.org/images/entities/char_2009.gif) :
:![[thin space (1/6-em)]](https://www.rsc.org/images/entities/char_2009.gif) VMeOH = 5
VMeOH = 5![[thin space (1/6-em)]](https://www.rsc.org/images/entities/char_2009.gif) :
:![[thin space (1/6-em)]](https://www.rsc.org/images/entities/char_2009.gif) 1, 1 mL) was placed between both layers to prevent instant precipitation of a powder. After one day, red crystals were formed at the layers interface. Yield ∼38% (4.6 mg). Elemental analysis (%) for FeC34H37N7Cl16O7 calcd: C 31.94, H 2.92, N 7.67; found: C 32.09, H 2.76, N 7.73. IR (cm−1): 2308, 2162, 1687, 1600, 1502, 1415, 1248, 1211, 1085, 1008, 969, 823, 746, 620, 543.
1, 1 mL) was placed between both layers to prevent instant precipitation of a powder. After one day, red crystals were formed at the layers interface. Yield ∼38% (4.6 mg). Elemental analysis (%) for FeC34H37N7Cl16O7 calcd: C 31.94, H 2.92, N 7.67; found: C 32.09, H 2.76, N 7.73. IR (cm−1): 2308, 2162, 1687, 1600, 1502, 1415, 1248, 1211, 1085, 1008, 969, 823, 746, 620, 543.
![[thin space (1/6-em)]](https://www.rsc.org/images/entities/char_2009.gif) :
:![[thin space (1/6-em)]](https://www.rsc.org/images/entities/char_2009.gif) VMeOH = 1
VMeOH = 1![[thin space (1/6-em)]](https://www.rsc.org/images/entities/char_2009.gif) :
:![[thin space (1/6-em)]](https://www.rsc.org/images/entities/char_2009.gif) 1, 0.6 mL) was placed between both layers to prevent the instant precipitation of a powder. After three days, yellow–orange crystals were formed at the layer interface. Yield ∼58% (2.43 mg). Elemental analysis (%) for C50.5H34ClFeN6O0.5S2. Calcd: C 68.28, H 3.86, N 9.46, S 7.22; found: C 68.39, H 3.59, N 9.50, S 7.46. IR (cm−1): 2364, 2057, 1599, 1540, 1442, 1400, 1254, 1211, 1146, 1065, 1006, 952, 898, 855, 812, 769, 742, 682, 640, 607, 538.
1, 0.6 mL) was placed between both layers to prevent the instant precipitation of a powder. After three days, yellow–orange crystals were formed at the layer interface. Yield ∼58% (2.43 mg). Elemental analysis (%) for C50.5H34ClFeN6O0.5S2. Calcd: C 68.28, H 3.86, N 9.46, S 7.22; found: C 68.39, H 3.59, N 9.50, S 7.46. IR (cm−1): 2364, 2057, 1599, 1540, 1442, 1400, 1254, 1211, 1146, 1065, 1006, 952, 898, 855, 812, 769, 742, 682, 640, 607, 538.
Data availability
CCDC 2299643–2299645† contain the supplementary crystallographic data for this paper. These data can be obtained free of charge from The Cambridge Crystallographic Data Centre viahttps://www.ccdc.cam.ac.uk/structures.Conflicts of interest
The authors declare no competing financial interest.Acknowledgements
This work was supported by the Fonds De La Recherche Scientifique—FNRS (PDR T.0095.21, CDR J.0064.23, CDR J.0168.22, and EQP U.N027.24), the Université de Versailles-Paris Saclay, the CNRS through the MITI interdisciplinary programs through its exploratory research program, Mol-CoSM ANR Project No. ANR-20-CE07-0028-01 and the UEFISCDI (HighSensSpin, TE 77/2022) (PN-III-P1-1.1-TE-2021-1654). L. S. and X. L. were supported by fellowship from the China Scholarship Council (201804910584 and 202108310050).References
- B. Li, R.-J. Wei, J. Tao, R.-B. Huang and L.-S. Zheng, J. Am. Chem. Soc., 2010, 132, 1558–1566 CrossRef PubMed.
- M. Steinert, B. Schneider, S. Dechert, S. Demeshko and F. Meyer, Angew. Chem., Int. Ed., 2014, 53, 6135–6139 CrossRef PubMed.
- L. Pineiro-Lopez, F. J. Valverde-Munoz, E. Trzop, M. C. Muñoz, M. Seredyuk, J. Castells-Gil, I. da Silva, C. Marti-Gastaldo, E. Collet and J. A. Real, Chem. Sci., 2020, 12, 1317–1326 RSC.
- M. M. Dîrtu, A. D. Naik, A. Rotaru, L. Spinu, D. Poelman and Y. Garcia, Inorg. Chem., 2016, 55, 4278–4295 CrossRef PubMed.
- Y. Garcia, V. Niel, M. C. Muñoz and J. A. Real, Top. Curr. Chem., 2004, 233, 229–257 CrossRef.
- Y. Garcia, J. Moscovici, A. Michalowicz, V. Ksenofontov, G. Levchenko, G. Bravic, D. Chasseau and P. Gütlich, Chem. – Eur. J., 2002, 8, 4992–5000 CrossRef PubMed.
- Y. Garcia, O. Kahn, L. Rabardel, B. Chansou, L. Salmon and J. P. Tuchagues, Inorg. Chem., 1999, 38, 4663–4670 CrossRef CAS PubMed.
- Y. Garcia, P. J. van Koningsbruggen, R. Lapouyade, L. Fournès, L. Rabardel, O. Kahn, V. Ksenofontov, G. Levchenko and P. Gütlich, Chem. Mater., 1998, 10, 2426–2433 CrossRef CAS.
- Y. Garcia, V. Ksenofontov, G. Levchenko and P. Gütlich, J. Mater. Chem., 2000, 10, 2274–2276 RSC.
- D. Unruh, P. Homenya, M. Kumar, R. Sindelar, Y. Garcia and F. Renz, Dalton Trans., 2016, 45, 14008–14018 RSC.
- T. Zhao, L. Cuignet, M. M. Dîrtu, M. Wolff, V. Spasojevic, I. Boldog, A. Rotaru, Y. Garcia and C. Janiak, J. Mater. Chem. C, 2015, 3, 7802–7812 RSC.
- F. J. Valverde-Munoz, C. Bartual-Murgui, L. Pineiro-Lopez, M. C. Muñoz and J. A. Real, Inorg. Chem., 2019, 58, 10038–10046 CrossRef CAS.
- J. H. Yang, Y. X. Zhao, J. P. Xue, Z. S. Yao and J. Tao, Inorg. Chem., 2021, 60, 7337–7344 CrossRef CAS.
- J. E. Clements, P. R. Airey, F. Ragon, V. Shang, C. J. Kepert and S. M. Neville, Inorg. Chem., 2018, 57, 14930–14938 CrossRef CAS.
- C. H. Pham and F. Paesani, Inorg. Chem., 2018, 57, 9839–9843 CrossRef CAS.
- R. Turo-Cortes, C. Bartual-Murgui, J. Castells-Gil, M. C. Muñoz, C. Marti-Gastaldo and J. A. Real, Chem. Sci., 2020, 11, 11224–11234 RSC.
- C. J. Kepert, H. Windsor, W. Lewis, S. M. Neville, S. Duyker and D. M. D’Alessandro, Chem. Commun., 2022, 58, 13127 RSC.
- A. Orellana-Silla, F. J. Valverde-Munoz, M. C. Muñoz, C. Bartual-Murgui, S. Ferrer and J. A. Real, Inorg. Chem., 2022, 61, 4484–4493 CrossRef CAS.
- M. Ohba, K. Yoneda, G. Agusti, M. C. Muñoz, A. B. Gaspar, J. A. Real, M. Yamasaki, H. Ando, Y. Nakao, S. Sakaki and S. Kitagawa, Angew. Chem., Int. Ed., 2009, 48, 4767–4771 CrossRef CAS PubMed.
- C. Bartual-Murgui, L. Salmon, A. Akou, N. A. Ortega-Villar, H. J. Shepherd, M. C. Muñoz, G. Molnar, J. A. Real and A. Bousseksou, Chem. – Eur. J., 2012, 18, 507–516 CrossRef CAS.
- Z.-P. Ni, J.-L. Liu, M. N. Hoque, W. Liu, J.-Y. Li, Y.-C. Chen and M.-L. Tong, Coord. Chem. Rev., 2017, 335, 28–43 CrossRef CAS.
- J.-Y. Li, C.-T. He, Y.-C. Chen, Z.-M. Zhang, W. Liu, Z.-P. Ni and M.-L. Tong, J. Mater. Chem. C, 2015, 3, 7830–7835 RSC.
- L. Sun, N. E. I. Belmouri, M. Ndiaye, K. Robeyns, A. Rotaru, K. Boukheddaden and Y. Garcia, Cryst. Growth Des., 2023, 23, 3402–3411 CrossRef.
- L. Sun, N. E. I. Belmouri, M. Ndiaye, K. Robeyns, A. Rotaru, K. Boukheddaden and Y. Garcia, Cryst. Growth Des., 2022, 22, 7555–7563 CrossRef.
- L. A. Pineiro-Lopez, F. J. Valverde-Munoz, M. Seredyuk, M. C. Muñoz, M. Haukka and J. A. Real, Inorg. Chem., 2017, 56, 7038–7047 CrossRef PubMed.
- L. Piñeiro-López, M. Seredyuk, M. C. Muñoz and J. A. Real, Eur. J. Inorg. Chem., 2020, 764–769 CrossRef.
- F. Liu and J. Tao, Chem. – Eur. J., 2017, 23, 18252–18257 CrossRef.
- A. L. Spek, Acta Crystallogr., Sect. C: Struct. Chem., 2015, 71, 9–18 CrossRef CAS PubMed.
- M. Sorai, M. Nakano and Y. Miyazaki, Chem. Rev., 2006, 106, 976–1031 CrossRef CAS.
- P. Gütlich and Y. Garcia, Chem. Soc. Rev., 2000, 29, 419–427 RSC.
- E. König, Struct. Bonding, 1991, 76, 51 CrossRef.
- K. Boukheddaden and M. Sy, Curr. Inorg. Chem., 2016, 6, 40–48 CrossRef CAS.
- C. Chong, A. Slimani, F. Varret, K. Boukheddaden, E. Collet, J.-C. Ameline, R. Bronisz and A. Hauser, Chem. Phys. Lett., 2011, 504, 29–33 CrossRef CAS.
- A. Slimani, F. Varret, K. Boukheddaden, C. Chong, H. Mishra, J. G. Haasnoot and S. Pillet, Phys. Rev. B.: Condens. Matter Mater. Phys., 2011, 84, 094442 CrossRef.
- K. Boukheddaden, C. Chong, H. Mishra, E. Collet, J. G. Haasnoot and S. Pillet, New J. Chem., 2011, 35, 2333–2340 RSC.
- C. Chong, H. Mishra, K. Boukheddaden, S. Denise, G. Bouchez, E. Collet, J. C. Ameline, A. D. Naik, Y. Garcia and F. Varret, J. Phys. Chem. B, 2010, 114, 1975–1984 CrossRef CAS.
- M. Sy, R. Traiche, H. Fourati, Y. Singh, F. Varret and K. Boukheddaden, J. Phys. Chem. C, 2018, 122, 20952–20962 CrossRef CAS.
- K. Boukheddaden, M. H. Ritti, G. Bouchez, M. Sy, M. M. Dîrtu, M. Parlier, J. Linares and Yann Garcia, J. Phys. Chem. C, 2018, 122, 7597–7604 CrossRef CAS.
- Y. Li, A. Benchohra, B. Xu, B. Baptiste, K. Béneut, P. Parisiades, L. Delbes, A. Soyer, K. Boukheddaden and R. Lescouëzec, Angew. Chem., Int. Ed., 2020, 59, 17272–17276 CrossRef CAS.
- A. Rotaru, F. Varret, E. Codjovi, K. Boukheddaden and J. Linares, J. Appl. Phys., 2009, 106, 053515 CrossRef.
- F. Varret, A. Bleuzen, K. Boukheddaden, A. Bousseksou, E. Codjovi, C. Enachescu, A. Goujon, J. Linares, N. Menendez and M. Verdaguer, Pure Appl. Chem., 2002, 74, 2093–2102 CrossRef.
- A. Sava, C. Enachescu, A. Stancu, K. Boukheddaden, E. Codjovi, I. Maurin and F. Varret, J. Optoelectron. Adv. Mater., 2003, 5, 977 Search PubMed.
- H. Fourati, E. Milin, A. Slimani, G. Chastanet, Y. Abid, S. Triki and K. Boukheddaden, Phys. Chem. Chem. Phys., 2018, 20, 10142–10154 RSC.
Footnote |
| † Electronic supplementary information (ESI) available: Characterization, modelling methods, FT-IR, crystallographic information, crystal structures of 1, magnetic behaviours of 1 (from 4 K to 400 K) and movies. CCDC 2299643–2299645. For ESI and crystallographic data in CIF or other electronic format see DOI: https://doi.org/10.1039/d4ma00527a |
| This journal is © The Royal Society of Chemistry 2024 |

