 Open Access Article
Development and characterisation of starch/alginate active films incorporated with lemongrass essential oil (Cymbopogon citratus)†
Olga Lucía Torres
Vargas
 *,
Yessica Viviana Galeano
Loaiza
 and
Iván Andrés Rodríguez
Agredo

Group of Research on Agro-industrial Sciences, Interdisciplinary Science Institute, Food Engineering Laboratory, Universidad del Quindío. Cra. 15# 12 N, Armenia, Quindío 630004, Colombia. E-mail: oltorres@uniquindio.edu.co
First published on 8th November 2024
Abstract
The development of active films based on biopolymers containing antimicrobial and antioxidant compounds has contributed to the improvement of food safety. In the present study, the composition of lemongrass (Cymbopogon citratus) essential oil (LEO) was evaluted by gas chromatography-mass spectrometry (GC-MS) analysis and the minimum inhibitory concentration (MIC) against S. aureus and E. coli bacteria was determined. Films based on cassava starch and sodium alginate were prepared incorporating different concentrations (0.0, 0.5, 1.0, and 1.5%) of lemongrass essential oil (FLEO). Their physicochemical, mechanical, optical, retention and release properties, as well as their antibacterial and antioxidant activities were evaluated. GC/MS analysis of lemongrass essential oil (LEO) revealed the presence of citral (39.12%) and citronellol (34.47%) as major components. A minimum inhibitory concentration (MIC) of 25 μg mL−1 was observed for LEO against S. aureus and E. coli bacteria. A significant decrease (12.42%) in water vapour permeability (WVP), moisture content (12.68%) and solubility (18.47%) was found as the LEO concentration in the films increased. Scanning electron microscopy (SEM) analyses showed a uniform distribution of LEO in the films, while FTIR spectra revealed interactions between the components. X-ray diffraction (XRD) patterns indicated that the incorporation of LEO did not affect the structural stability of the films, showing a decrease in crystallinity of 8.4%. Furthermore, The results showed an antioxidant activity of 32.4%, bacteriostatic activity against S. aureus and E. coli and a more stable release and retention of essential oil (EO) in films containing 1.5% LEO. These results suggest that the developed films have potential for application in active packaging.
1. Introduction
The growing need for food packaging systems that can retard or inhibit microbial growth, extend food shelf life and align with sustainable development goal 12 (ONU),1 manifests itself in the search for solutions that reduce the ecological footprint. This approach involves the transition from conventional plastic production methods to the efficient use of biopolymers in the production of active and biodegradable films, thus contributing to more sustainable and environmentally friendly practices.2In this context, the development of biodegradable active films is of increasing interest due to their composition based on natural biopolymers such as polysaccharides, including starch, alginate, pectin and gums, the combination of which often gives the films flexibility.3 In addition, these active films have shown good barrier properties, biocompatibility, renewability and biodegradability.4 In turn, these films can incorporate biologically active compounds, such as essential oils, which can inhibit microbial growth and reduce oxygen penetration, with the underlying purpose of prolonging shelf life and improving food quality.5
Essential oils are secondary metabolites found in the leaves, bark, stems, roots, flowers, or fruits of plants.6 A variety of essential oils are currently of great interest in the food industry due to their antioxidant and antimicrobial properties.7 Among them, lemongrass essential oil (LEO) has been highlighted for its functional properties.8 Among them, lemongrass essential oil (LEO) has been highlighted for its functional properties.8 This oil is a type of essential oil with a strong lemon flavour extracted from the plant Cymbopogon citratus, commonly known as lemongrass, which is widely distributed in the tropics and subtropics.9 The main compound in LEO is citral, which has antimicrobial, antifungal and antioxidant properties.10
On the other hand, cassava starch is one of the most abundant and biodegradable polysaccharides and is widely used in film development. Its combination with other biopolymers has been shown to improve physical, mechanical and barrier properties. Among these biopolymers is sodium alginate, a naturally occurring anionic polysaccharide found in the intercellular matrix of brown algae that is generally recognised as safe (GRAS). This biopolymer has properties that include the ability to form uniform gels and/or thicken the solution and provide barrier properties.3
Therefore, the objective of this study was to evaluate the effect caused by the inclusion of lemongrass essential oil in a film made from cassava starch and sodium alginate on its physicochemical, mechanical, optical, retention and release properties, as well as its antibacterial and antioxidant activity.
2. Materials and methods
2.1 Raw material
Lemongrass (Cymbopogon citratus) essential oil (LEO) was purchased from Tecnas S.A., Colombia. The cassava starch was obtained using the methodology described by J. Aristizábal et al.11 Sodium alginate (PanReac AppliChem, Darmstadt, Germany). Calcium chloride (CaCl2), glycerol, tween 80 and the different reagents necessary for the physical and microbiological characterization of the formulated films were acquired from Merck in Colombia.2.2 Gas chromatography-mass spectrometry (GC-MS) analysis
The chemical composition of lemongrass essential oil (LEO) was determined by gas chromatography-mass spectrometry (GC-MS). An Agilent HP-6890N gas chromatograph coupled to an Agilent 5973N mass selective detector (Agilent Technologies, HP USA), equipped with a DB-1 M capillary column (30 m long × 0.25 mm internal diameter and × 0.25 μm film thickness) was used. Helium (99.999%) was used as the carrier gas at a flow rate of 1.0 mL min−1 and an injector temperature of 250 °C. 0.2 μL of the lemongrass oil was injected in split mode. The oven temperature programme was at 70 °C for 10 min, increased to 100 °C at 5 °C min−1, followed by an increase to 150 °C at 5 °C min−1, then to 200 °C at 5 °C min−1 and finally to 250 °C at 5 °C min−1 for 15 min.Mass spectra were recorded in electron impact ionisation mode at 70 eV. The temperatures of the quadrupole mass detector, ion source and transfer line were set at 150, 230 and 280 °C respectively. Compound identification was based on the mass spectra (MS) obtained with those from the NIST02.L, NIST5a.L and NIST98.L libraries and the selected ion monitoring mode was used to determine the concentrations of the compounds.
2.3 Bacterial strains and growth conditions
The bacterial strains Staphylococcus aureus (ATCC 25923) and Escherichia coli (ATCC 25922) were obtained from the culture collection of the Molecular Immunology Research Group (GYMOL) of the Universidad del Quindío. S. aureus and E. coli cultures were preserved in 18% glycerol and kept at −80 °C until use. The inocula were separately grown in 10 mL of nutrient broth for 18 hours at 35 °C under aerobic conditions. Subsequently, the cultures were adjusted to a density of 0.5 on the McFarland scale (≅1 × 10⁸ CFU mL−1) before being used on in vitro antibacterial tests.2.4 Minimum inhibitory concentrations (MIC)
Minimum inhibitory concentration (MIC) assays were performed using the broth microdilution method in Mueller-Hilton (MH) medium, according to M. Fadli et al.12 Lemongrass essential oil (LEO) was analysed using a series of double dilutions prepared in 1% dimethyl sulfoxide (DMSO) at concentrations ranging from 3.125 to 100 μg mL−1. From the initial densities, an adjustment was made to obtain an approximate final inoculum size of 5 × 10⁵ CFU mL−1, for the bacteria by adding to each well a volume of 0.1 mL. On the other hand, the microtiter plates were sealed with a sterile adhesive film to avoid any loss of essential oil due to its inherent volatility.The microtiter plates were incubated under optimal conditions (37 °C for 24 h).13 After incubation, 30 μL of 0.02% resazurin was added to each well and further incubated for 24 h to observe the colour change. Viable microorganisms that interact with the indicator by changing from blue to pink denote bacterial growth. Therefore, the lowest dilution without a blue colour change is considered the MIC for LEO.14 All results were calculated as the means of experiments performed in triplicate.
2.5 Film formulation
The materials and the methodology that were used in this research to obtain the films were based on previous studies.15,16 Initially, 3.6 g of cassava starch were added to 72 g of distilled water at 70 °C with constant agitation at 600 rpm for 30 min. In parallel, 2.4 g of sodium alginate were dissolved in 72 g of distilled water at 60 °C for 30 min. Then a CaCl2 solution was added dropwise (0.01% CaCl2 was added for each gramme of sodium alginate). Both solutions were mixed with constant agitation for 15 min. Subsequently, the 15% glycerol solution (w/w, with respect to the weight of cassava starch) was brought to 35 ± 5 °C for 15 min.Tween 80 at 5% (w/w, based on LEO) was used as a surfactant and once the solution mixtures were obtained, LEO was added at concentrations of 0.5, 1.0, and 1.5% (w/w total solids). These concentrations were selected base on the minimum inhibitory concentration (MIC) determined in this study and those reported in the literature.17,18
The mixture was homogenised in Ultraturrax (IKA T25, Staufen, Germany) at 12![[thin space (1/6-em)]](https://www.rsc.org/images/entities/char_2009.gif) 000 rpm for 5 min at room temperature. It was then subjected to ultrasonic cleaner Branson-1510 (Danbury, CT, USA) for 30 min at 40 kHz frequency.
000 rpm for 5 min at room temperature. It was then subjected to ultrasonic cleaner Branson-1510 (Danbury, CT, USA) for 30 min at 40 kHz frequency.
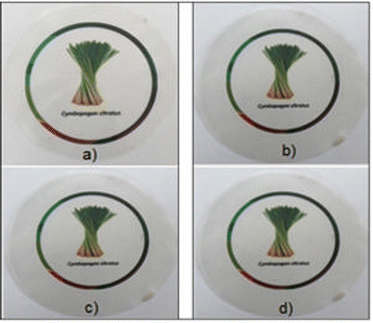
The obtained film-forming solution (SFP) was distributed on polystyrene Petri dishes (18 g) (64 cm2) and dried in a forced air convection oven (Binder, FD-115, Germany) at 45 ± 5 °C for 6 h. A control film (CF) was prepared following the same methodology, without adding LEO. All films (CF: Control Film, FLEO: Film with lemongrass essential oil) were stored in a desiccator at 23 ± 2 °C and 50 ± 2% relative humidity (RH) for subsequent analyses Fig. 1 shows the images of the films obtained.
2.6 Characterization of the films
The mechanical properties of the films were measured in a texturometer (TA, XT2, Textura Technologies Corpy col., Scarsdale, NY, USA). Tensile strength (TS) and elongation at break (EB, %) were determined until rupture of the FLEOs. The samples were die cut into 2 cm × 6 cm sheets and conditioned for 48 h at 25 ± 0.2 °C and 50 ± 1% relative humidity. During the analysis, they were subjected to tension with a 40 mm separation between the grips. Tensile strength and elongation were calculated according to ASTM D882-01 (ref. 19) of the American Society for Testing and Materials.
Moisture content was determined by the gravimetric method,21 conditioning for 48 h at 25 °C at 50% relative humidity. The samples were cut into 2 cm × 2 cm films and weighed. Initially, the weight of the films was taken (Wm) subsequently, they were placed in a drying oven (Binder, FD-115, Germany) at 105 °C for 24 h to constant weight (Wd). The moisture content was calculated using eqn (1).
 | (1) |
The solubility of FLEOs was determined by the percentage of the film dry matter that is soluble in water. The methodology reported by R. Akhter et al.22 was followed with some modifications. FLEOs were cut into 2 cm × 2 cm sheets. The samples were dried at 105 °C to a constant weight to obtain the initial dry mass (M1). The FLEOs were placed in 50 mL of distilled water, covered and stored at 25 °C for 24 h, then vacuum filtered and dried at 105 °C to a constant weight to obtain the final dry mass (M2). Solubility was calculated using eqn (2).
 | (2) |
The opacity of the films was determined by the ratio of films superimposed on a white (L*white) and black (L*black) plate, according to eqn (3).25
 | (3) |
2.7 Retention and release study
 | (4) |
2.8 Antioxidant activity
Several techniques have been employed to evaluate the antioxidant capacity of functional foods, such as herbal extracts and natural or synthetic compounds. These techniques include the diphenylpicrylhydrazyl (DPPH) free radical assay, the ferric reducing activity power (FRAP) assay, and the 2,2′-azinobis-(3-ethylbenzothiazoline-6-sulfonic acid) (ABTS) assay. Among these, the DPPH antioxidant assay is widely used due to the high stability, experimental feasibility, and low cost of the DPPH radical.27,28The antioxidant activity of the obtained films was evaluated by 2,2-diphenyl-1-picryl-hydrazyl (DPPH) free radical scavenging assay according to the methodology of M. Moradi et al.29 with some modifications.
First, 25 mg of film was immersed in 3 mL of deionised water. The resulting mixture was stirred at room temperature for 15 h, followed by centrifugation at 4185 × g for 15 min. The resulting film extracts (2.8 mL) were mixed with 0.1 mL of 1 M methanol solution of DPPH, and left in the dark at 25 °C for 30 min. The absorbance of the mixture was measured in a spectrophotometer at 515 nm; the absorbance of the solution without film (blank) was also measured. The percentage inhibition or reduction of the DPPH radical from the radical scavenging activity of DPPH was calculated using eqn (5).
 | (5) |
2.9 Antibacterial activity
The antimicrobial activity of the films obtained was determined using the agar disc diffusion method described by S. K. Bajpai et al.30 with some modifications. The growth conditions of the bacterial strains were performed according to numeral 2.3.Discs of 5 mm diameter of the films (previously sterilised on each side for 5 min with UV-C light: 254 nm) were placed on Mueller-Hinton solid agar previously spread on the surface with 100 μL of 108 CFU mL−1 of the suspensions with the bacterial cultures of S. aureus (ATCC 25923) and E. coli (ATCC 25922). The Petri dishes were incubated at 37 °C for 24 h. The diameter of the inhibition zones of the discs (mm) was measured using a digital calliper (Mitutoyo no. 192-30, Tokyo, Japan).
2.10 Statistical analysis
Statistical analysis of the data was performed by analysis of variance (ANOVA) using Statgraphics Centurion XVIII. One-way ANOVA and Tukey's multiple comparison tests were used to classify and assess statistical differences in ranges. In all cases, p < 0.05 was considered significant. All the experiments were performed in triplicate.3. Results and discussion
3.1 Gas chromatography-mass spectrometry (GC-MS) analysis
The chemical composition of LEO is shown in Table 1. A total of 41 compounds were identified in LEO by GC-MS analysis, representing 99.82% of the total volatile compounds. The most abundant compound was citral (39.12%), followed by citronellol (34.47%), citronellal (4.74%), caryphyllene (2.83%) and limonene (2.79%).| Compound | Retention time (min) | Relative content (%) |
|---|---|---|
| 5-Hepten-2-one, 6-methyl- | 5.29 | 0.94 |
| α-Sabinene | 5.42 | 0.10 |
| β-Myrcene | 5.62 | 0.25 |
| 1S-α-Pinene | 6.10 | 0.22 |
| Limonene | 6.50 | 2.79 |
| (E)-β-Ocimene | 6.57 | 0.49 |
| (Z)-β-Ocimene | 6.81 | 0.26 |
| Phenol, m-tert-butyl- | 8.34 | 0.08 |
| Linalool | 8.06 | 0.67 |
| Cis-rose oxide | 8.34 | 0.09 |
| Cyclohexene, 3,3,5-trimethyl- | 8.99 | 0.13 |
| 1,4-Hexadiene, 3,3,5-trimethyl- | 9.29 | 0.38 |
| (R)-(+)-Citronellal | 9.68 | 4.74 |
| 3-Decyne | 9.98 | 1.40 |
| Imidazole, 5-[N(2)-(isopropylidene)carbhydrazyno]- | 10.33 | 0.06 |
| Cyclohexanone, 5-methyl-2-(1-methylethenyl)-, trans | 10.63 | 1.86 |
| 1,11-Dodecadiene | 10.91 | 0.02 |
| Decanal | 11.50 | 0.26 |
| (R)-(+)-β-Citronellol | 13.40 | 34.47 |
| Citral | 14.71 | 39.12 |
| cis-2,6-dimethyl-2,6-octadiene | 16.82 | 0.71 |
| Geranyl acetate | 17.71 | 2.30 |
| Trans-nerolidol | 18.03 | 0.08 |
| (−)-β-Elemene | 18.26 | 0.38 |
| Caryphyllene | 19.15 | 2.83 |
| 4,7,10-Cycloundecatriene, 1,1,4,8-tetramethyl-, cis, cics, cis- | 19.99 | 0.36 |
| Germacrene D | 20.76 | 0.44 |
| α-Muurolene | 21.33 | 0.14 |
| γ-Muurolene | 21.74 | 0.21 |
| δ-Cadinene | 22.06 | 0.70 |
| α-Elemol | 22.84 | 0.64 |
| 1-Hydroxy-1,7-dimethyl-4-isopropyl-2,7-cyclodecadiene | 23.95 | 0.71 |
| Caryophyllene oxide | 24.06 | 0.62 |
| 3-Octyne, 7-methyl- | 25.02 | 0.10 |
| γ-Eudesmol | 26.19 | 0.07 |
| τ-Muurolol | 26.61 | 0.43 |
| β-Eusdemol | 26.90 | 0.05 |
| α.-Cadinol | 27.16 | 0.55 |
| 7-Octen-1-ol, 2,6-dimethyl- | 34.04 | 0.07 |
| 1,5,9-Decatriene. 2,3,5,8-Tetramethyl- | 37.83 | 0.04 |
| Neoisolongifolene, 8-bromo- | 41.47 | 0.06 |
| Total | 99.82 |
These results differ from the main compounds reported by G. Antonioli et al.,31 which were geranial (41.8%), neral (25.6%) and β-myrcene (18.1%). Similarly, neral (34.48%), geranial (34.37%) and β-myrcene (12.84%) were reported as the major components of lemongrass oil.32 Another study reported citral (70.22%) and mycerene (13.64%) as the major constituents of LEO.33 Therefore, the variation in the components of oils obtained from plant matrices is due to various factors (differences in harvesting season, geography, plant populations, edaphic factors, and extraction methods).34
3.2 Minimum inhibitory concentration (MIC)
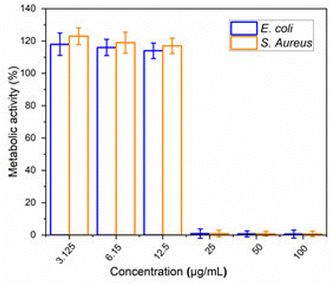
The MIC values obtained for LEO against S. aureus (Gram-positive) and E. coli (Gram-negative) bacteria are shown in Fig. 2. For both bacteria, LEO exhibited a MIC starting at 25 μg mL−1. Similarly, one study reported a MIC of 3125 μg mL−1 for both S. aureus and E. coli.35 In contrast, MIC values of 63 μg mL−1 were found for E. coli and 125 μg mL−1 for S. aureus.13 Another study has reported an MIC of 2200 μg mL−1 to inhibit the planktonic growth of E. coli.36 Viktorová et al.37 reported MIC values of 5190 μg mL−1 for the Gram-positive bacterium S. aureus, and 2125 μg mL−1 and 2338 μg mL−1 for the Gram-negative bacteria Pseudomonas aeruginosa and Salmonella enterica, respectively.The antibacterial activity of LEO is attributed to its ability to alter cell membrane integrity, inducing changes in membrane permeability and the release of cell contents, leading to cell death.38 Additionally, the antibacterial activity of LEO has been attributed to citral (a blend of neral and geranial) as the main antibacterial agent against Gram-positive and Gram-negative bacteria.37 However, other components of LEO may influence its biological properties by altering or modifying the effects of other compounds, potentially contributing to synergistic activity.39–41 Furthermore, although the antimicrobial efficacy of LEO is mainly determined by the concentration of bacteria and the oil content, other factors can also influence its effectiveness. These factors include the composition of the oil, the method of extraction, the stage of development of the plant and the environmental conditions.42
3.3 Characterization of the films
| Film | Thickness (mm) | TS (MPa) | EB (%) |
|---|---|---|---|
| a Data reported are mean values ± standard deviation. b Median on the same column with a different number of asterisks are significantly different (Tukey: p < 0.05). | |||
| CF | 0.107 ± 0.03* | 2.15 ± 0.57* | 14.08 ± 1.57* |
| FLEO 0.5% | 0.095 ± 0.01* | 1.49 ± 0.43** | 11.85 ± 1.18** |
| FLEO 1.0% | 0.090 ± 0.02* | 1.35 ± 0.09*** | 10.78 ± 1.26** |
| FLEO 1.5% | 0.107 ± 0.03* | 1.31 ± 0.60**** | 10.57 ± 1.05** |
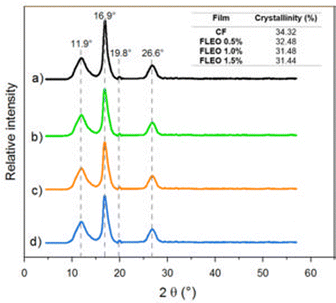
The addition of LEO to the films presented significant differences (p < 0.05) in mechanical properties compared to CF (Table 2). Tensile strength (TS) and elongation at break (EB) decreased with increasing LEO concentration. This effect can be attributed to the reduction in component interactions, leading to differences in the cross-linking of the polymer matrix.45 These results are consistent with the slight changes observed in XRD and SEM analyses.
A decrease in TS and EB has been reported in chitosan films with natural extracts.46 Similary, higher TS and EB were observed in the control film (cassava starch/chitosan) compared to films incorporated with LEO.14 F. Han Lyn and Z. A. Nur Hanani47 also found a decrease in TS with increasing LEO concentration in chitosan films. On the contrary, EB increased with increasing LEO concentration in the films.
| Film | WVP (×10−9 g s−1 m−1 Pa−1) | Moisture content (%) | Solubility (%) |
|---|---|---|---|
| a Data reported are mean values ± standard deviation. b Median on the same column with a different number of asterisks are significantly different (Tukey: p < 0.05). | |||
| CF | 7.81 ± 0.52* | 20.34 ± 0.50* | 85.05 ± 0.91* |
| FLEO 0.5% | 6.92 ± 0.38** | 18.41 ± 0.33** | 78.72 ± 0.78** |
| FLEO 1.0% | 6.87 ± 0.25** | 17.95 ± 0.40*** | 73.30 ± 1.32*** |
| FLEO 1.5% | 6.84 ± 0.30** | 17.76 ± 0.20*** | 69.34 ± 1.23**** |
Regarding the solubility of the films (Table 3), a decrease (p < 0.05) was evidenced with increasing LEO concentration. The highest solubility was found in CF (85.05 ± 0.91%) compared to FLEO-0.5% (78.72 ± 0.78%), FLEO-1.0% (73.30 ± 1.32%) and FLEO-1.5% (69.34 ± 1.23%). This is attributed to the fact that LEO reduces the amount of OH bonds, leading to the formation of hydrophobic regions in the polymer matrix, which results in lower solubility by hindering water penetration through the material.22 In addition, active films have been shown to have barrier properties against water vapour and oxygen.50
Similar results were obtained by F. Han Lyn and Z. A. Nur Hanani,47 who reported a decrease in WVP, moisture content and solubility with increasing LEO concentration in chitosan films. Similarly, a decrease in moisture content, solubility, and WVP was reported for films made from potato starch, Zedo gum, and Salvia officinalis essential oil.51 Also, A. Istiqomah et al.18 observed a decrease in moisture content and solubility by adding LEO to chitosan and Dioscorea hispida starch-based films.
| Film | L* | a* | b* | Opacity (%) |
|---|---|---|---|---|
| a Data reported are mean values ± standard deviation. b Median on the same column with a different number of asterisks are significantly different (Tukey: p < 0.05). | ||||
| CF | 56.77 ± 0.06* | 1.10 ± 0.10* | 16.37 ± 0.12* | 78.37 ± 0.60* |
| FLEO 0.5% | 55.63 ± 0.11** | 1.09 ± 0.08* | 16.53 ± 0.10** | 78.12 ± 0.16* |
| FLEO 1.0% | 55.57 ± 0.15** | 1.10 ± 0.00* | 16.60 ± 0.16** | 79.01 ± 1.00** |
| FLEO 1.5% | 55.20 ± 0.17*** | 1.10 ± 0.06* | 17.17 ± 0.23*** | 79.59 ± 0.93** |
As for the values of a* (green/red) and opacity, no significant differences were observed. However, the films showed opacity values between 78.12 ± 0.16 and 79.59 ± 0.93. These values suggest a potential application for light-sensitive foods, as opacity is a desirable property that provides a barrier to visible light, thus helping to prevent light-induced lipid oxidation.52
In general, the incorporation of LEO did not affect the colour parameters (L*, a* and b*) and opacity of the films (p > 0.05). These results are probably due to the light colour of LEO and the low concentrations of essential oil. Similar results have been reported for corn starch films with orange and Zanthoxylum bungeanum essential oils.53,54 In contrast, one study reported an increase in L*, a* and b* colour parameters when lemon essential oil was incorporated into films based on grass carp collagen and chitosan.55
In general, the incorporation of LEO did not cause significant changes in the microstructure of the films. Consistent with these results, a study showed that the addition of 1% cinnamon oil to pinto bean starch and polyvinyl alcohol films did not affect the position of the peaks compared to the control film.56 Similarly, in corn starch films with LEO, the presence of LEO was found not to affect the crystallographic structure of the films.57 In contrast, the incorporation of thyme oil into a soy protein isolate based film resulted in a less crystalline structure.58
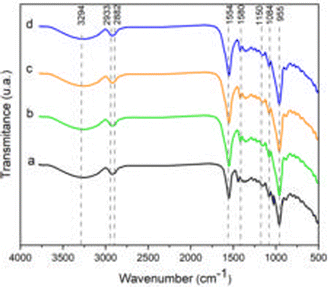
The bands at 2933 and 2882 cm−1 are attributed to antisymmetric and symmetric stretching vibrations of the –CH3 and –CH2 bonds. In addition, spectral changes in these bands are associated with lipids, surfactants and an increase in ester group content upon incorporation of essential oil.60,61
The bands at 1554 and 1380 cm−1 are attributed to bending and stretching vibrations of the O–H groups of matrix-bound water.62 However, a higher intensity at 1554 cm−1 has been observed in FLEOs, associated with compounds present in LEO.17,63
The bands identified at 1150, 1084 and 1027 cm−1 correspond to stretching frequencies of C–O groups associated with C–O–C glycosidic bonds.64 The band located at 955 cm−1 corresponds to the stretching vibration of the pyranose ring.65 The observed changes in the position of the bands between 1150 and 955 cm−1 suggest an interaction of hydrogen bonds between starch, alginate, glycerol and LEO.66 Bands below 868 cm−1 are attributed to skeletal vibrations of the glucopyranose rings.67
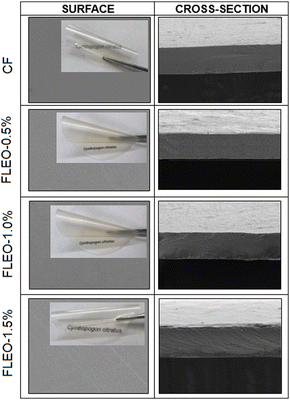 | ||
| Fig. 5 SEM images of the surface (left column) and the cross-sections (right column) of the film CF, FLEO-0.5%, FLEO-1.0% and FLEO-1.5%. | ||
These results are consistent with the findings obtained from mechanical, optical, and barrier properties, as well as FTIR and XRD analysis. The interaction between the film components affects the microstructure of the polymer matrix, which directly impacts the mechanical, optical, physical and barrier properties.68 Previous research on cassava starch-based films and chitosan and sodium alginate coatings with cinnamon essential oil observed a microstructure with uniform distribution of the essential oil.61,69 Similarly, Bansal et al.70 observed smooth and homogeneous structures in an edible coating of buckwheat starch with xanthan gum and LEO.
3.4 Retention and release study
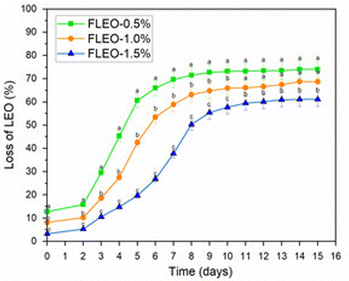
The results showed significant differences (p < 0.05) of the films during the storage time, demonstrating that FLEO-1.5% showed a higher retention of LEO in the polymeric matrix compared to FLEO-1.0% and FLEO-0.5%, which could be attributed to an increase in chemical interactions between LEO and the other components of the polymeric matrix.71
In addition, the compatibility between the components of the film and their uniform distribution (SEM Fig. 5) leads to a significant stability and retention of the essential oil. P. B Kavur and A. Yemenicioglu72 showed that chitosan films with chickpea proteins, which had a more homogeneous distribution of eugenol droplets in the films, had a higher retention. On the contrary, Zhu et al.73 observed an increase in thymol release in bilayer films with increasing oil addition during storage time.
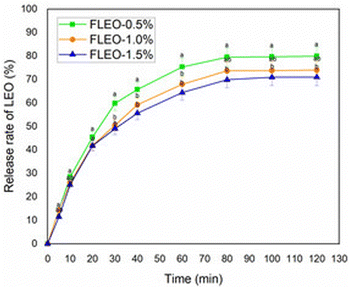
An initial rapid release of LEO was also observed when the films were immersed in the simulant solution, which could be attributed to the easy and rapid penetration of the simulant solution into the polymer matrix. Subsequently, the release rate decreased during the remaining period. This behaviour was also observed in polyvinyl alcohol/gum arabic gum/chitosan composite films with black pepper essential oil and ginger essential oil incorporated.71
Therefore, the diffusion of essential oils through the film matrix is also influenced by the swelling process, which creates a more open structure and consequently increases the mobility and release of the essential oil. Similarly, the interaction between the components of the polymeric matrix with the active substances and the characteristics of the simulant are factors that promote the release of this type of substance.46,74
3.5 Antioxidant activity
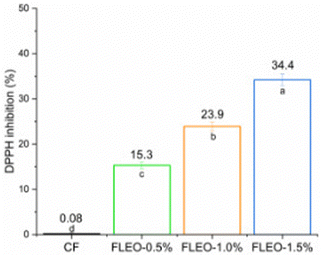
The DPPH radical inhibition activity of films with and without LEO addition is shown in Fig. 8. CF showed no antioxidant activity, whereas LEO incorporation resulted in a significant increase (p <0.05) with increasing LEO concentration. This is mainly attributed to citral, as it has been shown to be effective in scavenging free radicals and has the ability to donate hydrogen atoms to allylic sites.75 In addition, the presence of secondary metabolites and phenolic acids in LEO has been reported to confer antioxidant capacity.57 However, the antioxidant capacity of LEO, as well as its antimicrobial activity, may vary due to several factors, such as the extraction method, the origin of the species and the part of the plant used for extraction.76A study on polyvinyl alcohol and cassava starch-based films reported an increase in antioxidant capacity with increasing LEO concentration.9 Similarly, an increase in antioxidant activity was shown for the sweet potato starch film incorporated with LEO.77 An increasing trend in radical scavenging was also observed with higher oil concentrations.78
3.6 Antibacterial activity
Increasing the concentration of LEO in the film shows a significant increase (p < 0.05) in antibacterial activity (Table 5). In contrast, CF showed no zone of inhibition. The results show that FLEOs have antibacterial properties against S. aureus (Gram-positive) and E. coli (Gram-negative). This antibacterial effect is attributed to the fact that LEO induces damage to the cell membrane of bacteria, interfering with their growth and reproduction, ultimately leading to cell death.42,79,80| Film | Inhibition zone (mm) | |
|---|---|---|
| S. aureus | E. coli | |
| a Data reported are mean values ± standard deviation. b Median on the same column with a different number of asterisks are significantly different (Tukey: p < 0.05). | ||
| CF | 0.0* | 0.0* |
| FLEO 0.5% | 15.92 ± 1.03** | 13.96 ± 0.98** |
| FLEO 1.0% | 17.13 ± 1.09*** | 14.10 ± 1.12** |
| FLEO 1.5% | 19.24 ± 1.18**** | 16.06 ± 1.27*** |
In addition, slightly higher inhibition zones (between 15.92 ± 1.03 and 19.24 ± 1.18) were observed for S. aureus compared to E. coli (between 13.96 ± 0.98 and 16.06 ± 1.27). This is attributed to the fact that the composition of the cell wall of Gram-negative bacteria can reduce the effect of essential oils. This is because they have a thin layer of peptidoglycan and an outer membrane composed of lipoproteins, which acts as a barrier against hydrophilic compounds.81 A similar behaviour was observed in films of chitosan, Dioscorea hispida starch and LEO, which showed a higher antibacterial activity against Gram-positive bacteria (S. aureus and S. epidermis) compared to Gram-negative bacteria (E. coli and S. typhi).18 Another study also showed an increase in inhibition zones against S. aureus and E. coli with increasing LEO concentration in an edible coating of buckwheat starch with xanthan gum.70 In addition, Socaciu et al.82 observed a higher zone of inhibition for S. aureus in whey protein and Tarragon essential oil based films compared to E. coli.
4. Conclusions
In this study, citral and citronellol, were identified as the major components of lemongrass essential oil (LEO) with a minimum inhibitory concentration (MIC) of 25 μg mL−1 against S. aureus and E. coli bacteria. Incorporation of LEO into the films resulted in a decrease in water vapour permeability (WVP), moisture content and solubility with increasing LEO concentration.No effect on mechanical properties and colour parameters was observed when LEO was incorporated into the films. SEM, FTIR and XRD analyses confirmed the intermolecular interactions between LEO, starch, sodium alginate and glycerol. The results of in vitro release studies, antioxidant and antibacterial activities in FLEO-1.5% indicate the viability of the active films for food applications.
Therefore, the study of materials with natural composites for food packaging has great potential for implementation in the food industry, driving the development of active films to extend the shelf life of food and reduce the use of synthetic materials, in line with the trends towards sustainability and food safety.
Author contributions
Olga Lucía Torres Vargas – funding acquisition, conceptualization, writing – reviewing and editing; Yessica Viviana Galeano Loaiza – formal analysis, data curation, conceptualization, validation and writing; Iván Andrés Rodríguez Agredo – supervision, methodology and investigation.Data availability
The data supporting this article have been included as part of the ESI.†Conflicts of interest
There are no conflicts to declare.Acknowledgements
We thank the Molecular Immunology Research Group (GYMOL) of the Universidad del Quindío for their collaboration in the analysis of the Minimum Inhibitory Concentration (MIC) and for providing the bacterial strains necessary for this study. We would like to thank the Vicerrectoria de Investigaciones at Universidad del Quindío for providing financial support (Research Project No. 1073).References
- ONU. Objetivo 12: Garantizar modalidades de consumo y producción sostenibles, https://www.un.org/sustainabledevelopment/es/sustainable-consumption-production/, 2020 Search PubMed.
- B. Haridevamuthu, D. Raj, A. Chandran, R. Murugan, S. Seetharaman, M. Dhanaraj and J. Arockiaraj, Carbohydr. Polym., 2024, 329, 121798 CrossRef CAS PubMed.
- Z. Hernández-Nolasco, M. A. Ríos-Corripio, J. V. Hidalgo-Contreras, P. H. Castellano, E. Rubio-Rosas and A. S. Hernández-Cázares, LWT--Food Sci. Technol., 2024, 192, 115718 CrossRef.
- A. G. Sethulakshmi and M. P. Saravanakumar, Int. J. Biol. Macromol., 2024, 260, 129153 CrossRef CAS PubMed.
- Z. Song, J. Wei, Y. Cao, Q. Yu and L. Han, Food Chem., 2023, 418, 135958 CrossRef CAS PubMed.
- M. A. Hanif, S. Nisar, G. S. Khan, Z. Mushtaq and M. Zubair, J. Essent. Oil Res., 2019, 3–17 Search PubMed.
- Z. Liu, S. Wang, H. Liang, J. Zhou, M. Zong, Y. Cao and W. Lou, Int. J. Biol. Macromol., 2024, 133242 CrossRef CAS PubMed.
- J. Jovanović, J. Ćirković, A. Radojković, N. Tasić, D. Mutavdžić, G. Branković and Z. Branković, Int. J. Biol. Macromol., 2024, 133335 CrossRef PubMed.
- Z. Chen, L. Zong, C. Chen and J. Xie, Food Packag. Shelf Life, 2020, 26, 100565 CrossRef.
- A. D. Sharma, I. Kaur and A. Chauhan, Chem. Afr., 2023, 6, 2835–2848 CrossRef CAS.
- J. Aristizábal, T. Sánchez and D. M. Lorío. Guía técnica para producción y análisis de almidón de yuca, 2007, 49–59, https://www.fao.org/3/a1028s/a1028s00.htm Search PubMed.
- M. Fadli, J. M. Bolla, N. E. Mezrioui, J. M. Pagès and L. Hassani, Ind. Crops Prod., 2014, 61, 370–376 CrossRef CAS.
- A. Ahmad and A. Viljoen, Phytomedicine, 2015, 22(6), 657–665 CrossRef CAS PubMed.
- M. I. Perdana, J. Ruamcharoen, S. Panphon and M. Leelakriangsak, LWT--Food Sci. Technol., 2021, 141, 110934 CrossRef CAS.
- O. L. Vargas, Y. V. Loaiza and M. Gonzalez, J. Mater. Res. Technol., 2021, 13, 2239–2250 CrossRef.
- O. L. Vargas, I. A. Agredo and Y. V. Loaiza, RSC Adv., 2024, 14(22), 15293–15301 RSC.
- J. F. Mendes, L. B. Norcino, H. H. A. Martins, A. Manrich, C. G. Otoni, E. E. N. Carvalho, R. H. Piccoli, J. E. Oliveira, A. C. M. Pinheiro and L. H. C. Mattoso, Food Hydrocolloids, 2020, 100, 105428 CrossRef CAS.
- A. Istiqomah, W. E. Prasetyo, M. Firdaus and T. Kusumaningsih, Int. J. Biol. Macromol., 2022, 210, 669–681 CrossRef CAS PubMed.
- ASTM, Standard test method for tensile properties of thin plastic sheeting, in Standard Designations D882-01, Annual Book of ASTM Standards, American Society for Testing and Materials, Philadelphia, PA, 2002 Search PubMed.
- ASTM, Standard test methods for water vapor transmission of materials, in E96 e 05, Annual Book of ASTM Standards, American Society for Testing and Materials, 2005 Search PubMed.
- AOAC Association of Official Agricultural Chemists, Official Methods of Analysis of AOAC International, AOAC International Rockville, USA, 20th edn, 2016 Search PubMed.
- R. Akhter, F. A. Masoodi, T. A. Wani and S. A. Rather, Int. J. Biol. Macromol., 2019, 137, 1245–1255 CrossRef CAS PubMed.
- UNE 40-080, Determinación de las magnitudes cromáticas CIE, Norma española, Instituto Español de Normalización (IRANOR), Madrid, 1984 Search PubMed.
- CIE, Industrial colour-difference evaluation, Technical report 116/1995, Commission Internationale de I‘Eclairage Central Bureau, Vienna, Austria, 1995 Search PubMed.
- Hunter Associates Laboratory, Universal software versions 3.2 and above: User's manual: manual version 1.5, Reston, 1997 Search PubMed.
- T. Xu, C. Gao, Y. Yang, X. Shen, M. Huang, S. Liu and X. Tang, Food Hydrocolloids, 2018, 84, 84–92 CrossRef CAS.
- C. Han, P. Jin, M. Li, L. Wang and Y. Zheng, J. Agric. Food Chem., 2017, 65, 7159–7167 CrossRef CAS PubMed.
- M. Parcheta, R. Świsłocka, S. Orzechowska, M. Akimowicz, R. Choińska and W. Lewandowski, Mater., 2021, 14(8), 1984 CrossRef CAS PubMed.
- M. Moradi, H. Tajik, S. M. Rohani and A. Mahmoudian, LWT--Food Sci. Technol., 2016, 72, 37–43 CrossRef CAS.
- S. K. Bajpai, N. Chand and V. Chaurasia, Food Bioprocess Technol., 2012, 5, 1871–1881 CrossRef CAS.
- G. Antonioli, G. Fontanella, S. Echeverrigaray, A. P. L. Delamare, G. F. Pauletti and T. Barcellos, Food Chem., 2020, 326, 126997 CrossRef CAS PubMed.
- M. D. T. Ngongang, P. Eke, M. L. Sameza, M. N. L. N. Mback, C. D. Lordon and F. F. Boyom, Int. J. Trop. Insect Sci., 2022, 1–13 Search PubMed.
- S. A. Alsakhawy, H. H. Baghdadi, M. A. El-Shenawy and L. S. El-Hosseiny, Sci. Rep., 2024, 14(1), 17278 CrossRef CAS PubMed.
- A. Yadav, T. S. Raghuvanshi and B. Prakash, Sustainable Food Technol., 2023, 1(6), 930–940 RSC.
- D. Babatunde, G. Otusemade, M. Ojewumi, O. Agboola, E. Oyeniyi and K. Akinlabu, Inter. J. Mech. Eng. Technol., 2019, 10(3), 882–889 Search PubMed.
- L. A. Ortega-Ramirez, M. M. Gutiérrez-Pacheco, I. Vargas-Arispuro, G. A. González-Aguilar, M. A. Martínez-Téllez and J. F. Ayala-Zavala, Antibiotics, 2020, 9(3), 102 CrossRef CAS PubMed.
- J. Viktorová, M. Stupák, K. Řehořová, S. Dobiasová, L. Hoang, J. Hajšlová, T. Thanh, L. Tri, N. Tuan and T. Ruml, Foods, 2020, 9(5), 585 CrossRef PubMed.
- V. Valková, H. Ďúranová, L. Galovičová, P. Borotová, N. L. Vukovic, M. Vukic and M. Kačániová, Agronomy, 2022, 12(1), 155 CrossRef.
- R. Ribeiro-Santos, M. Andrade, N. R. de Melo and A. Sanches-Silva, Use of essential oils in active food packaging: Recent advances and future trends, Trends Food Sci. Technol., 2017, 61, 132–140 CrossRef CAS.
- J. Sharifi-Rad, A. Sureda, G. C. Tenore, M. Daglia, M. Sharifi-Rad, M. Valussi, R. Tundis, M. Sharifi-Rad, M. Loizzo, A. O. Ademiluyi, R. Sharifi-Rad, S. A. Ayatollahi and M. Iriti, Molecules, 2017, 22(1), 70 CrossRef PubMed.
- Y. Zhang, J. Wei, H. Chen, Z. Song, H. Guo, Y. Yuan and T. Yue, LWT--Food Sci. Technol., 2020, 117, 108667 CrossRef CAS.
- M. Mukarram, S. Choudhary, M. A. Khan, P. Poltronieri, M. M. A. Khan, J. Ali, D. Kurjak and M. Shahid, Antioxidants, 2021, 11(1), 20 CrossRef PubMed.
- L. B. Norcinoa, J. F. Mendes, C. V. L. Natarelli, A. Manrich, J. E. Oliveira and L. H. Mattoso, Food Hydrocolloids, 2020, 106, 105862 CrossRef.
- T. Erceg, O. Šovljanski, A. Stupar, J. Ugarković, M. Aćimović, L. Pezo, A. Tomić and M. A. Todosijević, Inter. J. Biol. Macromol., 2023, 228, 400–410 CrossRef CAS PubMed.
- M. Eltabakh, H. Kassab, W. Badawy, M. Abdin and S. Abdelhady, J. Polym. Environ., 2021, 30, 1–11 Search PubMed.
- T. T. Nguyen, B. T. T. Pham, H. N. Le, L. G. Bach and C. H. Thuc, Food Packag. Shelf Life, 2022, 32, 100830 CrossRef.
- F. Han Lyn and Z. A. Nur Hanani, J. Package Technol. Res., 2020, 4, 33–44 CrossRef.
- H. Almasi, S. Azizi and S. Amjadi, Food Hydrocolloids, 2020, 99, 105338 CrossRef CAS.
- B. Wang, J. Sui, B. Yu, C. Yuan, L. Guo, A. M. Abd El-Aty and B. Cui, Carbohydr. Polym., 2021, 254, 117314 CrossRef CAS PubMed.
- Y. Liu, S. Kang, H. Zhang, Y. Kai and H. Yang, Int. J. Food Microbiol., 2023, 407, 110437 CrossRef CAS PubMed.
- M. Pirouzifard, R. A. Yorghanlu and S. Pirsa, J. Thermoplast. Compos. Mater., 2020, 33(7), 915–937 CrossRef CAS.
- X. Sun, H. Zhang, J. Wang, M. Dong, P. Jia, T. Bu, Q. Wang and L. Wang, Food Packag. Shelf Life, 2021, 29, 100741 CrossRef CAS.
- J. A. do Evangelho, G. da Silva Dannenberg, B. Biduski, S. L. M. El Halal, D. H. Kringel, M. A. Gularte, A. M. Fiorentini and E. da Rosa Zavareze, Carbohydr. Polym., 2019, 222, 114981 CrossRef CAS PubMed.
- Q. Yang, F. Zheng, Q. Chai, Z. Li, H. Zhao, J. Zhang, K. Nishinari and B. Cui, Int. J. Biol. Macromol., 2024, 256, 128382 CrossRef CAS PubMed.
- Y. Jiang, W. Lan, D. E. Sameen, S. Ahmed, W. Qin, Q. Zhang, H. Chen, H. Dai, J. He and Y. Liu, Int. J. Biol. Macromol., 2020, 160, 340–351 CrossRef CAS PubMed.
- A. Khazaei, L. Nateghi, N. Zand, A. Oromiehie and F. Garavand, J. Polym., 2021, 13(16), 2778 CAS.
- P. Singh, G. Kaur, A. Singh and P. Kaur, J. Food Meas. Charact., 2023, 17(1), 527–545 CrossRef.
- Q. Liu, R. Han, D. Yu, Z. Wang, X. Zhuansun and Y. Li, LWT--Food Sci. Technol., 2024, 191, 115686 CrossRef CAS.
- S. M. Amaraweera, C. Gunathilake, O. H. Gunawardene, N. M. Fernando, D. B. Wanninayaka, A. Manamperi, R. S. Dassanayake, S. M. Rajapaksha, M. Gangoda, C. Fernando, A. K. Kulatunga and A. Manipura, Cellulose, 2021, 28, 10531–10548 CrossRef CAS.
- N. Karimi-Khorrami, M. Radi, S. Amiri, E. Abedi and D. J. McClements, Int. J. Biol. Macromol., 2022, 207, 801–812 CrossRef CAS PubMed.
- Y. Zhou, X. Wu, J. Chen and J. He, Int. J. Biol. Macromol., 2021, 184, 574–583 CrossRef CAS PubMed.
- M. Zhang and H. Chen, Int. J. Biol. Macromol., 2023, 233, 123462 CrossRef CAS PubMed.
- E. P. da Cruz, J. B. Pires, F. N. dos Santos, L. M. Fonseca, M. Radünz, J. Dal Magro, E. A. Gandra, E. Zavareze and A. R. G. Dias, Food Hydrocolloids, 2023, 145, 109105 CrossRef.
- T. J. Gutiérrez, J. Polym. Environ., 2018, 26(9), 3902–3912 CrossRef.
- Y. Zhang, Y. Pu, H. Jiang, L. Chen, C. Shen, W. Zhang, J. Cao and W. Jiang, Food Chem., 2024, 435, 137534 CrossRef CAS PubMed.
- J. Xiao, C. Gu, D. Zhu, Y. Huang, Y. Luo and Q. Zhou, LWT--Food Sci. Technol., 2021, 140, 110809 CrossRef CAS.
- A. Hejna, J. Lenża, K. Formela and J. Korol, J. Polym. Environ., 2019, 27, 1112–1126 CrossRef CAS.
- H. Haghighi, S. Biard, F. Bigi, R. De Leo, E. Bedin, F. Pfeifer, H. W. Siesler, F. Licciardello and A. Pulvirenti, Food Hydrocolloids, 2019, 95, 33–42 CrossRef CAS.
- X. He, M. Li, X. Gong, B. Niu and W. Li, Food Packag. Shelf Life, 2021, 29, 100697 CrossRef CAS.
- H. Bansal, H. P. Singh, S. Singh, A. Sharma, J. Singh, K. Kaur and S. K. Mehta, Int. J. Biol. Macromol., 2024, 133239 CrossRef CAS PubMed.
- A. Amalraj, J. T. Haponiuk, S. Thomas and S. Gopi, Int. J. Biol. Macromol., 2020, 151, 366–375 CrossRef CAS PubMed.
- P. B. Kavur and A. Yemenicioğlu, Food Hydrocolloids, 2024, 151, 109790 CrossRef.
- J. Y. Zhu, C. H. Tang, S. W. Yin and X. Q. Yang, Carbohydr. Polym., 2018, 181, 727–735 CrossRef CAS PubMed.
- J. Andrade, C. González-Martínez and A. Chiralt, Food Packag. Shelf Life, 2022, 33, 100855 CrossRef CAS.
- S. Li, Y. Jiang, Y. Zhou, R. Li, Y. Jiang, M. A. Hossen, J. Dai, W. Qin and Y. Liu, Food Chem., 2022, 370, 131082 CrossRef CAS PubMed.
- B. Ashaq, K. Rasool, S. Habib, I. Bashir, N. Nisar, S. Mustafa, Q. Ayas, G. A. Nayik, J. Uddin, S. Ramniwas, R. Mugabi and S. M. Wani, Food Chem. X, 2024, 101521 CrossRef CAS PubMed.
- R. K. Basha, N. F. Abuhan, S. H. Othman, N. Z. N. Hasnan, R. Sukor, N. S. Azmi, N. A. M. Amin and Z. M. Dom, Adv. Agric. Food Res. J., 2020, 1, 2 Search PubMed.
- M. A. Abou-Raya, M. M. Khalil, A. H. S. Soliman and R. AbdElmoula, J. Food Dairy Sci., 2023, 14(11), 251–260 CrossRef.
- S. Sharma, S. Habib, D. Sahu and J. Gupta, Med. Chem., 2021, 17(1), 2–12 CrossRef CAS.
- M. Alagawany, M. T. El-Saadony, S. S. Elnesr, M. Farahat, G. Attia, M. Madkour and F. M. Reda, Poult. Sci., 2021, 100(6), 101172 CrossRef CAS PubMed.
- I. K. Sani, S. P. Geshlaghi, S. Pirsa and A. Asdagh, Food Hydrocolloids, 2021, 117, 106719 CrossRef CAS.
- M. I. Socaciu, M. Fogarasi, C. A. Semeniuc, S. A. Socaci, M. A. Rotar, V. Mureşan, O. L. Pop and D. C. Vodnar, Polymers, 2020, 12(8), 1748 CrossRef CAS PubMed.
Footnote |
| † Electronic supplementary information (ESI) available. See DOI: https://doi.org/10.1039/d4ma00608a |
| This journal is © The Royal Society of Chemistry 2024 |

