DOI:
10.1039/D4MA00611A
(Paper)
Mater. Adv., 2024,
5, 8970-8985
Investigating pressure-driven semiconductor-to-metal transition in lead-free perovskites AlGeX3 (X = F, Cl, and Br): insights from first-principles calculations†
Received
12th June 2024
, Accepted 21st October 2024
First published on 22nd October 2024
Abstract
In the pursuit of commercializing electronic and optoelectronic devices, researchers have turned their attention to non-toxic inorganic cubic metal halide perovskites. This study focuses on novel lead-free compounds—specifically AlGeX3 (where X = F, Cl, and Br) and examines their structural, electronic, optical, and mechanical properties under the application of hydrostatic pressure through density functional theory (DFT). The mechanical stability of all compounds is rigorously assessed using Born stability criteria and formation energy. The elastic investigations reveal that the materials have anisotropy, ductility, and good Machinenabilty index depending on the halide type and applied pressure. The pressure-dependent electronic band structures are calculated by GGA-PBE functional to demonstrate the intriguing behavior of the compounds. Band structures are also calculated by HSE06 functional without pressure. Further, the substitution of the halide F with Cl/Br leads to an indirect to direct band gap transformation. Additionally, increasing positive hydrostatic pressure results in a tunable band gap with decreasing trends for all the compounds leading them to transit from semiconductor to metallic state. This phenomenon is explained by the partial and total density of states (PDOS and TDOS). The improvement of pressure-dependent optical properties in both visible and UV regions makes them valuable contenders in the quest for efficient solar cells and other electronic and optoelectronic devices.
Introduction
The global demand for electrical energy has been rising dramatically over the past few decades as a result of contemporary civilizations and industrialization. Industries rely on abundant, stable, and affordable energy supplies to construct contemporary civilization. However, a significant portion of the energy used comes from nonrenewable resources like fossil fuels, which are scarce and will eventually run out. Furthermore, the burning of fossil fuels contributes significantly to global warming. Thus, it is essential to research different sustainable and renewable energy sources such as solar energy, which is unlimited and has the potential to alleviate the consequences of global warming. Since photovoltaic cells can generate clean, renewable electricity from light, they have been employed and studied extensively in recent years.1–12 Thus, the search for an efficient light-absorbing material capable of absorbing the whole solar spectrum is important for fabricating high-performance solar cells. Perovskites (ABX3) are promising materials for the absorber layer because they are cheap, easy to make, and have high power conversion efficiency (PCE).13,14 MAPbI3 perovskite solar cells have reached a record PCE of over 25%.15 However, they have some drawbacks, such as the instability of the organic component under different environmental conditions16,17 and the toxicity of the lead element (Pb).18,19 These issues can be addressed by replacing the organic cations with inorganic ones20 and the lead element (Pb) with a non-toxic group 14 element, such as Sn or Ge.21,22 For example, lead-free germanium-based CsGeX3 (X is a halogen) perovskite solar cells achieved a PCE of about 4.92%, which increased to 7.11% when tin was added (CsSn0.5Ge0.5I3).23 Also, CsSnI3-based perovskite solar cells reached a PCE of more than 10%.24 However, these PCE are still lower than those of organic–inorganic halide perovskites (MAPbI3). Therefore, researchers are looking for new lead-free perovskite materials and ways to improve the absorbance of the absorber layer in the whole solar spectrum. Many parameters of the absorbing material, including bandgap, absorbance, carrier mobility, charge carrier recombination rate, and exciton binding energy influence the PCE of photovoltaic cells. These parameters can be adjusted or improved by applying pressure. Therefore, to investigate improved lead-free nontoxic inorganic perovskite-based absorber materials, it is necessary to study their electrical, optical, and mechanical properties under pressure.
Moreover, pressure-induced as well as strain-induced changes can control the material's band gap, improve light absorption, minimize charge carrier recombination, and maximize charge separation.25–28 Furthermore, pressure is vital for the exploration of the material's electronic and optical characteristics and structural integrity. To improve the solar energy conversion efficiency of Ge-based perovskite materials applying pressure could be a strategy. Mitro et al., Hasan et al., Sarker et al., and Xiang et al. explored pressure-driven structural, electronic, optical, and mechanical properties of RbGeX3 (X = Cl, Br),29 GaGeX3 (X = Cl, Br, and I),30 NaGeX3 (X = F, Cl, Br, and I),31 and CsGeX3 (X = I, Br, or Cl)32 accordingly, to enhance the optoelectronic characteristics, and making them more suitable for practical optoelectronic devices application such as solar cells. Recently, Hasan et al. investigated different physical properties of novel AlGeX3 (X = F, Cl, Br, and I)33 perovskites using first-principles calculation and whether no previous theoretical studies have been conducted on the pressure-driven Ge-based AlGeX3 (X = F, Cl, and Br) halide perovskites. So, based on an extensive literature review and leveraging our current understanding, the scarcity of existing research has driven us to investigate this uncharted area, aiming to overcome existing limitations and harness the untapped potential of these promising materials. Besides, Aluminum-based perovskite minerals are abundant in the Earth's crust and have been used in a wide range of applications. These materials are very resistant to corrosion and have the ideal properties of being lightweight, flexible, and ductile. In the development of functional materials with improved capacities, these attributes are highly valued. After silicon, aluminum is the second most common metallic element in the world that emphasizes its significance, and material science may suggest its wide variety of applications.
This study presents the pressure-induced structural, electronic, mechanical, and optical characteristics of perovskite Ge-halide materials AlGeX3 (X = F, Cl, and Br) by deliberately altering the pressure circumstances using first-principles computations. The key insights of this study are to investigate the pressure-dependent structural stability of the compounds, energy bandgap engineering, semiconductor–metal transition state, state of optical properties, elastic properties, etc., and hence to explore the compounds’ suitability for high-performance solar cells.
Computational details
This research uses the CASTEP module of BIOVIA Materials Studio software34 to perform DFT-based calculations.35 Here the GGA-PBE functional36 to compute the electronic exchange–correlation energy and the bandgap. The existence of the Vanderbilt-type OTFG ultrasoft pseudopotential is assumed37 to handle the electron–ion interactions. The optimal crystal structure is ensured by the BFGS method38 and the plane wave cutoff energy and k-points are set at 500 eV and 6 × 6 × 6 to obtain the optimal structure and the characteristics calculations. The Monkhorst–Pack scheme39 is conducted to sample the k-points in the Brillouin zone and optical properties are calculated at higher k-points. The elastic constants of our models are determined using the stress–strain method40 under standard conditions. CASTEP determines the elastic stiffness constants (Cij) based on the finite strain theory. On the other hand, the ELATE software is conducted to visually represent the anisotropic contour plots in three dimensions, specifically for the parameters of Shear modulus, Young's modulus, and Poisson's ratio. The geometry of the unit cells and the point of atomic relaxation optimization in CASTEP were set according to these criteria: convergence of total energy, 5 × 10⁻⁶ eV per atom; maximum displacements, 5 × 10⁻⁴ Å; maximum force, 0.01 eV per Å; and maximum stress, 0.02 GPa. We set the strain magnitude at 0.003 to achieve the best results and use the same thresholds for convergence.
Structural properties
Fig. 1 shows the supercell of cubic AlGeX3 crystal structure in 3D schematic form. Al and Ge are at certain Wyckoff coordinates in this structure: Al is at 1a (0,0,0), Ge is at 1b (0.5,0.5,0.5), and X atoms are at 3c (0.5,0,0.5). This structure belongs to the pm3m space group with number 221. Using the GGA technique, structural characteristics such as the energy of formation (ΔHf), the lattice constant (a), and the volume (V) were calculated by performing a volume optimization procedure to find the stable ground state unit cell. Furthermore, the energy values as a function of volume were adjusted to the Birch-Murnaghan equation.41 Using the given fit, we have calculated the lattice parameters under different hydrostatic pressures. The structural stability of those compounds such as AlGeF3, AlGeCl3, and AlGeBr3 depends on the applied pressure. The compounds become metallic for the positive hydrostatic pressures (compressive) 15 GPa, 4 GPa, and 2.5 GPa, respectively. The pressure-dependent lattice parameters, cell volumes, and formation energies are listed in Table S1(a–c) (ESI†) where the lattice parameters and cell volumes are found to decrease with intensifying the positive pressure for all the compounds. However, for a particular pressure, the lattice parameters as well as cell volumes increase when the halogen size increases (from F to Br) as seen in Table S1 (ESI†). The pressure-dependent variations of the lattice parameters for all the compounds are represented in Fig. 2.
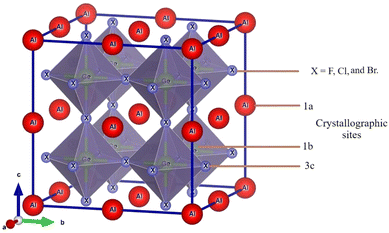 |
| | Fig. 1 AlGeX3 (X = F, Cl, and Br) cubic metal halide perovskite structure. | |
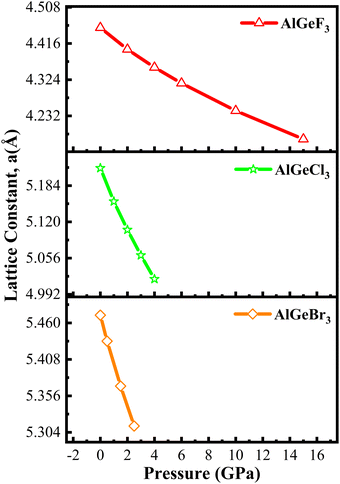 |
| | Fig. 2 Compressive pressure-dependent lattice constant of AlGeX3 (X = F, Cl, and Br). | |
To confirm the pressure-dependent structural stability, the formation energy and elastic constants of AlGeX3 are estimated and listed in Table S1 and S3(a), S4(a), and S5(a) (ESI†). The mechanical stability of those compounds is verified by Born stability criteria using the following relations,
| C11 + 2C12 > 0, C44 > 0, C11 – C12 > 0 |
The estimated elastic constants satisfy the criteria, so the compounds are mechanically stable. Further, the enthalpies of the compounds are calculated by eqn (1)
| |  | (1) |
here,
Etot.(AlGeX
3) represents AlGeX
3's total ground state energy, and
Es(Al),
Es(Ge), and
Es(X) are the energies of Al, Ge, and X (=F, Cl, and Br), respectively, per unit cell.
N is the total number of atoms per unit cell.
The results are shown in Fig. 3 where the negative formation energies (ΔHf) observed up to 15 GPa, 4 GPa, and 2.5 GPa for AlGeF3, AlGeCl3, and AlGeBr3 respectively, under compressive pressure. The formation energies of all compounds become less negative with increasing pressure. Thus, the structural stability of AlGeX3 compounds decreases gradually but they still exhibit excellent stability and tunability in the applied pressure range. The tunable structural and electrical properties of those compounds allow one to realize materials with suitable attributes for various applications. The pressure-dependent bond lengths of those compounds are estimated and listed in Table S2 (ESI†). The decrease of bond lengths with increasing pressure is due to the shrinking of interatomic space. This decreasing nature indicates a stronger bond between atoms under pressure. To explore the application areas of those compounds, their pressure-dependent electronic, optical, and mechanical properties are further estimated and presented in the following sections.
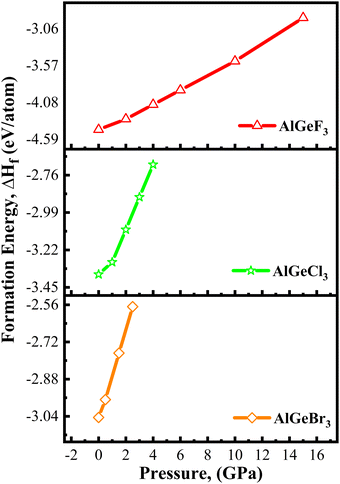 |
| | Fig. 3 Pressure-dependent formation energy of AlGeX3 (X = F, Cl, and Br). | |
Electronic properties
Herein, GGA-PBE approximation is employed to predict the pressure-induced electronic band dispersion profiles of AlGeX3. The results are presented in Fig. S1–S3 (ESI†), respectively, for the compounds AlGeF3, AlGeCl3, and AlGeBr3. The red dotted lines (0 eV, EF) in Fig. S1–S3 (ESI†) denote the Fermi level. Fig. S1 (ESI†) elucidates that AlGeF3 shows a 1.115 eV indirect energy gap at R–M critical points at ambient pressure. With the replacement of F by the larger halogen (Cl and Br) the band gap transformed from indirect to direct at the R point and the energy gap reduced to 0.760 eV and 0.433 eV for AlGeCl3 and AlGeBr3, respectively. AlGeF3 exhibits an indirect band gap and the rest of the compounds expose a direct band gap for all the applied pressure as seen in Fig. S1–S3 (ESI†). Fig. S1 (ESI†) shows that the conduction band of AlGeF3 starts shifting towards the Fermi level up to 10 Gpa pressure without changing the valence band position, that's why the energy gap reduces with increasing pressure. This scenario changes, that is, the valence band rises upward and crosses the Fermi level when 15 Gpa pressure is applied and the gap turns zero. The compounds AlGeCl3 and AlGeBr3 show identical band-shifting characteristics under compressive pressure except band gaps are direct and they become zero up to the applied pressure of 4 Gpa and 2.5 Gpa, respectively. Thus, by controlling pressure, we can tune the characteristics of compounds for specific applications such as switchable electrical devices that can alternate between metallic and semiconducting states, transistors, memory devices as well as materials with high conductivity. All the calculated band gaps of those compounds are tabulated in Tables S1(a–c) (ESI†) and plotted in Fig. 4. Almost linear trends with reduction of energy gaps are observed with intensifying pressure for the compounds AlGeF3, AlGeCl3, and AlGeBr3. Subsequently, semiconductor-to-metallic transition occurs at 15 GPa, 4 GPa, and 2.5 GPa, respectively. Since PBE underestimates the band gap, HSE06 functional is applied and the calculated values are found to be 2.043 eV, 1.694 eV, and 1.382 eV, respectively, for AlGeF3, AlGeCl3, and AlGeBr3 without pressure. A comparison of band dispersion profiles obtained from HSE06 and PBE functionals is shown in Fig. 5.
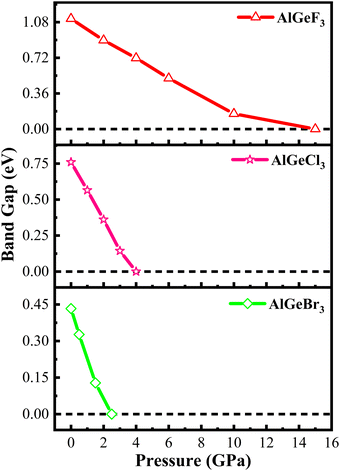 |
| | Fig. 4 Pressure-dependent band gap energy of AlGeX3 (X = F, Cl, and Br). | |
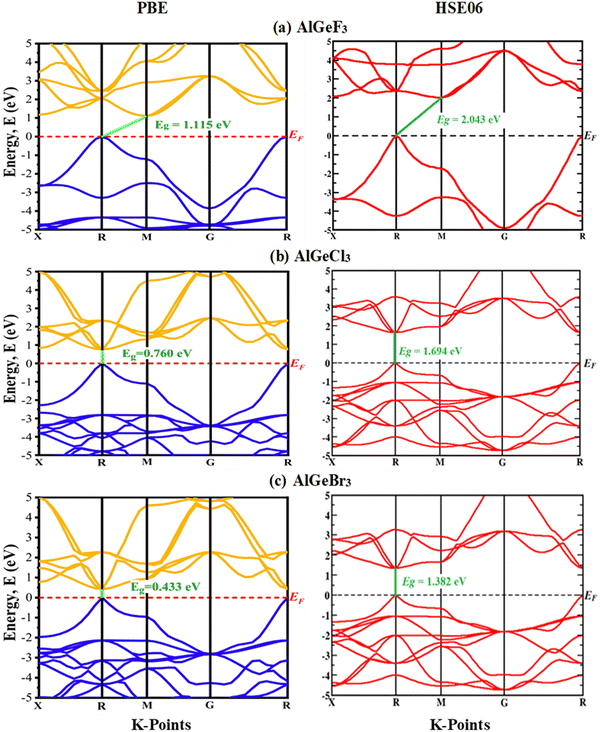 |
| | Fig. 5 A comparison of electronic band structures calculated by GGA-PBE and HSE06 functionals (a) AlGeF3, (b) AlGeCl3, and (c) AlGeBr3. | |
To assess the contribution of the orbitals in band dispersion profiles, the density of states (DOS) of AlGeX3 are also estimated and illustrated in Fig. S4–S6 (ESI†), respectively, for AlGeF3, AlGeCl3, and AlGeBr3 where the vertical line (black colored) at 0 eV designates the Fermi level. The total density of state (TDOS) is critical to understanding the properties of a semiconducting material. The TDOS of all the compounds show zero value near the Fermi level confirming that these are semiconductors at ambient pressure. It is evident from the partial density of states (PDOS) which are illustrated in Fig. S4–S6 (ESI†), the valence band maxima (VBM) are mainly derived from the orbital of F-2p and Ge-4s for AlGeF3, Cl-3p for AlGeCl3, and Br-4p for AlGeBr3. While forming the conduction band minima (CBM) are derived from mainly Al-3p for AlGeF3, Al-3p & Ge-4p for AlGeCl3 and Ge-4p for AlGeBr3 repectively. When compressive pressure is applied, the Al-3p orbital peak in the CB shifts toward the Fermi level for both AlGeF3 and AlGeCl3. But for AlGeBr3, the Ge-4p orbital peak in the CB shifts toward the Fermi level up to the pressure of 2.5 GPa. Therefore, the band gap becomes narrower, and semiconductor-to-metallic transition occurs at 15 GPa, 4 GPa, and 2.5 GPa for AlGeF3, AlGeCl3, and AlGeBr3, respectively. The pressure-dependent precise control over the bandgap through mechanical pressure, paving the way for applications of the compounds in advanced electronic and optoelectronic devices.
Optical properties
Compared to lead-based perovskites, lead-free metal halide cubic perovskites provide intriguing characteristics such as higher absorption, lower reflectance, and increased conductivity.42 Assessment of pressure-dependent optical properties is essential for advancing material research in the direction of modern optoelectronic devices, especially solar cell development.43 Here, we conducted a thorough investigation of the dielectric constant, absorption coefficient, conductivity, reflectivity, extinction coefficient, and refractive index of AlGeX3 (X = F, Cl, and Br) under pressure. It is crucial to assess the dielectric function44 first to determine other optical properties. The complex form of the dielectric function can be represented by ε(ω) = ε1(ω) + iε2(ω) where ε1(ω) is the real part and ε2(ω) is the imaginary.45 The real and imaginary parts can be expressed by| |  | (2) |
and| |  | (3) |
where P represents the integral's principal value. The mathematical expressions of the optical properties like absorption coefficient α(ω), conductivity σ(ω), refractive index η(ω), and reflectivity (R) are available in.44,46
Here we estimate pressure-dependent dielectric constants and plotted their real, ε1(ω) and imaginary, ε2(ω) parts as a function of photon energy. Fig. 6(a) shows a comparison of ε1(ω) estimated among the compounds without pressure as a function of photon energy varied from 0 to 30 eV. At 0 GPa, the value of the static dielectric constant ε1(0) increases when F is substituted by Cl and then to Br as seen in Fig. 6(a). The frequency dependence of ε1(ω) shows a dominant peak for the AlGeF3, which is further shifted to the lower energy side when F is substituted by Cl and Br. The peak of ε1(ω) is resulted due to the resonance between the electric displacement vector and field vector. Afterward, ε1(ω) reduces rapidly owing to the reduction of dipole moment resulting in a lack of synchronism between the displacement vector and field vector. The compounds exhibit negative ε1(ω) when the electric displacement and field vectors point in opposite directions at frequencies higher than the resonance frequency. The class of negative dielectric materials possesses a negative refractive index and has applications in optical devices. At higher frequencies, the value of ε1(ω) is almost zero due to the displacement vector which is unable to respond to the frequency of the field vector. The interaction of light with matter depends on the electronic polarization of the material.47 The charge carrier recombination rates are associated with the magnitude of ε1(ω) leading to a considerable improvement in the performance of an optoelectronic device. This implies that the compounds AlGeCl3 and AlGeBr3 are more appropriate for optoelectronic devices operating in the IR-visible region than the compound AlGeF3.
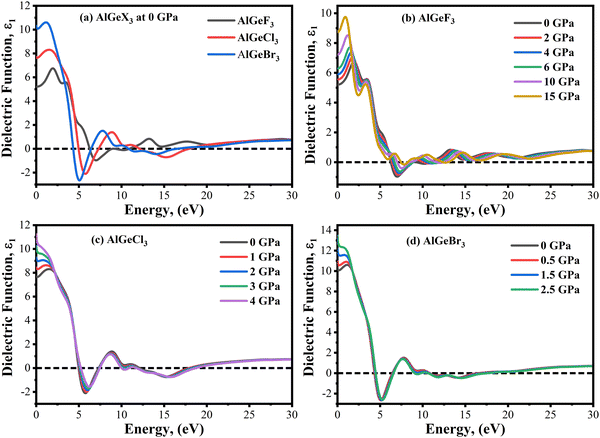 |
| | Fig. 6 Comparison of the real part of the dielectric constant without pressure (a) AlGeX3 (X = F, Cl, and Br) and with pressure (b) AlGeF3, (c) AlGeCl3, and (d) AlGeBr3. | |
A similar comparison is also shown in Fig. 6(b–d) for the compounds AlGeF3, AlGeCl3 and AlGeBr3 under pressurized conditions. The values of static dielectric constants ε1(0) increase with increasing pressure. However, the ε1(ω) spectra show major peaks that shift towards the lower energy side with increasing pressure and then they decrease rapidly and show negative peaks at a particular energy. This may be due to pressure-dependent orientational polarization that may cause the polarization vector stronger and hence the dipole moment. This in turn increases the value of ε1(0) under pressurized conditions. At higher energy, ε1(ω) becomes almost zero displaying small fluctuations as a function of photon energy. It is also found that the major peaks of ε1(ω) spectra become sharp and shifted in the lower energy direction after the application of pressure. The density of polarized atoms increases under hydrostatic pressure due to the volumetric compression of the compounds. This may result in sharp peaks due to pressure-dependent orientational change of the displacement vector in the reduced volume. Further, the resonance frequency of the displacement vector gives a redshift with increasing pressure. This demonstrates that the compounds could be more suitable for optoelectronic devices such as solar cells, LEDs, and photodetectors in the visible energy range under pressurized conditions.
The imaginary part of the dielectric function, ε2(ω) is directly connected to electron excitation. It signifies the loss of optical energy that is absorption of optical energy in the matter. Fig. 7(a) shows a comparison of the ε2(ω) obtained from the compounds AlGeF3, AlGeCl3, and AlGeBr3 with the variation of photon energy from 0 to 30 eV without pressure. The significant peak of ε2(ω) is observed at the lower energy and it gives a redshift when F is substituted by Cl and Br. Afterward, the magnitude of ε2(ω) decreases with photon energy with some arbitrary small peaks. The electric displacement vectors oscillate with field vectors and resonance condition buildup at different frequencies due to the inherent polarization of the compounds. The pressure-dependent of ε2(ω) is represented as a function of photon energy in Fig. 7(b–d). It is found in Fig. 7(b) that ε2(ω) shows one strong peak at about 4.85 eV and the second-highest peak at about 2.50 eV for the compound AlGeF3 at 0 GPa. However, these peaks become very sharp and significant with increasing pressure and they give redshift as well. The causes of sharp peaks and their shifts are already discussed. The influence of pressure is found to be insignificant in ε2(ω) spectra for the compounds AlGeCl3 and AlGeBr3 with and without pressure as seen in Fig. 7(c and d). Overall, semiconductor materials become more polarizable due to higher dielectric constant (ε1 & ε2). When materials undergo semiconductor-to-metal transitions at higher pressures, these dielectric tend to drop due to metals having low dielectric constants.
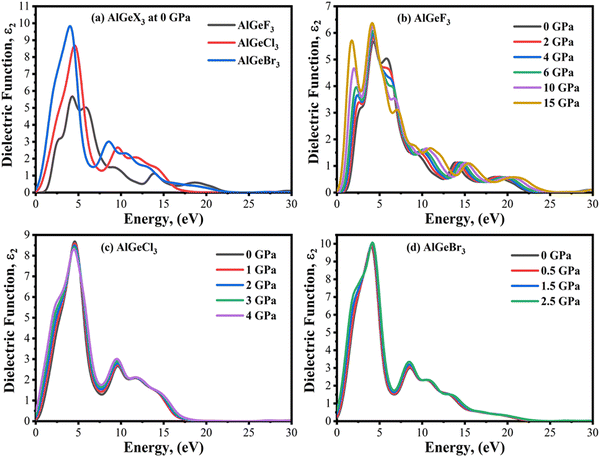 |
| | Fig. 7 Comparison of the imaginary part of the dielectric constant without pressure (a) AlGeX3 (X = F, Cl, and Br) and with pressure (b) AlGeF3, (c) AlGeCl3, and (d) AlGeBr3. | |
Optical absorption is an important factor, especially in visible regions for selecting high-performance photovoltaic materials. The absorption coefficient is a measure of how good a material is to absorb light for a particular wavelength. It depends on the loss of the photon in a material connected to the imaginary part of the dielectric constant, ε2(ω). Fig. 8(a) shows a comparison of the absorption coefficient of AlGeX3 (F, Cl, and Br) at 0 GPa. Here, the absorption spectra give a redshift when F is substituted via Cl and Br. A comparison of pressure-dependent absorption spectra of AlGeX3 (X = F, Cl, and Br) is shown in Fig. 8(b–d). Pressure-sensitive strong absorption peaks with anomalous shifts are observed in Fig. 8(b) for the compound AlGeF3. However, the influence of pressure in the lower energy of absorption spectra is found to be redshifted with higher intensity when F is replaced by Cl and Br as seen in Fig. 8(c and d). Besides, each compound displays several larger absorption peaks within the higher energy range under pressure, which indicates that the compounds could be suitable as UV sensors and detectors as well. To understand the absorption characteristics in the visible region the extended view of spectra is plotted as a function of wavelength in Fig. 9(a–d). The absorption coefficient decreases with increasing wavelength in the visible range and each compounds show the same pattern. A significant increase in the absorption is observed in the visible area for AlGeX3 under pressure in Fig. 9(b–d). However, AlGeBr3 exhibits a higher absorption among the compounds as seen in Fig. 9(a). The absorption in the visible region is consistent with the energy band gap of AlGeX3 [Eg (AlGeF3) > Eg (AlGeCl3) > Eg (AlGeBr3)]. That's why these materials show greater suitability in optoelectronic devices, especially solar cells.
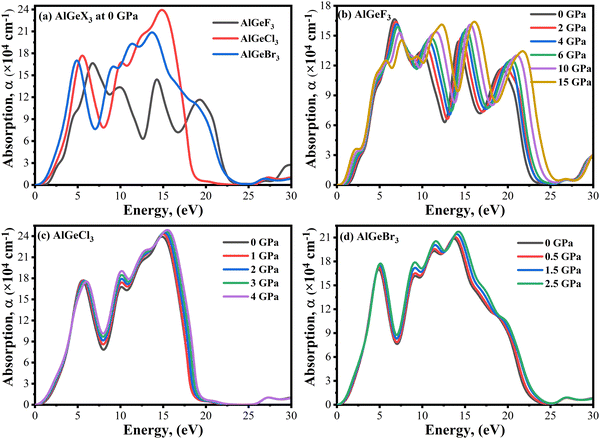 |
| | Fig. 8 Comparison of absorption coefficient without pressure (a) AlGeX3 (X = F, Cl, and Br) and with pressure (b) AlGeF3, (c) AlGeCl3, and (d) AlGeBr3. | |
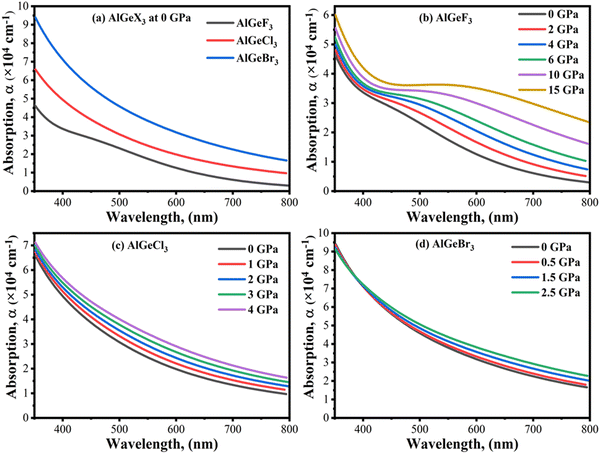 |
| | Fig. 9 Comparison of absorption coefficient in visible wavelength range without pressure (a) AlGeX3 (X = F, Cl, and Br) and with pressure (b) AlGeF3, (c) AlGeCl3, and (d) AlGeBr3. | |
Photoconductivity, σ(ω) is an optical and electrical phenomenon in which a material becomes more electrically conductive when it is exposed to light of sufficient energy. A comparison of σ(ω) is shown in Fig. 10(a–d) estimated for the compounds AlGeX3 (X = F, Cl, and Br) without pressure and with pressure. The conductivity spectra follow the same pattern as the imaginary part of the dielectric function ε2(ω). When F is substituted by Cl and Br the conductivity shifts towards the lower energy side as seen in Fig. 10(a). The pressure-dependent of σ(ω) is found to be a significant improvement for all compounds, especially in the visible region. For the compound AlGeF3, the applied pressure causes a shift of the conductivity edge towards the low-energy zone, but the conductivity peaks provide blueshift at higher energy levels. The extended view of conductivity in the visible area is shown in Fig. 11(a–d) with applied pressure. Without pressure, the compound AlGeBr3 shows the highest conductivity in the visible area as shown in Fig. 11(a). However, the conductivity is found to be more pressure-sensitive for the compound AlGeF3 than for the compounds AlGeCl3 and AlGeBr3. So, these tuning conductivity properties make a huge impact on optoelectronic devices.
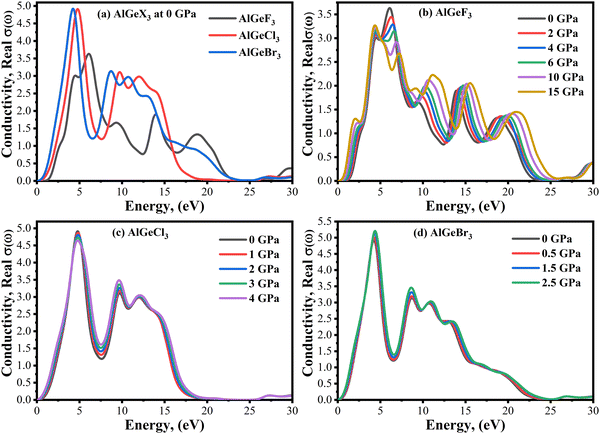 |
| | Fig. 10 Comparison of the real part of the conductivity without pressure (a) AlGeX3 (X = F, Cl, and Br) and with pressure (b) AlGeF3, (c) AlGeCl3, and (d) AlGeBr3. | |
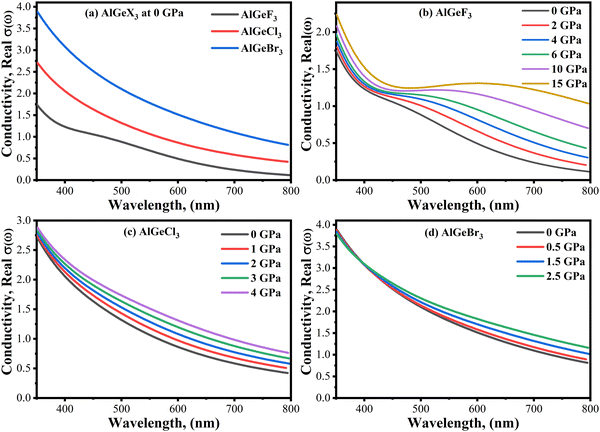 |
| | Fig. 11 Comparison of conductivity in visible wavelength range without pressure (a) AlGeX3 (X = F, Cl, and Br) and with pressure (b) AlGeF3, (c) AlGeCl3, and (d) AlGeBr3. | |
Reflectivity, R(ω) is an important parameter that determines how much light energy is reflected from a material surface. The R(ω) spectra of the compounds AlGeX3 (X = F, Cl, and Br) are shown in Fig. 12(a–d) without and with pressure. The compounds AlGeF3 and AlGeBr3 exhibit smaller reflectance over the whole spectrum (IR, Visible, and UV) as seen in Fig. 12(a). However, the compound AlGeCl3 shows a high reflectance peak at around 17 eV (UV region) indicating its application as a UV reflector. The pressure-dependent reflectivity is shown in Fig. 12(b–d). We observed redshift and blueshift in the reflectivity spectra at the low-energy and higher-energy regions under pressurized conditions. However, the change in the reflectivity value is found to be almost insignificant when pressure is applied.
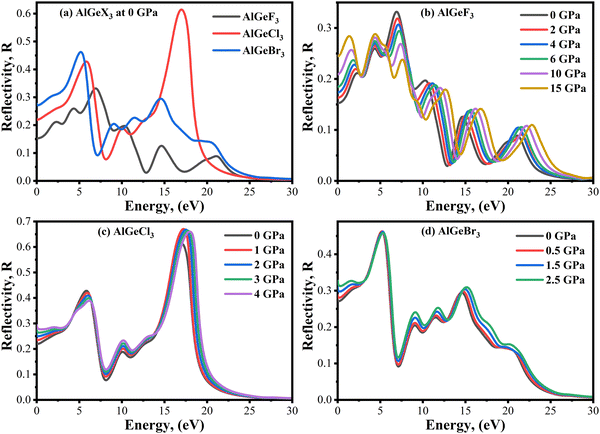 |
| | Fig. 12 Comparison of reflectivity without pressure (a) AlGeX3 (X = F, Cl, and Br) and with pressure (b) AlGeF3, (c) AlGeCl3, and (d) AlGeBr3. | |
The refractive index, η(ω) explains the speed of light in a medium. It depends on the real part of ε1(ω).48 When the refractive index falls below unity, the traveling photon's group velocity exceeds the speed of light. This property is known as superluminal. At 0 GPa, the variation of η(ω) follows the similar trends of ε1(ω) as shown in Fig. 13(a). The static value of η(ω) is found maximum for AlGeBr3 and minimum for AlGeF3, which decreases with increasing energy. When the energy reaches the UV region, the values of η(ω) go below unity. The values of η(ω) increase with increasing pressure and follow similar trends of ε1(ω) for all the compounds as shown in Fig. 13(b–d). At the lower energy region, the η(ω) peaks give a redshift up to the second peak with increasing pressure for AlGeF3 as seen in Fig. 13(b). However opposite results (blueshift) are found in the higher energy region, starting from the third peak. But for the compounds AlGeCl3 and AlGeBr3, small changes of η(ω) are observed with pressure in the lower energy region, and no significant changes are observed in the higher energy region shown in Fig. 13(c) and (d).
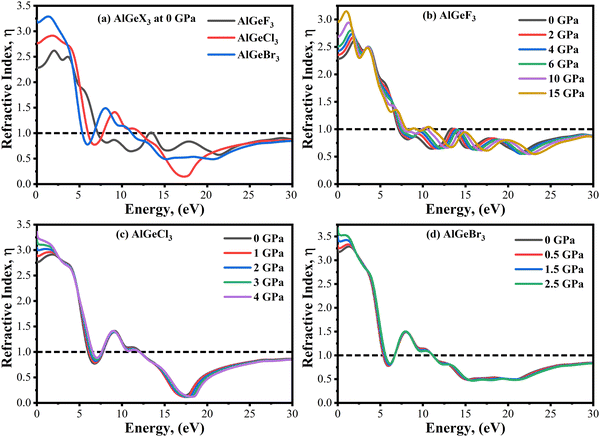 |
| | Fig. 13 Comparison of refractive index without pressure (a) AlGeX3 (X = F, Cl, and Br) and with pressure (b) AlGeF3, (c), AlGeCl3, and (d) AlGeBr3. | |
Mechanical properties
The response of a material to deformation induced by mechanical stress is quantified by elastic constants (Cij). These basic constants define the connection between stress and strain across different crystallographic orientations and are critical in determining a material's mechanical characteristics. These properties are crucial in determining the anisotropic nature, mechanical stability, and bonding characteristics between adjacent atomic planes of a material.49 How a material responds to deformation is greatly aided by the three independent elastic constants in a cubic system: C11, C12, and C44. Elastic constants are calculated using the formulations given in.50C11 is the rigidity of the material in the direction of the applied uniaxial stress, C12 signifies how stresses are coupled, and C44 describes the resistance to shear deformation of a material. Tables S3(a), S4(a), and S5(a) (ESI†) listed pressure-dependent elastic constants (Cij), Cauchy pressures (C12 − C44), and other mechanical properties computed for the compounds AlGeF3, AlGeCl3, and AlGeBr3, respectively. The estimated elastic constants satisfy the Born stability criteria:51C11 > 0; C44 > 0; C11 – C12 > 0, and C11 + 2C12 > 0 even in pressurized conditions. The values of C11 indicate that the compounds have greater resistance to uniaxial compressions compared to shear deformation which further increases under pressure. Also, the values of C12 and C44 exhibit higher resistance to pressure variations compared to C11 as seen in Tables S3(a), S4(a), and S5(a) (ESI†). Pressure-dependent elastic constants are illustrated in Fig. 14, where C11 increases linearly and C12 primarily decreases slightly up to 2 GPa, then increases linearly with applied pressure for AlGeF3 and C44 shows non-linear characteristics throughout the pressure. Almost linear variations are found for C11 and C44 in the case of AlGeCl3 under pressure although C12 shows non-linearity. Further, linear changes of C11, C12, and C44 are observed for AlGeBr3 up to the entire range of applied pressure. The observed behavior can be ascribed to the transverse strain's ability to alter the shape of an object instead of changing its volume as a whole.
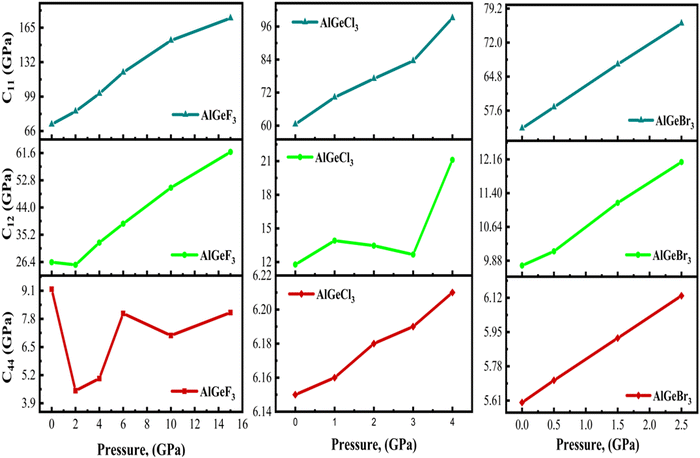 |
| | Fig. 14 Comparison of pressure-dependent elastic constants, C11, C12, and C44 of AlGeX3 (X= F, Cl, and Br). | |
One of the most widely recognized factors used to assess the ductile and brittle characteristics of materials is the Cauchy pressure, expressed by the equation C12 − C44. The AlGeX3 (X= F, Cl, Br) perovskites have positive Cauchy pressure without pressure and it rises with increasing pressure as shown in Tables S3(a), S4(a), and S5(a) (ESI†). This demonstrates ductile character which further improved with increasing pressure. The pressure-dependent Cauchy pressure varies almost linearly for the compounds AlGeF3 and AlGeBr3 as seen in Fig. 16. But the compound AlGeCl3 displays a rising trend up to 1 GPa then a decreasing trend at 3 GPa, and finally it increases linearly from 3 GPa to up to metallic. Among the compounds, AlGeF3 shows the superior ductility. Tables S3(a), S4(a), and S5(a) (ESI†) present the calculated mechanical properties including Young's modulus (E), bulk modulus (B), shear modulus (G), Pugh's ratio (B/G), Poisson's ratio (ν), hardness (HV), and Machinability index (μM) for AlGeX3 (X = F, Cl, Br). To find the B and G, the Voigt–Reuss technique is used. The Voigt and Reuss coefficients stand for the maximum and minimum values of the effective modulus. The Voigt shear modulus (GV) and Voigt bulk modulus (BV) are defined for cubic lattices and are given52 by:
| |  | (4) |
| |  | (5) |
Furthermore, the Reuss shear modulus (GR) and the Reuss bulk modulus (BR) are defined in terms of cubic lattices by the following equations.
| |  | (6) |
| |  | (7) |
The bulk (B) and shear (G) moduli are calculated from the Voigt–Reuss–Hill approximation:53
| |  | (8) |
| |  | (9) |
In addition, Poisson's ratio (υ) and Young's modulus (E) are estimated50 by:
| |  | (10) |
| |  | (11) |
where
B represents the fracture resistance, while
G corresponds to plastic deformation. AlGeF
3 shows higher bulk (
B) and shear modulus (
G) than AlGeCl
3 and AlGeBr
3. This implies that AlGeF
3 exhibits superior resistance to both fracture and plastic deformation than AlGeCl
3 and AlGeBr
3.
Fig. 15 shows the plots of bulk, shear, and Young's moduli as a function of applied pressure. Under the applied pressure,
B increases linearly while
G initially shows a decreasing trend after that increases gradually for AlGeF
3. However, both AlGeCl
3 and AlGeBr
3 show increasing trend linearly under pressure. A higher
E indicates greater stiffness, that is, the material requires more stress to induce a given amount of elastic deformation. The
E and
G show a similar trend for all of the compounds as seen in
Fig. 15. With pressure and without pressure, AlGeF
3 shows higher
E, that is, it has more stiffness than AlGeCl
3 and AlGeBr
3.
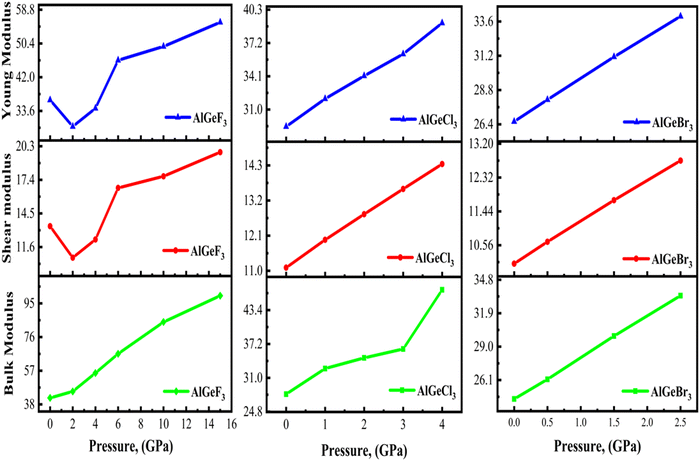 |
| | Fig. 15 Comparison of pressure-dependent Young modulus, shear modulus, and bulk modulus of AlGeX3 (X= F, Cl, and Br). | |
Pugh's ratio (B/G) is utilized to determine the ductile/brittle characteristic of a material. In general, a higher Pugh ratio greater than the critical value of 1.75 indicates better ductility, while a ratio lower than 1.75 suggests increased brittleness.54 Since all the compounds exhibit a Pugh's ratio greater than the critical value at 0 GPa, they are ductile. The pressure-dependent Pugh's ratio of the compounds AlGeX3 (X = F, Cl, and Br) is shown in Fig. 16. Initially, the Pugh's ratio of the compounds increases with increasing pressure. However, it decreases for the compounds AlGeF3 and AlGeCl3 at the pressure of 6 GPa and 3 GPa, respectively, afterward, an increasing trend is observed. In contrast, a linear change in the Pugh's ratio is represented in Fig. 16 for the compound AlGeBr3 with increasing pressure. Further, the compound AlGeF3 exhibits higher ductility among the compounds. The stress-induced deformation of a material can be explained by Poisson's ratio. Material with a higher Poisson's ratio exhibits ductile behavior which signifies plastic deformation and energy absorption before failure. Conversely, the lower ratio displays brittle behavior with limited plasticity and a tendency for sudden failure. Frantsevich and Pugh suggested a critical threshold of Poisson's ratio equal to 0.26 to distinguish between ductile and brittle characteristics.55 Under pressurized and non-pressurized conditions the studied compounds exhibit higher Poisson's ratio indicating their ductile behavior, which was earlier confirmed by Cauchy pressure. Fig. 16 illustrates the pressure-dependent variations of Cauchy pressure, Pugh's ratio, and Poisson's ratio for the compounds.
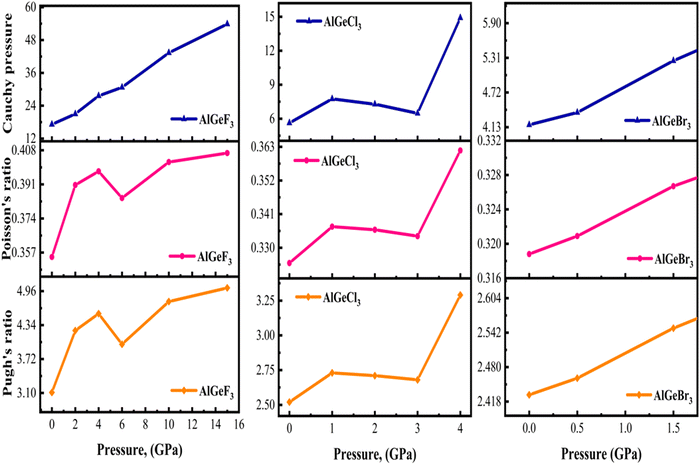 |
| | Fig. 16 Comparison of pressure-dependent Cauchy pressure, Poisson's ratio, and Pugh's ratio of cubic AlGeX3 (X = F, Cl, and Br). | |
The pressure-dependent Hardness (Hv) of the compounds is calculated using Tian's model49
| | | Hv,Tian = 0.92 K1.137G0.708 | (12) |
here,
K =
G/
B. The results are illustrated in
Fig. 17 as a function of pressure. In the case of AlGeF
3 and AlGeCl
3, the
Hv changes with a decreasing-increasing pattern. But for the AlGeBr
3, it increases linearly with increasing pressure.
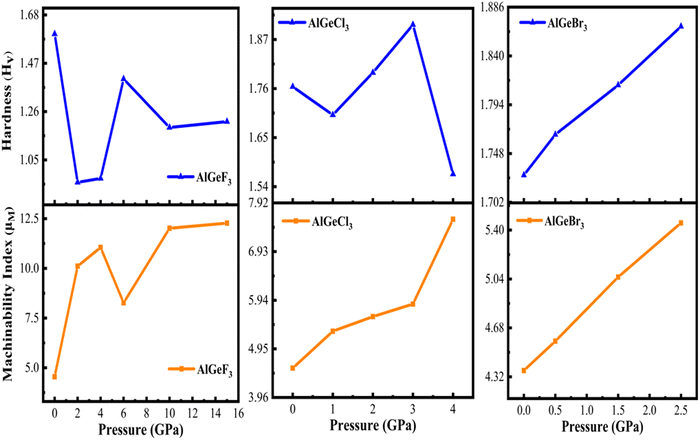 |
| | Fig. 17 Comparison of pressure-dependent hardness and machinability index of AlGeX3 (X = F, Cl, and Br). | |
The machinability index (μM) indicates the material's lubrication and plasticity. The larger the value of μM, the greater the lubrication effectiveness, decreased feed friction, and enhanced plastic strain. The pressure-dependent μM is determined by the following expression:56
| |  | (13) |
The results are presented in Fig. 17 for the compounds AlGeX3 (X = F, Cl, and Br). It is found that the μM increases sharply with increasing pressure up to 2 GPa for AlGeF3, then it decreases up to 6 GPa, and lastly increases up to metallic pressure (14 GPa). However, for the compounds AlGeCl3 and AlGeBr3, the μM increases almost linearly with increasing pressure as seen in Fig. 17.
The anisotropic index is utilized to quantify the material properties having directional dependence. The following equation is used to calculate the three shear anisotropy factors (A1, A2, and A3) for the {100}, {010}, and {001} planes57
| |  | (14) |
A similar expression for the Zener anisotropy factor (A) can be calculated58 by
| |  | (15) |
The elastic anisotropy increases for the compounds AlGeX3 (where X represents F, Cl, Br) with increasing pressure as evidenced in Tables S3(b), S4(b), and S5(b) (ESI†). To capture this anisotropy more straightforwardly, a single anisotropy index is preferred over multiple factors for various crystal planes. Moreover, utilizing by Chung and Buessem's empirical formula determines shear (AG) and bulk (AB) to give the anisotropy59 The calculated values of AB and AG demonstrate that all the compounds exhibit anisotropy in both pressurized and unpressurized conditions. The universal anisotropy factor (AU) can be used for all types of crystal symmetries and its value is zero for isotropic materials.60 The equivalent Zener anisotropy (Aeq) is determined using the empirical formula which is then used to obtain the proper anisotropy of AlGeX3 (X = F, Cl, and Br).58 The estimated pressure-dependent elastic anisotropies are listed in Tables S3(b), S4(b), and S5(c) (ESI†) for AlGeF3, AlGeCl3, and AlGeBr3, respectively. 3D anisotropic contour plots for E, G, and v are presented in Fig. S7–S9 (ESI†) to illustrate the directional dependence of elastic properties in AlGeX3 (X= F, Cl, Br) perovskites. The plots are generated at pressures of 0 and 15 GPa for AlGeF3; 0 and 4 GPa for AlGeCl3; and 0 and 2.5 GPa for AlGeBr3. The anisotropic character of the perovskites is shown by the deviance that is revealed from the spherical form in these contour plots.61 The anisotropies of AlGeX3 (X = F, Cl, Br) halide perovskites increase dramatically when pressure increases from 0 GPa up to metallic, indicating that pressure has a considerable impact on their directional elasticity.
Conclusion
Tuning material properties through hydrostatic pressures is a fascinating avenue of research. This study presents pressure-dependent structural, electronic, optical, and mechanical properties of lead-free AlGeX3 (X = F, Cl, and Br) perovskites. All properties of our investigated compounds can be improved by substituting a halide component at the X sites, which can be further extended by applying hydrostatic pressure. The material's lattice parameters decrease under pressure, leading to more negative formation energies that confirm the thermodynamic stabilities. Besides, these substances exhibit essential mechanical properties like mechanical stability, anisotropy, and ductility which can be improved further by halide substitution as well as applying pressure. Every compound exhibits semiconducting properties and replacing halide (F to Cl, Br) results in an indirect-to-direct band transition, suggesting their applications in optical devices and solar cells. Furthermore, positive hydrostatic pressure causes bandgap narrowing and semiconductor-to-metallic transition. This study confirmed that atoms in the Al-3s, F-2p, Cl-3p, Br-4p, and I-5p orbitals mostly contribute to forming the valence bands, while Al-3p and Ge-4p orbitals are mainly involved in the formation of conduction bands. Moreover, these compounds exhibit greater dielectric constant under relaxed conditions which are further improved under pressurized conditions. By precisely tuning the pressure, the absorption coefficient of these compounds can be improved significantly not only in the visible zones but also in the UV regions, demonstrating their application as solar cells, UV sensors, and UV detectors. In addition, pressures affect almost negligible change in the conductivity except AlGeF3. So, AlGeX3 perovskites (where X = F, Cl, and Br) are promising candidates for use in optoelectronic devices like solar cells, photosensors, and LEDs with their tunable structural, electronic, optical, and mechanical properties under pressure.
Authorship contribution
Md. Amran Sarker: investigation, methodology, data curation and analysis and interpretation, writing the original draft. Md Mehedi Hasan: investigation, methodology, data curation, graph ploting. Md. Rafiqul Islam: investigation, methodology. Md. Rabbi Talukder: investigation, methodology. Md. Rasidul Islam: bandgap calculation by HSE06 functional, investigation, methodology. Ahmed Sharif: resources allocation, supervision, writing – review & editing.
Data availability
The datasets and computer codes are available upon request from the authors.
Conflicts of interest
The authors declare no conflict of interest.
Acknowledgements
The authors express their sincere gratitude to the Central Computer Center, KUET, Bangladesh for providing the high-performance computing resources used in this research. The authors would like to express their gratitude to the Research and Innovation Centre for Science and Engineering (RISE), Bangladesh University of Engineering and Technology (BUET), Dhaka-1000, Bangladesh for funding through the RISE Internal Research Grant (2022-01-001).
References
- Y. Sun, W. Zhang, H. Chi, Y. Liu, C. L. Hou and D. Fang, Renewable Sustainable Energy Rev., 2015, 43, 973–980 CrossRef CAS.
- A. M. Humada, M. Hojabri, S. Mekhilef and H. M. Hamada, Renewable Sustainable Energy Rev., 2016, 56, 494–509 CrossRef.
- P. K. Nayak, S. Mahesh, H. J. Snaith and D. Cahen, Nat. Rev. Mater., 2019, 4, 269–285 CrossRef CAS.
- M. K. Hossain, S. Bhattarai, A. A. Arnab, M. K. A. Mohammed, R. Pandey, M. H. Ali, Md. F. Rahman, Md. R. Islam, D. P. Samajdar, J. Madan, H. Bencherif, D. K. Dwivedi and M. Amami, RSC Adv., 2023, 13, 21044–21062 RSC.
- Md. R. Islam, Y. Wu, K. Liu, Z. Wang, S. Qu and Z. Wang, Adv. Mater. Interfaces, 2022, 9(4), 2101144 CrossRef CAS.
- H. S. Jung and N. Park, Small, 2015, 11, 10–25 CrossRef CAS PubMed.
- S. Yun, Y. Qin, A. R. Uhl, N. Vlachopoulos, M. Yin, D. Li, X. Han and A. Hagfeldt, Energy Environ. Sci., 2018, 11, 476–526 RSC.
- P. P. Boix, K. Nonomura, N. Mathews and S. G. Mhaisalkar, Mater. Today, 2014, 17, 16–23 CrossRef CAS.
- J.-P. Correa-Baena, M. Saliba, T. Buonassisi, M. Grätzel, A. Abate, W. Tress and A. Hagfeldt, Science, 2017, 358, 739–744 CrossRef CAS PubMed.
- I. Hussain, H. P. Tran, J. Jaksik, J. Moore, N. Islam and M. J. Uddin, Emergent Mater., 2018, 1, 133–154 CrossRef CAS.
- M. A. Green, A. Ho-Baillie and H. J. Snaith, Nat. Photonics, 2014, 8, 506–514 CrossRef CAS.
- M. Solayman, M. R. Islam, M. A. Sarker, R. K. Sharme, M. Al Momin, M. R. Islam and A. A. Khan, Phys. Scr., 2023, 98, 125944 CrossRef.
- J. Y. Kim, J.-W. Lee, H. S. Jung, H. Shin and N.-G. Park, Chem. Rev., 2020, 120, 7867–7918 CrossRef CAS PubMed.
- M. K. Hossain, G. F. I. Toki, I. Alam, R. Pandey, D. P. Samajdar, Md. F. Rahman, Md. R. Islam, M. H. K. Rubel, H. Bencherif, J. Madan and M. K. A. Mohammed, New J. Chem., 2023, 47, 4801–4817 RSC.
- M. R. Islam, A. S. M. J. Islam, S. K. Mitro, M. R. Hasan Mojumder, B. K. Moghal, S. Ahmad, S. Roy and M. Z. Islam, J. Phys. Chem. Solids, 2022, 170, 110919 CrossRef CAS.
- J. S. Manser, M. I. Saidaminov, J. A. Christians, O. M. Bakr and P. V. Kamat, Acc. Chem. Res., 2016, 49, 330–338 CrossRef CAS PubMed.
- U.-G. Jong, C.-J. Yu, G.-C. Ri, A. P. McMahon, N. M. Harrison, P. R. F. Barnes and A. Walsh, J. Mater. Chem. A, 2018, 6, 1067–1074 RSC.
- R. Ali, Z.-G. Zhu, Q.-B. Yan, Q.-R. Zheng, G. Su, A. Laref, C. S. Saraj and C. Guo, ACS Appl. Mater. Interfaces, 2020, 12, 49636–49647 CrossRef CAS PubMed.
- M. K. Hossain, G. F. I. Toki, A. Kuddus, M. H. K. Rubel, M. M. Hossain, H. Bencherif, Md. F. Rahman, Md. R. Islam and M. Mushtaq, Sci. Rep., 2023, 13, 2521 CrossRef CAS PubMed.
- W. S. Yang, J. H. Noh, N. J. Jeon, Y. C. Kim, S. Ryu, J. Seo and S. Il Seok, Science, 1979, 2015(348), 1234–1237 Search PubMed.
- M. K. Hossain, G. F. I. Toki, D. P. Samajdar, M. Mushtaq, M. H. K. Rubel, R. Pandey, J. Madan, M. K. A. Mohammed, Md. R. Islam, Md. F. Rahman and H. Bencherif, ACS Omega, 2023, 8, 22466–22485 CrossRef CAS PubMed.
- Md. A. Sarker, M. M. Hasan, Md Al Momin, A. Irfan, Md. R. Islam and A. Sharif, RSC Adv., 2024, 14, 9805–9818 RSC.
- Md. R. Islam, Md. R. H. Mojumder, R. Moshwan, A. S. M. J. Islam, M. A. Islam, Md. S. Rahman and Md. H. Kabir, ECS J. Solid State Sci. Technol., 2022, 11, 033001 CrossRef CAS.
- T. Ye, X. Wang, K. Wang, S. Ma, D. Yang, Y. Hou, J. Yoon, K. Wang and S. Priya, ACS Energy Lett., 2021, 1480–1489 CrossRef CAS.
- S. Guo, Y. Zhao, K. Bu, Y. Fu, H. Luo, M. Chen, M. P. Hautzinger, Y. Wang, S. Jin, W. Yang and X. Lü, Angew. Chem., 2020, 132, 17686–17692 CrossRef.
- Md Solayman, Md. A. Sarker, M. Muntasir, R. K. Sharme and Md. R. Islam, Opt. Mater., 2024, 148, 114699 CrossRef CAS.
- Md. F. Rahman, Md. A. I. Islam, Md. R. Islam, Md. H. Ali, P. Barman, Md. A. Rahman, Md Harun-Or-Rashid, M. Hasan and M. K. Hossain, Nano Select, 2023, 4, 632–645 CrossRef CAS.
- L.-K. Gao, Y.-L. Tang and X.-F. Diao, Appl. Sci., 2020, 10, 5055 CrossRef CAS.
- S. K. Mitro, M. Saiduzzaman, T. I. Asif and K. M. Hossain, J. Mater. Sci.: Mater. Electron., 2022, 33, 13860–13875 CrossRef CAS.
- Md. M. Hasan, Md. A. Sarker, M. B. Mansur, Md. R. Islam and S. Ahmad, Heliyon, 2024, 10, e34824 CrossRef CAS PubMed.
- Md. A. Sarker, M. Muntasir, Md Al Momin, Md Solayman and Md. R. Islam, Adv. Theory Simul., 2024, 7(7), 2400112 CrossRef CAS.
- G. Xiang, Y. Wu, M. Zhang, J. Leng, C. Cheng and H. Ma, Phys. Chem. Chem. Phys., 2022, 24, 5448–5454 RSC.
- Md. M. Hasan, Md. A. Sarker, Md. R. Islam and Md. R. Islam, ACS Omega, 2024, 9, 35301–35312 CrossRef CAS PubMed.
- S. J. Clark, M. D. Segall, C. J. Pickard, P. J. Hasnip, M. I. J. Probert, K. Refson and M. C. Payne, Z. Kristallogr. - Cryst. Mater., 2005, 220, 567–570 CrossRef CAS.
- W. Kohn, Phys. Rev.
Lett., 1996, 76, 3168–3171 CrossRef CAS PubMed.
- J. P. Perdew, K. Burke and M. Ernzerhof, Phys. Rev. Lett., 1996, 77, 3865–3868 CrossRef CAS PubMed.
- D. Vanderbilt, Phys. Rev. B: Condens. Matter Mater. Phys., 1990, 41, 7892–7895 CrossRef PubMed.
- T. H. Fischer and J. Almlof, J. Phys. Chem., 1992, 96, 9768–9774 CrossRef CAS.
- H. J. Monkhorst and J. D. Pack, Phys. Rev. B: Solid State, 1976, 13, 5188–5192 CrossRef.
- J. Kang, E.-C. Lee and K. J. Chang, Phys. Rev. B: Condens. Matter Mater. Phys., 2003, 68, 054106 CrossRef.
- F. D. Murnaghan, Proc. Natl. Acad. Sci. U. S. A., 1944, 30, 244–247 CrossRef CAS PubMed.
- M. Aktary, M. Kamruzzaman and R. Afrose, Mater. Adv., 2023, 4, 4494–4508 RSC.
- Md. F. Rahman, Md. H. Rahman, Md. R. Islam, M. K. Hossain, A. Ghosh, Md. S. Islam, Md. M. Islam, Md Harun-Or-Rashid, H. Albalawi and Q. Mahmood, J. Mater. Sci., 2023, 58, 13100–13117 CrossRef CAS.
- K. Heidrich, W. Schäfer, M. Schreiber, J. Söchtig, G. Trendel, J. Treusch, T. Grandke and H. J. Stolz, Phys. Rev. B: Condens. Matter Mater. Phys., 1981, 24, 5642–5649 CrossRef CAS.
- Md. R. Islam, A. A. M. Mazumder, Md. R. H. Mojumder, A. S. M. Z. Shifat and M. K. Hossain, Jpn. J. Appl. Phys., 2023, 62, 011002 CrossRef.
- M. R. Islam, B. K. Moghal and R. Moshwan, Phys. Scr., 2022, 97, 065704 CrossRef CAS.
- Md. R. Islam, A. S. M. J. Islam, K. Liu, Z. Wang, S. Qu, C. Zhao, X. Wang and Z. Wang, Phys. B, 2022, 638, 413960 CrossRef CAS.
- A. Ghosh, Md. F. Rahman, Md. R. Islam, Md. S. Islam, M. Khalid Hossain, S. Bhattarai, R. Pandey, J. Madan, Md. A. Rahman and A. B. Md. Ismail, Opt. Continuum, 2023, 2, 2144 CrossRef CAS.
- Q.-Q. Liang, D.-Y. Hu, T.-Y. Tang, H.-X. Gao, S.-Q. Wu, L. Li and Y.-L. Tang, J. Mater. Res. Technol., 2023, 22, 3245–3254 CrossRef CAS.
- M. J. Mehl, Phys. Rev. B: Condens. Matter Mater. Phys., 1993, 47, 2493–2500 CrossRef CAS PubMed.
- F. Mouhat and F.-X. Coudert, Phys. Rev. B: Condens. Matter Mater. Phys., 2014, 90, 224104 CrossRef.
- M. I. Naher and S. H. Naqib, J. Alloys Compd., 2020, 829, 154509 CrossRef CAS.
- R. Hill, Proc. Phys. Soc., London, Sect. A, 1952, 65, 349–354 CrossRef.
- S. F. Pugh, Lond. Edinb. Dubl. Phil. Mag. J. Sci., 1954, 45, 823–843 CrossRef CAS.
- R. L. Fleischer, R. S. Gilmore and R. J. Zabala, Acta Metall., 1989, 37, 2801–2803 CrossRef CAS.
- M. Al-Fahdi, A. Rodriguez, T. Ouyang and M. Hu, Crystals, 2021, 11, 783 CrossRef CAS.
- X. Gao, Y. Jiang, R. Zhou and J. Feng, J. Alloys Compd., 2014, 587, 819–826 CrossRef CAS.
- C. M. Zener and S. Siegel, J. Phys. Colloid Chem., 1949, 53, 1468 CrossRef.
- R. K. Sharme, M. R. Islam, M. A. Sarker, M. Solayman, M. Al Momin and M. R. Islam, Phys. B, 2024, 415785 CrossRef CAS.
- S. I. Ranganathan and M. Ostoja-Starzewski, Phys. Rev. Lett., 2008, 101, 055504 CrossRef PubMed.
- A. Biswas, Md. S. Alam, A. Sultana, T. Ahmed, M. Saiduzzaman and K. M. Hossain, Appl. Phys. A, 2021, 127, 939 CrossRef CAS.
Footnote |
| † Electronic supplementary information (ESI) available: Fig. S1 Band structure of AlGeF3 under hydrostatic pressure. Fig. S2 Band structure of AlGeCl3 under hydrostatic pressure. Fig. S3 Band structure of AlGeBr3 under hydrostatic pressure. Fig. S4 The calculated TDOS and PDOS of cubic AlGeF3 perovskites under pressure. Fig. S5 The calculated TDOS and PDOS of cubic AlGeCl3 perovskites under pressures. Fig. S6 The calculated TDOS and PDOS of cubic AlGeBr3 perovskites under pressures. Fig. S7 Anisotropic 3D representation of Young's modulus, shear modulus, and Poisson's ratio of AlGeF3 at different pressures. Fig. S8 Anisotropic 3D representation of Young's modulus, shear modulus, and Poisson's ratio of AlGeCl3 at different pressures. Fig. S9 Anisotropic 3D representation of Young's modulus, shear modulus, and Poisson's ratio of AlGeBr3 at different pressure. Table S1: The calculated lattice parameters (a), cell volume (V), formation energy (ΔHf), and band gap (Eg) of AlGeX3 (X = F, Cl, and Br) at different pressures. Table S2: variation in bond length of cubic AlGeX3 (X = F, Cl, and Br) at different pressure. Table S3 (a): the calculated elastic constants, bulk modulus (B), shear modulus (G), Young's modulus (E), Pugh's ration, Poisson's ratio (υ), hardness (Hv), and machinability index (μM) of AlGeF3 under hydrostatic pressure. (b): changes in anisotropy of cubic AlGeF3 under hydrostatic pressure. Table S4 (a): the calculated elastic constants, bulk modulus (B), shear modulus (G), Young's modulus (E), Pugh's ration, Poisson's ratio (υ), hardness (Hv), and machinability index (μM) of AlGeCl3 under hydrostatic pressure. (b): changes in anisotropy of cubic AlGeCl3 under hydrostatic pressure. Table S5 (a): the calculated elastic constants, bulk modulus (B), shear modulus (G), Young's modulus (E), Pugh's ration, Poisson's ratio (υ), hardness (Hv), and machinability index (μM) of AlGeBr3 under hydrostatic pressure. (b): changes in anisotropy of cubic AlGeBr3 under hydrostatic pressure. See DOI: https://doi.org/10.1039/d4ma00611a |
|
| This journal is © The Royal Society of Chemistry 2024 |
Click here to see how this site uses Cookies. View our privacy policy here.  Open Access Article
 ab,
Md. Mehedi
Hasan
 b,
Md. Rafiqul
Islam
c,
Md. Rabbi
Talukder
 b,
Md. Rasidul
Islam
 d and
Ahmed
Sharif
 *a
*a


