 Open Access Article
Thermoelectric properties of YbZn11−xAlx†
Shuai
Li
a,
Ruhul
Quddus
b,
Sree Sourav
Das
 b,
Haobo
Wang
a,
Jerrold A.
Floro
a and
Mona
Zebarjadi
 *ab
*ab
aDepartment of Materials Science and Engineering, University of Virginia, Charlottesville, VA 22904, USA. E-mail: m.zebarjadi@virginia.edu
bElectrical and Computer Engineering Department, University of Virginia, Charlottesville, VA 22904, USA
First published on 9th September 2024
Abstract
Metallic thermoelectric materials with a high thermoelectric power factor and high thermal conductivity are favorable for transient dynamic active thermal management of microelectronics. Among these, several ytterbium intermetallic compounds demonstrate sharp peaks in their density of states due to contributions from ytterbium f-orbitals. YbZn11 is one of these compounds with a Gaussian-like density of states close to its Fermi level, an advantageous shape to achieve a high thermoelectric power factor. If the Fermi-level can be adjusted, high Seebeck coefficient values are expected following the Wiedemann–Franz law. Here we present YbZn11, a rarely made and studied sample, and for the first time, we report its thermoelectric and transport properties. Band structure calculations confirm the Gaussian function shape of the density of states. However, Seebeck calculations show that the Fermi level is not well positioned and ideally should be shifted by 200 meV. Al substitution for Zn (YbZn11−xAlx) and Zn-deficiency (YbZn11−x) are applied to modify the band structure and to shift the Fermi level to adjust the Seebeck coefficient.
1. Introduction
State-of-the-art electronics featuring high-power chips pack gigahertz transistors in an extremely dense manner. The substantial heat accumulated in such a small area presents new challenges for thermal management.1–3 The concept of the thermoelectric (TE) active cooling mode provides innovative approaches for active heat management.4,5 Unlike traditional thermoelectric modes with the Seebeck voltage (Peltier current) working against the temperature gradient, in the active cooling mode, the natural heat conduction from the hot source to the heat sink is enhanced by the Peltier current. The Peltier current, driven by the electric current, propels carriers along the temperature gradient, augmenting the passive transport of electrons and phonons. The TE module functions as an active heat sink. The effective thermal conductivity of this active heat sink under optimal current conditions is expressed as , where TH is the hot source temperature, ΔT is the temperature difference between the hot source and the heat sink, κ is the passive thermal conductivity, σ is the electrical conductivity, and S is the Seebeck coefficient.5 Hence to maximize the effective thermal conductivity, materials with high TE power factors (σS2) and high passive thermal conductivity values (κ) are needed.
Metals are great candidates for this application due to their inherently high electrical and thermal conductivity. Their only drawback is their low Seebeck coefficient. Hence, one can search for metals with high Seebeck coefficients to satisfy all criteria needed for successful active cooling. Pure metallic elements such as cobalt and nickel are shown to have a relatively high Seebeck coefficient. Various mechanisms can improve the Seebeck coefficient in metals. For instance, in the case of cobalt, the higher Seebeck coefficient is attributed to the magnon-drag effect.4 In CePd3 the electron correlation effect results in a Seebeck coefficient of more than 115 μV K−1 at 150 K.4 The Kondo resonance caused by the interaction of Yb 4f-orbital electrons and conduction bands gives YbAl3 a Seebeck coefficient of −90 μV K−1 below room temperature.6 The Cu–Ni alloy, also known as constantan, shows an improved Seebeck coefficient of −45.7 μV K−1 at room temperature and −72.5 μV K−1 at 873 K due to the scattering of low-energy carriers by nano-twin boundaries.7 A further study explored the possibility of additive manufacturing of the Cu–Ni alloy using industrial-level powders.8 An even higher Seebeck of 94 μV K−1 is achieved in the Ni–Au alloy at 1000 K, which is attributed to the interband scattering between s and d-orbital electrons.9
In metals, the Mott formula10 relates the Seebeck coefficient to the slope of the density of states (DOS) at the Fermi level. For metals, therefore, a sharp peak of the DOS near the Fermi level indicates the potential of a high Seebeck coefficient.11–14 Some of the Yb-based intermetallic compounds show such features according to first-principles calculations. A good example is YbAl3 which has a sharply peaked DOS due to the f-orbitals and as a result has a record high thermoelectric power factor.15 YbZn11 is another candidate in this class of materials. Since its crystal structure was first reported in 1966,16 YbZn11 has received little attention. Apart from a few studies that mention it while exploring the phase space of related systems,17,18 the only paper discussing its inter-band interaction dates to 1998.19 Moreover, the thermoelectric properties of YbZn11 have never been thoroughly examined or reported.
The expected sharp peaks in the DOS of several intermetallic Yb-based compounds are confirmed by band structure calculations from the Topological Materials Database20–23.13,15 Similarly, in YbZn11, a sharp peak of DOS near the Fermi level is shown in the topological materials database which in principle should result in a high Seebeck coefficient as evidenced by the Mott equation. However, this material is rarely studied, and its thermoelectric properties have never been reported. To assess the guidance provided by computational results and investigate the unreported thermoelectric properties of the materials, we synthesized YbZn11. Here, we report structural characterization and assessment of defects, followed by intrinsic thermoelectric properties. Finally, we explore avenues to enhance the thermoelectric performance using doping.
2. Methods
2.1 Experimental methods
Sublimed Yb pieces with 99.9% purity and 99.999% zinc shot were mixed to the stoichiometry of YbZn11. The mixed pure metals were loaded into a fused quartz glass tube. The tube was evacuated and backfilled with argon three times, and then sealed. The sealed ampoule was heated up to 890 °C to melt the metal for 16 hours, and then kept at 760 °C for 16 hours. After cooling down the ingot is ground into powder with a mortar and pestle. Ball-milling was not attempted due to the reactive nature of ytterbium. X-ray diffraction (XRD) was performed on powders and hot-pressed samples to confirm the formation of the compound. Al was used to substitute Zn to adjust the Fermi level. 99.999% aluminium powder and wires were added according to stoichiometry. The intrinsic and YbZn10.7Al0.3 samples were annealed at 650 °C in a sealed tube for 24 hours, to improve the Al distribution and substitution. For each sample around 2.5 grams of the product powder was loaded in a graphite die, with graphite paper covering the inner wall and the interface between the powder and the pushing rod to prevent sticking. The powders were then hot-pressed at 650 °C under 56 MPa pressure for 300 seconds using an OTF-1700X-RHP4 hot-press setup from MTI Corporation. The hot press chamber was filled with argon gas during the process. A disc-shaped solid sample with a diameter of 12.7 mm was obtained after polishing the hot-pressed ingot. The disc-shaped sample was then cut using a Mager BR220 precision cut-off saw into bar-shaped samples with approximately 2 mm × 2 mm × 10 mm dimensions. Transport performance is determined using the quantum design PPMS Versalab. XRD characterization is performed using an Empyrean X-ray diffractometer from Malvern-Panalytical on a pressed disc sample. Imaging is performed on an FEI Quanta 650 scanning electron microscope (SEM).2.2 Computational methods
YbZn11 crystallizes in a tetragonal I41/amd space group with 2 Yb and 22 Zn atoms in the unit cell. The lattice parameters were nominally a = b = 10.66 Å and c = 6.383 Å from the topological materials database.1 First-principles calculations were performed using density functional theory (DFT) as implemented in the QUANTUM ESPRESSO package.24 We used Perdew–Burke–Ernzerhof generalized gradient approximation (PBEsol)25 pseudopotential for zinc (Zn) and Wentzcovitch (PAW) pseudopotential26 for ytterbium (Yb). Scalar relativistic pseudopotentials were used throughout the calculation as we found no spin–orbit coupling (SOC) effects on the electronic band structure as shown in the ESI,† Fig. S2. The electronic structure calculation employed a kinetic energy cutoff of 60 Ry with a charge density cutoff of 320 Ry and a Monkhorst–Pack k-point mesh of 8 × 6 × 6. The atomic positions were relaxed through the Broyden–Fletcher–Goldfarb–Shanno (BFGS) algorithm. The convergence threshold of energy was set to 4.8 × 10⁻⁹ Ry in the self-consistent calculation. A Gaussian smearing value of 0.01 Ry was chosen during the calculations. Finally, the Seebeck coefficient was evaluated using the BoltzTraP package.27 BoltzTraP solves the Boltzmann transport equations (BTE) under constant relaxation time approximation.27 Within the constant relaxation-time approximation, the Seebeck coefficient can be obtained directly from the electronic structure without any adjustable parameters, and it is expressed in the following equation: | (1) |
3. Results and discussion
3.1 Material characterization
Many samples were prepared including intrinsic YbZn11, Al-doped ones (YbZn11−xAlx), and Zn-deficient ones (YbZn11−x).The XRD results of three representative samples are shown in Fig. 1. Note that in the patterns of YbZn11 and YbZn10.7Al0.3, two minor peaks of graphite and Yb2O3 can be identified. The graphite peak comes from the residue of graphite paper during the hot pressing process and only exists at the surface. The residue can stay in small cavities during the polishing process. The oxide peaks may result from residual oxygen in the sealing process. All the relevant samples show excellent correspondence between the XRD pattern of the synthesized material and the standard diffraction pattern of YbZn11 and the impurities only appear in a small volume fraction as indicated by the few identifiable minor peaks in XRD.
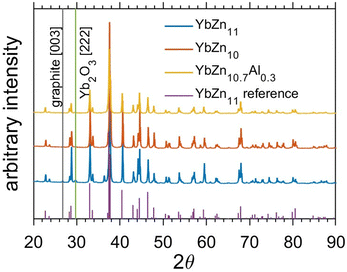 | ||
| Fig. 1 XRD results of Yb–Zn samples, the annealed intrinsic YbZn11 sample in blue, the Zn-deficient sample YbZn10 sample in orange, and the Al-substitution sample YbZn10.7Al0.3 in yellow, and the reference peaks in purple.28 Minor impurity peaks from graphite and ytterbium oxide are marked by black and green lines. | ||
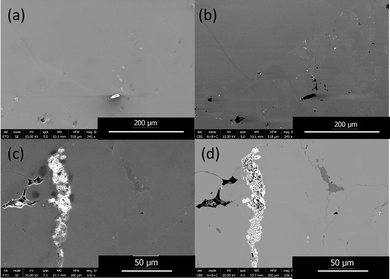
SEM micrographs of the YbZn11 sample in Fig. 2 show the typical defects in these Yb–Zn intrinsic samples. Fig. 2(a) and (b) show the secondary electron (SE) image and back-scattered electron (BSE) image of the YbZn11 sample with a scale bar of 200 μm. YbZn11, shown as the extended light grey area in the BSE image, constitutes the majority of material corresponding well with the XRD results. With higher magnification (Fig. 2(c) and (d), SE, and BSE respectively), the impurities in the microstructure can be identified. Typical defects are pores (black), Yb-rich (white), and Zn-rich (dark grey).
The samples are sintered from hand-milled powders. The intrinsic limitation of this sintering process results in minor retained porosity, as shown in the BSE images. This observation is confirmed by the SE image, which illustrates the morphology. The mass density of the YbZn11 sample is measured to be 98% of the theoretical density indicating the presence of some pores. Small Yb pieces that remained un-melted during the melting process or precipitated after cooling oxidized post-process, exhibiting higher brightness in the SE image due to the charging effect and in the BSE image owing to their higher relative mass.
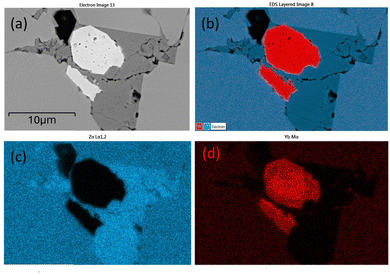
In the EDS mapping mode, the distribution of the elements can be demonstrated clearly as shown in Fig. 3. All three types of defects: cavity (pores), Yb-rich, and Zn-rich phases are shown in one site. In Fig. 3(b), Yb-rich, Zn-rich, and pure YbZn11 phases are identified by the red, dark blue, and blue areas, respectively. Fig. 3(c) and (d) show that the defects are caused by unreacted Yb and Zn. The dark grey area in Fig. 3(a) shows a higher Zn concentration as confirmed in Fig. 3(c) and near-zero Yb concentration as confirmed in Fig. 3(d), indicating the existence of the Zn-rich phase. Similarly, the white area in Fig. 3(a) seems to predominantly contain Yb with almost no Zn. Here we postulate that these small defects are ytterbium oxide considering the reactivity of Yb, Yb2O3 peaks in XRD, and the charging effect of this kind of defect under the electron beam. Further EDS line scan on the same site crossing all separate phases as shown in Fig. 4 confirms the weight percentage of Yb and Zn in these phases. The main matrix shows the correct weight percentage of Yb and Zn for YbZn11, combined with XRD results and EBSD results in the ESI;† the major matrix is confirmed to be YbZn11.
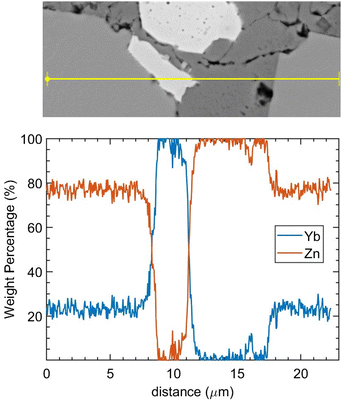 | ||
| Fig. 4 EDS line scan on the defect site. The scanning line goes through the YbZn11 matrix, Yb oxides (white), Zn-rich phase (dark grey), and YbZn11. | ||
Combining XRD and SEM results, micron-sized oxides with extremely small volume fraction primarily appear in cavities. Considering the extended grain size of the YbZn11 crystals (Fig. S1, ESI†), we believe that the scattered oxide impurities should not significantly affect the overall transport properties or the overall thermoelectric performance of macroscopic samples.
3.2 Band structure calculations
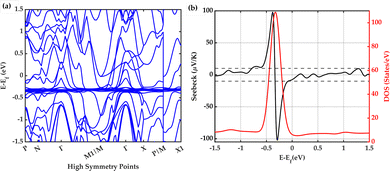
The electronic band structure and electronic density of states (DOS) calculated for intrinsic YbZn11 are shown in Fig. 5. The band structure is shown in Fig. 5(a) along high symmetry direction P(0.25,0.25,0.25)–N(0,0.50,0)–Γ(0,0,0)–M1/M(−0.50,0.50,0.50)–Γ–X(0,0,0.50)–P/M(0.50,0.50,0.50)–X1(0,1.00,0.50). The obtained DFT band structure and the DOS are in good agreement with previous calculations shown in the topological materials database.23 The density of states has a smeared delta-function (Gaussian) shape centred approximately 322 meV below the Fermi level. This is an ideal band structure shape for a thermoelectric material as was discussed by Mahan and Sofo.29 However, the Fermi level ideally should be within a few kBT from the peak point where the slope of the DOS with respect to energy is maximum.The Seebeck coefficient at room temperature (300 Kelvin) and the DOS are shown together in Fig. 5(b). The Mott formula for the thermoelectric power S for metals is defined in the following equation:
 | (2) |
For example, Fig. 6 demonstrates that upon doping with Al, we can shift the peak in the DOS to lower energies. Specifically, upon 4.5% Al doping, the peak is 371 meV below the Fermi level, which is 49 meV further away from the Fermi level compared to the intrinsic case. On the other hand, upon inclusion of zinc deficiency, we can move the peak toward the higher energies and closer to the Fermi level. Including 4.5% zinc vacancy shifts the peak to approximately −286 meV, bringing it closer to the Fermi level compared to the intrinsic case by 36 meV. In terms of the changes in the Seebeck coefficient, these two doping strategies should show opposite trends which we can confirm experimentally as will be discussed later. However, the predicted changes are not significant enough to increase the Seebeck coefficient significantly. To achieve a high Seebeck coefficient, the Fermi level must be shifted ideally to 202 meV below the intrinsic Fermi level where the slope of the DOS is the largest. There may be other promising transition metals that could serve as dopants to fine-tune the Fermi level. Further research is necessary to optimally adjust the Fermi-level position, which will be the focus of future studies.
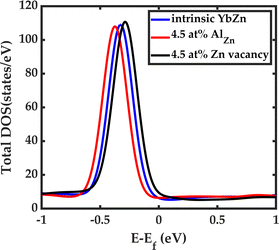 | ||
| Fig. 6 Effect of Al doping and Zn deficiency on the density of states. Al doping shifts the DOS to lower energy levels while the Zn vacancy moves the DOS to higher energy levels. | ||
3.3 Performance
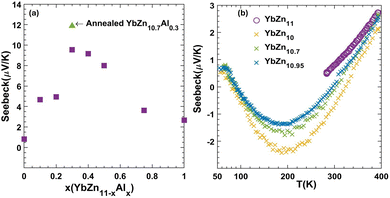
As discussed in the theoretical section, intrinsic YbZ11 is expected to have a low Seebeck coefficient. The room temperature value measured for intrinsic YbZn11 is only 1 μV K−1. Therefore, we attempted to tune the Fermi level via doping. We note that due to the errors in theoretical calculations for small Seebeck values and the presence of defects in experimental samples, a direct quantitative comparison of theory and experiment is not possible, and we can only use theory to predict trends.In Fig. 7, the trend of measured room temperature Seebeck versus Al composition x (YbZn11−xAlx) is demonstrated. The addition of a small amount of Al improves the Seebeck of YbZn11−xAlx, peaking at YbZn10.7Al0.3. A further increase in the Al amount reduces the Seebeck coefficient. The low performance of samples with x higher than 0.3 could be attributed to the formation of other Yb–Al compounds due to limited solubility of Al in YbZn11. However, due to their low concentration, they are not identified in the XRD analysis. The Seebeck value peaks at x = 0.3, reaching 9.54 μV K−1 at 300 K. After annealing, the Seebeck further increased by 24.4% to 11.87 μV K−1, which should be attributed to improved distribution and dissolution of Al in Yb–Zn. Further high-temperature measurements after annealing are reported in the ESI,† Fig. S3, indicating further small improvements in the Seebeck coefficient.
Fig. 8 summarizes the trends of the transport properties, including the Seebeck coefficient, electrical resistivity, and thermal conductivity as a function of temperature from 50 to 400 K for Al-doped samples. The uncertainty on the Seebeck coefficient is less than 15% and for resistivity, it is less than 10%. These values are estimated by repeating the measurements under different thermal history conditions and are detailed in the ESI.† As temperatures increase, the Seebeck coefficient and resistivity both increase, a common trend in all samples studied here and in general in the thermoelectric field. The increasing Seebeck coefficient can be explained by the Mott equation of metals (eqn (2)). Assuming no change in the slope of DOS with temperature, Seebeck should increase linearly with temperature. However, the relation is not exactly linear as the Fermi level position changes slightly with temperature. The increase in the resistivity can be explained by the increasing scattering between electrons and phonons at elevated temperatures. Finally, the thermal conductivity is dominated by the electronic contribution and follows the Wiedemann–Franz law closely. At room temperature, the electronic contribution of the thermal conductivity is 93% for the YbZn11 sample and 88% for YbZn10.7Al0.3. Details of lattice thermal conductivity calculations and relevant plots are presented in the ESI.†
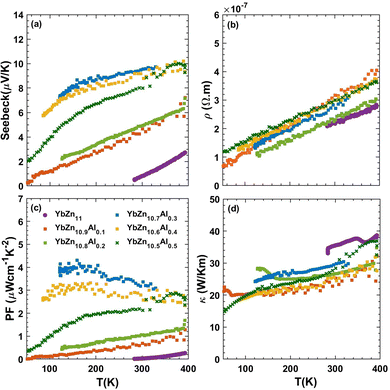 | ||
| Fig. 8 (a) Seebeck coefficient, (b) resistivity, (c) power factor, and (d) thermal conductivity of YbZn11−xAlx samples (x = 0, 0.1, 0.2, 0.3, 0.3, 0.4, 0.5) versus temperature from 70–400 K. | ||
The addition of the optimal amount of Al (x = 0.3–0.5) altered the trend of the Seebeck coefficient versus temperature, particularly in the lower temperature range, resulting in a significant increase in the Seebeck coefficient. This increase is the primary reason for the enhanced power factor. The resistivities of all YbZn11−xAlx samples closely resemble that of intrinsic YbZn11, indicating only minor increases in scattering rates at low Al compositions. Further increasing the Al composition surpasses the solubility limit, and leads to different reactions during the melting process, resulting in the appearance of multiple crystalline oxides that increase the resistivity while the thermal conductivity remains close to intrinsic YbZn11. More details are included in the ESI† (Fig. S8 and S9). The thermoelectric power factor of YbZn11−xAlx (x = 0.3,0.4) peaks at around 100 K to 4 μW cm−1 K−2 due to the decreased resistivity at low temperatures and the sharp increase of the Seebeck coefficient.
Other ways of altering the YbZn11 system such as non-stoichiometric composition YbZn10.9 and Ag and Sn substitution YbZn10.9Sn0.1 have been tried. All show improvements but do not exceed the YbZn10.7Al0.3 sample. Zn-deficient samples YbZn11−x with x = 0.05, 0.3, 1 were prepared using the same methods as those of intrinsic and Al-substitution samples. As shown in Fig. 7b, the introduction of Zn deficiency results in more negative Seebeck coefficient values. This is the opposite of what was observed with Al doping and is consistent with our theoretical results discussed in Section 3.2. Since Al-doping results in a shift of the DOS delta function to lower energy values and Zn-efficiency does the reverse (see Fig. 6), an opposite trend in the Seebeck coefficient is expected using these two doping strategies. While we can predict some trends using the first-principles approach, we acknowledge that a direct comparison between theory and experiment is not possible due to several factors. First, the as-grown YbZn11 in the experiment is different from the ideal intrinsic YbZn11 used in modelling, and the exact position of the Fermi level is unknown due to inherent low dimensional defects that are evenly distributed in the YbZn11 crystal grains such as vacancies, substitutional impurities, and interstitials. As shown in the ESI,† changes in the inherent atomic-level defects/impurities results in changes in the DOS which alters the Seebeck coefficient at a given chemical potential. Second, first-principles data generated have an error bar due to errors in band structure calculations and the constant relaxation time approximation used. As seen in Fig. 8(a), the Seebeck coefficient does not show a linear trend with respect to temperature for many of the samples. This nonlinear trend can be attributed to temperature-dependent relaxation times as well as minor changes in the chemical potential with temperature and is discussed further in the ESI.† While we do not have a good way to estimate this error, the error in Seebeck calculations should be on the order of 10 μV K−1 and therefore small Seebeck values as highlighted in the dashed-line region of Fig. 5(b) are close to the noise level of Seebeck calculations.
In the case of Zn deficiency, the value of the Seebeck coefficient is maximum at around 200 K, but its value remains small. The vacancies lowered both thermal and electrical conductivity slightly and, combined with low Seebeck values, did not result in improvements higher than that in the case of Al-doping. At x = 1 deficiency the hot-pressed sample shows a large level of cavities and poor sintering. Hence, Al-doping is identified as a better solution compared to the Zn-deficiency method. Similarly, Ag doping (not presented here) made the Seebeck coefficient more negative; however, Ag solubility is not good enough to significantly affect the Seebeck values toward high negative values.
Conclusions
YbZn11-based samples were synthesized and confirmed using XRD and SEM methods. Small pores, Yb2O3, and zinc-rich defects were identified in the samples. The thermoelectric properties are reported for the first time. All samples have low resistivity confirming the metallic nature of the samples. The thermal conductivity of the samples is dominated by the electronic contribution as expected for metals with the intrinsic sample having a thermal conductivity of 35 Wm K−1 at room temperature which further increasing with temperature. The downside of these samples is their low Seebeck coefficient values. Efforts to improve the Seebeck coefficient by Al substitution are conducted and resulted in improved Seebeck by an order of magnitude without sacrificing the electrical or thermal conductivity. However, the thermoelectric power factor remains modest with a peak value of 4 μW cm−1 K−2 at 100 K. First-principles calculations identified a Gaussian-shape DOS ideal for the thermoelectric power factor in YbZn11. However, the Fermi level is not ideally positioned with respect to this Gaussian function and needs to be adjusted for high performance. The limited solubility of Al, Sn, and Ag prevented further adjustments to the Fermi level. Similarly, zinc-deficiency tuning of the Fermi level is limited and does not allow for adjusting the Fermi level far enough to verify the existence of the DOS peak and, therefore, the high performance. Further studies of other dopants and alloying are needed to adjust the Fermi level to increase the Seebeck coefficient.Author contributions
SL: conceptualization, data curation, formal analysis, investigation, methodology, visualization, writing – original manuscript. RQ and SSD: simulation, validation, writing – original manuscript. HW: data curation, formal analysis. JF: methodology, supervision, writing – review & editing, MZ: conceptualization, funding acquisition, project administration, supervision, and writing – review & editing.Data availability
Data for this article, including raw experimental measurements, are available at YbZn11 thermoelectric transport properties at https://doi.org/10.18130/V3/QOPZXU.Conflicts of interest
There are no conflicts to declare.Acknowledgements
RQ and SSD would like to acknowledge the Rivanna cluster of UVA used for the computational part. We acknowledge Xin Shi and Zhifeng Ren of the University of Houston for their help in verifying our results and for the high-temperature measurements presented in the ESI.† We acknowledge the Nanoscale Materials Characterization Facility (NMCF) at UVA for providing SEM and XRD facilities. This work is supported by NSF grant number 2230352.Notes and references
- Z. Zhang, X. Wang and Y. Yan, e-Prime - Advances in Electrical Engineering, Electron. Energy, 2021, 1, 100009 Search PubMed.
- S. M. Sohel Murshed and C. A. Nieto de Castro, Renewable Sustainable Energy Rev., 2017, 78, 821–833 CrossRef CAS.
- ed H.-M. Tong, Y.-S. Lai and C. P. Wong.
- M. J. Adams, M. Verosky, M. Zebarjadi and J. P. Heremans, Phys. Rev. Appl., 2019, 11, 054008 CrossRef CAS.
- M. Zebarjadi, Appl. Phys. Lett., 2015, 106, 203506 CrossRef.
- H. J. van Daal, P. B. van Aken and K. H. J. Buschow, Phys. Lett. A, 1974, 49, 246–248 CrossRef.
- J. Mao, Y. Wang, H. S. Kim, Z. Liu, U. Saparamadu, F. Tian, K. Dahal, J. Sun, S. Chen, W. Liu and Z. Ren, Nano Energy, 2015, 17, 279 CrossRef CAS.
- S. Li, K. Snyder, M. S. Akhanda, R. Martukanitz, M. Mitra, J. Poon and M. Zebarjadi, Int. J. Heat Mass Transfer, 2022, 195, 123181 CrossRef CAS.
- F. Garmroudi, M. Parzer, A. Riss, C. Bourgès, S. Khmelevskyi, T. Mori, E. Bauer and A. Pustogow, Sci. Adv., 2023, 9(37) DOI:10.1126/sciadv.adj1611.
- N. F. Mott, E. A. Davis and K. Weiser, Phys. Today, 1972, 25, 55 CrossRef.
- G. D. Mahan and J. O. Sofo, Proc. Natl. Acad. Sci. U. S. A., 1996, 93, 7436–7439 CrossRef CAS.
- J. Zhou, R. Yang, G. Chen and M. S. Dresselhaus, Phys. Rev. Lett., 2011, 107, 226601 CrossRef.
- C. Jeong, R. Kim and M. Lundstrom, J. Appl. Phys., 2011, 111, 113707 CrossRef.
- G. D. Mahan, Solid State Phys., 1997, 51, 81–157 Search PubMed.
- D. M. Rowe, V. L. Kuznetsov, L. A. Kuznetsova and G. Min, J. Phys. D: Appl. Phys., 2002, 35, 315 CrossRef.
- E. Laube, Monatsh. Chem., 1966, 97, 722–732 CrossRef CAS.
- Z. Zhu and A. D. Pelton, J. Alloys Compd., 2015, 641, 261–271 CrossRef CAS.
- F. Akbar, I. Čurlík, M. Reiffers and M. Giovannini, J. Alloys Compd., 2024, 976, 173195 CrossRef CAS.
- I. Sakamoto, S. Ohara, I. Oguro, E. Yamamoto, Y. Haga, Y. Onuki and S. Maruno, J. Alloys Compd., 1998, 275–277, 505–509 CrossRef CAS.
- B. Bradlyn, L. Elcoro, J. Cano, M. G. Vergniory, Z. Wang, C. Felser, M. I. Aroyo and B. A. Bernevig, Nature, 2017, 547, 298–305 CrossRef CAS PubMed.
- M. G. Vergniory, L. Elcoro, C. Felser, N. Regnault, B. A. Bernevig and Z. Wang, Nature, 2019, 566, 480–485 CrossRef CAS.
- M. G. Vergniory, B. J. Wieder, L. Elcoro, S. S. P. Parkin, C. Felser, B. A. Bernevig and N. Regnault, Science, 2022, 376(6595) DOI:10.1126/SCIENCE.ABG9094.
- Topological materials database, https://www.topologicalquantumchemistry.com/#/.
- P. Giannozzi, S. Baroni, N. Bonini, M. Calandra, R. Car, C. Cavazzoni, D. Ceresoli, G. L. Chiarotti, M. Cococcioni, I. Dabo, A. Dal Corso, S. de Gironcoli, S. Fabris, G. Fratesi, R. Gebauer, U. Gerstmann, C. Gougoussis, A. Kokalj, M. Lazzeri, L. Martin-Samos, N. Marzari, F. Mauri, R. Mazzarello, S. Paolini, A. Pasquarello, L. Paulatto, C. Sbraccia, S. Scandolo, G. Sclauzero, A. P. Seitsonen, A. Smogunov, P. Umari and R. M. Wentzcovitch, J. Phys.: Condens. Matter, 2009, 21, 395502 CrossRef PubMed.
- J. P. Perdew, K. Burke and M. Ernzerhof, Phys. Rev. Lett., 1996, 77, 3865–3868 CrossRef CAS.
- M. Topsakal and R. M. Wentzcovitch, Comput. Mater. Sci., 2014, 95, 263–270 CrossRef CAS.
- G. K. H. Madsen and D. J. Singh, Comput. Phys. Commun., 2006, 175, 67–71 CrossRef CAS.
- Y. B. Kuzma, P. I. Kripyakevich and D. P. Frankevich, Izv. Akad. Nauk SSSR, Neorg. Mater., 1965, 1, 1547–1553 CAS.
- G. D. Mahan and J. O. Sofo, Proc. Natl. Acad. Sci. U. S. A., 1996, 93, 7436–7439 CrossRef CAS PubMed.
Footnote |
| † Electronic supplementary information (ESI) available. See DOI: https://doi.org/10.1039/d4ma00626g |
| This journal is © The Royal Society of Chemistry 2024 |

