DOI:
10.1039/D4MA00680A
(Paper)
Mater. Adv., 2024,
5, 9445-9457
A lignin-based biocomposite hydrogel for antimicrobial and wound healing applications†
Received
5th July 2024
, Accepted 31st October 2024
First published on 4th November 2024
Abstract
Skin, the body's largest organ, plays a key role in protection, sensory perception, temperature regulation, and immune defense. Any damage to this protection makes the skin susceptible to infections and though the body heals itself, wound healing, however, is often challenged by various factors. Current wound dressing options encompass hydrogels, films, wafers, nanofibers, foams, topicals, patches, sponges, and bandages. Among these, hydrogels offer unique advantages such as creating a conducive moist environment, high moisture retention, and a barrier against bacterial intrusion, making them ideal for managing exudative and granulating wounds. Biopolymers are being preferred over synthetic polymers for the development of hydrogels owing to their non-toxic, biodegradable, and biocompatible properties. In this study, hydrogels were synthesized successfully using lignin and chitosan as biopolymers, chondroitin sulphate as a cross-linker, and poly-vinyl alcohol as an emulsifier, respectively. The hydrogels were loaded with oxytetracycline (OTC), a broad-spectrum antibiotic, in varying doses to provide antibacterial efficacy for wound management, recognizing wounds' susceptibility to infections. The hydrogels were characterized by FTIR, DSC, and scanning electron microscopy, revealing smooth surfaces. OTC release followed a time-dependent pattern, with 25% and 13% drug released at pH 7.4 and 4, respectively. The hydrogels were found to be non-hemolytic and exhibited non-cytotoxic properties towards mouse fibroblast cells. Fibroblast cell migration rates and antibacterial activity against Gram-negative (E. coli) and Gram-positive bacteria (S. aureus) highlighted the hydrogels' potential for wound healing and bacterial protection. These findings suggest that biopolymer-based, drug-loaded hydrogels hold promise for advancing wound care treatments.
1. Introduction
The skin, our largest organ, is the first line of defense, safeguarding internal structures from external hazards with its intricate barrier mechanisms, and is crucial for protecting internal organs from the external environment. However, disruptions such as wounds, cuts, and bruises can impair this barrier, leading to prolonged healing processes even without intervention. The healing process can be hampered by a number of factors, including local ones (such as oxygenation, wound infection, foreign bodies, venous sufficiency, wound area, depth, and regional tension and pressure) and systemic ones (such as age and gender, sex hormones, and stress).1 Hydrogels are versatile wound dressings2 that can retain moisture which in turn promotes moist wound healing3 and aids in tissue regeneration. Biopolymeric materials are naturally derived polymers that play a crucial part in sustainable development attributed to their ease of availability, extreme versatility, and affordability. Non-bio-based polymers offer versatility, enhanced mechanical strength, controlled degradation, cost-effectiveness, and tailored properties, but face challenges of biocompatibility, environmental impact, and lack of inherent bioactivity. Conversely, biopolymer-based hydrogel systems boast biocompatibility, sustainability, bioactivity, biodegradability, and immunomodulatory properties, making them favorable for various biomedical applications. Lignin, the second most prevalent natural polymer4 is highly branched and amenable to chemical modification due to the abundance of functional groups, allowing changes in accordance with the required application.5 Lignin is produced in quantities of over fifty million tonnes annually and represents an excellent choice for the creation of novel polymeric systems due to its simple accessibility, environmental friendliness, low cost, nontoxic nature, antioxidant, antibacterial, and UV protectant properties, and great abundance.6 Chitin, a heteropolysaccharide, obtained from insect, crustacean, and mushroom cell walls, is converted into the heteropolysaccharide chitosan by deacetylation.7 Chitosan is used in the current study due to its antibacterial, anti-inflammatory, film-forming, and wound-healing capabilities. Chondroitin sulphate is an important structural component in connective tissues and cartilages. It provides compressive strength to connective tissues by adjusting their water content and possesses characteristic features, such as high-water absorption, multifunctionality, and biodegradability suitable for several bio-applications. In addition, the presence of active functional groups in chondroitin sulphate, such as carboxylic acids (–COOH), organosulphate (–OSO3H) and hydroxyl functionalities (–OH), provides access to bioconjugation strategies for numerous applications. Polyvinyl alcohol (PVA) has a compatible structure and hydrophilic properties, owing to which this polymer is frequently blended with other polymer compounds, such as biopolymers and other polymers with hydrophilic properties, to improve the mechanical properties of hydrogels in a variety of industrial applications.8
Oxytetracycline (OTC), (4S,4aR,5S,5aR,6S,12aS)-4-(dimethylamino)-3,5,6,10,11,12a-hexahydroxy-6-methyl-1,12-dioxo-1,4,4a,5,5a,6,12,12a-octahydrotetracene-2-carboxamide, is a broad spectrum tetracycline antibiotic with activity against a significant variety of Gram-positive and Gram-negative microorganisms.9 OTC inhibits cell growth by inhibiting translation. It binds to the 30S ribosomal subunit and prevents the amino-acyl tRNA from binding to the A site of the ribosome. Tetracyclines are sporadically and insufficiently absorbed from the digestive system and therefore direct application on wounds would provide a better antibacterial activity. This study reports the fabrication, characterization, and in vitro evaluation of an OTC-loaded-lignin-based hydrogel for antimicrobial and wound healing applications.
Lignin and chitosan are both bioactive materials with complementary properties. Chitosan is well-known for its antimicrobial, hemostatic, and biodegradable characteristics, making it suitable for wound dressing materials. Lignin, on the other hand, exhibits antioxidant activity, helping to reduce oxidative stress in the wound environment.10 Polyvinyl alcohol (PVA) is a synthetic polymer commonly used in wound dressings due to its film-forming, biocompatible, and non-toxic properties. Lignin can enhance these properties by contributing its bioactivity, such as antioxidant capabilities, which are critical in the healing process.
This study aims to develop and characterize a biopolymer-based hydrogel loaded with the antibiotic oxytetracycline (OTC) for enhanced antibacterial efficacy, with the goal of improving wound healing and protection against bacterial infections. The study seeks to evaluate the hydrogel's biocompatibility, release kinetics, and antibacterial activity, while also investigating its potential as a safe and effective wound dressing.
2. Experimental
2.1. Materials
Alkali lignin (97%) and oxytetracycline hydrochloride were purchased from Sigma-Aldrich Pvt Ltd. Chitosan (low molecular weight, molecular weight <150 kDa, with a degree of acetylation of 75% to 85%) and chondroitin sulphate sodium salt were purchased from Central Drug House (P) Ltd. PVA was purchased from Loba Chemicals Pvt. Ltd. Acetic acid (99%) was purchased from SRL Chemicals Pvt. Ltd.
2.2. Method of preparation
2.2.1 Preparation of lignin–chitosan–CS–PVA hydrogels.
Hydrogels were prepared using the freeze and thaw method as reported before with minor modifications11 (Fig. 1). Lignin solution (1% w/v in water) and chitosan solution (1 and 2.5% w/v) in 1% v/v glacial acetic acid were stirred at room temperature individually at 350 rpm for 24 h using a magnetic stirrer. PVA solution (5, 10, 20% w/v in water) was also stirred individually for 2 hours at 80 °C at 350 rpm. Chondroitin sulphate (CS) solution (0.5, 1, 2% w/v in water) was prepared by dissolving CS in water as mentioned in Table 1. CS solution, chitosan, and PVA solution were added to the lignin solution under stirring. Stirring was maintained for 24 hours. The resultant solution was poured into Petri plates and kept for the freeze (−80 °C for 12 hours) and thaw (25 °C for 6 hours) cycle. The cycle was repeated 5 times.
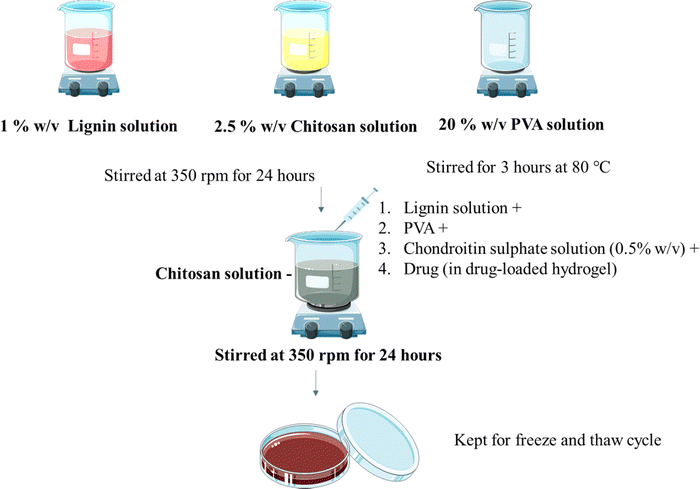 |
| | Fig. 1 Preparation of the hydrogel. | |
Table 1 Preparation of lignin–chitosan–CS–PVA hydrogels
| S. no. |
Chitosan (% w/v) |
Lignin (% w/v) |
Chondroitin sulphate (% w/v) |
Polyvinyl alcohol (% w/v) |
| 1 |
1 |
1 |
2 |
— |
| 2 |
5 |
| 3 |
1 |
10 |
| 4 |
2.5 |
| 5 |
20 |
| 6 |
0.5 |
2.2.2. Preparation of drug-loaded hydrogels.
The drug OTC was loaded using direct in situ addition (Fig. 1). Hydrogels were prepared using the freeze and thaw method as reported before with minor modifications. Lignin solution (1% w/v in water) and chitosan solution (2.5% w/v) in glacial acetic acid (1% v/v) were stirred individually at 350 rpm for 24 h using a magnetic stirrer. PVA solution (5%, 10%, 20% w/v in water) was stirred individually for 2 hours at 80 °C at 350 rpm. CS solution along with drug, chitosan solution, and PVA solution were added to the lignin solution under stirring. Stirring was maintained for 24 hours. The resultant solution was poured into Petri plates and was kept for the freeze (−80 °C for 12 hours) and thaw (25 °C for 6 hours) cycle. The cycle was repeated 5 times.
2.3. Characterization of hydrogels
The surface morphology of the hydrogels was studied using scanning electron microscopy (SEM, JSM-6100).
The porosity percentage12 was calculated using the following formula:
where
AP = total area of the pores (the dark regions in the SEM image) and
AT = total area of the material (the entire cross-sectional area of the sample).
FTIR analysis was performed using a PerkinElmer Spectrum Two™ FT-IR spectrometer. Thermal properties were determined using a DSC Q20 TA (Waters, USA) instrument with a heating rate of 10 °C min−1 from 30 °C to 350 °C. In vitro drug release experiments were accomplished at pH 7.4 and pH 4 using dialysis bags with a molecular cut-off of 8 kDa and the drug quantity was analyzed using a UV-Vis spectrophotometer (using a calibration curve, ESI,† supp. 3.)
For swelling index measurement,13 the quantities of dried hydrogels were accurately weighed and recorded (Wt dry). The dried hydrogels were then immersed in deionized water (pH = 7.0) at 25 °C. After 24 hours, the hydrogel that was saturated with water was weighed (Wt wet) and the swelling ratio was determined according to the following formula:
| |  | (2) |
The moisture content of blank and drug-loaded hydrogels equilibrated at 25 °C was analyzed by drying the sample at 100 °C before calculating the difference in the weight, using the following equation:
| |  | (3) |
where
W1 and
W2 are the initial and dried weights of the sample, respectively.
pH determination of both blank and drug-loaded hydrogels was carried out through immersion of the hydrogel measuring 1 cm by 1 cm in distilled water and allowing the water to equilibrate at 25 °C for 24 hours. After 24 hours, pH measurements of the decanted water were carried out to assess the pH levels of the hydrogels.
2.4. Rheological studies
Rheological analysis was performed on a RheolabQC SN000000; ID81946396; FW1.31 rheometer with a Peltier temperature-controlled system for fast and precise thermoregulation. All the measurements were conducted using a 25 mm parallel plate geometry with a 1 mm set gap. The instrument was calibrated, and the temperature was set to 26.2 °C for all the experiments. A shear rate of 50 s−1 was applied to the hydrogel samples to study the flow behaviour and shear rate versus shear stress relationship. The viscosity of the hydrogel was evaluated.14
2.5. Cell viability assay
Cytotoxicity of the prepared hydrogels was evaluated using a 3-(4,5-dimethylthiazol-2-yl)-2,5-diphenyltetrazolium bromide (MTT) based colorimetric assay (Alqahtani et al., 2019). Fibroblast cells (L-929) were cultured in a DMEM with 10% FBS and 1% penicillin–streptomycin and incubated for 24 h at 37 °C in a humidified incubator with 5% CO2. The cells were seeded at a density of 9 × 10³ cells per well in 96-well culture plates in a 200 μL culture medium. Different weights of hydrogel samples (1–10 mg) were added to culture wells and incubation was continued for 24 h. Cells with only media were used as a positive control. After 24 h, a supernatant fluid layer of cell cultures was replaced by media containing MTT (2.5 mg mL−1), and cells were incubated for 4 h. MTT was removed and 100 μL of DMSO was added to dissolve the formazan crystals. The absorbance of the samples was assessed using a microplate reader (Biorad) at a wavelength of 595 nm. Control cells were assumed to have 100% viability, and other treated wells were compared with the control to compute cell toxicity in wells treated with blank, drug-loaded hydrogels, and drug alone hydrogels.
2.6. Antioxidant activity with the DPPH test
The antioxidant activity was determined using a 2,2-diphenyl-1-picrylhydrazyl (DPPH) assay. DPPH solution (0.1 mM in ethanol) was prepared and various quantities (2–50 mg) of the sample (blank hydrogel) were mixed with 3 ml of DPPH solution and kept at room temperature for 30 min in the dark. The absorbance was measured at 517 nm using a spectrophotometer (UV 3200, LabIndia). DPPH solution without a sample was taken as a control solution. Ascorbic acid was used as a standard antioxidant. The inhibitory percentage of the sample was calculated using the following equation:| |  | (4) |
2.7. Hematoxicity measurements
Any toxic effect on RBCs (red blood cells) can limit the applications of a formulation, and therefore a pre-screening by hemolysis assay is necessary. A fresh whole blood sample was collected from a healthy rat and immediately transferred to an EDTA tube to prevent coagulation. The RBCs were separated by centrifugation (1500 rpm, 10 min at 4 °C) and washed with ice-cold 0.9% NaCl several times until the supernatant was clear and suspended in ice-cold 0.9% NaCl. Different amounts of the samples (blank and drug-loaded hydrogels) were mixed with 200 μL of RBC suspension and incubated under constant shaking for 1 h at 37 °C. The negative and positive controls were normal saline solution (0.9% sodium chloride) and 0.1% Triton X-100 in 0.9% NaCl, respectively. After the centrifugation (1500 rpm, 10 min at 4 °C), the hemolysis was assessed using a microplate reader (BioRad) at 540 nm. The % hemolysis was calculated using the following formula:| |  | (5) |
2.8. Cell scratch/migration assay on fibroblast cells
The ability of cells to migrate is essential for many physiological processes including embryonic development, wound repair, tumor invasion, neoangiogenesis, and metastasis. In this assay, cells were seeded in a 6-well plate (106 cells per well) and allowed to grow into a monolayer. A scratch was made with a sterile microtip, detached cells were washed and cells were treated with the hydrogel. Cells with only media and no treatment were treated as controls. The images were acquired using a Nikon phase contrast microscope at 0, 4, 24, and 32 h at 10× magnification. The % cell migration is calculated using the formula:| |  | (6) |
2.9. Antibacterial assay
The antibacterial activity of drug-loaded hydrogels was determined against representative Gram-positive (Staphylococcus aureus ATCC 29213) and Gram-negative bacteria (Escherichia coli ATCC 25922) by Kirby-Bauer agar diffusion assay as per the guidelines of Clinical and Laboratory Standards Institute (CLSI, 2023). Briefly, 24-h old cultures of the bacteria were set to McFarland standard 0.5 in normal saline (0.85% sodium chloride) and swab inoculated on Mueller Hinton agar plates, to give a confluent lawn of growth upon incubation. Sterile 6 mm paper disks loaded with drug (OTC, 10 μg) and OTC-loaded hydrogels were placed on the pre-inoculated Mueller Hinton agar plates and incubated at 37 °C for 24 h. Blank hydrogels and positive controls (S. aureus, 30 μg per disk amikacin; E. coli 5 μg per disk ciprofloxacin) were also tested in parallel. The results were measured as the diameters of the zones of growth inhibition. The experiments were performed in duplicate and repeated twice to confirm the observations.15
2.10. Degradation studies
As chitosan is rich in amino groups, the degradation profile of the blank hydrogels was analyzed using a ninhydrin reagent. Ninhydrin reagent reacts with the amine group and produces a deep blue color product which can be quantified at 570 nm. The hypothesis is that when CH–CS undergoes degradation the free chitosan will be released which can then be quantified using ninhydrin reagent. A standard curve for quantification was prepared with free chitosan. The study was performed at different pH values: pH 4, 7, and 9. After 24 h, to 1 ml aliquot of the sample, an equal volume of 8% ninhydrin solution was added and the solution was heated at 80 °C for 15 min. The solution was allowed to cool and was analyzed at 570 nm using UV spectroscopy.
3. Results and discussion
3.1. Optimization studies
In the current study, the freeze–thaw method was used with varying ratios of the chitosan–PVA–CS mixture. From all the tried ratios and methods, lignin 1%, chitosan 2.5%, PVA 20%, and CS 0.5% yielded uniform homogenous hydrogels with a smooth front and a slightly rough back surface (Fig. 2).
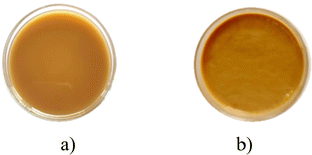 |
| | Fig. 2 Image of the finally prepared (a) blank hydrogel and (b) drug-loaded hydrogel. | |
3.2. Characterization of hydrogels
As seen in Fig. 3, the surfaces of both hydrogels were homogenous and fibrous with a polymeric network where the drug was encapsulated. The image of the cross-sectional area reveals a fibrous nature with a thickness of 319.73 and 431.94 μm for blank and drug-loaded hydrogels, respectively, indicating an increase in thickness with drug-loading. The porosity percentage of the blank hydrogel was approximately 59.38% and for the drug-loaded hydrogel, it was 36.29%. The marked decrease in porosity suggests that the drug has been loaded in the intercellular spaces in the hydrogel's matrix, thereby confirming successful drug loading.
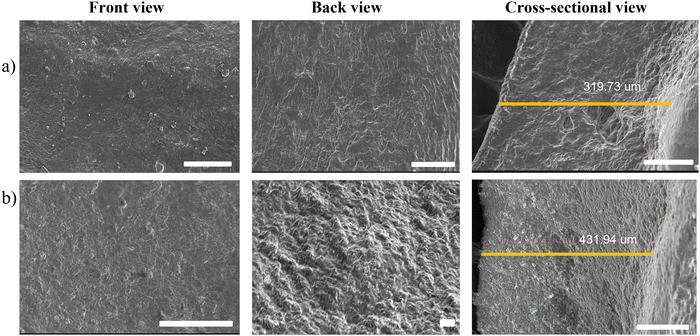 |
| | Fig. 3 SEM images of (a) the blank hydrogel and (b) the drug-loaded hydrogel (scale bar = 100 μm). | |
From the FTIR spectrum of oxytetracycline (OTC), it can be observed that the specific vibration bands of amide and phenol groups belong to OTC (Fig. 3). The OTC bands are allocated in the range of 1538 cm−1 to 1639 cm−1 for the amide group and for the latter the range was within 1338 cm−1 to 1444 cm−1.16 For chitosan (Fig. S1, ESI†), the bands observed were at 3366 cm−1 (N–H stretching), 2925 cm−1 (–CH2– asymmetric stretching), 2855 cm−1 (–CH2– symmetric stretching), 1555 cm−1 (C![[double bond, length as m-dash]](https://www.rsc.org/images/entities/char_e001.gif) O stretching), 1413 cm−1 (N–H bending), 1158 cm−1 (asymmetric C–O–C stretching vibrations), and 1075 cm−1 (symmetric C–O stretching vibrations of the 10-OH group).17 For chondroitin sulphate (Fig. S1, ESI†), the bands observed at 3436 cm−1 were due to N–H streching, those at 1246–1063 cm−1 were due to the sulphate ester group, that at 1640 cm−1 was due to the carboxylate group (C
O stretching), 1413 cm−1 (N–H bending), 1158 cm−1 (asymmetric C–O–C stretching vibrations), and 1075 cm−1 (symmetric C–O stretching vibrations of the 10-OH group).17 For chondroitin sulphate (Fig. S1, ESI†), the bands observed at 3436 cm−1 were due to N–H streching, those at 1246–1063 cm−1 were due to the sulphate ester group, that at 1640 cm−1 was due to the carboxylate group (C![[double bond, length as m-dash]](https://www.rsc.org/images/entities/char_e001.gif) O streching vibrations) and those at 1129–1063 cm−1 and 950–850 cm−1 were due to the presence of pyranose and furanose rings.18 For PVA (Fig. S1, ESI†), the IR bands were observed at 3780, 2917, 2858, 1690, and 1425 cm−1. These peaks are assigned to the O–H stretching vibration of the hydroxy group, CH asymmetric stretching vibration, C
O streching vibrations) and those at 1129–1063 cm−1 and 950–850 cm−1 were due to the presence of pyranose and furanose rings.18 For PVA (Fig. S1, ESI†), the IR bands were observed at 3780, 2917, 2858, 1690, and 1425 cm−1. These peaks are assigned to the O–H stretching vibration of the hydroxy group, CH asymmetric stretching vibration, C![[double bond, length as m-dash]](https://www.rsc.org/images/entities/char_e001.gif) O carbonyl stretch, C–H bending vibration of CH2, C–H deformation vibration, C–O stretching of acetyl groups and C–C stretching vibration.19 For lignin (Fig. S1, ESI†), the bands at 3419 cm−1 are due to the O–H stretching vibration and bands near 2857 cm−1 are due to the asymmetric C–H stretching vibration. The peaks at 1592 and 1518 cm−1 are due to the skeletal vibration and stretching vibration of the aromatic ring, absorption at 1274 cm−1 can be attributed to the C–O stretch, and the peaks at 1030–1300 cm−1 are attributed to C–C, C–O, and ether functionalities.5 In Fig. 4, the drug-loaded hydrogel showed peaks of both the blank hydrogel and drug (OTC) thus confirming the successful entrapment of drug in the hydrogel.
O carbonyl stretch, C–H bending vibration of CH2, C–H deformation vibration, C–O stretching of acetyl groups and C–C stretching vibration.19 For lignin (Fig. S1, ESI†), the bands at 3419 cm−1 are due to the O–H stretching vibration and bands near 2857 cm−1 are due to the asymmetric C–H stretching vibration. The peaks at 1592 and 1518 cm−1 are due to the skeletal vibration and stretching vibration of the aromatic ring, absorption at 1274 cm−1 can be attributed to the C–O stretch, and the peaks at 1030–1300 cm−1 are attributed to C–C, C–O, and ether functionalities.5 In Fig. 4, the drug-loaded hydrogel showed peaks of both the blank hydrogel and drug (OTC) thus confirming the successful entrapment of drug in the hydrogel.
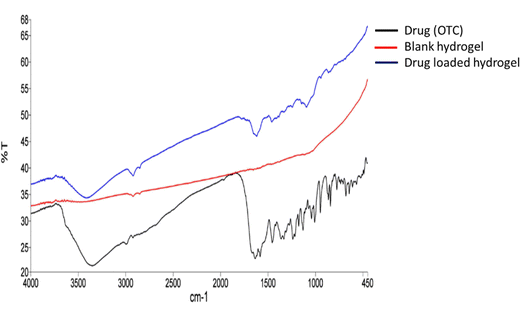 |
| | Fig. 4 FTIR spectra of the drug, blank hydrogel, and drug loaded hydrogel. | |
3.2.1. Rheological studies.
The viscosity was observed to be 117 and 114 Pa s for the blank hydrogel and drug loaded hydrogel, respectively. The decrease in viscosity may be due to oxytetracycline which is a hydrophilic molecule, and its presence can enhance water interactions within the hydrogel matrix. This can lead to increased hydration of the polymer chains, resulting in a more mobile structure that allows for easier flow, thereby lowering viscosity. Even the addition of a drug can cause the polymer chains to become more loosely arranged, leading to reduced resistance to flow and a decrease in viscosity (Fig. 5).14
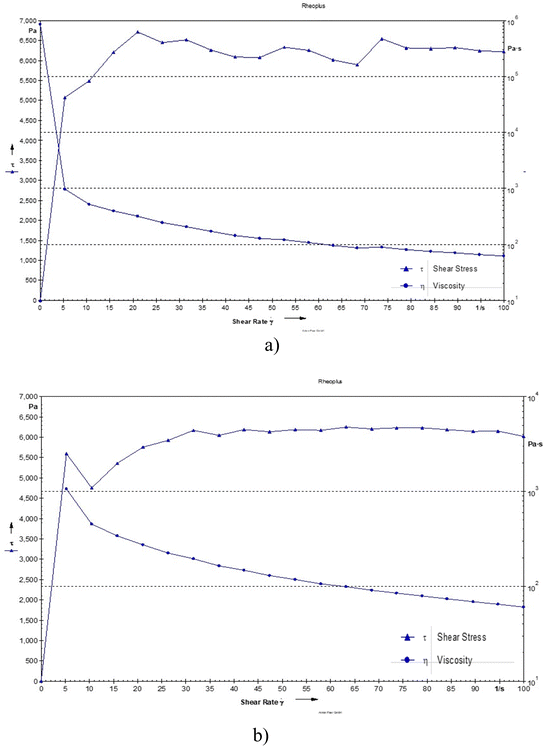 |
| | Fig. 5 Shear stress of (a) the blank hydrogel and (b) the drug-loaded hydrogel as a function of shear rate. | |
3.2.2. DSC.
DSC thermograms were used to study the drug and polymer thermal peaks and their interaction in the prepared hydrogels. From the thermogram (Fig. 6), chitosan shows an exothermic peak from 268.45 to 288.77 °C, CS exhibited an endothermic peak at 79.15 °C due to water loss and a sharp exothermic peak at 246.78 °C and PVA shows an exothermic peak from 224 °C to 298.22 °C due to crystallization.20 Lignin shows an endothermic peak from 132.27–146.41 °C. For OTC it has been reported before that Form 1 typically melts around 200 °C to 206 °C and Form II usually has a melting point in the range of 190 °C to 196 °C. In the DSC graph, the drug (OTC) shows an endothermic peak from 94 to 108 °C corresponding to water loss and an endothermic peak at 204.71 °C which is indicative of Form 1, while the small transition at 192.03 °C might suggest the presence of a small amount of Form II. This overlap in melting points is often observed with polymorphic mixtures16 showing the Form II of the drug. In the blank hydrogel, a peak below 100 °C shows water loss through evaporation. The thermal stability of the formed hydrogel was improved in comparison with individual polymers due to cross-linking and the formation of a polymeric matrix. The thermogram of the drug-loaded hydrogel did not show a corresponding melting peak (184.5) as in the drug's thermogram confirming that the drug was encapsulated in the polymeric matrix.
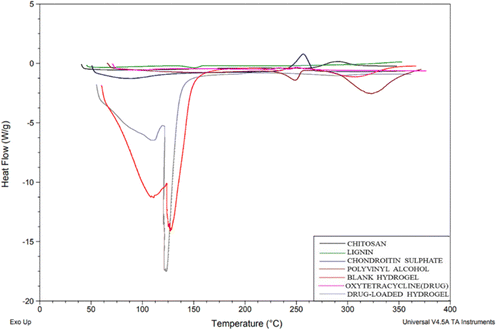 |
| | Fig. 6 DSC graph of chitosan, lignin, chondroitin sulphate, polyvinyl alcohol, blank hydrogel, oxytetracycline (drug), and drug-loaded hydrogel. | |
3.2.3. pH.
The pH of the blank and drug-loaded hydrogels showed a prominent decrease with the loading of the drug. pH was observed to be 5.23 and 4.35 for the blank and drug-loaded hydrogels, respectively. The pH of the drug solution (1 mg mL−1) was 3.97; the decrease in pH with drug loading can be attributed to the acidic nature of the drug, OTC. pH plays a vital role in drug release and in wound healing; therefore, pH was evaluated to understand the acidic or basic nature of the developed formulation. The developed hydrogel was slightly acidic and the acidic hydrogel promotes wound healing by maintaining a low pH, which inhibits bacterial growth and enhances tissue regeneration.21 The observed pH values of blank and drug loaded hydrogels are provided in Table S1 of the ESI.†
3.2.4. Moisture content.
The moisture content of the hydrogels is given in Table 2. The moisture content decreased with the addition of the drug which can be attributed to reduced water absorption and retention due to the hydrophilic nature of OTC. OTC has large amounts of the hydrophilic amino and hydroxyl groups and this might be responsible for the absorption of excess water molecules as observed in swelling studies.22
Table 2 Observed moisture ratio of the blank and the drug-loaded hydrogel (data represented as mean ± S.D., n = 3)
| S. no. |
Formulation |
Temperature |
% Moisture content (%) ± SD |
| 1 |
Blank hydrogel |
Kept in an oven at 100 °C |
1022.277 ± 9.579928 |
| 2 |
Drug-loaded hydrogel (100 mg) |
720.073 ± 3.475085 |
| 3 |
Drug-loaded hydrogel (200 mg) |
479.5337 ± 3.475085 |
| 4 |
Drug-loaded hydrogel (300 mg) |
347.3349 ± 3.270208 |
3.2.5. Swelling index.
Table 3 depicts the swelling index represented as a swelling percentage. One of the factors that mostly influence the swelling of hydrogels is the presence of PVA which acts as an emulsifier/thickener and contributes to water absorption and retention. Furthermore, the swelling percentage was observed to increase with drug-loading which could be credited to the enhanced water retention with increased drug content owing to the presence of hydrophilic amino and hydroxyl groups in OTC.23
Table 3 Observed swelling percentage of the blank and drug-loaded hydrogels (data represented as mean ± S.D., n = 3)
| S. no. |
Formulation |
Swelling index (%) |
| 1 |
Blank hydrogel |
71.78 ± 0.634305 |
| 2 |
Drug-loaded hydrogel (100 mg) |
121.95 ± 0.596328 |
| 3 |
Drug-loaded hydrogel (200 mg) |
145.44 ± 0.310907 |
| 4 |
Drug-loaded hydrogel (300 mg) |
229.49 ± 0.749309 |
3.2.6. Degradation studies.
Degradation was less than 5% at all tested concentrations. The data suggest that the blank hydrogel did not degrade with time even under low and high pH conditions over a period of 24 h, thus supporting its use for topical administration and loading of therapeutically active drugs.24
3.3.
In vitro drug release studies
To evaluate the release profile of the hydrogel, the drug release study was carried out under two different pH conditions, pH 7.4 and pH 4. A slow drug release was observed from the polymeric hydrogel in a time-dependent manner with the cumulative release of 17%, 22%, and 25% at pH 7.4 for 100, 200, and 300 mg drug-loaded hydrogels, respectively (Fig. 7). Whereas the release was 13%, 12%, and 13% at pH 4 for 100, 200, and 300 mg drug-loaded hydrogels, respectively. A higher drug release at pH 7.4 can be attributed to the higher solubility at 7.4 than at 4.25 The % drug release was the highest in the 300 mg drug-loaded hydrogel; therefore, it was selected for further evaluation.
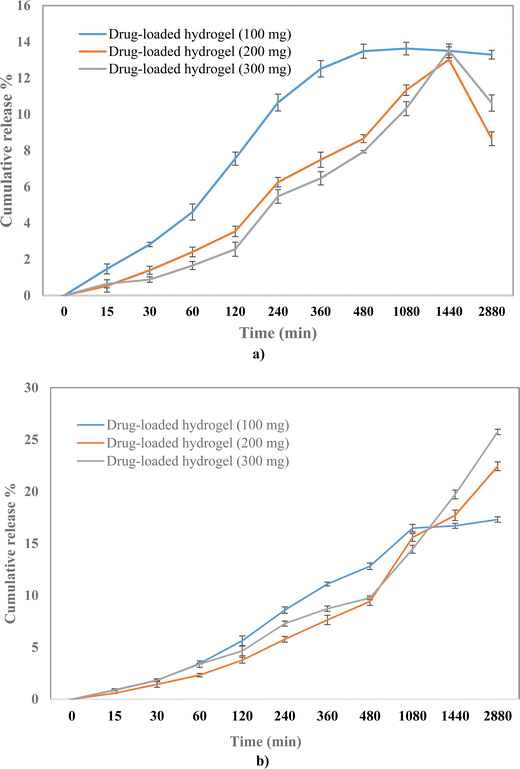 |
| | Fig. 7 Drug release profile of 100, 200, and 300 mg of the drug-loaded hydrogel at (a) pH 4 and (b) pH 7.4. | |
3.4. Kinetic modeling
Kinetic modeling was conducted to understand the release kinetics of the prepared hydrogel by applying different equations to the obtained data sets of drug release. The volume of release media was 2 ml, the temperature was 37 °C and the sample was taken 9 times at 0, 15, 30, 60, 120, 240, 360, 480, 1080, and 1440 min. The experiment was performed in triplicate. UV was performed at a wavelength of 285 nm.
Various models were evaluated, and the best-fit model was selected based on the R2 values (regression coefficient). The R2 values (Table 4) indicate that the release kinetics follow the Higuchi model with F0 at pH 7.4 and the first-order model with Fmax at pH 4.
Table 4 Values of R2 for various kinetic models at pH 7.4 and 4
| Order |
Equation |
Predicted R2 |
| pH 7 |
pH 4 |
| Zero-order |
F = k0 × t |
0.7693 |
0.2658 |
| Zero-order with Tlag |
F = k0 × (t − Tlag) |
0.9102 |
0.5597 |
| Zero-order with F0 |
F = F0 + k0 × t |
0.9102 |
0.5597 |
| First-order |
F = 100 × [1 − exp(−k1 × t)] |
0.8281 |
0.3248 |
| First-order with Tlag |
F = 100 × {1 − exp[−k1 × (t − Tlag)]} |
0.9315 |
0.5790 |
| First-order with Fmax |
F = Fmax × [1 − exp(−k1 × t)] |
0.9637 |
0.9632 |
| First-order with Tlag and Fmax |
F = Fmax × {1 − exp[−k1 × (t − Tlag)]} |
0.9807 |
0.9582 |
| Higuchi |
F = kH × t0.5 |
0.9864 |
0.8224 |
| Higuchi with Tlag |
F = kH × (t − Tlag)0.5 |
0.9898 |
0.8026 |
| Higuchi with F0 |
F = F0 + kH × t0.5 |
0.9908 |
0.8045 |
| Korsmeyer–Peppas |
F = kKP × tn |
0.9892 |
0.8334 |
| Korsmeyer–Peppas with Tlag |
F = kKP × (t − Tlag)n |
0.9895 |
0.8785 |
| Korsmeyer–Peppas with F0 |
F = F0 + kKP × tn |
0.9895 |
0.8884 |
| Quadratic |
F = 100 × (k1 × t2 + k2 × t) |
0.9426 |
0.9378 |
| Quadratic with Tlag |
F = k1 × (t − Tlag)0.5 + k2 × (t − Tlag) |
0.9765 |
0.9565 |
| Weibull 1 |
F = 100 × {1 − exp[−((t − Ti)β)/α]} |
0.9898 |
0.8809 |
| Weibull 2 |
F = 100 × {1 − exp[−(tβ)/α]} |
0.9903 |
0.8392 |
| Weibull 3 |
F = Fmax × {1 − exp[−(tβ)/α]} |
0.9893 |
0.9592 |
| Weibull 4 |
F = Fmax × {1 − exp[−((t − Ti)β)/α]} |
0.9880 |
0.9530 |
The release kinetics following the Higuchi model with F0 and the first-order model with Fmax are obtained using the following equations:
| | | F = F0 + kH × t0.5, F = Fmax × [1 − exp(−k1 × t)] | (7) |
where
F is the fraction of the drug dissolved in time
t,
α is a scale parameter that describes the time scale of the process, and
Ti represents the lag time before the onset of dissolution. The term
β is a shape parameter that defines the shape of the curve as either exponential (
β = 1), sigmoid (S-shaped) with upward curvature followed by a turning point (
β > 1), or parabolic (
β < 1), with a higher initial slope and after that consistent with the exponential. The value of
β was 0.589 for pH 7.4 suggesting a parabolic release while
β was 1.077 for pH 4 suggesting a sigmoid release. A value of
β > 1 indicates that a complex mechanism governs the release process because the rate of release does not change monotonically. Also, the release rate initially increases nonlinearly up to the inflection point and then decreases asymptotically,
i.e., the rate of release increases up to the inflection point and, after that, declines (Papadopoulou
et al. 2006). The expected and observed releases are shown in
Fig. 8 for pH 7.4 and 4.
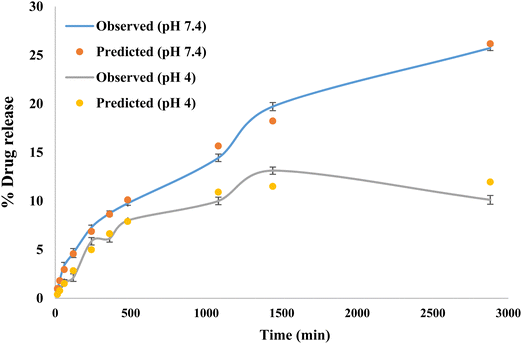 |
| | Fig. 8 Observed and predicted drug release study. | |
3.5. Hemotoxicity
The formulation should be compatible with the components of blood, so the hemotoxicity of the blank hydrogel and the drug-loaded hydrogel was measured with 1, 2, 5, and 10 mg of polymeric hydrogel samples. Any hemolysis value <10% is considered to be non-hemolytic, while a value >25% of hemolysis is considered to be hemolytic (Psimadas et al., 2012). No hemolytic activity was observed in any of the samples tested (Fig. 9). The developed polymeric hydrogel can be considered safe for the desired application.
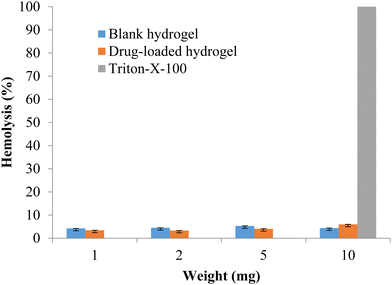 |
| | Fig. 9 % Hemolysis of the blank and drug-loaded hydrogels (data represented as mean ± S.D., n = 3). | |
3.6. Antioxidant assay
The free radical scavenging potential of the polymeric material was tested using the DPPH method. A blank hydrogel was used to assess the scavenging activity, with samples of 2 mg, 5 mg, 10 mg, and 50 mg of the hydrogel tested. The results are shown in Fig. 10. The radical scavenging activity increased with the concentration of the hydrogel. At the highest concentration, of 50 mg, the radical scavenging activity was 39.27. The prepared hydrogels exhibited antioxidant activity which can be attributed to the presence of lignin and chitosan.26
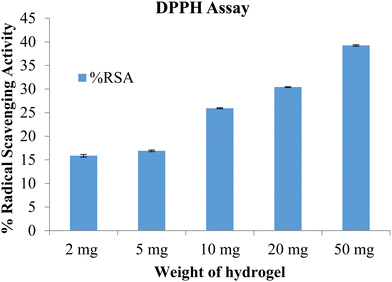 |
| | Fig. 10 %RSA of the blank hydrogel (data represented as mean ± S.D., n = 3). | |
3.7. Cell viability assay
The potential of the formulation to cause cellular toxicity was evaluated using an MTT assay. Different concentrations of the blank hydrogel and the drug-loaded hydrogel were evaluated to determine the cell viability of the L-929 fibroblast cell line (Fig. 11). All the values were significant (p < 0.001) when compared with the control. Both blank and drug-loaded hydrogels showed cell viability > 80% and hence can be considered non-toxic and safe for use.
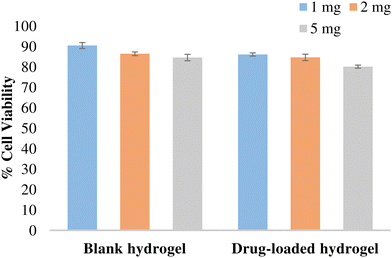 |
| | Fig. 11 % Cell viability of the hydrogel in L-929 fibroblast cells. Data expressed as mean ± SD, n = 3. Data were analysed by Graphpad-PRISM two-way ANOVA followed by Tukey's multiple comparison. All the values were significant (p < 0.0001) compared with the control and with each other at all tested concentrations. | |
3.8. Cell scratch/migration assay on fibroblast cells
The ability of the hydrogel to stimulate fibroblast proliferation and/or migration was visualized by the scratch assay. Fig. 12 shows the migration of fibroblasts after scratch and culture with 1 and 2 mg of the blank and drug-loaded hydrogels. When cells were cultured with the blank hydrogel, a higher migration and proliferation activity was observed, as compared to drug-loaded and control cells. After 4 h of treatment, the % cell migration values in the control (without treatment), blank hydrogel, and drug-loaded hydrogel were observed to be 8.7, 9.5, and 7.2%, respectively. A marginally higher proliferation with the blank hydrogel can be linked to the previously reported wound healing and antioxidant activity of chitosan and lignin.27
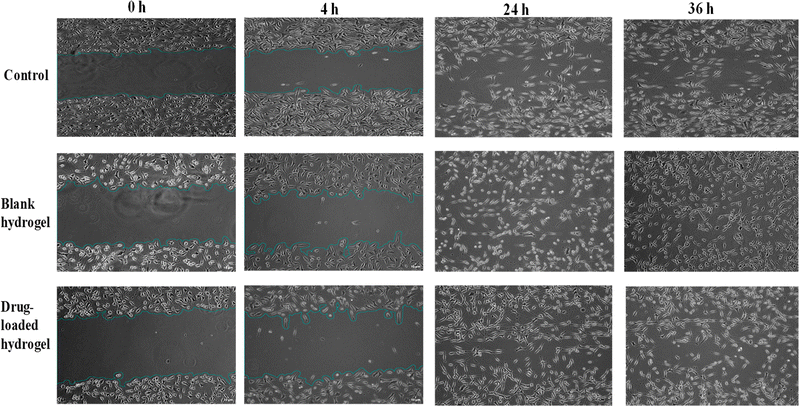 |
| | Fig. 12 Cell scratch assay on fibroblast cells after treatment with (a) the control (no treatment), (b). blank hydrogel, (c) and drug-loaded hydrogel, for 0 h, 4 h, 24 h, and 36 h. Images were taken with a Nikon inverted microscope at 10× magnification (scale bar = 10 μm) and processed using ImageJ software. | |
3.9. Antibacterial activity
Microbes can easily contaminate the wounds and adhere to the surfaces of wound dressings, increasing the patients’ risks of developing infections.28 Since wound infections are usually caused by bacteria, the antibacterial performances of the blank and drug-loaded hydrogel were evaluated. Fig. 13 shows the antibacterial activity against representative Gram-positive (S. aureus) and Gram-negative (E. coli) bacteria. The activity was measured as diameters of the zones of growth inhibition (Table 5) obtained with drug-loaded hydrogels, compared with the drug alone and blank hydrogels. The drug-loaded hydrogels demonstrated effective bacterial inhibition against both S. aureus and E. coli (Fig. 13). Marginal growth inhibition was also noted with blank hydrogels, which can be attributed to the antimicrobial activity of lignin and chitosan. Lignin is known to have antibacterial activity owing to the hydroxyl groups that can ablate bacteria by damaging cell walls.29 Some previous reports have shown that chitosan30 can inhibit bacteria by damaging cell walls, and electrostatic interactions between protonated amino groups of chitosan and phosphoryl groups of phospholipid components of cell membranes can prevent bacteria from absorbing nutrients for proliferation. In addition, the antibacterial activity of drug-loaded hydrogels, blank hydrogel, and OTC was greater for S. aureus than for E. coli at similar concentrations.
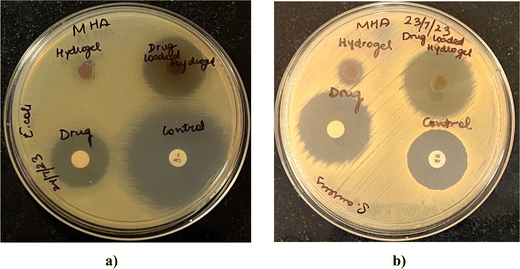 |
| | Fig. 13 Zones of growth inhibition of E. coli (a) and S. aureus (b) after exposure to drug-loaded hydrogels as observed by agar diffusion assay. Blank hydrogels, oxytetracycline disks (10 μg per disk), and positive controls (S. aureus, 30 μg per disk amikacin; E. coli 5 μg per disk ciprofloxacin) were tested in parallel. | |
Table 5 Diameters of the zones of growth inhibition of E. coli and S. aureus after exposure to drug-loaded hydrogels as observed by the agar diffusion assay. Blank hydrogels, oxytetracycline disks (10 μg per disk), and positive controls (S. aureus, 30 μg per disk amikacin; E. coli 5 μg per disk ciprofloxacin) were tested in parallel (n = 2)
| Sample |
Diameter of the zones of growth inhibition (mean ± SD) |
|
E. coli
|
S. aureus
|
| Blank hydrogel |
7 ± 0 |
10 ± 0 |
| Oxytetracycline |
19.5 ± 0.5 |
24.5 ± 0.5 |
| Drug-loaded hydrogel |
22 ± 0 |
24.5 ± 0.5 |
| Positive control |
35 ± 0 |
23 ± 0 |
3. Conclusion
The skin's role as a barrier and its functions in sensory perception, temperature regulation, fluid balance, and immune defense highlight its importance for the overall health. However, the intricate process of wound healing can face obstacles due to various local and systemic factors, emphasizing the need for effective wound management strategies. Among the diverse array of wound dressing options available, hydrogels emerge as standout candidates due to their ability to create an optimal moist environment, retain moisture effectively, and establish a protective shield against bacterial intrusion. This study details the synthesis of hydrogels using lignin, chitosan, CS, and PVA, and the incorporation of the antibiotic OTC into them. Controlled drug release was observed, with 25% and 13% cumulative release from lignin-chitosan hydrogels at pH 7.4 and 4, respectively. Release kinetics followed the Higuchi-F0 order at pH 7.4 and first-order at pH 4, indicating sustained antibacterial effects. The hydrogels were non-toxic, non-hemolytic, and exhibited enhanced fibroblast cell migration, suggesting wound-healing potential. Their antioxidant properties and strong antibacterial activity, particularly against S. aureus, underscore their promise in antibacterial drug delivery. These findings collectively emphasize the promising attributes of the developed hydrogels, positioning them as strong candidates for antibacterial drug delivery through dermal administration. Future investigations into these drug-loaded hydrogels hold promise for significant advancements in dermatological and wound care treatments, offering an innovative and efficient strategy to combat bacterial infections and promote optimal wound healing.
Author contributions
JP and KP: conceptualization, methodology, investigation, data curation, and writing – original draft preparation and editing. DBS: conceptualization and writing – reviewing and editing. SVP: project administration, conceptualization, methodology, supervision, writing – reviewing and editing. JK and RS: antibacterial experimental methodology and study.
Data availability
All data underlying the results are available in figures and tables as part of the article.
Conflicts of interest
The authors declare no competing financial interest.
Acknowledgements
The authors acknowledge the SAIF facility of DST at Panjab University, Chandigarh, India and the DST-FIST and UGC-CAS funded facility of UIPS used for analysis and characterization. KP is grateful to CSIR for her SRF [File No: 09/0135(13255)/2022-EMRI].
References
- H. Liu, C. Wang, C. Li, Y. Qin, Z. Wang, F. Yang, Z. Li and J. Wang, RSC Adv., 2018, 8, 7533–7549 RSC.
- M. Soleimanpour, S. S. Mirhaji, S. Jafari, H. Derakhshankhah, F. Mamashli, H. Nedaei, M. R. Karimi, H. Motasadizadeh, Y. Fatahi, A. Ghasemi, M. S. Nezamtaheri, M. Khajezade, M. Teimouri, B. Goliaei, C. Delattre and A. A. Saboury, Sci. Rep., 2022, 12, 1–17 CrossRef.
- S. S. Mirhaji, M. Soleimanpour, H. Derakhshankhah, S. Jafari, F. Mamashli, M. Rooki, M. R. Karimi, H. Nedaei, M. Pirhaghi, H. Motasadizadeh, A. Ghasemi, M. S. Nezamtaheri, F. Saadatpour, B. Goliaei, C. Delattre and A. A. Saboury, Int. J. Biol. Macromol., 2023, 241, 124529 CrossRef CAS.
- P. Pothal, K. Pathania, S. Kumar, J. Kaur, S. P. Sah, R. Singh and S. V. Pawar, Mater. Lett., 2023, 337, 133956 CrossRef CAS.
- K. Pathania, S. P. Sah, D. B. Salunke, M. Jain, A. K. Yadav, V. G. Yadav and S. V. Pawar, Int. J. Biol. Macromol., 2023, 229, 684–695 CrossRef CAS PubMed.
- E. Capecchi, D. Piccinino, I. Delfino, P. Bollella, R. Antiochia and R. Saladino, Nanomaterials, 2018, 8(6), 438 CrossRef PubMed.
- S. Adila, N. Suyatma, A. Firlieyanti and A. Bujang, Adv. Mater. Res., 2013, 748, 155–159 Search PubMed.
- N. Limpan, T. Prodpran, S. Benjakul and S. Prasarpran, Food Hydrocolloids, 2012, 29, 226–233 CrossRef CAS.
- M. Olszewska, Wiad. Lek., 2006, 59, 829–833 Search PubMed.
- F. Masood, M. A. Makhdoom, I. A. Channa, S. J. Gilani, A. Khan, R. Hussain, S. A. Batool, K. Konain, S. U. Rahman, A. Wadood, M. N. bin Jumah and M. A. U. Rehman, Gels, 2022, 8(10), 676 CrossRef CAS.
- Y. Zhang, M. Jiang, Y. Zhang, Q. Cao, X. Wang, Y. Han, G. Sun, Y. Li and J. Zhou, Mater. Sci. Eng., C, 2019, 104, 110002 CrossRef CAS PubMed.
- J. Buckman, S. A. Bankole, S. Zihms, H. Lewis, G. Couples and P. W. M. Corbett, Geosciences, 2017, 7(3), 70 CrossRef.
- A. Varadarajan, R. M. Badani Prado, K. Elmore, S. Mishra and S. Kundu, Soft Matter, 2023, 20, 869–876 RSC.
- K. Enoch and A. A. Somasundaram, Surf. Interfaces, 2023, 41, 103178 CrossRef CAS.
- I. P. Merlusca, D. S. Matiut, G. Lisa, M. Silion, L. Gradinaru, S. Oprea and I. M. Popa, Polym. Bull., 2018, 75, 3971–3986 CrossRef CAS.
- P. Cervini, B. Ambrozini, L. C. M. Machado, A. P. G. Ferreira and É. T. G. Cavalheiro, J. Therm. Anal. Calorim., 2015, 121, 347–352 CrossRef CAS.
- S. Alven and B. A. Aderibigbe, Int. J. Mol. Sci., 2021, 21(24), 9656 CrossRef.
- C. Alberto-Silva, F. B. M. Malheiros and S. M. Querobino, Future J. Pharm. Sci., 2020, 6, 98 CrossRef.
- I. M. Jipa, A. Stoica, M. Stroescu, L. M. Dobre, T. Dobre, S. Jinga and C. Tardei, Chem. Pap., 2012, 66, 138–143 CAS.
- F. Luzi, E. Pannucci, L. Santi, J. M. Kenny, L. Torre, R. Bernini and D. Puglia, Polymers, 2019, 11, 1–20 Search PubMed.
- S. Schreml, R. M. Szeimies, L. Prantl, M. Landthaler and P. Babilas, J. Am. Acad. Dermatol., 2010, 63, 866–881 CrossRef PubMed.
- H. Chopra, S. Bibi, S. Kumar, M. S. Khan, P. Kumar and I. Singh, Gels, 2022, 8(2), 111 CrossRef CAS.
- L. Li, J. Guo and R. Xiong, Polym. Test., 2021, 94, 106982 CrossRef CAS.
- R. A. McBath and D. A. Shipp, Polym. Chem., 2010, 1, 860–865 RSC.
- D. Tempfli, E. Borbás, H. Pataki, D. Csicsák, G. Völgyi, B. Sinkó and K. Takács-Novák, Eur. J. Pharm. Sci., 2020, 149, 0–6 CrossRef CAS PubMed.
- C. Song, H. Yu, M. Zhang, Y. Yang and G. Zhang, Int. J. Biol. Macromol., 2013, 60, 347–354 CrossRef CAS.
- V. K. Thakur and M. K. Thakur, Int. J. Biol. Macromol., 2015, 72, 834–847 CrossRef CAS PubMed.
- A. Uberoi, A. McCready-Vangi and E. A. Grice, Nat. Rev. Microbiol., 2024, 22(8), 507–521 CrossRef CAS PubMed.
- D. M. Rocca, J. P. Vanegas, K. Fournier, M. C. Becerra, J. C. Scaiano and A. E. Lanterna, RSC Adv., 2018, 8, 40454–40463 RSC.
- J. Li and S. Zhuang, Eur. Polym. J., 2020, 138, 109984 CrossRef CAS.
|
| This journal is © The Royal Society of Chemistry 2024 |
Click here to see how this site uses Cookies. View our privacy policy here.  Open Access Article
 cd and
Sandip V.
Pawar
 *a
*a


![[double bond, length as m-dash]](https://www.rsc.org/images/entities/char_e001.gif) O stretching), 1413 cm−1 (N–H bending), 1158 cm−1 (asymmetric C–O–C stretching vibrations), and 1075 cm−1 (symmetric C–O stretching vibrations of the 10-OH group).17 For chondroitin sulphate (Fig. S1, ESI†), the bands observed at 3436 cm−1 were due to N–H streching, those at 1246–1063 cm−1 were due to the sulphate ester group, that at 1640 cm−1 was due to the carboxylate group (C
O stretching), 1413 cm−1 (N–H bending), 1158 cm−1 (asymmetric C–O–C stretching vibrations), and 1075 cm−1 (symmetric C–O stretching vibrations of the 10-OH group).17 For chondroitin sulphate (Fig. S1, ESI†), the bands observed at 3436 cm−1 were due to N–H streching, those at 1246–1063 cm−1 were due to the sulphate ester group, that at 1640 cm−1 was due to the carboxylate group (C![[double bond, length as m-dash]](https://www.rsc.org/images/entities/char_e001.gif) O streching vibrations) and those at 1129–1063 cm−1 and 950–850 cm−1 were due to the presence of pyranose and furanose rings.18 For PVA (Fig. S1, ESI†), the IR bands were observed at 3780, 2917, 2858, 1690, and 1425 cm−1. These peaks are assigned to the O–H stretching vibration of the hydroxy group, CH asymmetric stretching vibration, C
O streching vibrations) and those at 1129–1063 cm−1 and 950–850 cm−1 were due to the presence of pyranose and furanose rings.18 For PVA (Fig. S1, ESI†), the IR bands were observed at 3780, 2917, 2858, 1690, and 1425 cm−1. These peaks are assigned to the O–H stretching vibration of the hydroxy group, CH asymmetric stretching vibration, C![[double bond, length as m-dash]](https://www.rsc.org/images/entities/char_e001.gif) O carbonyl stretch, C–H bending vibration of CH2, C–H deformation vibration, C–O stretching of acetyl groups and C–C stretching vibration.19 For lignin (Fig. S1, ESI†), the bands at 3419 cm−1 are due to the O–H stretching vibration and bands near 2857 cm−1 are due to the asymmetric C–H stretching vibration. The peaks at 1592 and 1518 cm−1 are due to the skeletal vibration and stretching vibration of the aromatic ring, absorption at 1274 cm−1 can be attributed to the C–O stretch, and the peaks at 1030–1300 cm−1 are attributed to C–C, C–O, and ether functionalities.5 In Fig. 4, the drug-loaded hydrogel showed peaks of both the blank hydrogel and drug (OTC) thus confirming the successful entrapment of drug in the hydrogel.
O carbonyl stretch, C–H bending vibration of CH2, C–H deformation vibration, C–O stretching of acetyl groups and C–C stretching vibration.19 For lignin (Fig. S1, ESI†), the bands at 3419 cm−1 are due to the O–H stretching vibration and bands near 2857 cm−1 are due to the asymmetric C–H stretching vibration. The peaks at 1592 and 1518 cm−1 are due to the skeletal vibration and stretching vibration of the aromatic ring, absorption at 1274 cm−1 can be attributed to the C–O stretch, and the peaks at 1030–1300 cm−1 are attributed to C–C, C–O, and ether functionalities.5 In Fig. 4, the drug-loaded hydrogel showed peaks of both the blank hydrogel and drug (OTC) thus confirming the successful entrapment of drug in the hydrogel.


