 Open Access Article
Creative Commons Attribution 3.0 Unported Licence
Role of intermolecular charge transfer towards fluorometric detection of fluoride ions with anthrapyrazolone derivatives†
Gomathi
Sivakumar
,
Anashwara
Babu
,
Anubhab
Das
,
Mageshwari
Anandhan
 ,
Venkatramaiah
Nutalapati
 * and
Samarendra
Maji
 *
*
Department of Chemistry, Faculty of Engineering and Technology, SRM Institute of Science and Technology (SRMIST), Kattankulathur, Tamil Nadu-603203, India. E-mail: nvenkat83@gmail.com; venkatrv1@srmist.edu.in; samarenr@srmist.edu.in
First published on 21st October 2024
Abstract
Anion detection using small molecules as chemosensors holds significant importance in the biological and environmental fields, offering several advantages over conventional methods. In this report, we have developed three anthrapyrazolone derivatives, namely 2,7-dihydrobenzo[1,2,3-cd:4,5,6-c′d′]bis(indazole) (DHBBI), 2-(benzo[1,2,3-cd:4,5,6-c′]bis(indazole)-2(7H)-yl)ethanol (DHBBI-OH), and 2,2′-(benzo[1,2,3-cd:4,5,6-c′d′]bis(indazole)-2,7-diyl)diethanol (DHBBI-2-OH), utilizing straightforward chemical reactions. These compounds were investigated for the fluorometric detection of a series of anions viz. F−, Cl−, Br−, I−, OH−, CN−, ClO4−, SO42−, NO3− and SCN− in the form of tetrabutylammonium salts. Detailed photophysical and mechanistic investigations were conducted to understand the interactions of three fluorophores with different anions. Fluorescence analysis showed considerable changes in the emission intensity of the three fluorophores in the presence of a series of anions as mentioned earlier. Among the synthesized molecules, DHBBI (Ksv = 11.6 × 10⁴ M−1) exhibited the highest selectivity with ∼1.30 and 1.80 fold higher association rate constants and sensitivity with a limit of detection of ∼10.3 mM towards F− ions compared to DHBBI-OH and DHBBI-2-OH. The selectivity and sensitivity towards F− ions were demonstrated in light of hydrogen-bonding interactions between DHBBI and F− ions. Additionally, DFT and TDDFT studies were employed for DHBBI and its derivatives to investigate their structural insights and electronic properties comprehensively.
1. Introduction
The interest in creating new, compact, and efficient compounds for precise qualitative and quantitative anion detection as chemical sensors is growing rapidly.1–7 Research on novel chemosensors for anion detection through hydrogen bond interactions8 has been an active topic due to the significance of anions in a wide range of therapeutic,4,9,10 environmental,11–13 and biological activities.14–16 Much of the research has focused on optical sensors for anions, which detect changes in colour or fluorescence intensity.17,18 Additionally, these sensors using the spectroscopic technique for monitoring anions have several benefits, including high selectivity, sensitivity and real-time monitoring, and provide detailed molecular information. These devices are easy to use and have acquired attention for the above reasons.19,20 Despite being sensitive to environmental factors, their versatility and non-destructive nature make them essential in scientific and industrial applications. Consequently, selective anion detection using these methods is vital. The ability of spectroscopic methods to detect multiple analytes offers significant advantages over other sensing techniques, such as electrochemical analysis, capillary electrophoresis, and high-performance liquid chromatography (HPLC), due to its rapid response and simplicity.21–26Fluoride ions (F−), despite their small size, have significant biological roles, including in dental health and osteoporosis treatment, but they can also cause environmental and health risks.27–32 Additionally, F− is a crucial mineral for the proper growth, development, and maintenance of healthy hair, nails, teeth, and bones. Sodium fluoride (NaF) is a component of toothpaste and plays a vital role in promoting body growth. A F− concentration of 0.5 to 1.0 ppm in drinking water is believed to be effective for promoting metabolism. Whereas, high amounts of F− can result in environmental damage and give rise to diseases such as dental or skeletal fluorosis, nephrotoxic consequences and urolithiasis in human beings. Moreover, there is a correlation between F− toxicity with enhanced bone density, elevated risks of cancer, gastrointestinal problems, and kidney damage.33,34 Hence, it is important to identify the presence of hazardous levels of F− using a straightforward approach and take appropriate measures to reduce the potential risks to both human health and the environment.35
Recently, fluorophores have been designed and reported as colorimetric and fluorometric anion sensors. These sensors utilize various signalling blocks, such as anthracene,36,37 dansyl38,39 imidazole,40,41 anthraquinone,42,43 indole,44,45 nitrobenzene azo groups,46,47 and other conjugated moieties,48 which are covalently connected to anion receptors.
Yadav and his team developed 1,8-naphthalimide-derived chromo-fluorogenic chemosensors to detect F− ions, with detection limits of 1.34 nM.49 Li et al. designed boronic acid-pyrene derived carbon dot-based fluorophores and used them to sense F− with LOD of 5.9 × 10⁻⁵ M.50 Wu et al. developed 4-(2,2-dichloroacetamide)-N-n-butyl-naphthalimide and 1,8-naphthalimide (CNA) probes to detect F− ions using colorimetric and fluorescence methods. The CNA was able to identify F− with LODs of 0.52 μM from fluorescence spectra and 1.41 μM from ratiometric absorption spectra.51
Besides the widely used fluorophore molecules mentioned above, anthrapyrazolone stands out as a significant organic fluorophore due to its remarkable properties, such as intense fluorescence emission in the visible range, high photostability, and exceptional sensitivity for analyte detection.52,53 These properties make it highly suitable for sensor applications, particularly in biological samples and environmental pollutant monitoring. Its versatility has led to widespread use in the design of synthetic structures and materials. Prasad and his coworkers studied the use of a small fluorescent molecule, 1,9-pyrazoloanthrone, as a “turn-on” fluorescence probe for the detection of CN− and F− ions. Although this molecule has primarily been employed as an inhibitor for c-JUN N-terminal kinase (JNK1/2), its potential in ion detection was highlighted and demonstrated selective fluorometric detection towards CN− and F− ions among seven anions.52 Maji et al. conducted a study using copolymer and 1,9-pyrazoloanthrone derivatives to detect 2,4,6-trinitrophenol with a LOD of ∼83 μM.53 In addition to this study, the same group designed an anthrapyrazolone derivative named 2-(benzo[1,2,3-cd:4,5,6-c′d′]bis(indazole)-2(7H)-yl)ethyl methacrylate (DHBBI-MA) specifically for the detection of SCN− and F− ions.54 To the best of our knowledge, there have been few reports of a single molecular probe capable of selectively detecting and distinguishing single anionic species.
Thus, herein this study, we have synthesized and characterized anthrapyrazolone-based molecules: 2,7-dihydrobenzo[1,2,3-cd:4,5,6-c′d′]bis(indazole) (DHBBI), 2-(benzo[1,2,3-cd:4,5,6-c′]bis(indazole)-2(7H)-yl)ethanol (DHBBI-OH), and 2,2′-(benzo[1,2,3-cd:4,5,6-c′d′]bis(indazole)-2,7-diyl)diethanol (DHBBI-2-OH), and thoroughly examined their mechanism of molecular interactions with F− anions. The impact of increasing the number of hydroxyalkyl units in anthrapyrazolone derivatives on the F− anion's selectivity and sensitivity was investigated using fluorescence methods to determine the effect of hydrogen bonding interaction with the hydroxyl group that may influence the detection. Interference analysis with various other anions was demonstrated for the selectivity of DHBBI. Computational analysis using the DFT method provided insight into the electronic characteristics of molecular hydrogen bonding that support the experimental observations.
2. Materials and methods
2.1. Materials
All solvents and chemicals utilized in this study were of analytical grade and used without further purification. 1,5-Dichloroanthraquinone and hydroquinone were obtained from Sigma Aldrich with purity >98%, while 2-bromoethanol (>97% Purity) was procured from TCI Chemicals (India) Pvt. Ltd. Pyridine (98% purity) and sodium acetate (CH3COONa) (97% purity) were obtained from Lobachemie Pvt. Ltd. India. Hydrazine monohydrate (>98.0% purity), triethylamine (TEA) (99% purity), N,N-dimethylformamide (DMF), dichloromethane (DCM), ethyl acetate (EA), methanol, and hexane were supplied by Finar Chemicals Limited, India. Additionally, 4-dimethylaminopyridine (DMAP), potassium carbonate (K2CO3) with >99.0% purity, and acetonitrile (ACN) were acquired from Sisco Research Laboratories Pvt. Ltd. (SRL), India. All these solvents were distilled prior to use in reactions.2.2. Characterization
The UV-vis absorption spectra for DHBBI, DHBBI-OH, and DHBBI-2-OH were measured in acetonitrile (ACN) using an Agilent Cary 60 UV-vis spectrophotometer. Fourier transform infrared (FT-IR) spectra were analyzed within the 4000–400 cm−1 range using a Shimadzu IRTracer-100 FT-IR spectrometer. 1H-NMR spectra were obtained using Bruker 500 MHz NMR spectrometers with DMSO-d6 as the solvent. The ESI-MS spectra of DHBBI, DHBBI-OH, and DHBBI-2-OH were characterized using an Agilent 6230B Time-of-Flight (TOF) mass spectrometer. The Edinburgh FLS-1000 spectrofluorometer was used for room-temperature fluorescence investigations. Fluorescence lifetime decay in ACN was measured using a 380 nm LED and a 450 nm diode laser as the excitation source. A cuvette was filled with a solution of 3.0 mL DHBBI and its derivatives (10 μM), and the preliminary emission was obtained with 400 nm excitation. An aliquot of 10 μL of analyte solution prepared in ACN was added to the cuvette. Following every addition of the analyte, the cuvette was closed and thoroughly stirred, and a fluorescence spectrum was recorded. This method was continued with different analyte concentrations to get significant fluorescence quenching. The Stern–Volmer equation (eqn (1)) was then used to determine the Stern–Volmer association rate constants (Ksv).| I0/I = 1 + Ksv [Q] | (1) |
| Eint = Ecomplex − (Ecompound + Eanion) | (2) |
2.3. Synthesis of 2,7-dihydrobenzo[1,2,3-cd:4,5,6-c′d′]bis(indazole) [DHBBI]
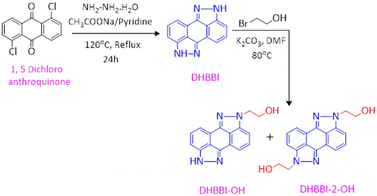
The DHBBI molecule was synthesized using the method outlined in the literature (Scheme 1).54 In a 250 mL round-bottom flask, 5.0 g (18 mmol) of 1,5-dichloroanthraquinone and 3.6 g (43 mmol) of sodium acetate were combined with 25 mL of pyridine. To this mixture, 6 mL of hydrazine monohydrate was added, and the reaction was refluxed at 120 °C for 24 h under a nitrogen atmosphere. The progress of the reaction was monitored by thin-layer chromatography (TLC). Vacuum distillation was used to extract the pyridine once the reaction was complete. The crude product was then purified using column chromatography with a 70![[thin space (1/6-em)]](https://www.rsc.org/images/entities/char_2009.gif) :
:![[thin space (1/6-em)]](https://www.rsc.org/images/entities/char_2009.gif) 30 solvent mixture of dichloromethane (DCM) and ethyl acetate (EA). Finally, pure 2,7-dihydrobenzo[1,2,3-cd:4,5,6-c′d′]bis(indazole) (DHBBI) was obtained by removing the solvents under reduced pressure, yielding 3.1 g (74%). 1H NMR (500 MHz, DMSO-d6) δ (ppm): 13.149 (s, 2H), 7.47–7.37 (m, 6H). ESI-MS calculated for C14H8N4: 232.07, found: m/z = 233.05 [M + H]+.
30 solvent mixture of dichloromethane (DCM) and ethyl acetate (EA). Finally, pure 2,7-dihydrobenzo[1,2,3-cd:4,5,6-c′d′]bis(indazole) (DHBBI) was obtained by removing the solvents under reduced pressure, yielding 3.1 g (74%). 1H NMR (500 MHz, DMSO-d6) δ (ppm): 13.149 (s, 2H), 7.47–7.37 (m, 6H). ESI-MS calculated for C14H8N4: 232.07, found: m/z = 233.05 [M + H]+.
2.4. Synthesis of 2-(benzo[1,2,3-cd: 4,5,6-c′d′]bis(indazole)-2(7H)-yl)ethanol [DHBBI-OH] and 2,2′-(benzo[1,2,3-cd:4,5,6-c′d′]bis(indazole)-2,7-diyl)diethanol [DHBBI-2-OH]
These compounds were synthesized following a procedure from the literature.54 The reaction involved treating 1.94 g (8.35 mmol) of dihydrobenzoindazole with 2 mL of 2-bromoethanol in the presence of anhydrous K2CO3 (3.5 g, 25 mmol) using dimethylformamide (DMF) as the solvent. The mixture was heated to 80 °C under N2 conditions (Scheme 1). TLC was used to monitor the reaction, revealing the formation of mono- and di-substituted ethanol derivatives of DHBBI. After completion, the DMF was removed by vacuum distillation, and the crude products were purified by silica chromatography (60–120 mesh) using a 60![[thin space (1/6-em)]](https://www.rsc.org/images/entities/char_2009.gif) :
:![[thin space (1/6-em)]](https://www.rsc.org/images/entities/char_2009.gif) 40% mixture of EA and DCM. The solvents were then evaporated under reduced pressure to yield DHBBI-OH (1.2 g, 37.5%) with 1H NMR (500 MHz, DMSO-d6) δ (ppm): 13.19 (s, 1H), 7.51–7.40 (m, 6H), 4.97 (t, J = 5.1 Hz, 1H), 4.50 (t, J = 5.4 Hz, 2H), 3.89 (q, J = 5.6 Hz, 2H). ESI-MS calculated for C16H12N4O: 276.10, found: m/z = 277.15 [M + H]+, and DHBBI-2-OH (0.520 g, 15.6%) with 1H NMR (500 MHz, DMSO-d6) δ (ppm): 7.53–7.44 (m, 6H), 4.9 (t, J = 4.75 Hz, 2H), 4.490 (t, J = 5.45 Hz, 4H), 3.89 (q, J = 5.5 Hz, 4H) and ESI-MS calculated for C18H16N4O2: 320.13, found: m/z = 320 [M]+.
40% mixture of EA and DCM. The solvents were then evaporated under reduced pressure to yield DHBBI-OH (1.2 g, 37.5%) with 1H NMR (500 MHz, DMSO-d6) δ (ppm): 13.19 (s, 1H), 7.51–7.40 (m, 6H), 4.97 (t, J = 5.1 Hz, 1H), 4.50 (t, J = 5.4 Hz, 2H), 3.89 (q, J = 5.6 Hz, 2H). ESI-MS calculated for C16H12N4O: 276.10, found: m/z = 277.15 [M + H]+, and DHBBI-2-OH (0.520 g, 15.6%) with 1H NMR (500 MHz, DMSO-d6) δ (ppm): 7.53–7.44 (m, 6H), 4.9 (t, J = 4.75 Hz, 2H), 4.490 (t, J = 5.45 Hz, 4H), 3.89 (q, J = 5.5 Hz, 4H) and ESI-MS calculated for C18H16N4O2: 320.13, found: m/z = 320 [M]+.
3. Results and discussion
3.1. Synthesis and characterization of, DHBBI, DHBBI-OH, and DHBBI-2-OH
In the current study, three fluorophore molecules, DHBBI, DHBBI-OH, and DHBBI-2-OH were synthesized. To prepare DHBBI, 1,5-dichloroanthraquinone, and hydrazine monohydrate were initially subjected to a condensation process with pyridine and sodium acetate at 120 °C for 24 hours. This process yielded 74% after isolation (Scheme 1). DHBBI-OH and DHBBI-2-OH were produced by reacting DHBBI with 2-bromoethanol at 80 °C in the presence of anhydrous K2CO3. 1H NMR, FT-IR, and mass spectrometry confirmed the chemical structures of the compounds.The 1H NMR spectrum of DHBBI (Fig. S1, ESI†) shows that six aromatic protons appear in the region of δ 7.48–7.38 ppm and the signal at δ 13.19 ppm corresponds to the –NH proton in the indazole moiety. This reveals that 1,5-dichloroanthraquinone condensed with hydrazine hydrate and formed 2,7-dihydrobenzo[1,2,3-cd:4,5,6-c′d′]bis(indazole). ESI-MS results show that the molecular ion peak at m/z 233.05 [M + H]+ validates the formation of the desired DHBBI (Fig. S2, ESI†). The 1H NMR spectrum of DHBBI-OH and DHBBI-2-OH (Fig. S3 and S4, ESI†) shows two new signals observed at δ 3.89 and δ 4.50 ppm with the coupling constants of J = 5.6 Hz and J = 5.4 Hz due to the substitution of two methylene moieties. The signal at δ 3.89 ppm is due to the presence of a –CH2 proton attached to the –OH functional group, and the peak at δ 4.50 ppm is owing to methylene protons linked to the aromatic unit. In addition, the peak around δ 4.97 ppm represents the hydroxyl group from the 2-bromoethanol. The mono-substituted DHBBI-OH was further confirmed by one –NH proton in the aromatic unit (Fig. S3, ESI†). The ESI-MS result of the molecular ion peak at m/z 277.15 [M + H]+ indicates the formation of the expected compound (Fig. S5, ESI†). Similarly, the 1H NMR spectrum of DHBBI-2-OH was also further confirmed due to the absence of the aromatic –NH group, which shows the bi-functionalization of 2-bromoethanol on the DHBBI molecules (Fig. S4, ESI†). The ESI-MS result of bi-functionalized DHBBI-2-OH exhibits the molecular ion peak at m/z 320.0 [M]+ indicating the formation of the expected compound (Fig. S6, ESI†).
The FTIR spectrum of DHBBI showed a characteristic stretching vibration that appeared at 3028 cm−1 due to –NH stretching. Two stretching vibrations at 1660 cm−1 and 1057 cm−1 were attributable to C![[double bond, length as m-dash]](https://www.rsc.org/images/entities/char_e001.gif) N stretching and C–N bending vibrations (Fig. S7a, ESI†). The FTIR spectra of DHBBI-OH and DHBBI-2-OH are shown in Fig. S7b and c (ESI†) respectively.
N stretching and C–N bending vibrations (Fig. S7a, ESI†). The FTIR spectra of DHBBI-OH and DHBBI-2-OH are shown in Fig. S7b and c (ESI†) respectively.
In these spectra, a stretching vibration at 3114 cm−1 and a bending vibration at 1440 cm−1 are observed as a result of the O–H stretching and bending vibrations of the –OH group attached to the alkyl chain. An aromatic N–H stretching vibration appears at 3329 cm−1, and an aliphatic C–H stretching vibration is observed at 2861 cm−1. The C–O and C–N stretching vibrations appear at 1321 cm−1 and 1032 cm−1, respectively, while a medium-poor stretching vibration at 767 cm−1 is corresponding to C![[double bond, length as m-dash]](https://www.rsc.org/images/entities/char_e001.gif) C bending. The FTIR spectrum of DHBBI-2-OH shows all the peaks present in DHBBI-OH, but with improved intensity.
C bending. The FTIR spectrum of DHBBI-2-OH shows all the peaks present in DHBBI-OH, but with improved intensity.
The photophysical properties of the DHBBI, DHBBI-OH, and DHBBI-2-OH were analyzed through UV-visible and fluorescence spectroscopy in an ACN medium. The DHBBI exhibits a wide absorption band at 299 ± 2 nm due to the π → π* transition together with a small absorption band at 369.63 ± 2 and 388.7 ± 2 nm owing to the intramolecular charge transfer transition (Fig. 1a). The UV-vis absorption spectra of DHBBI-OH and DHBBI-2-OH show short broad bands at 300 nm and 307 nm, respectively, with highly intense vibronic absorption bands at 360, 377, and 400 nm for DHBBI-OH and 367, 386, and 408 nm for DHBBI-2-OH. In the case of DHBBI-OH and DHBBI-2-OH, the absorption bands are primarily attributed to the π → π* and n → π* transition. All three molecules show a similar absorption pattern in ACN with minimal variations in the absorption values that depend on the ethanol side chains on DHBBI. In DHBBI, the electron density is primarily localized on the π-conjugated anthrapyrazolone moiety. When hydroxyalkyl groups are added to form DHBBI-OH and DHBBI-2-OH, this electron density extends the anthrapyrazolone moiety to the hydroxyalkyl groups. This extension causes a redshift in the intramolecular charge transfer band. The significant redshift in the absorption spectrum of DHBBI-OH and DHBBI-2-OH compared to DHBBI suggests a highly planar molecular backbone with electron density concentrated on the anthrapyrazolone moiety.55 These findings are further validated by DFT and TDDFT studies. Fig. 1b displays the fluorescence spectra of three molecules upon excitation at λex = 368 nm. DHBBI exhibits emission bands at 391 nm, 414 nm, and 439 nm. The emission spectrum of DHBBI-OH shows highly intense emission bands at 403, 425 nm, and 451 nm. Similarly, the DHBBI-2-OH molecule shows intense emission bands at 410 nm, 435 nm, and 461 nm. All DHBBI derivatives exhibit an intense blue emission in the ACN solvent with a Stokes shift of 50 ± 20 nm. The obtained emission spectra of all DHBBI derivatives are independent of the excitation wavelength, resulting in emission from the S1 → S0 state. Like the absorption spectra, the emission spectra also exhibited a red shift from DHBBI to DHBBI-2-OH. Strong intramolecular interactions in DHBBI derivatives cause a red shift in the emission wavelength.
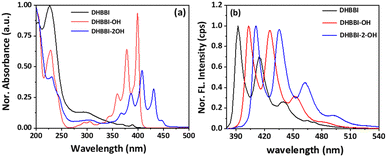 | ||
| Fig. 1 (a) UV-visible and (b) fluorescence emission spectra of DHBBI, DHBBI-OH, and DHBBI-2-OH in ACN solution. | ||
The optimized geometries of all studied molecules (DHBBI, DHBBI-OH, DHBBI-2-OH) were obtained using the B3LYP/6-31g* method in the Gaussian 09 suite of programs and as shown in Fig. 2a. The selected bond lengths, bond angles, and dihedral angles of the designed compounds are listed in Table S1 (ESI†). The optimized structures of DHBBI, DHBBI-OH, and DHBBI-2-OH are almost planar. Furthermore, the frontier molecular orbitals of DHBBI and its derivatives showed that the electron density of both the HOMO and LUMO was predominantly localized on the entire π-conjugated anthrapyrazolone moiety. The HOMO–LUMO energy levels, electron density distribution, and band gap for the DHBBI, DHBBI-OH, and DHBBI-2-OH were calculated. The HOMO and LUMO energy levels of DHBBI are −5.37 eV and −1.79 eV, respectively, with an estimated band gap of 3.58 eV (Fig. 2b). Functionalization with 2-bromoethanol (DHBBI-OH and DHBBI-2-OH) decreases the HOMO–LUMO energy gap, resulting in band gaps of 3.51 eV for DHBBI-OH and 3.45 eV for DHBBI-2-OH. Both mono and di-substituted derivatives exhibit the same electronic structures, although the energy levels are lower due to functionalization. The HOMO electron density of DHBBI is located on the π-conjugated anthrapyrazolone moiety, while in the case of DHBBI-OH and DHBBI-2-OH, it extends to the functionalized ethanol units. The LUMO electron density remains primarily on the central core, indicating a charge transfer process similar to DHBBI.
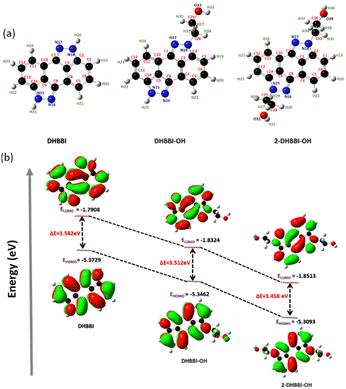 | ||
| Fig. 2 (a) Optimized geometry and (b) energy profile diagram of DHBBI, DHBBI-OH, and DHBBI-2-OH obtained using DFT/B3LYP/6-31g*. | ||
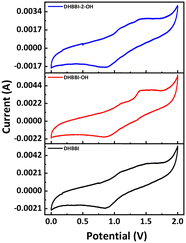
Molecules with higher oxidation potential have a greater tendency to lose electrons and be oxidized. Similarly, the oxidation potentials of DHBBI are higher due to increased electron density in its donor unit, as confirmed by cyclic voltammetry (Fig. 3). The onset oxidation potentials follow the order: DHBBI (1.01 V) > DHBBI-OH (0.97 V) > DHBBI-2-OH (0.93 V). All three molecules exhibit reversible oxidation and reduction peaks. The HOMO and LUMO energy levels, as well as the bandgaps from CV and DFT, are summarized in Table 1. All the DHBBI derivatives exhibit low-lying HOMO energy levels, with DHBBI showing the lowest HOMO energy level, as calculated from its oxidation potential peak position.
| Complex | Electrochemical | DFT | |||
|---|---|---|---|---|---|
| E ox,onset (V) | E red,onset (V) | E HOMO/ELUMOd (eV) | E g,opt (eV) | E g,opt (eV) | |
| a The onset of oxidation of DHBBI, DHBBI-OH, and DHBBI-2-OH. b The onset of the reduction curves of DHBBI, DHBBI-OH, and DHBBI-2-OH. c Optical gap = (1240/λonset). d E HOMO = −[Eox.onset + 4.8] eV, ELUMO = EHOMO + Eg. | |||||
| DHBBI | 1.01 | 1.11 | −5.81/−2.63 | 3.18 | 3.58 |
| DHBBI-OH | 0.97 | 1.20 | −5.77/−2.67 | 3.10 | 3.51 |
| DHBBI-2-OH | 0.93 | 1.21 | −5.73/−2.94 | 2.79 | 3.45 |
The LUMO energies calculated from reduction potential indicate that the addition of hydroxyalkyl units to DHBBI results in a notable decrease in the energy levels of DHBBI-OH and DHBBI-2-OH. This reduction is more significant than that predicted by DFT calculations. Functionalization (DHBBI-OH, DHBBI-2-OH) results in lower HOMO energies and smaller band gaps compared to DHBBI. The frontier orbital energies of these D–π–A systems are suitable for hole and electron injection, enhancing their optoelectronic functionality. The band gap calculated from electrochemical measurements was almost similar to the DFT band gap (Fig. 3 and Table 1).
Electrostatic potential (ESP) surfaces of DHBBI, DHBBI-OH, and DHBBI-2-OH show that the anthrapyrazolone core is an attractive site for electron donors. In DHBBI, N17 and N16 are highly negative. At the same time, DHBBI-OH and DHBBI-2-OH show similar regions at N15, O33, and O31, O39 indicating sites for electrophilic attack (Fig. S8a, ESI†). TD-DFT (B3LYP/6-31g*) calculations were also performed to determine the orbitals involved in the predominant excited-state electronic transitions, and their corresponding energies and oscillator strengths are summarized in Table S2 (ESI†). TD-DFT analysis indicates that the primary electronic transitions (S0 → S1) for these three molecules are HOMO to LUMO transitions. Table S2 (ESI†) demonstrates a gradual increase in oscillator strength from DHBBI to DHBBI-2-OH. This increase is attributed to the improved electronic coupling between the donor and acceptor moieties, which aligns with our findings from optical spectroscopy. As the number of ethanolic groups on the DHBBI molecule increases, the low-energy transition shifts from approximately 360 nm (DHBBI) to 369 nm (DHBBI-OH) and then to 377 nm (DHBBI-2-OH). The differences in absorption maxima between theoretical calculations and experimental observations may be attributed to factors such as solvent molecules, which are not considered in the TD-DFT computations (Fig. S8b and Table S2, ESI†).
3.2. Detection of anions
To study the chemosensing behaviour of the DHBBI and its derivatives, absorption and fluorescence studies were measured in ACN solution at 25 °C. The anion sensing ability of DHBBI, DHBBI-OH, and DHBBI-2-OH was evaluated by spherical anions (F−, Cl−, Br− and I−), linear (OH−, CN−) and large ions (ClO4−, SO42−, NO3−) in the form of tetrabutylammonium salts.Fig. 4a–c shows a change in the emission spectra of DHBBI, DHBBI-OH, and DHBBI-2-OH upon the gradual incorporation of various concentrations of F− ions. Upon the gradual addition of an F− ion (1.7 × 10⁻⁴ M) to the DHBBI, DHBBI-OH, and DHBBI-2-OH, a gradual decrease in the fluorescence emission intensity was observed. The emission intensity of DHBBI decreased by 40% upon the addition of 167 μM of F− ions (Fig. 4a). The emission intensity only decreased by 7–18% when other analytes were added. Fig. 4b shows that the initial intensity of the DHBBI-OH solution was reduced by 19% when 167 μM of F− anions was added. The initial fluorescence intensity of DHBBI-2-OH is quenched by 18% under the same conditions (Fig. 4c).
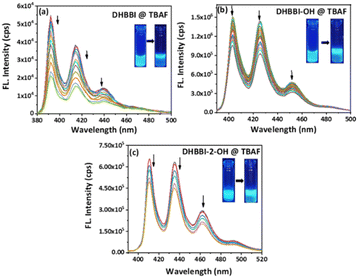 | ||
| Fig. 4 Change in fluorescence emission behaviour of (a) DHBBI, (b) DHBBI-OH and (c) DHBBI-2-OH in ACN (7 × 10⁻⁶ M) upon addition of different concentrations of TBAF (167 μM). | ||
Fluorescence quenching experiments were conducted to analyse the quenching rates, the selectivity for sensing various anions, and their interactions with DHBBI, DHBBI-OH, and DHBBI-2-OH molecules. These studies show that DHBBI exhibits a superior quenching behaviour with the F− ion than the other two derivatives in the order of DHBBI > DHBBI-OH > DHBBI-2-OH. Moreover, the other remaining anions (CN−, OH−, Cl−, Br− and I−, OH−, CN−, ClO4−, SO42−, NO3−, SCN−) did not show considerable change in emission spectra. DFT and TD-DFT were used to study the binding mechanisms of F− with DHBBI and its derivatives (Fig. S9, ESI†). The interaction of the optimized DHBBI and DHBBI-OH probes with the F− ion revealed strong interaction energy between DHBBI and F−, consistent with experimental findings. ESP showed a substantial reduction in electron density at the ring's centre upon complexation with F− due to its high electronegativity. DHBBI@F− displayed the most significant reduction in its electron density as observed from the ESP image (Fig. S10, ESI†). DHBBI-OH also showed reduced electron density with F− (Fig. S11, ESI†), and very minimal changes were observed in the ESP map of DHBBI-2-OH upon anion complexation. The HOMOs and LUMOs were spread over the aromatic rings, with energy differences of 3.582 eV and 3.512 eV for DHBBI and DHBBI-OH, respectively (Fig. S12 and S13, ESI†). Anion complexation led to a significant reduction in the HOMO–LUMO energy gap, confirming intermolecular charge transfer transitions. TD-DFT calculations (Tables S3 and S4, ESI†) provide insights into electronic transitions, indicating redshifts in λmax, with F− causing the most prominent shift due to hydrogen bonding interaction and increased electron density on the nitrogen atom (Fig. S14a and b, ESI†). Fully functionalized DHBBI-2-OH showed negligible changes as the free N–H is not available. These findings enhance the understanding of DHBBI and F− interactions. Fig. S15–S17 (ESI†) summarize the changes in emission intensity for the different analyte concentrations. The rapid drop in emission intensity was detected with a rise in F− ion concentration. Fig. 5 demonstrates the variation of quenching activity while adding fixed (167 μM) concentrations of various anions. The F− with DHBBI displayed the maximum selectivity and quenching efficiency.
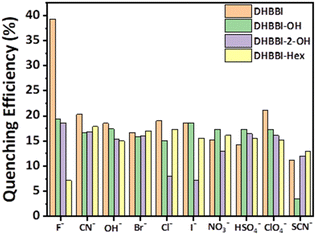 | ||
| Fig. 5 Quenching efficiency of DHBBI, DHBBI-OH, DHBBI-2-OH, and DHBBI-Hex (7 × 10⁻⁶ M) treated with various anions in the form of tetrabutylammonium salts (167 μM). | ||
The Stern–Volmer equation (Ksv) was employed to investigate the sensitivity of fluorescence quenching of DHBBI and its derivatives (eqn (1)). Fig. 6a displays the Ksv plot of the I0/I change in response to different F− ion analyte concentrations. In every case, the I0/I value linearly increased with an increase in the concentration of the F− ion. It is evident that the primary cause of the emission intensity decrease is the static quenching process. The calculated Ksv values are 11.6 × 10⁴ M−1, 8.86 × 10⁴ M−1, and 6.46 × 10⁴ M−1 for DHBBI, DHBBI-OH, and DHBBI-2-OH. Among the synthesized molecules, DHBBI (Ksv = 11.6 × 10⁴ M−1) exhibits association rate constants towards the F− ion that are approximately 1.30 and 1.80 times higher than that of DHBBI-OH (8.86 × 10⁴ M−1) and DHBBI-2-OH (6.46 × 10⁴ M−1), respectively. The larger Ksv values observed for DHBBI indicate efficient binding efficiency with TBAF analyte than other DHBBI derivatives (Fig. 6a and Fig. S18, S19, ESI†). Fig. 6b displays the Ksv data of DHBBI with different anionic analytes at various concentrations. The order of sensitivity for the various studied analytes is TBACN > TBAOH > TBAClO4 > TBACl ≈ TBANO3 > TBAI > TBABr > TBAHSO4 > TBASCN for the DHBBI molecule, according to Table S5 (ESI†), which summarizes the Ksv values. From Table S5 (ESI†), it is clear that DHBBI exhibits a maximum quenching rate constant compared to its other derivatives for TBAF. The decrease in emission intensity of DHBBI and DHBBI-OH is attributed to the free anthrapyrazolone N–H group in the core structure. Conversely, in DHBBI-2-OH, the anthrapyrazolone N–H group was functionalized by 2-bromoethanol, which did not efficiently interact with anions. This suggests that the free anthrapyrazolone N–H group in DHBBI and DHBBI-OH interacts with anions through hydrogen bonding. To understand the role of H bonding interactions of free OH functionality with anions, we have further investigated the emission behaviour with the model compound having hexyl alkyl chains (DHBBI-Hex). Testing of DHBBI-Hex with various anions did not show a response due to the absence of anthrapyrazolone N–H group (Fig. S20 and S21, ESI†) suggesting that free hydroxyl groups do not influence the hydrogen bonding interaction with anions. The strength of hydrogen bond formation for the anthrapyrazolone derivatives with F− anions decreases in the order of DHBBI > DHBBI-OH > DHBBI-2-OH > DHBBI-Hex.
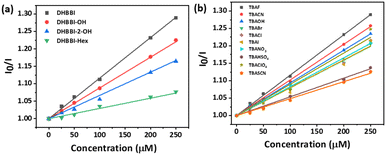 | ||
| Fig. 6 (a) Variation in the Stern–Volmer (Ksv) plot of DHBBI and its derivatives treated with various concentrations of TBAF. (b) Ksv plot of DHBBI upon addition of different anions. | ||
Hence, the interaction with anions is specifically due to the presence of the anthrapyrazolone N–H group in the designed molecules. Plotting of the emission intensities versus F− concentration (Fig. S22, ESI†) helps in calculation of the LOD for DHBBI. The signal-to-noise ratio (SNR) was determined by calculating the final LODs using the formula LOD = 3.3 × σ/m, where σ is the standard deviation and m is the slope. 10.3 mM was determined to be the LOD for DHBBI.
To perform competitive fluorescence quenching, the DHBBI's emission spectra were first measured. To achieve an efficient interaction, 150 μM of Cl− was added to the solution and left to stabilize for 5 min. The addition of Cl− anions caused no substantial change in the emission maximum of the solution. A solution containing F− at a concentration of 150 μM was introduced into the solution, and the resultant emission spectrum was measured, revealing a substantial reduction in fluorescence intensity. The method of incorporating equal quantities of F− and Cl− ions was done multiple times, and the resulting emission spectra were also recorded. The same outcomes were also reported when other anions were employed instead of Cl− (Fig. 7). The investigation demonstrates a reduction in the quenching efficiency, confirming the excellent selectivity of DHBBI for F− ions even in the presence of other anionic analytes.
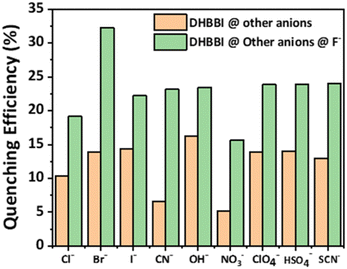 | ||
| Fig. 7 Variation in the fluorescence quenching efficiency of DHBBI upon the addition of different anion analytes, followed by F−. | ||
3.3. Sensing mechanism for F− by DHBBI
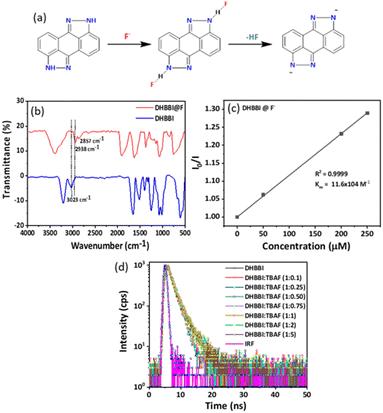
To get more insight into the fluorescence emission quenching mechanism of DHBBI in the presence of F− deep understanding is necessary. The fluorescence of the anthrapyrazolone group is exclusively explained by the intramolecular charge transfer (ICT) transition process. Fluorescence quenching was detected and the intensity of the intermolecular charge transfer transition was reduced upon the incorporation of an F− anion. The presence of the –NH group in the DHBBI causes it to develop a hydrogen bond with the F−. The excitation of DHBBI-F− increases the efficiency of electron transfer and internal conversion, which facilitates the nonradiative transition essential for the quenching of fluorescence. This effect can make the DHBBI a good candidate for sensing F− anions (Fig. 8a). To further clarify the binding mechanism of F− with DHBBI, analysis was performed by using FTIR (Fig. 8b). After the F− ion binding with the DHBBI, the strong and sharp peak observed at 3023 cm−1 became weaker and shifted to a wavenumber of 2938 cm−1 due to the DHBBI and F− interaction. Also, the small peak at 2857 cm−1 could be due to the N–H⋯F stretching after F− binding. The FTIR spectra confirmed that the new peak at 2857 cm−1 is the N–H⋯F stretching after the F− binding through electrostatic interaction. Thus, F− can have the capacity to bind with the DHBBI as a complex form.The rapid quenching of DHBBI by F− anions is due to the development of a significant charge transfer complex in the ground state, facilitated by ion pair electrostatic interactions. Based on the Ksv plot method (Fig. 8c and Table S6, ESI†), it can be shown that the variation in I0/I in relation to the concentration of F− follows a linear pattern. This indicates that the introduction of F− causes the fluorescence to be statically quenched. To verify this procedure, we conducted fluorescence lifetime measurements for DHBBI both before and after the incorporation of different amounts of F− anions. The fluorescence lifetime decay spectra and lifetime values exhibit minimal variation. This indicates that the quenching is a result of static quenching phenomena, as seen in Fig. 8d and Table S6 (ESI†). Thus, it can be confirmed that the presence of static quenching phenomena is the motive for the quenching process.
3.4. Comparison study
The fluorometric detection of F− ions was investigated by using the DHBBI molecule and compared with previously reported probes used for the detection of F− ions. The results, which are compiled in Table S7 (ESI†), demonstrate that the probes utilized in this investigation perform exceptionally well, having high binding constant, with high sensitivity, and selectivity towards F−.4. Conclusion
In conclusion, we have developed three anthrapyrazolone derivatives namely DHBBI, DHBBI-OH, and DHBBI-2-OH with an increase in the alkyl ethanol chains. The successful application of these derivatives as a fluorescence-based material for detecting F− anions has been investigated. Fluorescence experiments demonstrated that, even in the presence of other competing anions, the selectivity and sensitivity for F− ions were significantly higher in the case of DHBBI than that of other anthrapyrazolone derivatives. The outcomes of our research demonstrate that the DHBBI fluorescent molecule has a higher ability to reduce the fluorescence intensity owing to F− ions, with a response that is ∼1.30 and 1.80 folds stronger compared to DHBBI-OH and DHBBI-2-OH. The DHBBI exhibited a higher Stern Volmer rate constant (Ksv = 11.6 × 10⁴ M−1), and LOD of 10.3 mM. The turn-off fluorescence behaviour is triggered by a static quenching mechanism involving intermolecular hydrogen bonding. The interference investigations with various anions have been explained to confirm the selectivity. Finally, DFT and TDDFT studies were employed for DHBBI and its derivatives to investigate their structural, photophysical, and electronic properties comprehensively, which validates the experimental results.Author contributions
The manuscript was written through the contributions of all authors. All authors have approved the final version of the manuscript.Data availability
The data used to support the findings of this study are included within the article.Conflicts of interest
The authors declare no competing financial interest.Acknowledgements
GS, AB and AD thank SRM IST for providing a fellowship to support the PhD program. SM acknowledged SRMIST for providing a seed grant and the Science and Engineering Research Board (SERB), India for a Core research grant (Project Code: CRG/2021/004203).Notes and references
- R. Martínez-Máñez and F. Sancenón, Fluorogenic and chromogenic chemosensors and reagents for anions, Chem. Rev., 2003, 103, 4419–4476 CrossRef PubMed.
- Y. Zhou, Z. Xu and J. Yoon, Fluorescent and colorimetric chemosensors for detection of nucleotides, FAD and NADH: highlighted research during 2004–2010, Chem. Soc. Rev., 2011, 40, 2222 RSC.
- M. Wenzel, J. R. Hiscock and P. A. Gale, Anion receptor chemistry: highlights from 2010, Chem. Soc. Rev., 2012, 41, 480–520 RSC.
- R. M. Duke, E. B. Veale, F. M. Pfeffer, P. E. Kruger and T. Gunnlaugsson, Colorimetric, and fluorescent anion sensors: an overview of recent developments in the use of 1,8-naphthalimide-based chemosensors, Chem. Soc. Rev., 2010, 39, 3936 RSC.
- A. F. Li, J. H. Wang, F. Wang and Y. B. Jiang, Anion complexation and sensing using modified urea and thiourea-based receptors, Chem. Soc. Rev., 2010, 39, 3729 RSC.
- J. L. Sessler, D. G. Cho and V. Lynch, Diindolylquinoxalines: effective indole-based receptors for phosphate anion, J. Am. Chem. Soc., 2006, 128, 16518–16519 CrossRef CAS PubMed.
- M. J. Chmielewski, M. Charon and J. Jurczak, 1,8-Diamino-3,6-dichlorocarbazole: a promising building block for anion receptors, Org. Lett., 2004, 6, 3501–3504 CrossRef CAS.
- P. A. Gale, Anion receptor chemistry, Chem. Commun., 2011, 47, 82–86 RSC.
- L. Wu, J. Liu, P. Li, B. Tang and T. D. James, Two-photon small-molecule fluorescence-based agents for sensing, imaging, and therapy within biological systems, Chem. Soc. Rev., 2021, 50, 702–734 RSC.
- N. V. S. D. K. Bhupathiraju, W. Rizvi, J. D. Batteas and C. M. Drain, Fluorinated porphyrinoids as efficient platforms for new photonic materials, sensors, and therapeutics, Org. Biomol. Chem., 2016, 14, 389–408 RSC.
- Y. Zheng, C. Tan, G. P. C. Drummen and Q. Wang, A luminescent lanthanide complex-based anion sensor with electron-donating methoxy groups for monitoring multiple anions in environmental and biological processes, Spectrochim. Acta, Part A, 2012, 96, 387–394 CrossRef CAS.
- M. K. Goshisht and N. Tripathi, Fluorescence-based sensors as an emerging tool for anion detection: mechanism, sensory materials and applications, J. Mater. Chem. C, 2021, 9, 9820–9850 RSC.
- S. Suganya, J. S. Park and S. Velmathi, Visual sensing of aqueous anions by C2-symmetric chemosensor and its application in real sample analysis, Sens. Actuators, B, 2014, 190, 679–684 CrossRef.
- X. Lou, D. Ou, Q. Li and Z. Li, An indirect approach for anion detection: the displacement strategy and its application, Chem. Commun., 2012, 48, 8462 RSC.
- S. Mizukami, T. Nagano, Y. Urano, A. Odani and K. Kikuchi, A fluorescent anion sensor that works in neutral aqueous solution for bioanalytical application, J. Am. Chem. Soc., 2002, 124, 3920–3925 CrossRef PubMed.
- C. Sonkar, S. Sarkar, N. Malviya, M. L. Kuznetsov and S. Mukhopadhyay, Recognition and mechanistic investigation of anion sensing by ruthenium arene complexes and bio-imaging application, Dalton Trans., 2022, 51, 13071–13084 RSC.
- G. Picci, R. Montis, A. M. Gilchrist, P. A. Gale and C. Caltagirone, Fluorescent and colorimetric sensors for anions: highlights from 2020 to 2022, Coord. Chem. Rev., 2024, 501, 215561 CrossRef.
- B. Bhattacharyya, A. Kundu, N. Guchhait and K. Dhara, Anthraimidazoledione based reversible and reusable selective chemosensors for fluoride ion: Naked-eye, colorimetric and fluorescence “ON–OFF”, J. Fluoresc., 2017, 27, 1041–1049 CrossRef PubMed.
- D. Singhal, N. Gupta and A. K. Singh, The anion recognition properties of a novel hydrazone based on colorimetric and potentiometric studies, Mater. Sci. Eng., C, 2016, 58, 548–557 CrossRef PubMed.
- E. Saikia, M. P. Borpuzari, B. Chetia and R. Kar, Experimental and theoretical study of urea and thiourea based new colorimetric chemosensor for fluoride and acetate ions, Spectrochim. Acta, Part A, 2016, 152, 101–108 CrossRef CAS PubMed.
- R. Hein, P. D. Beer and J. J. Davis, Electrochemical anion sensing: supramolecular approaches, Chem. Rev., 2020, 120, 1888–1935 CrossRef CAS PubMed.
- P. Doble and P. R. Haddad, Indirect photometric detection of anions in capillary electrophoresis, J. Chromatogr. A, 1999, 834, 189–212 Search PubMed.
- S. B. Butt and M. Riaz, Determination of cations and anions in environmental samples by HPLC: review, J. Liq. Chromatogr. Relat. Technol., 2009, 32, 1045–1064 CrossRef CAS.
- D. Y. Lee, N. Singh and D. O. Jang, A benzimidazole-based single molecular multianalyte fluorescent probe for the simultaneous analysis of Cu2+ and Fe3+, Tetrahedron Lett., 2010, 51, 1103–1106 CrossRef CAS.
- N. Kaur and S. Kumar, Single molecular colorimetric probe for simultaneous estimation of Cu2+ and Ni2+, Chem. Commun., 2007, 3069 RSC.
- M. Schmittel and H. W. Lin, Quadruple-channel sensing: a molecular sensor with a single type of receptor site for selective and quantitative multi-Ion analysis, Angew. Chemie., 2007, 119, 911–914 CrossRef.
- J.-M. You, H. Jeong, H. Seo and S. Jeon, A new fluoride ion colorimetric sensor based on dipyrrolemethanes, Sens. Actuators, B, 2010, 146, 160–164 CrossRef CAS.
- D. A. Jose, D. K. Kumar, B. Ganguly and A. Das, Efficient and simple colorimetric fluoride ion sensor based on receptors having urea and thiourea binding sites, Org. Lett., 2004, 6, 3445–3448 CrossRef CAS.
- V. K. Harikrishnan, S. M. Basheer, N. Joseph and A. Sreekanth, Colorimetric and fluorimetric response of salicylaldehyde dithiosemicarbazone towards fluoride, cyanide and copper ions: spectroscopic and TD-DFT studies, Spectrochim. Acta, Part A, 2017, 182, 160–167 CrossRef.
- G. Y. Li, D. Liu, H. Zhang, W. W. Li, F. Wang and Y. H. Liang, TDDFT study on the sensing mechanism of a fluorescent sensor for fluoride anion: inhibition of the ESPT process, Spectrochim. Acta, Part A, 2015, 149, 17–22 CrossRef.
- C. P. Carvalho, R. Ferreira, J. P. Da Silva and U. Pischel, An aminonaphthalimide–putrescine conjugate as fluorescent probe for cucurbituril host–guest complexes, Supramol. Chem., 2013, 25, 92–100 CrossRef.
- A. A. Kumaran, A. Chithrambattu, B. Vedhanarayanan, S. B. A. Rajukrishnan, V. K. Praveen and R. N. Kizhakayil, Fluoride-philic reduced graphene oxide–fluorophore anion sensors, Mater. Adv., 2022, 3, 6809–6817 RSC.
- S. Peckham and N. Awofeso, Water Fluoridation: A Critical Review of the Physiological Effects of Ingested Fluoride as a Public Health Intervention, Sci. World J., 2014, 2014, 1–10 CrossRef PubMed.
- A. K. Mascarenhas and B. A. Burt, Fluorosis risk from early exposure to fluoride toothpaste, Community Dent. Oral Epidemiol., 1998, 26, 241–248 CrossRef.
- H. Matsui, M. Morimoto, K. Horimoto and Y. Nishimura, Some characteristics of fluoride-induced cell death in rat thymocytes: cytotoxicity of sodium fluoride, Toxicol. In Vitro, 2007, 21, 1113–1120 CrossRef PubMed.
- D. E. Gross, V. Mikkilineni, V. M. Lynch and J. L. Sessler, Bis-amidopyrrolyl receptors based on anthracene and carbazole, Supramol. Chem., 2010, 22, 135–141 CrossRef CAS PubMed.
- G. Singh, Pawan, Mohit, Sushma, B. Singh, D. GonzálezSilverac, C. Espinosa-Ruízc, M. A. Estebanc and A. Kaur, Anthracene-based triazolyl triethoxysilanes as selective and colorimetric sensor for cysteine: rationalization towards stability factors, therapeutics evaluation and molecular docking, ChemistrySelect, 2021, 6, 8899–8911 CrossRef CAS.
- N. Wanichacheva, S. Watpathomsub, V. S. Lee and K. Grudpan, Synthesis of a novel fluorescent sensor bearing dansyl fluorophores for the highly selective detection of Mercury(II) ions, Molecules, 2010, 15, 1798–1810 CrossRef.
- J. B. Chae, D. Yun, H. Lee, H. Lee, K.-T. Kim and C. Kim, Highly sensitive dansyl-based chemosensor for detection of Cu2+ in aqueous solution and Zebrafish, ACS Omega, 2019, 4, 12537–12543 CrossRef PubMed.
- M. H. Mahnashi, A. M. Mahmoud, S. A. Alkahtani, R. Ali and M. M. El-Wekil, A novel imidazole derived colorimetric and fluorometric chemosensor for bifunctional detection of copper(II) and sulphide ions in environmental water samples, Spectrochim. Acta, Part A, 2020, 228, 117846 CrossRef.
- S. Manoj Kumar, D. Jothi, S. Munusamy, S. Enbanathan and S. Kulathu Iyer, Imidazole-derived new colorimetric/fluorometric chemosensor for the sensitive recognition of CN− ions: real-time application in food samples and fluorescence bio-imaging, J. Photochem. Photobiol., A, 2023, 434, 114269 CrossRef.
- G. Kumar, N. Gupta, K. Paul and V. Luxami, Acrylonitrile embedded benzimidazole-anthraquinone based chromofluorescent sensor for ratiometric detection of CN− ions in bovine serum albumin, Sens. Actuators, B, 2018, 267, 549–558 CrossRef.
- L. Hou, X. Kong, Y. Wang, J. Chao, C. Li, C. Dong, Y. Wang and S. Shuang, An anthraquinone-based highly selective colorimetric and fluorometric sensor for sequential detection of Cu2+ and S2− with intracellular application, J. Mater. Chem. B, 2017, 5, 8957–8966 RSC.
- G. W. Lee, N.-K. Kim and K.-S. Jeong, Synthesis of biindole−diazo conjugates as a colorimetric anion receptor, Org. Lett., 2010, 12, 2634–2637 CrossRef.
- K. Karuppiah, H. Muniyasamy, M. Sepperumal and S. Ayyanar, Design and synthesis of new salicylhydrazone tagged indole derivative for fluorometric sensing of Zn2+ ion and colorimetric sensing of F− ion: applications in live cell imaging, Microchem. J., 2020, 159, 105543 CrossRef.
- P. Madhusudhana Reddy, S. R. Hsieh, J. K. Chen, C. J. Chang, J. Y. Kang and C. H. Chen, Robust, sensitive and facile method for detection of F−, CN− and Ac− anions, Spectrochim. Acta, Part A, 2017, 186, 8–16 CrossRef PubMed.
- A. E. Prestiani and B. Purwono, Styrene and azo-styrene based colorimetric sensors for highly selective detection of cyanide, Indones. J. Chem., 2017, 17, 238 CrossRef.
- F. Wang, L. Wang, X. Chen and J. Yoon, Recent progress in the development of fluorometric and colorimetric chemosensors for detection of cyanide ions, Chem. Soc. Rev., 2014, 43, 4312 RSC.
- P. Yadav, H. Laddha, M. Agarwal and R. Gupta, Colorimetric assay of fluoride goes digital: on the spot testing of F− ions in water using smartphone's digital imaging and test strip assay by a novel chromofluorogenic receptor based on 1,8-naphthalimide, J. Mol. Liq., 2021, 324, 114690 CrossRef.
- M. Li, X. Li, M. Jiang, X. Liu, Z. Chen, S. Wang, T. D. James, L. Wang and H. Xiao, Engineering a ratiometric fluorescent sensor membrane containing carbon dots for efficient fluoride detection and removal, Chem. Eng. J., 2020, 399, 125741 CrossRef.
- N. Wu, L.-X. Zhao, C.-Y. Jiang, P. Li, Y. Liu, Y. Fu and F. Ye, A naked-eye visible colorimetric and fluorescent chemosensor for rapid detection of fluoride anions: implication for toxic fluorine-containing pesticides detection, J. Mol. Liq., 2020, 302, 112549 CrossRef.
- K. Durga Prasad, N. Venkataramaiah and T. N. Guru Row, 1,9-Pyrazoloanthrone as a colorimetric and “Turn-On” fluorometric chemosensor: structural implications, Cryst. Growth Des., 2014, 14, 2118–2122 CrossRef.
- S. Saravanan, R. Ahmad, S. Kasthuri, K. Pal, S. Raviteja, P. Nagaraaj, R. Hoogenboom, V. Nutalapati and S. Maji, Pyrazoloanthrone-functionalized fluorescent copolymer for the detection and rapid analysis of nitroaromatics, Mater. Chem. Front., 2021, 5, 238–248 RSC.
- S. Saravanan, T. M. Sheeba Rani, A. Deepak Nazare, V. Nutalapati and S. Maji, Fluorometric detection of fluoride and thiocyanate ions using novel anthrapyrazolone derivatives, Mater. Today: Proc., 2021, 40, S241–S247 Search PubMed.
- M. A. Naik, N. Venkatramaiah, C. Kanimozhi and S. Patil, Influence of side-chain on structural order and photophysical properties in thiophene based diketopyrrolopyrroles: a systematic study, J. Phys. Chem. C, 2012, 116, 26128–26137 CrossRef.
Footnote |
| † Electronic supplementary information (ESI) available: 1H NMR, ESI MS, DFT, fluorescence studies, and UV-vis studies. See DOI: https://doi.org/10.1039/d4ma00738g |
| This journal is © The Royal Society of Chemistry 2024 |

