 Open Access Article
Creative Commons Attribution 3.0 Unported Licence
Poultry waste derived in situ drug loaded nano-hydroxyapatite bio-ceramic material for osteomyelitis treatment: in vitro drug release and biocompatibility studies
Mashrafi
Bin Mobarak
 a,
Fariha
Chowdhury
 b,
Md. Najem
Uddin
 c,
Md. Sahadat
Hossain
 a,
Umme Sarmeen
Akhtar
a,
Nazmul Islam
Tanvir
c,
Md Aftab Ali
Shaikh
*de and
Samina
Ahmed
a,
Umme Sarmeen
Akhtar
a,
Nazmul Islam
Tanvir
c,
Md Aftab Ali
Shaikh
*de and
Samina
Ahmed
 *a
*a
aInstitute of Glass and Ceramic Research and Testing (IGCRT), Bangladesh Council of Scientific and Industrial Research (BCSIR), Dhaka 1205, Bangladesh. E-mail: shanta_samina@yahoo.com
bBiomedical and toxicological Research Institute (BTRI), Bangladesh Council of Scientific and Industrial Research (BCSIR), Dhaka 1205, Bangladesh
cBCSIR Dhaka Laboratories, Bangladesh Council of Scientific and Industrial Research (BCSIR), Dhaka 1205, Bangladesh
dBangladesh Council of Scientific and Industrial Research (BCSIR), Dhaka 1205, Bangladesh. E-mail: aftabshaikh@du.ac.bd
eDepartment of Chemistry, University of Dhaka, Dhaka 1000, Bangladesh
First published on 15th November 2024
Abstract
This study presents the preparation of a bone substitute material, nano-hydroxyapatite (nHAp), derived from waste chicken eggshell (WCE), with the incorporation of ciprofloxacin (CF) to harness both the beneficial properties of nHAp and the antibacterial effects of CF in treating osteomyelitis. CF was loaded in situ at three different concentrations: 5, 10 and 15 mg mL−1. The formation of nHAp, along with CF-loaded samples, was confirmed using XRD analysis. Functional group analysis was conducted through FTIR and Raman spectroscopic methods. FESEM analysis was employed to examine morphology and particle size, while EDX study determined elemental composition. The antibacterial activity of CF-loaded samples against Escherichia coli and Staphylococcus aureus increased with higher CF concentrations. Cytocompatibility and hemocompatibility assessments demonstrated the safety of nHAp and CF-loaded nHAp samples under physiological conditions. The bioactive nature of the samples was affirmed by the formation of an apatite layer after immersion in simulated body fluid solution (SBF) for three weeks at 37 °C. CF release kinetics was investigated at room temperature under static conditions for two weeks. The cumulative release percentage of CF decreased with increasing CF concentration, likely due to enhanced interaction between CF and nHAp molecules, as confirmed by XPS and FTIR analysis. WCE-derived nHAp proved to be a promising CF carrier for combating diseases such as osteomyelitis.
1. Introduction
Bone infection, also known as osteomyelitis, is a serious condition characterized by an infection in the bone.1 This infection can be caused by bacteria or fungi entering the bone, leading to symptoms such as pain, swelling, redness, and fever.2 Osteomyelitis can result from various factors like severe injuries, surgeries, or infections spreading through the bloodstream.3 Commonly caused by Staphylococcus aureus bacteria, osteomyelitis can affect individuals of all ages, with children often experiencing infections in long bones like those in the arms and legs, while adults may be more prone to infections in the hips, spine, and feet.4,5 The treatment of osteomyelitis typically involves a two-pronged approach: antibiotics to fight the infection and, in some cases, surgery to remove infected tissue.6 Antibiotics, being the primary weapon to combat osteomyelitis, typically start with intravenous (IV) administration delivered directly into the bloodstream for a week or two, especially for severe cases, to ensure sufficient antibiotics reach the infection site.7 Following initial IV treatment, a switch to oral administration may occur for several weeks. The total duration of antibiotic therapy can vary depending on the severity and type of osteomyelitis. Acute cases may require 4–8 weeks, while chronic infections might need months of treatment.8 Surgery becomes necessary in the case of necrosis (dead bone tissue) along with other foreign objects, which requires operative debridement.9Treating osteomyelitis with antibiotics poses several challenges. These include difficulty penetrating dense bone tissue, bacterial biofilm formation that reduces antibiotic efficacy, the emergence of antibiotic-resistant strains, and the chronic nature of the infection requiring prolonged therapy.10,11 Systemic side effects, drug interactions, and the need for surgical intervention generally add complexity. Additionally, cost, accessibility, complications, and patient compliance issues further complicate treatment.12 Local delivery of antibiotics for osteomyelitis treatment offers several advantages over oral or intravenous administration. These include higher concentrations at the infection site, improved antibiotic penetration into bone tissue, controlled and/or sustained release of drugs, reduced systemic side effects, targeted treatment, faster healing, potential for lower antibiotic dosages, and easy combination with surgical intervention. This approach provides a more efficient, well-tolerated, and effective method for treating osteomyelitis while minimizing systemic antibiotic exposure and associated risks.13–15
Biomaterials serve as effective carriers for local drug delivery, particularly in treating conditions like osteomyelitis. They offer biocompatibility, controlled release, targeted delivery, and protection for drugs, improving therapeutic outcomes while reducing systemic side effects. Additionally, biomaterials can act as scaffolds for tissue regeneration, enhancing their versatility and clinical translation potential.16–18 The biocompatibility of bio-ceramic drug carrier materials is generally excellent, as they are well-tolerated by the body and can integrate well with biological tissues.19 Niosomes, which are non-ionic surfactant-based vesicles, also exhibit good biocompatibility, biodegradability, and low toxicity.20–22 Liposomes, phospholipid-based vesicles, are highly biocompatible and biodegradable, making them suitable for drug delivery applications.23 Polymeric drug carriers, such as those made from polylactic acid (PLA) and polyglycolic acid (PGA), are known for their good biocompatibility and biodegradability, making them safe for biomedical use.24,25 In comparison, while all these materials demonstrate good biocompatibility, CaP based bio-ceramic drug carrier materials stand out for their similarity to natural bone and teeth, enhancing their integration with biological tissues.26,27 Niosomes and liposomes are generally biocompatible but may be unstable and difficult to manufacture in large quantities. Polymeric materials offer versatility and tunability but biocompatibility can vary, and there's a potential for inflammatory response.17
Hydroxyapatite (HAp) is a preferred biomaterial for local drug delivery carriers in the fight against osteomyelitis due to its ability to release drugs effectively.28 While other biomaterials like hydrogels and polymers are also being explored, HAp's unique combination of biocompatibility, bone affinity, and controlled drug release properties make it a strong contender for local antibiotic delivery in osteomyelitis treatment.29–31 Many studies report the use of HAp for the delivery of ciprofloxacin,32,33 amoxicillin,12 doxycycline hyclate,1 vancomycin,29 levofloxacin,34 moxifloxacin,35etc. for the treatment of osteomyelitis, albeit the loading of these drugs into the carrier is a major concern.
In situ loading of drugs into carrier materials offers several advantages over techniques like adsorptive loading and solid-state mixing. It ensures higher encapsulation efficiency and controlled drug release, leading to predictable therapeutic outcomes. Additionally, in situ loading improves the stability of the drug-carrier complex, allows for tailored carrier properties, and minimizes issues such as drug aggregation. Moreover, it reduces processing steps and costs, making it a preferred approach for developing efficient drug delivery systems.32,36,37 In this study, the in situ loading technique was employed to incorporate ciprofloxacin into the gold standard bio-ceramic material, HAp, which was synthesized using WCE. Kumar et al. previously reported the in situ loading of ciprofloxacin into synthetic HAp using Ca(NO3)2·4H2O as the calcium source.32 In contrast, this present work focused on utilizing WCE as a calcium source, given its high calcium content (94–97%)38 and the advantages it offers in terms of cost-effectiveness, environmental sustainability, and the presence of beneficial trace elements that enhance the bioactivity and bone regeneration properties of HAp derived from waste sources.1,39,40 The selection of CF for studying the loading and release profile of HAp was based on the fact that CF possesses a low minimal inhibitory concentration (MIC) against the majority of osteomyelitis-causing pathogens.32,41
2. Materials and methods
2.1. Materials
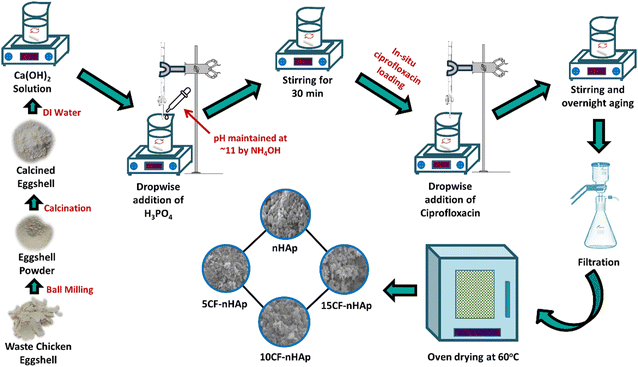
WCE was sourced from cafeterias in close proximity to Dhaka University campus. As the source of P, orthophosphoric acid (H3PO4) (Mark, Germany) was used and ammonia solution (NH4OH) was employed to adjust the pH. Ciprofloxacin hydrochloride (C17H18FN3O3·HCl) was procured from Tokyo Chemical Industry (TCI, Japan), and no additional purification of these chemicals was conducted.2.2. Methods
2.2.5.1. Minimum inhibitory concentration (MIC). The minimum inhibitory concentration (MIC) of the 5CF-nHAp sample was determined using the standard broth dilution method (CLSI M07-A8), as described elsewhere.44,46 In summary, the 5CF-nHAp sample was serially diluted two-fold in Brain Heart Infusion (BHI) broth to determine the MIC. Eight 5CF-nHAp sample concentrations (25 μg mL−1, 12.5 μg mL−1, 6.25 μg mL−1, 3.125 μg mL−1, 1.56 μg mL−1, 0.78 μg mL−1, 0.39 μg mL−1 and 0.12 μg mL−1) were evaluated in relation to a 1 × 10⁵ colony-forming units per milliliter (CFU ml−1) bacterial concentration. Positive control consisted of BHI broth containing the bacterial strain, while negative control consisted of only broth. The samples were incubated for 24 hours at 37 °C in screw cap test tubes. Visual examination of the samples’ turbidity both before and after incubation allowed for the determination of MIC.
2.2.5.2. Minimum bactericidal concentrations (MBCs). The minimum bactericidal concentrations (MBC) study method was similar to the MIC study with a minor addition. Each tube received 2 milliliters of BHI broth media after the MIC was visually determined. The tubes were then re-incubated for 24 hours at 37 °C. Following incubation, a 50 μL sample was taken out of the tubes that did not exhibit any bacterial growth and put on BHI agar plates for bacterial growth observation and culture (incubation at 37 °C for 24 hours).
![[thin space (1/6-em)]](https://www.rsc.org/images/entities/char_2009.gif) :
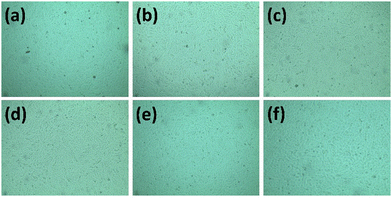
:![[thin space (1/6-em)]](https://www.rsc.org/images/entities/char_2009.gif) 1 ratio), 0.2% gentamycin, and 10% fetal bovine serum (FBS). A total of 3.0 × 10⁴ cells in 200 μL were seeded onto a 48-well plate, followed by a 24-hour incubation at 37 °C with 5% CO2. After this initial incubation, each well received 50 μL of the nHAp and CF-loaded samples, and cytocompatibility was assessed over the course of 48 hours using a trinocular microscope (Optika, Italy), with cell counting performed using an automated cell counter (hemocytometer). Duplicate wells were used for each sample, and this procedure was replicated for all the samples. Cell viability was calculated based on the following equation,47
1 ratio), 0.2% gentamycin, and 10% fetal bovine serum (FBS). A total of 3.0 × 10⁴ cells in 200 μL were seeded onto a 48-well plate, followed by a 24-hour incubation at 37 °C with 5% CO2. After this initial incubation, each well received 50 μL of the nHAp and CF-loaded samples, and cytocompatibility was assessed over the course of 48 hours using a trinocular microscope (Optika, Italy), with cell counting performed using an automated cell counter (hemocytometer). Duplicate wells were used for each sample, and this procedure was replicated for all the samples. Cell viability was calculated based on the following equation,47 | (1) |
 | (2) |
 | (3) |
The release profile of in situ loaded CF from nHAp was evaluated in SBF solution, kept at room temperature (RT, 25 ± 2 °C) for two weeks. A 50 mg of CF-loaded nHAp samples were taken in a beaker where 50 mL of SBF solution was added. The solutions were kept in an incubator and aliquots were collected at different time intervals for UV measurements. The amount of CF released was calculated in terms of cumulative release% (eqn (4)) and absorption values at 272 nm were selected. Fresh SBF solution is added to replace the solution that was removed from the release medium.
 | (4) |
3. Results and discussion
3.1 X-ray powder diffraction study
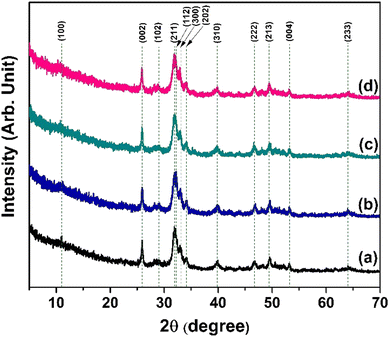
To determine the phase, its purity, and measure the crystallographic factors that are crucial to understanding how hydroxyapatite behaves, X-ray powder diffractometry was used. The XRD patterns of the synthesized nHAp and CF-loaded nHAp samples are shown in Fig. 2. The XRD patterns shown illustrate the formation of HAp phase when compared against the ICDD database. All the patterns are very close to the JCPDS file #09-0432.49 The pattern of HAp is depicted by the characteristic broad peak at around 31°, which corresponds to the (211) plane. Adjacent reflection peaks within the diffraction angle of 31° to 35° are assigned to the (112), (300) and (202) planes, which are also characteristic of HAp phase. Other characteristic diffraction angles and their corresponding planes are: 10° (100), 26° (002), 39° (310), 46° (222), 49° (213), 53° (004) and 64° (233). The absence of sharp and intense peaks in these patterns depicts the poor crystalline nature of HAp. With the introduction of CF in situ, broadening and intensification of diffraction peaks were apparent, which was also observed by Kumar et al.32 The peak broadening with the addition of CF resulted in reduced crystallite size and changes in other crystallographic parameters. The following equations can be used to get the lattice parameter and volume of the unit cell of thee hexagonal HAp structure,50 | (5) |
 | (6) |
Crystallite size is the average size of the coherent domains in a polycrystalline material. Coherent domains are regions of the crystal where the atomic lattice is unbroken.51 The most popular equation for calculating crystallite size is the Scherrer equation, represented as follows,52
 | (7) |
Dislocation density is the number of dislocations per unit volume of a material. Dislocations are defects in the crystal lattice where an extra plane of atoms is inserted or removed. Micro-strain is the localized elastic strain in a material. It can be caused by dislocations, grain boundaries, and other defects in the crystal lattice. Following equations represent the calculative expressions for dislocation density and micro-strain.
 | (8) |
 | (9) |
Crystallinity index (CI) is a measure used to quantify the degree of crystalline order or the extent of crystalline structure within a material, particularly in the context of polymers, plastics, and other materials with both crystalline and amorphous regions. It provides information about the organization and regularity of the atomic or molecular arrangement within a given substance. The CI of nHAp and CF-loaded nHAp is calculated by applying the following equation,
 | (10) |
All the calculated parameters (lattice parameter, volume of unit cell, average crystallite size, dislocation density, micro-strain and CI) are presented in Table 1.
| Sample ID | Lattice parameter (experimental) | Lattice parameter (according to JCPDS file #09-0432) | Average crystallite size (nm) | Dislocation density × 10−3 (lines per nm2) | Micro-strain | Crystallinity index (CI) |
|---|---|---|---|---|---|---|
| nHAp | a = b = 9.4062 Å and c = 6.8842 Å V = 527.4655 Å3 | a = b = 9.4180 Å and c = 6.8840 Å V = 528.80 Å3 | 11.39 | 7.71 | 0.0111 | 0.0363 |
| 5CF-nHAp | a = b = 9.4133 Å and c = 6.883 Å V = 528.1588 Å3 | 5.51 | 32.94 | 0.0228 | 0.0041 | |
| 10CF-nHAp | a = b = 9.4049 Å and c = 6.874 Å V = 526.5719 Å3 | 5.66 | 31.22 | 0.0222 | 0.0044 | |
| 15CF-nHAp | a = b = 9.4033 Å and c = 6.88 Å V = 526.8075 Å3 | 5.51 | 32.94 | 0.0229 | 0.0041 |
The obtained values indicate that in situ addition of CF (5, 10 and 15 mg mL−1) resulted in a reduction in crystallite size compared to the bare nHAp. In addition, the magnitude of dislocation density and micro-strain of HAp increased with the addition of CF. Furthermore, CI decreased with CF addition, which is also evident in the XRD pattern. The volume of the unit cell was the smallest for the 10CF-nHAp sample and the highest for the 5CF-nHAp. The contraction in volume of HAp crystal is evident for 10 and 15 mg mL−1 of CF addition but an increase in volume was observed for 5 mg mL−1 concentrations of CF addition.
3.2. FTIR spectroscopic analysis
To determine the functional groups, present on the synthesized nHAp and CF-loaded nHAp samples, FTIR analysis was carried out. Fig. 3 represents the FTIR spectrum of the synthesized nHAp and the CF-loaded nHAp samples. For the nHAp sample, the characteristic bands for PO43− group were observed at 455, 561, 601, 962, 1022 and 1089 cm−1. These bands can be assigned to symmetrical degenerate bending (ν2, for 455 cm−1), doubly degenerate asymmetric bending (ν4, for 561 and 601 cm−1), non-degenerate symmetric-stretching (ν1, for 962 cm−1) and doubly degenerate asymmetric-stretching (ν3, for 1022 and 1089 cm−1) modes.53 Bands for CO32− group were also observed at 875 and 1419 cm−1.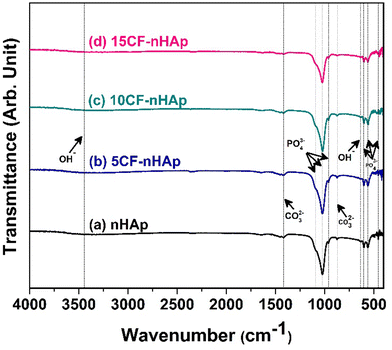 | ||
| Fig. 3 FTIR spectra of the synthesized (a) nHAp, (b) 5CF-nHAp, (c) 10CF-nHAp and (d) 15CF-nHAp samples. | ||
The evolution of bands for carbonate is due to the sensitiveness of the anionic sites of the HAp crystal lattice to CO2 in the atmosphere and during the course of reaction in the alkaline solution, the formation of CO32− is governed by either substituting the PO43− or OH− group of the HAp lattice. Based on the type of substitution, the bands of CO32− can be assigned to A type (at 875 cm−1 for substitution of the OH− group) or B type (at 1419 cm−1 for substitution of the OH− group). The presence of the structural OH− group was observed around 630 cm−1 and 3446 cm−1 albeit with significantly lower intensities.54Fig. 3(b)–(d) represents the FTIR spectrum of CF-loaded nHAp samples. The band observed at around 1631 cm−1 in this spectrum was due to the carbonyl group stretching vibration.32 Shifts in peaks were also observed with the addition of CF. Shift in symmetrical and asymmetrical bending vibrations (459 cm−1 and 559–599 cm−1) was observed for 10CF-nHAp, whereas shift in symmetrical bending and asymmetric-stretching vibration (445 cm−1 and 1024 cm−1) was observed for 15CF-nHAp. However, no shifts in PO43− group vibrations were observed for 5CF-nHAp, which can be attributed to the presence of smaller amounts of CF.
3.3. Raman spectroscopic analysis
Raman spectroscopy was employed to investigate the functional groups and confirm the apatite phase in both pure and CF-loaded nHAp samples. The obtained Raman spectra are presented in Fig. 4. For nHAp, the Raman shift observed at 962 cm−1, corresponds to the characteristic symmetrical P–O stretching of the PO43− group which also confirms the formation of the apatite phase.55 This peak was also observed in the spectrum of CF-loaded HAp samples without any peak shifting. Raman shifts observed at 430, 590, 1044 and 1071 cm−1 are assigned to O–P–O symmetrical bending (ν2), anti-symmetrical bending (ν4) and asymmetric P–O stretching (ν3).56 For the in situ CF-loaded samples, the peak at 1387 cm−1 corresponds to the piperazine stretching of the CF structure, whereas the peak at 1555 cm−1 and 1627 cm−1 corresponds to the cyclopropane ring deformation and CH2 deformation.57 The intensity of these peaks increased with the increasing dosage of CF. Apart from these peaks that correspond to the CF structure, characteristic peaks of HAp were also present in the CF-loaded samples.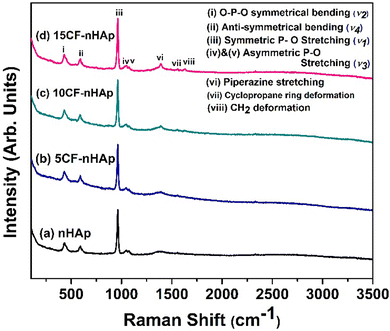 | ||
| Fig. 4 Raman spectra of the synthesized (a) nHAp, (b) 5CF-nHAp, (c) 10CF-nHAp and (d) 15CF-nHAp samples. | ||
3.4. Morphological analysis
Morphological investigation of the nHAp and CF-loaded nHAp samples was carried out in terms of FESEM analysis and the images are shown in Fig. 5. For the nHAp sample (Fig. 5(a)), the particles are seen to be aggregated as well as agglomerated and have an irregular structure with a cylindrical-spherical shape. A similar phenomenon was observed in our previous study.1 With the addition of 5 mg mL−1 CF solution in situ, the shape of the particles (Fig. 5(c)) changed to a more cylindrical rod-shaped structure, albeit irregular-shaped particles are also present. Interestingly, the addition of 10 and 15 mg mL−1 CF solution in situ made the particles shorter in dimension. Agglomeration of particles was also visible for 10CF-nHAp (Fig. 5(e)) and 15CF-nHAp (Fig. 5(g)) samples. Imagej software was utilized for particle size measurements and the procedure for this measurement can be found elsewhere.58 A minimum of 100 particles were selected for measuring the average particle size.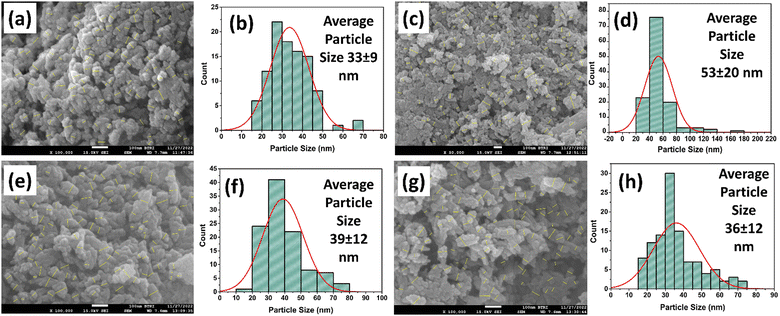 | ||
| Fig. 5 FESEM images with particle selection for size measurements and particle size histograms of nHAp (a) and (b), 5CF-nHAp (c) and (d), 10CF-nHAp (e) and (f) and 15CF-nHAp (g) and (h). | ||
The particle size histograms of the samples are shown in Fig. 5(b), (d), (f) and (h). Based on the statistical data, the average particle size of nHAp has been found to be 33 ± 9 nm. The in situ addition of 5 mg mL−1 CF solution clearly affected the size and shape of the nHAp particles. The average particle size of the 5CF-nHAp sample increased to 53 ± 20 nm. However, in situ addition of 10 and 15 mg mL−1 CF solution caused a decrease in the average particle size (39 ± 12 nm and 36 ± 12 nm for 10CF-nHAp and 15CF-nHAp respectively).
Such observations regarding particle size can be explained by the Ostwald ripening and capping phenomena. According to Ostwald ripening, larger particles grow at the expense of smaller ones due to their lower surface energy. In this case, CF might be influencing the crystal growth process, promoting the growth of larger nHAp crystals at the initial loading (5 mg mL−1). This could explain the observed increase in particle size. However, as the CF concentration increased further (10 and 15 mg mL−1), these CF molecules might start adsorbing onto the surface of the growing nHAp crystals. This capping effect could hinder further crystal growth, leading to the observed decrease in particle size at higher CF concentrations.59
3.5. Elemental analysis by EDX
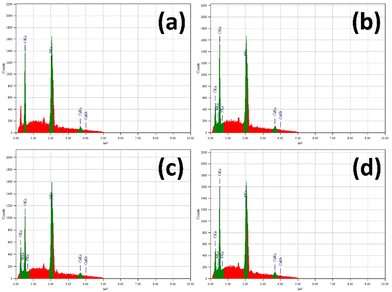
The chemical composition of the samples was analyzed using energy dispersive X-ray (EDX) spectroscopy, as shown in Fig. 6. The expected elements for nHAp – calcium (Ca), phosphorus (P), and oxygen (O) – were all confirmed through qualitative and quantitative analysis. In addition to these elements, C, N and F were also detected and quantified for the CF-loaded n-HAp samples.The quantified mass% and atom% of the detected elements from nHAp and CF-loaded nHAp are presented in Table 2. The Ca/P ratio of nHAp was found to be 1.50, which indicates the formation of Ca-deficient HAp.60 The addition of CF at concentrations of 5, 10 and 15 mg/mL further decreased the Ca/P ratio. The occupation of vacant Ca2+ sites of Ca-deficient HAp by cations of CF might cause a decrease in the Ca/P ratio.61 Chelation of CF with Ca2+ ions may also contribute to the lessening of Ca2+ ions in the HAp structure and hence the decrease in the Ca/P ratio.62
| Elements | nHAp | 5CF-nHAp | 10CF-nHAp | 15CF-nHAp | ||||
|---|---|---|---|---|---|---|---|---|
| Mass% | Atom% | Mass% | Atom% | Mass% | Atom% | Mass% | Atom% | |
| Ca | 47.88 | 32.24 | 41.86 | 25.33 | 41.67 | 25.22 | 43.55 | 27.04 |
| P | 24.72 | 21.54 | 22.90 | 17.93 | 23.58 | 18.47 | 25.35 | 20.37 |
| O | 27.40 | 46.22 | 26.89 | 40.78 | 25.71 | 38.99 | 21.61 | 33.62 |
| C | — | — | 5.22 | 10.54 | 5.94 | 11.99 | 7.23 | 14.98 |
| N | — | — | 2.19 | 3.10 | 3.01 | 5.22 | 3.90 | 5.37 |
| F | — | — | 0.03 | 0.04 | 0.09 | 0.11 | 0.07 | 0.09 |
| Ca/P | 1.50 | 1.41 | 1.37 | 1.33 | ||||
3.6. In vitro studies
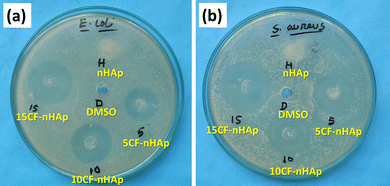 | ||
| Fig. 7 Antibacterial activity assessment of nHAp, 5CF-nHAp, 10CF-nHAp and 15CF-nHAp samples against: (a) E. coli and (b) S. aureus. | ||
| Sample | Zone of Inhibition (mm) | |
|---|---|---|
| E. coli | S. aureus | |
| DMSO (control) | — | — |
| nHAp | — | — |
| 5CF-nHAp | 26 ± 0.20 | 28 ± 0.25 |
| 10CF-nHAp | 30 ± 0.10 | 30 ± 0.20 |
| 15CF-nHAp | 32 ± 0.15 | 36 ± 0.11 |
The loaded CF molecules on HAp played a part as an antibacterial agent, which is why the 5CF-nHAp, 10CF-nHAp and 15CF-nHAp samples showed activity against E. coli and S. aureus. CF, a 2nd-generation fluoroquinolone antibiotic, enters bacterial cells and halts the activity of enzymes like DNA gyrase and topoisomerase IV, which are necessary for the replication and development of bacterial DNA.64 The amount of CF released over a day from the CF-loaded nHAp samples is more than enough to kill the bacteria that typically cause bone infections since the amount of CF exceeds the minimum inhibitory concentration (MIC) of ciprofloxacin (0.25–2 mg mL−1).32,41 As the concentration of CF loaded in nHAp increased, activity against E. coli and S. aureus also increased. Against both types of bacteria, 15CF-nHAp showed the highest activity, particularly against the Gram-positive bacteria (E. coli).
The MIC and MBC of CF loaded nHAp sample against E. coli and S. aureus were measured, for which the 5CF-nHAp sample was chosen as it contains the lowest amount of CF. The results of MIC and MBC is presented in Table 4.
| Bacterial Strains | MIC | |||||||
|---|---|---|---|---|---|---|---|---|
| 25 μg mL−1 | 12.5 μg mL−1 | 6.25 μg mL−1 | 3.125 μg mL−1 | 1.56 μg mL−1 | 0.78 μg mL−1 | 0.39 μg mL−1 | 0.12 μg mL−1 | |
| Note: ‘+’ means presence of bacterial growth; ‘−’ means absence of bacterial growth. | ||||||||
| E. coli | − | − | − | − | − | − | + | + |
| S. aureus | − | − | − | − | − | − | − | + |
| MBC | ||||||||
| E. coli | − | − | − | + | + | + | + | + |
| S. aureus | − | − | − | − | + | + | + | + |
Based on the results of MIC (Table 4), 0.78 μg mL−1 concentration of 5CF-nHAp sample was found to be effective against E. coli and S. aureus bacterial strains. Therefore, the MIC of 5CF-nHAp sample is reported to be of 0.78 μg mL−1. Similarly for the MBC determination, 12.5 μg mL−1 concentration of 5CF-nHAp sample was bactericidal against E. coli and S. aureus
| Name of sample | Cell viability | Verdict |
|---|---|---|
| Control (−ve) (solvent) | 100% | No signs of cytotoxicity. |
| Control (+ve) (solvent) | 100% | |
| nHAp | >95% | |
| 5CF-nHAp | >95% | |
| 10CF-nHAp | >95% | |
| 15CF-nHAp | >95% |
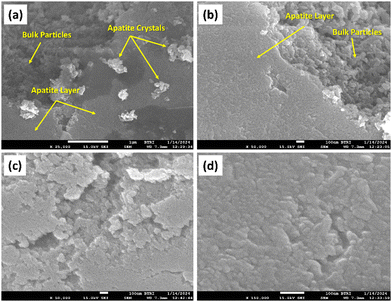 | ||
| Fig. 9 FESEM images of (a) nHAp, (b) 5CF-nHAp (c) 10CF-nHAp and (d) 15CF-nHAp after soaking in SBF solution for 3 weeks at 37 °C. | ||
The formation of the apatite layer is clearly visible from the FESEM images of all the samples. For nHAp, apatite crystal nucleation was also observed along with layer formation. The magnitude of layer formation was greater in nHAp particles compared to the CF-loaded samples and the magnitude of layer formation decreased with increasing drug loading. This can easily be attributed to the fact that the CF-loaded nHAp samples possess CF molecules on their surface, which interrupts the interaction of the Ca2+ and PO43− sites of HAp with the negative and positive sites of the SBF solution.1 For all the samples (nHAp and CF-loaded nHAp), super-saturation of the apatite layer was observed, indicating the bioactivity of the synthesized samples.
Fig. 10(a) shows the hemolysis results of the nHAp and CF-loaded nHAp samples. The results indicate that as the concentration of CF loaded in the nHAp increased, the hemolytic effect on red blood cells also increased. Specifically, the hemolysis percentages rose from 0.8% with nHAp alone to 2.75% with 15 mg mL−1 CF-nHAp. CF itself can possess some degree of cytotoxicity (toxic to cells) at higher concentrations.74 This suggests a dose-dependent relationship between CF concentration and hemolytic activity, highlighting the importance of considering the potential side effects of drug-loaded nano-materials like CF-nHAp on blood cells when used in medical applications.75 The positive control, Triton X-100, showed complete hemolysis, whereas PBS showed none.
The CF IE of nHAp increased with the increasing concentration of CF, as shown in Fig. 10(b). For 5, 10 and 15 mg mL−1 concentrations of CF, IE was 90.89%, 94.89% and 95.14% respectively. For 15 mg mL−1 CF concentration, the IE only increased by 0.25% whereas for 10 mg mL−1, the IE increased by 4.0%. Depletion of available binding sites of nHAp molecules at higher CF concentrations might be the reason behind this. The cumulative release of CF in SBF solution at RT was calculated from eqn (4) and is shown in Fig. 10(c) along with the amount of CF released in Fig. 10(d). Release of in situ loaded CF was observed for two weeks. The observed release pattern of 5CF-nHAp was quite different than that of the 10CF-nHAp and 15CF-nHAp samples in Fig. 10(c).
The cumulative release percentage of CF was always higher from 5CF-nHAp than that of the other two. After the 6th day, rapid release of CF was observed (from 23% to 49% on the 7th day), which went up to 61% on the 14th day. For 10CF-nHAp and 15CF-nHAp samples, no such spike in release was observed, and a steady release pattern was seen throughout. In two weeks, a maximum of 6% and 13% release was observed from 10CF-nHAp and 15CF-nHAp samples, respectively. At higher concentrations (10 and 15 mg mL−1), CF molecules might start to aggregate or precipitate within the nHAp pores. These aggregates are larger and less mobile, which hinders their release from the pores. On the other hand, at lower concentrations (5 mg mL−1), CF molecules might be more evenly distributed and readily diffusible. Another factor that might be playing a part in this scenario is the blockage of pores by CF molecules at higher concentrations, which hinders the diffusion of CF molecules. Greater interaction between nHAp and CF at higher CF concentrations also contributed to the sustained release of CF.76,77 The amount of CF released surpassed the MIC of CF (0.25–2 μg mL−1 for most osteomyelitis-causing pathogens) within 24 hours of the release study.32 This is also evident in the antibacterial activity of the CF-loaded nHAp samples.
Understanding how drugs are released from a carrier over time (drug release kinetics), is crucial for designing effective medications. It helps us see how the carrier and drug interact, paving the way for better formulations. A model-dependent approach was implemented to see how CF gets released from the synthesized nHAp samples. The zero-order kinetic model, first-order kinetic model, Higuchi kinetic model and Korsmeyer–Peppas kinetic model were used for this evaluation.1
The zero-order kinetic model represents a drug delivery system where drug release remains constant and is unaffected by concentration fluctuations. This model is represented by the following equation,
| Ct = C0 + K0t | (11) |
The first-order kinetic model provides a better explanation of drug delivery systems when drug adsorption and/or release are related and the rate of release depends on the concentration. The expression of this model is as follows,
 | (12) |
| C = KH × t1/2 | (13) |
| C = KKP × tn | (14) |
The Korsmeyer–Peppas constant is denoted by KKP and the diffusional exponent is denoted by n, which characterizes the drug release mechanism. The significance of the value of n is: 0 < n < 0.45 refers to hindered Fickian diffusion; n = 0.45 refers to Fickian diffusion (case-I); 0.45 < n < 1 refers to anomalous transport; n = 1 refers to non-Fickian transport (case-II) and n > 1 refers to super case-II transport.78
Plots of cumulative release% against time, log (cumulative release%) against time, cumulative release% against square root of time and log (cumulative release%) against log time were constructed for zero order (Fig. 10(e)), first order (Fig. 10(f)), Higuchi (Fig. 10(g)) and Korsmeyer–Peppas (Fig. 10(h)) kinetic models respectively. The extrapolated results from these plots are tabulated in Table 6.
| Sample | Zero order model | First order model | Higuchi model | Korsmeyer–Peppas model | |||||
|---|---|---|---|---|---|---|---|---|---|
| K 0 | R 2 | K 1 | R 2 | K H | R 2 | K KP | n | R 2 | |
| 5CF-nHAp | 4.06 | 0.89 | 0.13 | 0.82 | 20.01 | 0.89 | 2.54 | 0.75 | 0.92 |
| 10CF-nHAp | 0.54 | 0.95 | 0.06 | 0.85 | 2.71 | 0.98 | 1.98 | 0.36 | 0.98 |
| 15CF-nHAp | 0.25 | 0.68 | 0.02 | 0.73 | 1.18 | 0.61 | 2.57 | 0.11 | 0.56 |
The loading of CF in situ at three different concentrations showed variance in their in vitro release pattern, as mentioned earlier. The kinetic models were exploited for further exploration of this release pattern. The release of CF from the 5CF-nHAp sample followed the Korsmeyer–Peppas kinetic model (R2 = 0.92) where the value of n suggests the involvement of multiple mechanisms along with diffusion that govern the CF release. A value of n between 0.5 and 1 indicates a non-Fickian diffusion mechanism. This means that the drug release is controlled by both diffusion and erosion processes.79 For the case of 10CF-nHAp, both the Higuchi and Korsmeyer–Peppas models equally fitted (R2 = 0.98) which suggests a combined release mechanism of CF from the nHAp matrix. Both the Higuchi and Korsmeyer–Peppas models describe diffusion-controlled release, albeit with different complexities. Higuchi assumes spherical particles and constant drug concentration, while Korsmeyer–Peppas considers non-Fickian diffusion.80 Release of CF from 15CF-nHAp can be best explained by the first-order kinetic model with moderate fitting of data (R2 = 0.73) which signifies the dependency of CF release rate on concentration. A closer look into Fig. 10(c) and (d) will reveal that, higher amount of CF was released from the 15CF-nHAp depicting the initial burst release which contributed to the first order kinetics. The diffusional exponents for both 10CF-nHAp and 15CF-nHAp samples suggest hindered Fickian diffusion.78
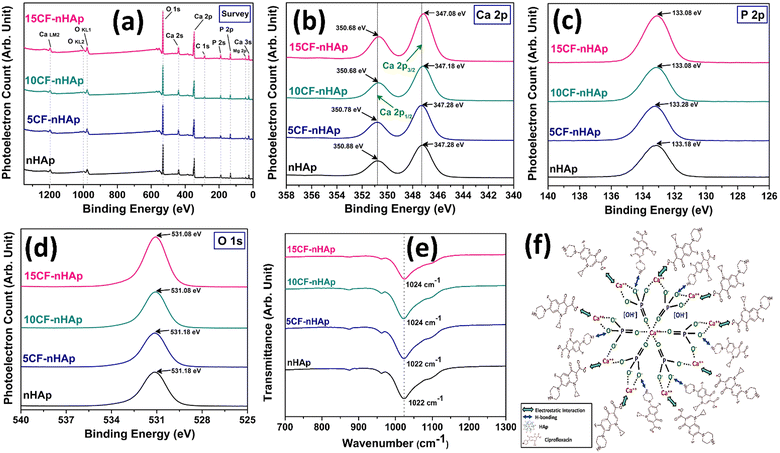
3.7. CF loading-release mechanism by FTIR and XPS analysis
The analysis of CF loading showed that over 90% of the CF was loaded across all three concentrations, and this percentage of loading increased as the concentrations increased. The in situ addition of drugs typically yields a higher percentage of loading compared to techniques such as adsorption or solid-state mixing.32 Given that the quantity of CF loaded into nHAp for all three concentrations significantly exceeds the MIC, investigating the interaction between CF and nHAp is essential for comprehending their release profile. To facilitate this, samples underwent XPS and FTIR analyses. Fig. 11(a)–(d) illustrates the high-resolution XPS spectra of both nHAp and CF-loaded nHAp samples. The survey spectrum of nHAp (Fig. 11(a)) revealed the presence of key elements, namely Ca, P, and O, characteristic of HAp. Furthermore, Mg was detected at an atomic percentage of 0.33 which may have originated from the poultry waste.81 The Ca/P ratio, as determined from the survey spectrum of nHAp, was found to be 1.34, markedly lower than the ratio obtained through EDX analysis (Table 2). In the case of CF-loaded samples, in addition to Mg, N and F were also detected, with atomic percentages ranging from 0.72 to 0.91% and 0.41 to 0.65% respectively. This N and F originated from the CF structure that was loaded on nHAp at three different concentrations.82Fig. 11(b)–(d) represents the narrow scan spectra of Ca 2p, P 2p and O 1s respectively. Based on the high-resolution narrow spectra of nHAp and CF-loaded nHAp samples, a change in binding energy (BE) was observed as the concentration of CF increased. The in situ addition of CF to HAp can cause an alteration of the local electronic environment due to the interaction of CF molecules with HAp. This interaction can result in changes in the electron density around these elements, affecting the XPS spectra.1 This interaction was also observed in the FTIR spectra of the CF-loaded samples along the most intense band for the PO43− group. The band position was changed as the concentration of CF was increased (Fig. 11(e)).
Fig. 11(f) represents the possible interaction between HAp and the CF molecule. CF is a zwitterionic molecule, meaning it holds both positive and negative charges at physiological pH. When the pH is above 8.8, the anionic structure of CF is mostly dominant in the solution.83 When CF was added to the reaction media, the pH of the solution was already maintained at around 11 by adding NH4OH. As the pH was >8.8, the CF molecules were mostly in the anionic state.
Since anionic CF molecules are mostly present in the solution, electrostatic interaction between the negative CF molecule and the positive HAp site (Ca2+) is the predominant phenomenon for the CF's attachment to HAp.84 In addition to that, H-bonding also takes place to some extent. Both of these interactions cause changes in the electron density around the Ca 2p, P 2p and O 1s sites, affecting the XPS spectra. Based on the narrow scan spectra of these sites, changes in BE occurred with increasing concentrations of CF. As a consequence, the magnitude of the interaction increased and more CF was attached. An intriguing observation is that the 15CF-nHAp sample exhibited smaller crystallite and particle sizes, as elucidated in the XRD and FESEM sections. Since smaller particles possess a larger surface area-to-volume ratio, they offer more potential active sites for CF molecules to interact with. Consequently, the 15CF-nHAp sample demonstrated the highest percentage of CF loading. Regarding CF release, the 5CF-nHAp sample exhibited a higher cumulative release percentage due to the lower magnitude of attraction between CF and HAp. Conversely, the 10CF-nHAp and 15CF-nHAp samples displayed higher cumulative release percentages than the 5CF-nHAp sample, attributed to their stronger interaction magnitudes. A comparison has been presented in Table 7 where the loading of CF by different materials is tabulated.
| Material | Synthesis method | CF loading method | CF loading amount | Ref. |
|---|---|---|---|---|
| Hydroxyapatite | Wet chemical precipitation | In situ | 95.14% incorporation efficiency | This study |
| Hydroxyapatite | Wet chemical precipitation | Adsorptive | 38.24% maximum entrapment efficacy | 1 |
| Hydroxyapatite | Ultrasonic assisted in situ mineralization | In situ | 63% loading efficiency | 77 |
| Hydroxyapatite-alginate nanocomposite | Wet chemical precipitation | Adsorptive | 87.45% CF loading | 57 |
| Hydroxyapatite | Wet chemical precipitation | In situ | ∼0.2 g g−1 CF loading | 32 |
| κ-Carrageenan crosslinked chitosan/hydroxyapatite hydrogel | Wet chemical precipitation | In situ | 61.56% encapsulation efficacy | 85 |
| Zinc-doped hydroxyapatite | Wet chemical precipitation | adsorptive | 90% loading | 33 |
4. Conclusion
The in situ loading mechanism for superior loading and release of antibiotics from poultry waste-derived nHAp was investigated in this research. The nHAp was synthesized utilizing chicken eggshell waste, which was calcined prior to the reaction with orthophosphoric acid. CF in three different concentrations was added to the reaction mixture after pH adjustments. The percentage of CF loading increased with increasing concentrations of CF. However, cumulative release up to 14 days indicates a decrease in release% with an increased amount of CF loading as described by the FTIR and XPS analysis. Incorporation of CF into nHAp in situ does not significantly impact the bioactivity or cytocompatibility of HAp and imparts antibacterial activity against pathogens like E. coli and S. aureus, known to cause osteomyelitis.Ethical statement
This study adhered to IGCRT guidelines and received prior BCSIR Ethics Committee approval (Ref: 1GCRT/R&D research/2022-2024/01; Date: 04.10.2022) for the hemolysis study. Informed consent was obtained from all human participants.Author contributions
Mashrafi Bin Mobarak – conceptualization, methodology, data collection, data analysis, writing – original draft, project administration; Fariha Chowdhury – data collection, data analysis; Md. Najem Uddin – methodology, data collection; Md. Sahadat Hossain, Umme Sarmeen Akhter and Nazmul Islam Tanvir – data collection; Md Aftab Ali Shaikh – writing – review & editing; Samina Ahmed – supervision, funding acquisition.Data availability
All the data used in this article will be available in the repository of MoST (Ministry of Science and Technology), Bangladesh.Conflicts of interest
There are no conflicts to declare.Acknowledgements
This research work was supported by Ministry of Science and Technology (MoST), Government of the People's Republic of Bangladesh (ref. no. 39.00.0000.012.02.009.23.159; Date: 09/09/2023; SL no. 05; reg no. 14). We also acknowledge the support from Bangladesh Council of Scientific and Industrial Research (BCSIR) through R&D project (ref. no. 39.02.0000.011.14.134.2021/900; Date: 30.12.2021). Our sincere gratitude to Dr Tania Hossain, Scientist, CARS, DU for helping out with the cytocompatibility assessment.Notes and references
- M. B. Mobarak, M. N. Islam, F. Chowdhury, M. N. Uddin, M. S. Hossain, M. Mahmud, U. S. Akhtar, N. I. Tanvir, A. M. Rahman and S. Ahmed, RSC Adv., 2023, 13, 36209–36222 RSC.
- A. Hogan, V. G. Heppert and A. J. Suda, Arch. Orthop. Trauma Surg., 2013, 133, 1183–1196 CrossRef PubMed.
- S. K. Schmitt, Infect. Dis. Clin., 2017, 31, 325–338 Search PubMed.
- D. P. Lew and F. A. Waldvogel, Lancet, 2004, 364, 369–379 CrossRef CAS PubMed.
- L. P. Ferguson and T. F. Beattie, BMJ, 2002, 324, 1380–1381 CrossRef CAS PubMed.
- J. Calhoun, M. M. Manring and M. Shirtliff, Semin. Plast. Surg., 2009, 23, 059–072 CrossRef PubMed.
- Y. Jha and K. Chaudhary, Cureus, 2022, 14(10), e30713 Search PubMed.
- A. L. L. Lima, P. R. Oliveira, V. C. Carvalho, S. Cimerman and E. Savio, Braz. J. Infect. Dis., 2014, 18, 526–534 CrossRef PubMed.
- N. Rao, B. H. Ziran and B. A. Lipsky, Plast. Reconstr. Surg., 2011, 127, 177S–187S CrossRef CAS PubMed.
- C. R. Arciola, D. Campoccia and L. Montanaro, Nat. Rev. Microbiol., 2018, 16, 397–409 CrossRef CAS PubMed.
- R. Besal, P. Adamič, B. Beović and L. Papst, Antibiotics, 2023, 12, 944 CrossRef CAS PubMed.
- N. H. Alotaibi, M. U. Munir, N. K. Alruwaili, K. S. Alharbi, A. Ihsan, A. S. Almurshedi, I. U. Khan, S. N. A. Bukhari, M. Rehman and N. Ahmad, Pharmaceutics, 2022, 14, 975 CrossRef CAS PubMed.
- J. S. Gogia, J. P. Meehan, P. E. Di Cesare and A. A. Jamali, Seminars in plastic surgery, copyright Thieme Medical Publishers, 2009, vol. 23, pp. 100–107 Search PubMed.
- S. K. Nandi, S. Bandyopadhyay, P. Das, I. Samanta, P. Mukherjee, S. Roy and B. Kundu, Biotechnol. Adv., 2016, 34, 1305–1317 CrossRef CAS PubMed.
- R. K. Wassif, M. Elkayal, R. N. Shamma and S. A. Elkheshen, Drug Delivery, 2021, 28, 2392–2414 CrossRef CAS PubMed.
- M. Vallet-Regí, D. Lozano, B. González and I. Izquierdo-Barba, Adv. Healthcare Mater., 2020, 9, 2000310 CrossRef PubMed.
- P. Trucillo, Materials, 2024, 17, 456 CrossRef CAS PubMed.
- A. Josyula, K. S. Parikh, I. Pitha and L. M. Ensign, Drug Delivery Transl. Res., 2021, 11, 1675–1688 CrossRef CAS PubMed.
- B. A. Witika, P. A. Makoni, S. K. Matafwali, B. Chabalenge, C. Mwila, A. C. Kalungia, C. I. Nkanga, A. M. Bapolisi and R. B. Walker, Nanomaterials, 2020, 10, 1649 CrossRef CAS PubMed.
- L. K. Hakim, M. Yazdanian, M. Alam, K. Abbasi, H. Tebyaniyan, E. Tahmasebi, D. Khayatan, A. Seifalian, R. Ranjbar and A. Yazdanian, J. Evidence-Based Complementary Altern. Med., 2021, 2021(1), 9011226 Search PubMed.
- F. M. Beram, S. N. Ali, G. Mesbahian, F. Pashizeh, M. Keshvadi, F. Mashayekhi, B. Khodadadi, Z. Bashiri, A. Moeinzadeh, N. Rezaei, S. Namazifard, N. Hossein-khannazer and M. Tavakkoli Yaraki, ACS Appl. Bio Mater., 2024, 7, 1449–1468 CrossRef CAS PubMed.
- S. Amiri, F. Pashizeh, K. Moeinabadi-Bidgoli, Y. Eyvazi, T. Akbari, Z. S. Moghaddam, M. Eskandarisani, F. Farahmand, Y. Hafezi and H. N. Jevinani, Environ. Res., 2023, 239, 117292 CrossRef CAS PubMed.
- D. Pasarin, A.-I. Ghizdareanu, C. E. Enascuta, C. B. Matei, C. Bilbie, L. Paraschiv-Palada and P.-A. Veres, Polymers, 2023, 15, 782 CrossRef CAS PubMed.
- H. Idrees, S. Z. J. Zaidi, A. Sabir, R. U. Khan, X. Zhang and S. Hassan, Nanomaterials, 2020, 10, 1970 CrossRef CAS PubMed.
- H. Lee, D. Y. Shin, Y. Na, G. Han, J. Kim, N. Kim, S.-J. Bang, H. S. Kang, S. Oh and C.-B. Yoon, Biomater. Adv., 2023, 152, 213523 CrossRef CAS PubMed.
- H. Lee, D. Y. Shin, S.-J. Bang, G. Han, Y. Na, H. S. Kang, S. Oh, C.-B. Yoon, S. Vijayavenkataraman and J. Song, Int. J. Biol. Macromol., 2024, 254, 127797 CrossRef CAS PubMed.
- T. Jang, S. J. Park, J. E. Lee, J. Yang, S. Park, M. B. Jun, Y. W. Kim, C. Aranas, J. P. Choi, Y. Zou, R. C. Advincula, Y. Zheng, H. L. Jang, N. Cho, H. Jung and S. H. Kim, Adv. Funct. Mater., 2022, 32, 2206863 CrossRef CAS.
- M. E. Shirtliff, J. H. Calhoun and J. T. Mader, Clin. Orthop. Relat. Res., 2002, 401, 239–247 CrossRef PubMed.
- U. Joosten, A. Joist, G. Gosheger, U. Liljenqvist, B. Brandt and C. von Eiff, Biomaterials, 2005, 26, 5251–5258 CrossRef CAS PubMed.
- A. Krisanapiboon, B. Buranapanitkit and K. Oungbho, J. Orthop. Surg., 2006, 14, 315–318 CrossRef CAS PubMed.
- V. C. A. Martins, G. Goissis, A. C. Ribeiro, E. Marcantônio Jr and M. R. Bet, Artif. Organs, 1998, 22, 215–221 CrossRef CAS PubMed.
- G. S. Kumar, R. Govindan and E. K. Girija, J. Mater. Chem. B, 2014, 2, 5052–5060 RSC.
- G. Devanand Venkatasubbu, S. Ramasamy, V. Ramakrishnan and J. Kumar, 3 Biotech, 2011, 1, 173–186 CrossRef CAS PubMed.
- Q. Wang, C. Chen, W. Liu, X. He, N. Zhou, D. Zhang, H. Gu, J. Li, J. Jiang and W. Huang, Sci. Rep., 2017, 7, 41808 CrossRef CAS PubMed.
- Y. N. Reddy, P. C. Deepika, M. P. Venkatesh and K. G. Rajeshwari, Contemp. Clin. Dent., 2016, 7, 357–365 CrossRef CAS PubMed.
- X. Wang and D. J. Burgess, Adv. Drug Delivery Rev., 2021, 178, 113912 CrossRef CAS PubMed.
- M. M. Wan, Y. Y. Li, T. Yang, T. Zhang, X. D. Sun and J. H. Zhu, Chem. – Eur. J., 2016, 22, 6294–6301 CrossRef CAS PubMed.
- M. B. Mobarak, N. S. Pinky, F. Chowdhury, M. S. Hossain, M. Mahmud, M. S. Quddus, S. A. Jahan and S. Ahmed, J. Saudi Chem. Soc., 2023, 101690 CrossRef.
- N. M. Pu’ad, P. Koshy, H. Z. Abdullah, M. I. Idris and T. C. Lee, Heliyon, 2019, 5(5), e01588 CrossRef PubMed.
- M. B. Mobarak, M. N. Uddin, F. Chowdhury, M. S. Hossain, M. Mahmud, S. Sarkar, N. I. Tanvir and S. Ahmed, J. Mol. Struct., 2024, 1301, 137321 CrossRef.
- C. Castro, C. Evora, M. Baro, I. Soriano and E. Sanchez, Eur. J. Pharm. Biopharm., 2005, 60, 401–406 CrossRef CAS PubMed.
- A. C. Tas, Biomaterials, 2000, 21, 1429–1438 CrossRef CAS PubMed.
- T. Kokubo, H. Kushitani, S. Sakka, T. Kitsugi and T. Yamamuro, J. Biomed. Mater. Res., 1990, 24, 721–734 CrossRef CAS PubMed.
- T. Saha, M. B. Mobarak, M. N. Uddin, M. S. Quddus, M. R. Naim and N. S. Pinky, Mater. Chem. Phys., 2023, 127979 CrossRef CAS.
- F. Chowdhury, M. B. Mobarak, M. Hakim, M. N. Uddin, M. S. Hossain, U. S. Akhter, D. Islam, S. Ahmed and H. Das, New J. Chem., 2024, 48, 17038–17051 RSC.
- I. Wiegand, K. Hilpert and R. E. Hancock, Nat. Protoc., 2008, 3, 163–175 CrossRef CAS PubMed.
- M. S. Hossain, M. A. A. Shaikh, S. A. Jahan, M. Mahmud, M. B. Mobarak, M. S. Rahaman, M. N. Uddin and S. Ahmed, RSC Adv., 2023, 13, 9654–9664 RSC.
- T. Govender, T. Riley, T. Ehtezazi, M. C. Garnett, S. Stolnik, L. Illum and S. S. Davis, Int. J. Pharm., 2000, 199, 95–110 CrossRef CAS PubMed.
- S. Sultana, M. S. Hossain, M. Mahmud, M. B. Mobarak, M. H. Kabir, N. Sharmin and S. Ahmed, RSC Adv., 2021, 11, 3686–3694 RSC.
- M. B. Mobarak, M. S. Hossain, Z. Yeasmin, M. Mahmud, M. M. Rahman, S. Sultana, S. M. Masum and S. Ahmed, J. Mol. Struct., 2022, 1252, 132142 CrossRef.
- A. Bishnoi, S. Kumar and N. Joshi, Microscopy methods in nanomaterials characterization, Elsevier, 2017, pp. 313–337 Search PubMed.
- M. Hossain, M. Mahmud, M. B. Mobarak and S. Ahmed, Chem. Pap., 2021, 1–13 Search PubMed.
- N. K. Nga, N. T. T. Chau and P. H. Viet, Colloids Surf., B, 2018, 172, 769–778 CrossRef CAS PubMed.
- X. Guo, H. Yan, S. Zhao, Z. Li, Y. Li and X. Liang, Adv. Powder Technol., 2013, 24, 1034–1038 CrossRef CAS.
- A. Gupta, A. Prasad, N. Mulchandani, M. Shah, M. Ravi Sankar, S. Kumar and V. Katiyar, ACS Omega, 2017, 2, 4039–4052 CrossRef CAS PubMed.
- A. Anwar, Q. Kanwal, S. Akbar, A. Munawar, A. Durrani and M. Hassan Farooq, Nanotechnol. Rev., 2017, 6, 149–157 CAS.
- G. D. Venkatasubbu, S. Ramasamy, V. Ramakrishnan and J. Kumar, J. Biomed. Nanotechnol., 2011, 7, 759–767 CrossRef CAS PubMed.
- M. Bin Mobarak, Md. S. Hossain, F. Chowdhury and S. Ahmed, Arabian J. Chem., 2022, 15, 104117 CrossRef CAS.
- T. P. Gamagedara, U. M. Rathnayake and R. M. G. Rajapakse, J. Clin. Invest., 2018, 1, 1–5 Search PubMed.
- M. T. Fulmer, R. I. Martin and P. W. Brown, J. Mater. Sci.: Mater. Med., 1992, 3, 299–305 CrossRef CAS.
- Y. Sekine, R. Motokawa, N. Kozai, T. Ohnuki, D. Matsumura, T. Tsuji, R. Kawasaki and K. Akiyoshi, Sci. Rep., 2017, 7, 2064 CrossRef PubMed.
- B. Dey, P. Katakam, F. H. Assaleh, B. R. Chandu, S. K. Adiki and A. Mitra, J. Pharm. Anal., 2015, 5, 389–395 CrossRef PubMed.
- M. Hajinaebi, M. Ganjali and N. A. Nasab, J. Inorg. Organomet. Polym., 2022, 32, 3521–3532 CrossRef CAS.
- K. Drlica and X. Zhao, Microbiol. Mol. Biol. Rev., 1997, 61, 377–392 CAS.
- A. Jayakumar, S. Radoor, J. W. Rhim, J. Parameswaranpillai, S. Siengchin and J. T. Kim, Advanced Applications of Biobased Materials, Elsevier, 2023, pp. 533–547 Search PubMed.
- T. Groth, P. Falck and R.-R. Miethke, Altern. Lab. Anim., 1995, 23, 790–799 CrossRef.
- I. O. for Standardization, 2009.
- M. Kheradmandfard, K. Mahdavi, A. Z. Kharazi, S. F. Kashani-Bozorg and D.-E. Kim, Mater. Sci. Eng., C, 2020, 117, 111310 CrossRef CAS PubMed.
- E. A. Ofudje, J. A. Akande, E. F. Sodiya, G. O. Ajayi, A. J. Ademoyegun, A. G. Al-Sehemi, Y. N. Kavil and A. M. Bakheet, Sci. Rep., 2023, 13, 19896 CrossRef CAS PubMed.
- S.-L. Bee, Y. Bustami, A. Ul-Hamid, K. Lim and Z. A. Abdul Hamid, J. Mater. Sci.: Mater. Med., 2021, 32, 106 CrossRef CAS PubMed.
- S. L. Aktuğ, S. Durdu, E. Yalçın, K. Çavuşoğlu and M. Usta, Mater. Sci. Eng., C, 2017, 71, 1020–1027 CrossRef PubMed.
- E. A. Ofudje, A. I. Adeogun, M. A. Idowu and S. O. Kareem, Heliyon, 2019, 5, e01716 CrossRef PubMed.
- M. Weber, H. Steinle, S. Golombek, L. Hann, C. Schlensak, H. P. Wendel and M. Avci-Adali, Front. Bioeng. Biotechnol., 2018, 6, 99 CrossRef PubMed.
- M. Z. R. Sabuj, F. Huygens, K. M. Spann, A. A. Tarique, T. R. Dargaville, G. Will, M. A. Wahab and N. Islam, Int. J. Mol. Sci., 2023, 24, 4532 CrossRef CAS PubMed.
- S. Lim and M. G. Alam, Renal Failure, 2003, 25, 647–651 CrossRef PubMed.
- M.-V. Ciocilteu, A. G. Mocanu, A. Mocanu, C. Ducu, O. E. Nicolaescu, V. C. Manda, A. Turcu-Stiolica, C. Nicolicescu, R. Melinte and M. Balasoiu, Acta Pharm., 2018, 68, 129–144 CrossRef CAS PubMed.
- P. Agalya, S. Cholan, K. M. Prabu, G. S. Kumar, G. Karunakaran, M. Shkir, E. Kolesnikov and S. Ramalingam, Inorg. Chem. Commun., 2022, 143, 109788 CrossRef CAS.
- M. Fosca, J. V. Rau and V. Uskoković, Bioact. Mater., 2022, 7, 341–363 CAS.
- W. Zhu, J. Long and M. Shi, Materials, 2023, 16, 3282 CrossRef CAS PubMed.
- M. P. Paarakh, P. A. Jose, C. M. Setty and G. V. Peterchristoper, Int. J. Pharm. Res. Technol., 2018, 8, 12–20 CrossRef.
- A. Schaafsma, I. Pakan, G. J. H. Hofstede, F. A. Muskiet, E. Van Der Veer and P. J. F. De Vries, Poult. Sci., 2000, 79, 1833–1838 CrossRef CAS PubMed.
- PubChem, Ciprofloxacin, https://pubchem.ncbi.nlm.nih.gov/compound/2764, (accessed March 18, 2024).
- H. Rasoulzadeh, A. Mohseni-Bandpei, M. Hosseini and M. Safari, Int. J. Biol. Macromol., 2019, 133, 712–721 CrossRef CAS PubMed.
- M. Beiranvand, S. Farhadi and A. Mohammadi-Gholami, RSC Adv., 2022, 12, 34438–34453 RSC.
- G. R. Mahdavinia, M. H. Karimi, M. Soltaniniya and B. Massoumi, Int. J. Biol. Macromol., 2019, 126, 443–453 CrossRef CAS PubMed.
| This journal is © The Royal Society of Chemistry 2024 |

