 Open Access Article
Enhancing the cycling performance of manganese oxides through pre-sodiation for aqueous Zn-ion batteries†
Anjeline
Williams
and
Prasant Kumar
Nayak
 *
*
Materials Electrochemistry Research Laboratory, Department of Chemistry, SRM Institute of Science and Technology, Kattankulathur-603203, Tamil Nadu, India. E-mail: prasantn1@srmist.edu.in
First published on 6th November 2024
Abstract
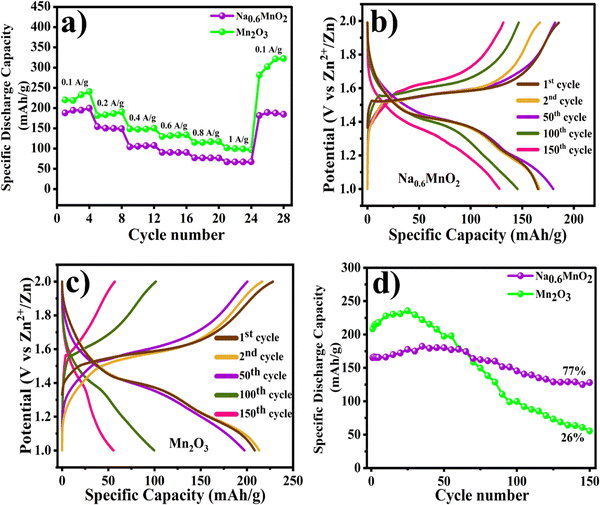
Although Li-ion batteries have dominated the portable electronics market due to their high energy density and long cycle-life, it is essential to find alternative energy storage devices that can be cost-effective and environmentally friendly because of the low abundance and high cost of Li. In this regard, aqueous Zn-ion batteries are promising, because of their high abundance, low cost, high gravimetric capacity of the Zn anode and the environmental friendliness of aqueous electrolytes compared to flammable and costly organic electrolytes. Manganese oxides are the preferred cathode materials for aqueous Zn-ion batteries because of their specific capacity above 200 mA h g−1, low cost and environmental friendliness. However, they suffer from capacity fading due to manganese dissolution and structural transformation upon cycling. In this study, pre-sodiated manganese oxide Na0.6MnO2 is synthesized by a hydrothermal method, followed by annealing at 900 °C, and its performance was tested for Zn-ion batteries by means of cyclic voltammetry, galvanostatic charge–discharge cycling and electrochemical impedance spectroscopy. Interestingly, Na0.6MnO2 delivers an initial specific capacity of 165 mA h g−1, showing approximately 77% capacity retention over 150 cycles when cycled at 0.2 A g−1 in the voltage domain of 1.0–2.0 V vs. Zn in 1.0 M ZnSO4 + 0.1 M MnSO4. On the other hand, Mn2O3 (without pre-sodiation) exhibits a high specific capacity above 200 mA h g−1; however, it undergoes severe capacity fading and retains only 26% capacity after 150 cycles. The ex situ XRD analysis shows the formation of a major spinel ZnMn2O4 phase along with a ZnMn3O7 phase, thus confirming the intercalation of the zinc-ion during the discharge process. Thus, this study enlightens the importance of pre-sodiation of manganese oxides in aqueous Zn-ion batteries for maintaining a stable specific capacity upon prolonged cycling.
1. Introduction
Owing to the increasing energy demand and environmental pollution from the use of fossil fuels, the harvesting and storage of renewable energies, such as solar and wind energy, by large-scale energy storage devices have become the need of the hour.1,2 Although Li-ion batteries (LIBs) have dominated the portable electronic market for the past few decades due to their high energy density, long cycle-life, and compactness; low Li reserves, high cost, and flammability issues of organic electrolytes challenge the usage of LIBs for large-scale energy storage applications.3–5 Hence, alternative energy storage devices, such as rechargeable aqueous metal-ion batteries utilizing earth-abundant metal ions (Na+, K+, Mg2+, Zn2+, Ca2+) and non-flammable aqueous electrolytes, can potentially be good alternatives for LIBs in large-scale grid energy storage applications. Among them, aqueous Zn-ion batteries (AZIB) have advantages, such as high Zn abundance in the earth's crust (70 ppm), low reduction potential of Zn (−0.76 V vs. SHE), high theoretical capacity of Zn (820 mA h g−1), compatibility of the Zn anode with aqueous electrolytes and environmental friendliness.6,7 Aqueous electrolytes possess two orders of high ionic conductivity (10−1–1 S cm−1) compared to that of organic electrolytes (10−3–10−2 S cm−1) and have no flammability issues, which makes them safer for grid energy storage applications.8,9 Despite these advantages of AZIB, the practical difficulty comes from designing a suitable cathode material for hosting reversible Zn2+ storage.Various cathode materials have been reported for AZIB, which include Mn-based oxides (MnO, MnO2,10 Mn2O3,11,12 Mn3O413), V-based oxides (V2O5,14 ZnV2O415), Mo-based sulfides (MoS216), Prussian-blue analogues (FeFe(CN)6,17 KCuFe(CN)6,18 ZnHCF19), polyanionic compounds (Na3V2(PO4)3),20 and Chevrel phase compounds (Mo6S8). However, most of these materials possess inherent difficulties, such as vanadium-based materials, which display poor structural stability and limited operational potential (vs. Zn) despite its high capacity. Conversely, Prussian-blue analogues show very low specific discharge capacity (∼50–60 mA h g−1) and aging issues.11,21,22 By comparison, Mn-based oxides have several advantages such as high theoretical capacity, high Mn reserve in the earth's crust (∼900 ppm), low cost, eco-friendliness, and satisfactory operational voltage (vs. Zn), making them a potential choice as a cathode material in AZIB. Mn-based oxides exist in various crystallographic forms, such as α, β, γ, δ, and λ-MnO2, possessing either a tunnel or layered structure.23,24 Based on the MnO6 linkage, α-MnO2 has one dimensional (1 × 1) (2 × 2) tunnel structures, β-MnO2 has (1 × 1) tunnels, and γ-MnO2 has (1 × 1) (1 × 2) tunnels, while δ-MnO2 has a two-dimensional layered structure, and λ-MnO2 has a three-dimensional spinel structure.25–28 Among these forms, α-MnO2 possessing larger tunnels and δ-MnO2 possessing a large interlayer spacing exhibit high specific capacity for AZIB application. However, the underlying problems of Mn-based oxides are Mn2+ dissolution, faster capacity fading, structural transformation during the charge/discharge process, and poor conductivity.29 Various strategies have been followed to alleviate these issues, such as defect introduction, electrolyte additive, compositing with a conducting material, and nano-structuring.30 Pan et al. reported the use of a MnSO4 additive in an electrolyte to prevent Mn2+ dissolution and observed a high specific capacity of ∼260 mA h g−1 at 1C rate and 92% capacity retention after 5000 cycles at 5C, whereas only ∼100 mA h g−1 was observed in the absence of the additive.31 During charging, the Mn2+ is electrochemically oxidised to a higher oxidation state (Mn2+/MnO2 transformation), thus boosting the capacity.32 Wu et al. prepared graphene scroll-coated α-MnO2 nanowires, which showed a high specific capacity of ∼301 mA h g−1 at 0.1 A g−1 current density with 94% capacity retention after 3000 cycles when cycled at 3 A g−1, compared to the non-graphene coated nanowire (∼242 mA h g−1 at 0.1 A g−1).33 Zhai et al. demonstrated that the sodium ion/crystal water co-intercalated cathode (Na0.55Mn2O4·0.57H2O) shows a higher specific capacity of ∼285 mA h g−1 compared to δ-MnO2 (194 mA h g−1) at 0.5 A g−1, highlighting the vital role of alkali metal ion (Na+) doping and crystal water, which enhances the interlayer spacing for reversible Zn2+ insertion/extraction.23 Another manganese-based oxide, Mn2O3 cathode has been widely investigated due to its high specific discharge capacity and easy synthesis. However, they display Mn dissolution and volume changes during the charge–discharge process, which has been tackled by using various techniques like the synthesis of a metal oxide using MOF sacrificial precursors,34 Ni2+ doping35 and carbon compositing.36,37
Layered sodiated transition metal oxides (P2 and O3 type), such as Na2/3MnO2, Na2/3Mn2/3Ni1/3O2, and NaMn1/2Ni1/2O2, have been the most studied cathode materials for sodium-ion batteries (SIB).38 Especially, P2-type oxide cathodes have more advantages, because of the trigonal prismatic sites being occupied by Na ions and the AB BA stacking of the transition metal oxide layers (TMO), whereas Na ions occupy octahedral sites and TMO shows AB CA BC stacking in O3-type oxide. P2-type oxides exhibit high capacity as the Na has to cross less energy barrier, thus making its jump more feasible from one trigonal prismatic site to another without structural collapse, which is not the case for the O3 type.39,40 However, P2-type oxides are rarely investigated as positive electrode materials for aqueous Zn-ion batteries. Hence, it is essential to examine the performance of P2-Na0.6MnO2 as a cathode material for AZIB. It should be noted that while manganese oxides are usually discharged first in the 1st cycle, this sodiated metal oxide material can be charged in order to extract Na+ ions in the 1st cycle, in a principle similar to Li or Na-ion batteries. This work highlights the importance of a pre-sodiation strategy to tackle the capacity fading issue and boost the capacity retention of Mn-based oxide materials.
In this work, we have synthesized pre-sodiated P2-Na0.6MnO2 and Mn2O3 (without pre-sodiation) by a hydrothermal method, followed by annealing, as reported in our previous publication,39 and studied the impact of the pre-sodiation strategy for aqueous Zn-ion batteries. From the galvanostatic charge–discharge (GCD) cycling studies, a significant enhancement of capacity retention (around 77%) is achieved via a simple pre-sodiation strategy compared to the low capacity retention (26%) of Mn2O3 after 150 cycles. The performance of hydrothermally synthesized Na0.6MnO2 is compared with that of manganese oxides reported previously in the literature and represented here in Table 1.
| Cathode materials | Synthesis method | Morphology | Electrolyte | Potential window (V) | Specific discharge capacity (mA h g−1) | Capacity retention (%) | Ref. |
|---|---|---|---|---|---|---|---|
| α-MnO2 | Hydrothermal | Nanorods | 1 M ZnSO4 | 0.7 to 2.0 | 210 at 1C | — | 10 |
| Na pre-intercalated Mn2O3@graphene | Molten salt | Vertical Mn2O3 nanosheets on graphene | 3 M ZnSO4 + 0.1 M MnSO4 | 0.8 to 1.9 | 320 at 0.6 A g−1 | ∼71% after 5000 cycles at 7 A g−1 | 11 |
| MOF derived α-Mn2O3 | Microwave | Microrods with nanoparticles | 2 M ZnSO4 + 0.2 M MnSO4 | 1.0 to 1.85 | 225 at 0.05 A g−1 | 42% after 1600 cycles at 2 A g−1 | 12 |
| MCM@Mn3O4 | Precipitation | Spherical particles | 2 M ZnSO4 + 0.1 M MnSO4 | 0.8 to 1.9 | 220 at 0.2 A g−1 | 80% after 1000 cycles at 0.6 A g−1 | 13 |
| Ni-doped Mn2O3 | Co-precipitation | Nanospheres | 2 M ZnSO4 | 0.8 to 1.8 | 252 at 0.1 A g−1 | 85.6% after 2500 cycles at 1 A g−1 | 21 |
| MnO2–Mn2O3 | Molten salt | Nanobelt + nanoparticle | 2 M ZnSO4 + 0.2 M MnSO4 | 1.0 to 1.85 | 289.8 at 0.2 A g−1 | 96.7% after 1000 cycles at 1 A g−1 | 22 |
| Graphene scroll coated α-MnO2 | Hydrothermal | Nanowire with rGO sheets | 2 M ZnSO4 + 0.2 M MnSO4 | 1.0 to 1.85 | 301.2 at 0.1 A g−1 | 94% after 3000 cycles at 3.0 A g−1 | 33 |
| Na0.55Mn2O4·0.57H2O | Selective etching | Nanoflakes | 2 M ZnSO4 + 0.2 M MnSO4 | 0.8 to 1.9 | 340.7 at 0.2 A g−1 | 67% after 400 cycles at 0.5 A g−1 | 23 |
| Ni-doped ZnMn2O4/Mn2O3 | Pulsed potential electrodeposition | Fine particles | 2 M ZnSO4 + 0.2 M MnSO4 | 0.8 to 1.9 | 237.2 at 0.2 A g−1 | 91.3% after 3000 cycles at 2 A g−1 | 35 |
| Na0.44MnO2 | High temperature with cell grinding | Shorter nanorods | 3 M ZnSO4 + 0.1 M MnSO4 | 1.0 to 1.8 | 301.3 at 0.1 A g−1 | 69.3% after 800 cycles at 1.0 A g−1 | 41 |
| D-Mn3O4 | Solvothermal | Flake-like with nanoparticles | 1 M ZnSO4 + 0.1 M MnSO4 | 1.0 to 1.9 | 270 at 0.3 A g−1 | 56% after 3000 cycles at 2.0 A g−1 | 42 |
| Na0.44MnO2 | Sol–gel | Micro-rods | 6 M NaOH | 1.1 to 2.0 | 74.8 at 1C | 73% after 1000 cycles at 10C | 43 |
| Na0.6MnO2 | Hydrothermal | Hexagonal sheets | 1 M ZnSO4 + 0.1 M MnSO4 | 1.0 to 2.0 | 165.2 at 0.2 A g−1 | 77% after 150 cycles at 0.2 A g−1 | This work |
| Mn2O3 | Hydrothermal | Agglomerated particles | 1 M ZnSO4 + 0.1 M MnSO4 | 1.0 to 2.0 | 208.4 at 0.2 A g−1 | 26% after 150 cycles at 0.2 A g−1 | — |
2. Experimental section
2.1. Synthesis of Na0.6MnO2 and Mn2O3
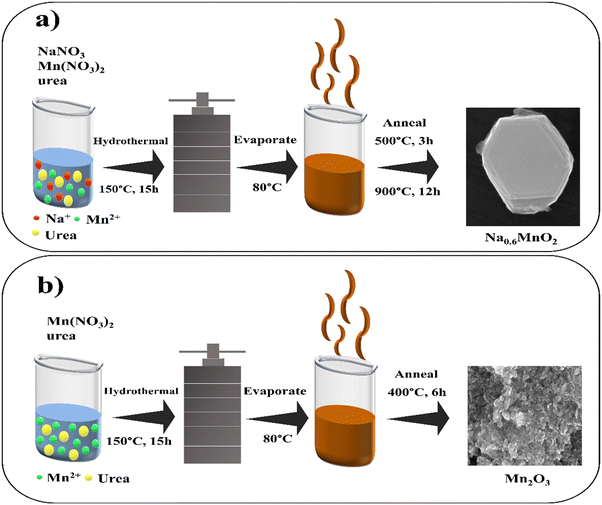
P2-Na0.6MnO2 was synthesized using a hydrothermal method according to our previous study.39 Briefly, 1.02 g of sodium nitrate (12 mM) (5% excess added to compensate the loss of Na at high temperatures), 5.02 g of manganese nitrate (20 mM), and 1.92 g of urea (32 mM) were separately dissolved in 20 mL of de-ionized water through stirring. Afterward, the sodium nitrate solution was added to the manganese nitrate solution with vigorous stirring, and then the urea solution was added dropwise to the mixture. After continuous stirring for 2 h, the solution was transferred to a Teflon-lined stainless steel autoclave, and kept in an oven at 150 °C for 15 h. After completion of the reaction, the autoclave was cooled down to room temperature. The resulting brown solution was then evaporated at 80 °C to obtain a dry mass, which was annealed in two steps. The initial step involves annealing the sample at 500 °C (heating rate of 5 °C min−1) for 3 h under air atmosphere. The sample was then ground to a powder form with a mortar-pestle, and then annealed at 900 °C for 12 h (Fig. 1a). The resulting Na0.6MnO2 black powder was stored in an air-tight container. For comparison, Mn2O3 (without pre-sodiation) was prepared in a similar process without the addition of sodium nitrate, with final annealing at 400 °C for 6 h, which resulted in a black powder material.2.2. Material characterization
The X-ray diffraction (XRD) patterns of the synthesized Na0.6MnO2 and Mn2O3 were measured in 2θ range of 10° to 80° using Bruker, USA, D8 Advance, Davinci, which utilizes Cu Kα radiation (λ = 1.54 Å). The morphology of both samples was examined using a high-resolution scanning electron microscope (HRSEM) from ThermoScientific Apreo S. High-resolution transmission electron microscope (HRTEM) images, along with energy dispersive X-ray spectra (EDS), were recorded using JEM 2100 Plus, JEOL Japan. X-ray photoelectron spectroscopy (XPS) measurements were obtained using PHI VersaProbe III to study the elemental composition and the oxidation state of Mn. Electrochemical impedance spectroscopy (EIS) was conducted with an ac amplitude of 10 mV using Biologic/VSP 300, in the frequency range of 100 kHz to 10 mHz.2.3. Electrode preparation and electrochemical measurements
The electrochemical measurements were performed using the CR2032 coin cell. The slurry was prepared by grinding 75 wt% of Na0.6MnO2, 15 wt% of super P carbon, and 10 wt% of poly(vinyl difluoride) (PVDF), and adding a few drops of NMP (N-methyl pyrrolidone) using a mortar and pestle for 30 min. Then, the homogeneous slurry was hand-painted onto circular graphite electrodes with 14 mm diameter. The electrodes were dried at 100 °C under vacuum overnight to remove the NMP. The geometric area of the electrode was 1.54 cm2 and the mass loading of the active material is ∼1.1 mg cm−2. The CR2032 coin cells were assembled using a Whatman GF/D glass fibre filter membrane as the separator, Na0.6MnO2 or Mn2O3 as the cathode, Zn foil as the anode and an aqueous solution of 1 M ZnSO4 + 0.1 M MnSO4 as the electrolyte. All cells were assembled and tested at a temperature of 25 °C. The specific capacity values of Na0.6MnO2 and Mn2O3 are reported after testing the performance of at least two cells for the reproducibility of data with 6% error. The cyclic voltammetry (CV) experiments were conducted with various scan rates ranging from 0.5 to 5.0 mV s−1. Galvanostatic charge–discharge (GCD) studies were carried out at various specific currents within a voltage range of 1.0–2.0 V by employing Autolab potentiostat/galvanostat (Metrohm, Netherlands). The galvanostatic intermittent titration technique (GITT) experiments were carried out by using a pulse current of 50 mA g−1 for 15 min with a relaxation time of 40 min for evaluation of diffusion coefficients at various voltages. The electrochemical impedance spectra (EIS) were measured at an open circuit potential (OCP) with an AC amplitude of 10 mV in the frequency range of 10 kHz–0.01 Hz using the ZIVE SP1 potentiostat/galvanostat.3. Results and discussion
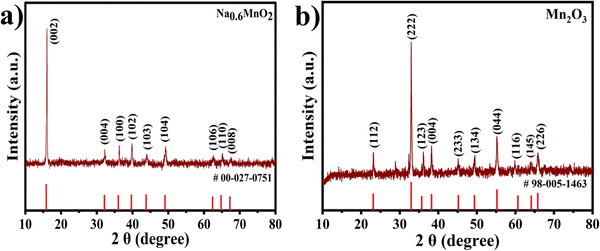
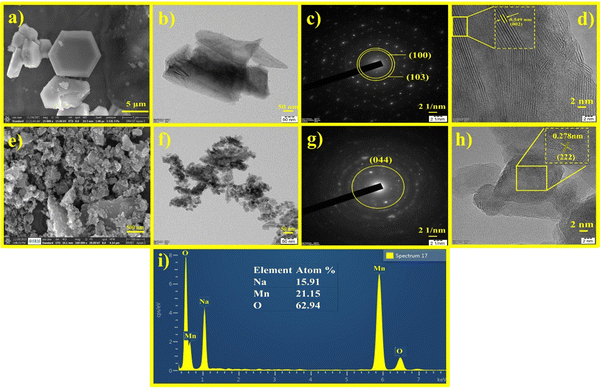
The crystal structures and phase purity of the synthesized Na0.6MnO2 and Mn2O3 were examined with XRD patterns. The XRD peaks with 2θ values of 15.84°, 32.13°, 36.02°, 39.67°, 43.80°, 49.07°, 62.39°, and 64.77° are well indexed as hexagonal Na0.6MnO2 (JCPDS: 027-0751, space group: P63/mmc), which corresponds to the (002), (004), (100), (102), (103), (104), (106), and (110) planes, respectively (Fig. 2a).39 The intense sharp peaks indicate the good crystallinity of the synthesized Na0.6MnO2. The diffraction peaks at around 23.13°, 32.95°, 35.68°, 38.23°, 45.16°, 49.35°, 55.18°, 60.62°, 64.09°, and 65.92° are indexed as cubic Mn2O3 (JCPDS: 98-005-1463, space group: Ia3), corresponding to the (112), (222), (123), (004), (233), (134), (044), (116), (145), and (226) planes, respectively (Fig. 2b).The morphology and particle size were investigated by HRSEM and HRTEM. The HRSEM image of Na0.6MnO2 features a hexagonal sheet-like morphology with a particle size of ∼966 nm (Fig. 3a and Fig. S1, ESI†).39Fig. 3b shows the HRTEM image of Na0.6MnO2, where it exhibits a thin sheet-like nature and the continuous lattice from Fig. 3d. This indicates the good crystalline nature of Na0.6MnO2 with a lattice fringe spacing of 0.549 nm, which corresponds to the (002) plane of hexagonal Na0.6MnO2. The selected area electron diffraction (SAED) pattern with distinct spots arranged in a hexagonal array fashion, further confirmed the crystalline nature of Na0.6MnO2. The presence of (100) and (103) planes of Na0.6MnO2 can be ascribed to XRD peaks appearing around 36.02° and 43.8° (Fig. 2a). These results verify the layered structure of Na0.6MnO2, which could facilitate the insertion/extraction of Zn2+ compared to Mn2O3, which is reflected in the subsequent electrochemical performance. Fig. 3i shows the EDX elemental analysis, where (atom%) of (0.7![[thin space (1/6-em)]](https://www.rsc.org/images/entities/char_2009.gif) :
:![[thin space (1/6-em)]](https://www.rsc.org/images/entities/char_2009.gif) 1 for Na:Mn) further confirms the formation of Na0.6MnO2. HRSEM and HRTEM images of Mn2O3 displayed agglomerated particles morphology (Fig. 3e and f) with varying particle sizes in the range of ∼20–70 nm. The SAED pattern of Mn2O3 shows the presence of (044) plane, which can be ascribed to an XRD peak around 55.18° (Fig. 3g), and the presence of concentric circles confirms its polycrystalline nature. Fig. 3h shows the interplanar lattice fringe spacing of 0.278 nm, which matches to the interplanar distance of (222) plane, corresponding to the most intense XRD peak of Mn2O3 appearing at 32.95°.
1 for Na:Mn) further confirms the formation of Na0.6MnO2. HRSEM and HRTEM images of Mn2O3 displayed agglomerated particles morphology (Fig. 3e and f) with varying particle sizes in the range of ∼20–70 nm. The SAED pattern of Mn2O3 shows the presence of (044) plane, which can be ascribed to an XRD peak around 55.18° (Fig. 3g), and the presence of concentric circles confirms its polycrystalline nature. Fig. 3h shows the interplanar lattice fringe spacing of 0.278 nm, which matches to the interplanar distance of (222) plane, corresponding to the most intense XRD peak of Mn2O3 appearing at 32.95°.
XPS analysis was performed to explore the valence state of individual elements. The high-resolution Mn 2p spectrum of Na0.6MnO2 exhibits two peaks at around 642.3 eV and 653.9 eV, corresponding to Mn 2p3/2 and Mn 2p1/2, respectively (Fig. 4a), with a ΔE value of 11.6 eV. On fitting, the Mn 2p3/2 peak is divided into two peaks, Mn3+ (642.2 eV) and Mn4+ (644.1 eV), and the 2p1/2 peak is divided into two peaks Mn3+ (653.8 eV) and Mn4+ (654.6 eV) (Fig. 4a).4,23 The Mn 3s peaks are broad with multiple splitting caused by the coupling of 3s with 3d electrons. The peak difference denotes the valence state of Mn in the sample. In the case of Na0.6MnO2, two peaks were centred at 84.35 eV and 89.26 eV with a peak difference of 4.91 eV, indicating the presence of Mn4+.27,44 The average oxidation state of Mn (n) was calculated to be 3.49 using eqn 1, which shows the mixed oxidation state of Mn3+ and Mn4+ in the Na0.6MnO2 sample.
| E = 7.88 − 0.85n | (1) |
 | ||
| Fig. 4 High-resolution XPS spectra of Na0.6MnO2 and Mn2O3 samples; (a)–(d) Mn 2p, Mn 3s, Na 1s and O 1s of Na0.6MnO2; (e)–(g) Mn 2p, Mn 3s and O 1s of Mn2O3. | ||
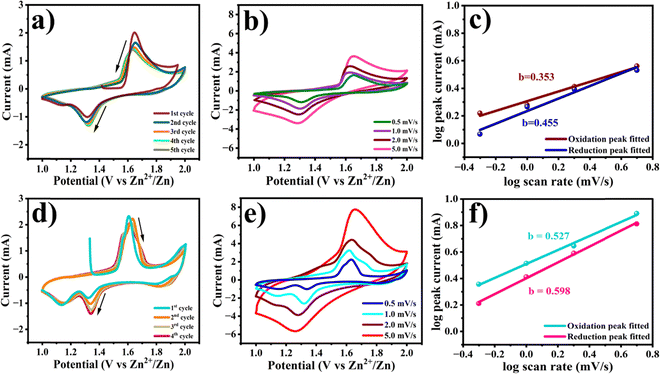
The electrochemical performance of Na0.6MnO2 and Mn2O3 for zinc-ion storage was investigated using a CR2032 coin cell with Na0.6MnO2 or Mn2O3 as the cathode, and Zn foil as the anode in an aqueous electrolyte of 1 M ZnSO4 + 0.1MnSO4. The assembled half-cells were left overnight for proper electrolyte percolation. Zn||Na0.6MnO2 revealed an open circuit potential (OCP) of ∼1.41 V, whereas Zn||Mn2O3 showed an OCP of ∼1.35 V. Fig. 5a shows the CV curves of the first five cycles of the Na0.6MnO2 cathode at a scan rate of 0.5 mV s−1 in the potential range of 1.0 to 2.0 V (vs. Zn/Zn2+). The first anodic peak at 1.64 V shows the extraction of Na+ along with the exchange of Zn2+ ions (as explained in the mechanism through XRD analysis) and oxidation of manganese ions.23 The cathodic scan reveals two reduction peaks, one centered at 1.31 V and the other at 1.13 V, attributed to H+ insertion and Zn2+-ion insertion, along with manganese ion reduction, respectively.41 However, the second reduction peak at 1.13 V vanishes after the initial cycle, indicating the reversible intercalation of small hydrated H+ ions (1.0 Å). Yuan et al. had studied the performance of Na0.44MnO2 in 6.0 M NaOH, and provided the existence of various redox pairs in the CV data at 1.20/1.18 V, 1.41/1.38 V, 1.51/1.48 V, and 1.71/1.70 (vs. Zn2+/Zn), providing clear evidence for the reversible insertion and extraction of sodium ions.43 However, our CV analysis does not reveal such redox peaks corresponding to the intricate phase transitions in Na0.6MnO2, suggesting the reversible intercalation and extraction of Zn2+, rather than intercalation/extraction of Na+ ions.
In the case of Mn2O3, the first anodic peak appears at 1.60 V with a shoulder peak around 1.56 V due to the oxidation of manganese ions (Mn3+ to Mn4+) at 0.5 mV s−1 scan rate (Fig. 5d). The corresponding cathodic scan shows two distinct reduction peaks at 1.32 and 1.13 V, which are due to the co-intercalation of H+ and Zn2+, accompanied by the reduction of Mn4+ to Mn3+ and Mn3+ to Mn2+.22,33 In the subsequent cycles, the appearance of the oxidation peak, along with a prominent shoulder peak, can result from the extraction of Zn2+ and H+.42 The peak current of the first reduction peak occurring at a higher potential shows an increase in the peak current in further cycles due to the gradual activation process,33 while the second reduction peak overlaps in all five cycles at 0.5 mV s−1. However, the oxidation peaks show a decrease in the peak currents in further cycles, which may be due to the irreversibility of the Mn2+/Mn4+ reaction. To better understand the reaction, the CV of Na0.6MnO2 was carried out at different scan rates of 0.5, 1.0, 2.0, 5.0 mV s−1. With an increase in the scan rate, the peak currents increased, indicating a diffusion controlled process, which was further confirmed by the plot of Ipvs. ν1/2 (Fig. S2, ESI†). A similar trend of an increase in current with scan rate was observed in the case of Mn2O3, which reaches a maximum anodic peak current of 7.73 mA and cathodic peak current of −5.66 mA at 5.0 mV s−1 scan rate, respectively (Fig. 5e). From Fig. 5e, we can clearly see two pairs of oxidation–reduction peaks at low scan rates (0.5 mV s−1 and 1.0 mV s−1), which is attributed to H+ and Zn2+ intercalation, respectively.21,46 When the scan rate increases to 5.0 mV s−1, only one pair of oxidation–reduction peaks is observed. This is due to intercalation of small hydrated H+ ions (1.0 Å).12,47 Thus, this study reveals that the CV patterns are well-maintained for Na0.6MnO2 at all scan rates compared to Mn2O3, indicating better structural stability of Na0.6MnO2, which in turn helps in better cycling performance of Na0.6MnO2 (Fig. 6d) with capacity retention (77%) over 150 cycles.
The charge storage kinetics of both Na0.6MnO2 and Mn2O3 was analysed using power law equation, which relates the peak current (i) with the scan rate (ν) according to the following equation (eqn (2)):
| i = aνb | (2) |
![[thin space (1/6-em)]](https://www.rsc.org/images/entities/char_2009.gif) i vs. log
i vs. log![[thin space (1/6-em)]](https://www.rsc.org/images/entities/char_2009.gif) ν plot, which signifies a diffusion-controlled process if the b value is close to 0.5, and a capacitive dominant process if it is close to 1.0.36,48 From Fig. 5c and f, the calculated b values are found to be 0.455 and 0.598, respectively, for the cathodic peaks of Na0.6MnO2 and Mn2O3. A value of b close to 0.5 for Na0.6MnO2 and Mn2O3 indicates a diffusion-controlled process in both electrodes.
ν plot, which signifies a diffusion-controlled process if the b value is close to 0.5, and a capacitive dominant process if it is close to 1.0.36,48 From Fig. 5c and f, the calculated b values are found to be 0.455 and 0.598, respectively, for the cathodic peaks of Na0.6MnO2 and Mn2O3. A value of b close to 0.5 for Na0.6MnO2 and Mn2O3 indicates a diffusion-controlled process in both electrodes.
The rate performance for both oxide cathodes was evaluated by GCD cycling at different specific currents (Fig. 6a). GCD was performed with increasing specific currents from 0.1 A g−1 to 1.0 A g−1 with four cycles at each current, and finally returning back to cycling at the low current of 0.1 A g−1. On increasing the specific current from 0.1 A g−1 to 1.0 A g−1, Na0.6MnO2 exhibits reversible discharge capacities of 188.0, 154.0, 104.4, 90.5, 77.0, and 67.2 mA h g−1 at the specific currents of 0.1, 0.2, 0.4, 0.6, 0.8 and 1.0 A g−1, respectively. Interestingly, on returning to cycling at the lower current of 0.1 A g−1, the Na0.6MnO2 cathode delivered a specific capacity of 181.5 mA h g−1, thus displaying its stable capacity. Generally, manganese oxide materials show high specific capacity compared to pre-sodiated manganese oxides (Na0.6MnO2). At different specific currents of 0.1 A g−1 to 1.0 A g−1, the Mn2O3 cathode exhibited a comparatively higher discharge capacity of 220.0, 181.0, 148.7, 130.0, 115.0, and 101.6 mA h g−1 at the specific currents of 0.1, 0.2, 0.4, 0.6, 0.8 and 1.0 A g−1, respectively. On returning back to cycling at 0.1 A g−1, the discharge capacity was much higher than the initial capacity at 0.1 A g−1 in the case of Mn2O3 (∼281.5 mA h g−1). This may be attributed to the gradual electrode activation process, which is clearly seen in the cycling data, where Mn2O3 reaches a maximum capacity of 235.5 mA h g−1 at 0.2 A g−1 after 25 cycles (from the initial capacity of 208.4 mA h g−1), followed by capacity fading (Fig. 6d).22 The discharge capacities of the first four cycles of Na0.6MnO2 at the specific current of 0.1 A g−1 are 188.0, 194.5, 194.7, 199.7 mA h g−1, and that for Mn2O3 are 220.0, 219.0, 232.0, and 242.0 mA h g−1 at 0.1 A g−1 (Fig. 6a). This shows the stable capacity of Na0.6MnO2, whereas there is an increase in capacity upon the cycling of Mn2O3. Such an increase in the specific capacity can be ascribed to the gradual activation of the electrode with the electrolyte percolation, as reported previously.11,35,49 Thus, this result highlights the importance of the pre-sodiation of manganese oxides for the reversible insertion and extraction of Zn2+ ions.
The cycling stabilities of both Na0.6MnO2 and Mn2O3 are examined by GCD at 0.2 A g−1 for 150 cycles (Fig. 6d). As shown in Fig. 6(b and d), Na0.6MnO2 delivers a stable capacity for the first 100 cycles when cycled at 0.2 A g−1, followed by a gradual capacity fading, whereas the Mn2O3 cathode exhibits a stable capacity for only the first 50 cycles. The voltage vs. specific capacity curves of Na0.6MnO2 and Mn2O3 at 0.2 A g−1 shows the plateaus at 1.6/1.3 V and 1.5/1.3 V, corresponding to the oxidation/reduction process in CV (Fig. 6b and c). The cycling stability study displays discharge capacities of 165.2, 166.4, 180.1, 145.4, and 128.0 mA h g−1 at the 1st, 2nd, 50th, 100th, and 150th cycle, respectively, for Na0.6MnO2, thus exhibiting around 77% capacity retention after 150 cycles (Fig. 6b and d) (Table 2). Conversely, the discharge capacities of Mn2O3 at 0.2 A g−1 are 208.4, 213.3, 197.3, 99.6, and 55.5 mA h g−1 at the 1st, 2nd, 50th, 100th, and 150th cycle, respectively (Fig. 6c). Thus, the GCD studies conclude that the pre-sodiated Na0.6MnO2 cathode exhibits 77% capacity retention (Fig. 6d) compared to 26% for Mn2O3 after 150 cycles.
| Cycle number | Discharge capacity (mA h g−1) of Na0.6MnO2 at 0.2 A g−1 | Discharge capacity (mA h g−1) of Mn2O3 at 0.2 A g−1 |
|---|---|---|
| 1 | 165.2 | 208.4 |
| 2 | 166.4 | 213.3 |
| 50 | 180.1 | 197.3 |
| 100 | 145.4 | 99.6 |
| 150 | 128.0 | 55.6 |
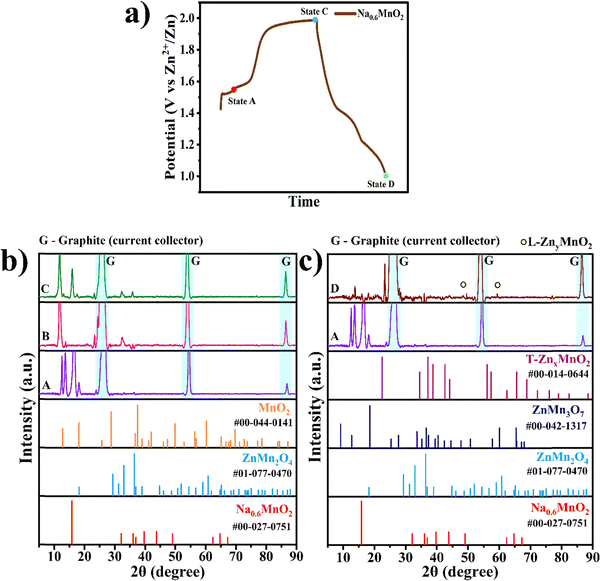
Ex situ XRD was conducted to find the phase transformation occurring during the charge–discharge process. In Fig. 7a, three different voltage states of the Na0.6MnO2 cathode are marked, where state B corresponds to the partially charged state with a potential of 1.5 V, state C corresponds to the fully charged state with a potential of 2.0 V, and state D corresponds to a fully discharged state with a potential of 1.0 V in the first cycle. Fig. 7b shows the comparison of the XRD patterns recorded at states B and C, along with state A being the pristine electrode (before assembling the cell). The XRD pattern of state A shows the diffraction peak of the P2-type Na0.6MnO2 phase appearing at 15.8° due to the (002) plane with high intensity, which belongs to the hexagonal crystal system, space group: P63/mmc (JCPDS: 00-027-0751). (i) Once the cathode is assembled in the CR2032 coin-cell against the Zn anode using 1 M ZnSO4 + 0.1 M MnSO4 electrolyte, some Zn2+ ions may get inserted into the cathode during the partial charging potential (1.5 V vs. Zn2+/Zn from OCP), forming the ZnMn2O4 spinel phase. Hence, at state B, the peaks around 32.5° and 36.0° correspond to the (103) and (211) planes of the ZnMn2O4 spinel phase (JCPDS: 01-077-0470, space group: I41/amd), respectively. This type of zinc ion-exchange mechanism taking place even before starting the galvanostatic charge–discharge cycle has been reported recently in the MnO2 cathode.50 (ii) At state C (fully charged state 2.0 V), sodium ions are extracted from the cathode, leading to the formation of the tetragonal α-MnO2 phase, which can be confirmed by peaks appearing at 13.0° (110), 17.5° (200) (JCPDS: 00-044-0141, space group: I4/m). Also, peaks at 32.5° and 36.0° corresponding to the ZnMn2O4 spinel phase are seen even at state C due to the irreversible nature of the spinel phase. Fig. 7c shows the XRD comparison of the pristine electrode and fully discharged state D. (iii) At the fully discharged state D (1.0 V), the spinel ZnMn2O4, tunnel γ-ZnxMnO2, and layered ZnyMnO2 phases are formed as expected due to the insertion of the Zn2+ ions into the manganese oxide structure. The peaks around 32.5° and 36.0° correspond to the (103) and (211) planes of the ZnMn2O4 spinel phase, as previously discussed in state C. The tetragonal ZnMn3O7 phase can be indexed to peaks present at 18.2°, 27.9°, and 57.6°, corresponding to planes (002), (003) and (404) (JCPDS: 00-047-1825), respectively. The tunnel γ-ZnxMnO2 phase can be confirmed by peaks appearing at 2θ values of 41.9°, 44.1° and 77°, which correspond to planes (300), (002) and (450) belonging to the orthorhombic phase (JCPDS: 00-014-0644), respectively. The layered ZnyMnO2 phase can be confirmed by peaks appearing at 2θ values of 48.3° and 59.2°, corresponds to planes (202) and (203) belonging to monoclinic phase (JCPDS: 00-042-1317), respectively.51,52
Apart from these diffraction peaks discussed above, highly sharp & highly intense peaks seen at 26.42°, 54.51° and 86.90° appear in all states (A–D) as it arises from the graphite sheet current collector used in our study, and can be indexed to the planes (002), (004) and (006), respectively, of graphite (JCPDS: 00-012-0212, space group: P63/mmc).
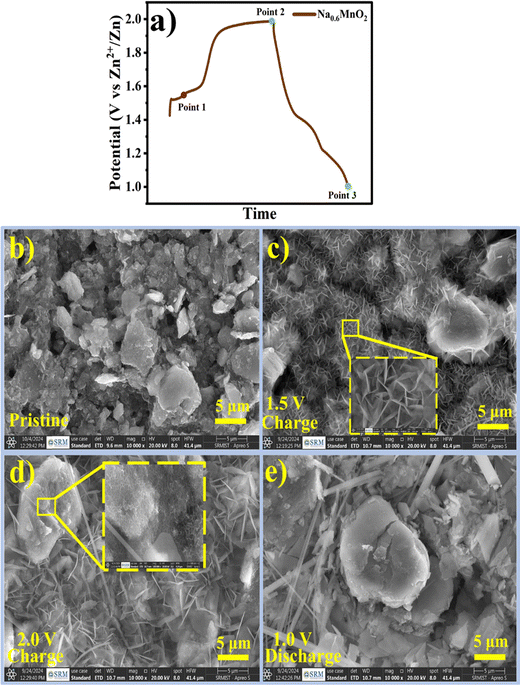
All XRD data correlate with the SEM images taken at different voltages, which show the morphology change at different potentials, signifying the phase transformation occurring in the pre-sodiated manganese oxide cathode during the charge–discharge cycle.
Based on the XRD analysis, the charge storage mechanism can be proposed as follows.
During the partial charged state (1.5 V):
| Na0.6MnO2 + xZn2+ → ZnxMn2O4 + xNa+(ion-exchange) |
During the fully charged state (2.0 V):
| ZnxMn2O4 → xZn2+ + 2MnO2 |
During the fully discharged state (1.0 V):
| Zn2+ + 2MnO2 → ZnMn2O4 + L-ZnMnO2 + T-ZnMnO2 |
The possible charge storage mechanism can be explained from the information obtained from XRD analysis at different potentials. During the partially charged state (1.5 V), the sodium ions are exchanged with Zn2+ ions from the electrolyte, as reported recently by Cui et al.50 At the fully charged state (2.0 V), the remaining sodium ions and Zn2+ ions are completely extracted, forming manganese oxide (MnO2). During the fully discharged state (1.0 V), MnO2 undergoes Zn2+ intercalation, forming possible Zn-Manganese oxide phases such as ZnMn2O4 spinel phase, T-γ-ZnMnO2 (Tunnel) and L-ZnMnO2 (layered). On further cycling, Zn2+ extraction/intercalation reversibly takes places, resulting in the enhanced cycling stability of the pre-sodiated manganese oxide cathode.
In order to study the morphological changes occurring at the electrode at different potentials, ex situ SEM was performed. Fig. 8 shows the changes in the morphology during charge–discharge in the first cycle of the Na0.6MnO2 cathode. Three points (point 1 to point 3) marked in Fig. 8a indicate the three different states of the electrode in the first cycle. Fig. 8b shows the agglomerated particle-like morphology of the pristine electrode. Considering that sodium extraction in the first cycle occurs at the voltage of ∼1.56 V to 1.6 V, the electrode was partially charged to 1.5 V (point 1) from OCP, which shows the morphology of Na0.6MnO2 during the partial charging process. At point 1 (Fig. 8c), smaller nanoflakes were formed with a size of ∼1 μm. The pristine electrode morphology was mainly transformed to smaller nanoflakes, along with the appearance of some agglomerated particles similar to that of the pristine electrode. Fig. 8d shows the fully charged state 2.0 V (point 2), where smaller nanosheets transformed into larger nanosheets of size 4–5 μm, along with the emergence of a new flower-like morphology. Considering point 1 and point 2 as states before and after sodium extraction, the morphology has significantly changed from smaller nanosheets to larger nanosheets, accompanied by flower-like morphology, which may be due to the nanosheet-like MnO2 phase formation on sodium extraction. The nanosheet-like formation could be due to excess crystal water content present in the interlayer spacing during charging, as reported in the previous literature.53 When the electrode was discharged to 1.0 V (point 3), all of the nanosheet and flower-like structures disappeared, resulting in large-size agglomerated/irregular particles. This serves as evidence for Zn2+ insertion during discharge, forming the ZnMn2O4 and ZnxMnO2 phases. At point 3, the particles are large in size (>5 μm) compared to pristine electrode (∼5 μm). The EDS measurements reveal the presence of Zn, Mn, and O, and the absence of the sodium element. This further confirms the reversible insertion/extraction of the Zn2+ species, rather than the reversible insertion/extraction of sodium ions.54 The appearance of no cracks and flake formation during the discharged state ensures the reversible Zn2+ insertion/extraction with the higher cycling stability of the pre-sodiated manganese oxide electrode. The XRD serves as evidence along with SEM images, proving the phase transformation occurring in the manganese oxide-based cathodes.
In order to measure the Zn-ion diffusion coefficients at particular voltages, a GITT experiment was performed. Before performing the GITT experiment, the cell was charged and discharged at 100 mA g−1 for two cycles. During the GITT procedure, a current pulse of 50 mA g−1 was applied for a time of 15 min and the cell was relaxed for 40 min, which was then repeated for the entire charge/discharge process. The diffusion coefficients of Zn2+ ions in the pre-sodiated (Na0.6MnO2) and non-pre sodiated (Mn2O3) cathode were calculated from the GITT data using the formula:
Fig. 9a and b shows the GITT curves, and the calculated diffusion coefficient (DZn2+) of the Na0.6MnO2 and Mn2O3 cathodes during the charge and discharge process are shown in Fig. 9(c and d). The calculated DZn2+ for the Na0.6MnO2 cathode is found in the range of 10−9 to 10−11 cm2 s−1 orders of magnitude, and is in the range of 10−8 to 10−13 cm2 s−1 for the Mn2O3 cathode.46,55 This indicates that the good conductivity and high diffusion of the Zn2+ ions in the Na0.6MnO2 cathode are due to its hexagonal sheet-like structure, which facilitates faster reaction kinetics, electron transfer and Zn-ion diffusion. Conversely, the diffusion coefficient of the Zn2+ ions in Mn2O3 is 2 orders of magnitude lower compared to that of Na0.6MnO2. During discharge, the H+ diffusion occurring around 1.3 V shows a higher diffusion coefficient (10−9 cm2 s−1) compared to the Zn2+ diffusion occurring around 1.1 V (10−10 cm2 s−1) in Na0.6MnO2. This is because of the large size of the hydrated Zn2+ ion (4.7 Å).
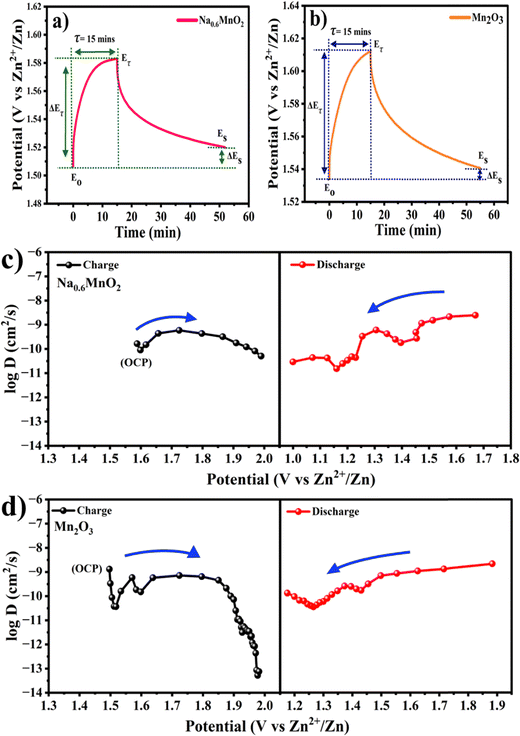 | ||
| Fig. 9 Single GITT curves of (a) Na0.6MnO2; (b) Mn2O3; (c) diffusion coefficient values of Na0.6MnO2 during charge–discharge; (d) diffusion coefficient values of Mn2O3 during charge–discharge. | ||
In order to evaluate the electrode kinetics parameters such as charge transfer resistance (Rct) and diffusion coefficient of Zn2+ onto the active mass, the electrochemical impedance spectra (EIS) were measured on the Na0.6MnO2 and Mn2O3 cathodes in the frequency range of 100 kHz to 10 mHz. Two semicircles are observed for both samples when analyzed after completing 5 cycles at the discharged state (Fig. 10a). The semicircle at the high-frequency region corresponds to the parallel combination of the surface film resistance (Rsf) and capacitance, whereas the diameter of the 2nd semicircle represents the value of Rct.12,35 The appearance of a semicircle at the high-frequency range indicates the presence of a surface precipitation layer on both cathode surfaces due to the pH change during battery cycling.42 The Rsf values (diameter of 1st semicircle) are found to be 68 Ω and 44 Ω, respectively, and the Rct values are found to be 378 Ω and 223 Ω, respectively, for Na0.6MnO2 and Mn2O3 (Fig. 10a). These cell impedance values can be well correlated with their initial specific capacity differences. Thus, the Mn2O3 cathode exhibits a high specific capacity (∼208 mA h g−1) due to its small Rct (223 Ω) compared to that of the Na0.6MnO2 cathode (165 mA h g−1) with a Rct value of 378 Ω, when cycled at 0.2 A g−1 (Fig. 6a and b).
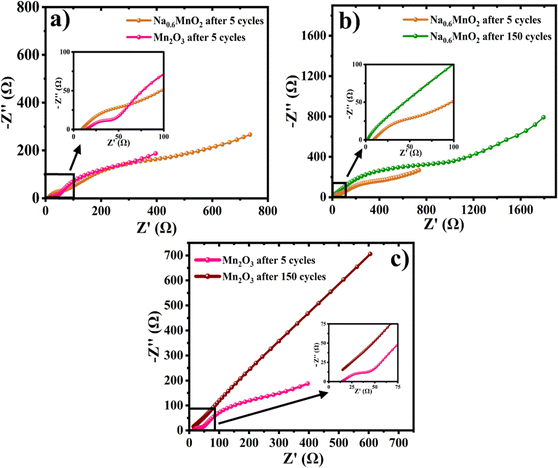 | ||
| Fig. 10 (a) EIS spectra of Na0.6MnO2 and Mn2O3 after 5 cycles; (b) and (c) comparison of EIS of Na0.6MnO2 and Mn2O3 after 5 cycles and upon completion of 150 cycles at 0.2 A g−1. | ||
The Nyquist plots in Fig. 10b show the comparative impedance response of Na0.6MnO2 recorded after 5 cycles and after completing the 150th cycle at 0.2 A g−1. The values of Rct (the diameter of the second semicircle) are found to increase from 378 Ω to 945 Ω after 150 cycles, indicating the increase in the charge-transfer resistance during cycling (Table 3). Fig. 10c shows the impedance response of Mn2O3 recorded after 5 cycles and after completing 150 cycles at 0.2 A g−1. The linear spike at the low frequency region after 5 cycles indicates the diffusion of zinc-ions onto the active mass, whereas after 150 cycles, there is a transition from the Warburg diffusion to the capacitive behaviour (less diffusion). Thus, the Mn2O3 cathode exhibits a high initial specific capacity (∼208 mA h g−1) and suffers from a drastic capacity fading of 153 mA h g−1 (finally ∼55 mA h g−1), retaining only 26% capacity retention after 150 cycles. Hence, the EIS data support the GCD cycling performance, where Na0.6MnO2 shows less capacity fading after 150 cycles (Fig. 6d), supporting the enhanced cycling stability of the pre-sodiated material during extensive cycling.
| Sample | R s (Ω) | R sf (Ω) | R ct (Ω) |
|---|---|---|---|
| Na0.6MnO2 | 9.50 | 67.58 | 378.29 |
| Mn2O3 | 14.73 | 44.17 | 223.26 |
The diffusion coefficient (D) can be calculated from EIS using the following equations (eqn (3) and (4)):35
| Z′ = R1 + Rct + σω(−1/2) | (3) |
 | (4) |
Fig. 11(a and b) shows the linear fitting results according to eqn (2), which is taken in the low-frequency region of the EIS spectrum of the Na0.6MnO2 cathode after 5 cycles and after 150 cycles. The linear fitted line gives the slope values of σ = 42.80 and 104.10 after 5 cycles and 150 cycles at 0.2 A g−1, respectively. The diffusion coefficient values are calculated as per eqn (3), and found to be 8.17 × 10⁻⁶ after 5 cycles and 1.38 × 10⁻⁶ cm2 s−1 after 150 cycles, which clearly shows that the diffusion of the Zn2+ ions is maintained even after 150 cycles. Similarly, the linear fitted line of Mn2O3 gives the slope value of σ = 31.10 and 58.90 after 5 cycles and 150 cycles, respectively. The corresponding diffusion coefficient values are calculated as per eqn (3), and found to be 1.55 × 10⁻⁵ and 4.31 × 10⁻⁶ cm2 s−1, respectively, after 5 and 150 cycles (Table 4). Thus, there is a decrease in the diffusion coefficient of the Zn2+ ions into the Mn2O3 cathode upon prolonged cycling compared to that after 5 cycles. This may be due to the structural changes of Mn2O3 upon prolonged cycling.12,21 The Zn2+ diffusion coefficients of Na0.6MnO2 and Mn2O3 were calculated using the Randles–Sevcik equation, and are 1.15 × 10⁻⁵ cm2 s−1 and 4.96 × 10⁻⁵ cm2 s−1, respectively (Fig. S2, ESI†). This data is comparable to the DZn2+ value calculated from EIS, as shown in Table 4. Thus, Mn2O3 cathode exhibits a high initial specific capacity (∼208 mA h g−1) due to the high DZn2+ (1.55 × 10⁻⁵ cm2 s−1) compared to the Na0.6MnO2 cathode (165 mA h g−1) with a low DZn2+ (8.17 × 10⁻⁶ cm2 s−1) when cycled at 0.2 A g−1 (Fig. 6a and b).
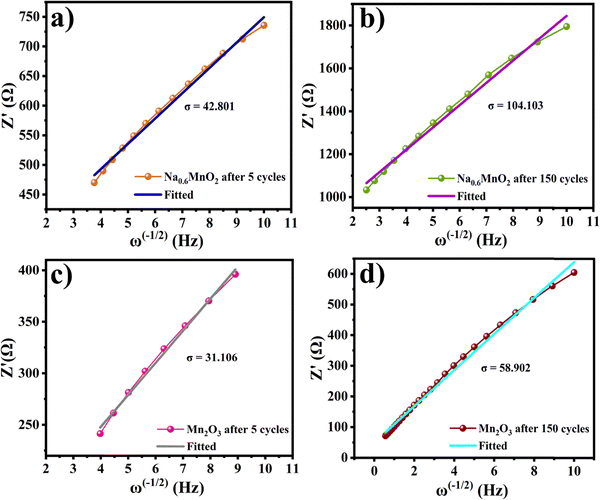 | ||
| Fig. 11 Plots of Z′ vs. ω−1/2 of the Na0.6MnO2 cathode (a) and (b) and that of Mn2O3 (c) and (d) after 5 cycles and 150 cycles, respectively. | ||
| D Zn2+ calculated from EIS after 5 cycles (cm2 s−1) | D Zn2+ calculated from Randles Sevcik equation (cm2 s−1) | |
|---|---|---|
| Na0.6MnO2 | 0.82 × 10⁻⁵ | 1.15 × 10⁻⁵ |
| Mn2O3 | 1.55 × 10⁻⁵ | 4.96 × 10⁻⁵ |
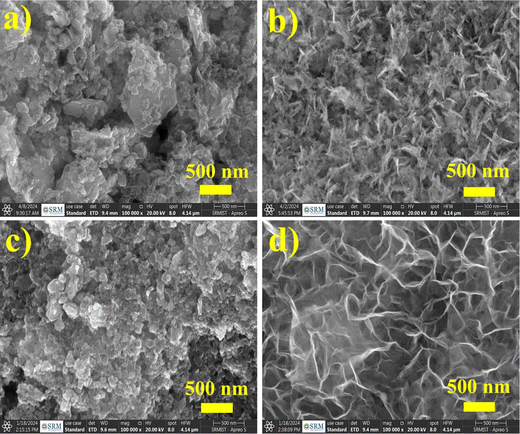
To study the morphology changes before and after cycling, the coin-cell was disassembled after performing 150 charge–discharge cycles at 0.2 A g−1, and the Na0.6MnO2 electrode was washed with deionized water and dried under vacuum. Fig. 12(a and b) shows the surface morphology of the pristine and cycled electrodes (150 cycles) of Na0.6MnO2 using HRSEM images. Only a minimal change in the surface morphology is observed upon the cycling of the Na0.6MnO2 electrode. This structural integrity helps in explaining the high capacity retention of the Na0.6MnO2 electrode, as seen in the GCD cycling data (Fig. 6d). Fig. 12(c and d) shows the morphology of the pristine and cycled Mn2O3 electrode, where a significant change in the morphology was observed after 150 cycles. This change in morphology can be the cause of the capacity fading observed in the case of the Mn2O3 cathode (Fig. 6d) due to the decrease in the zinc-ion diffusion and electrolyte percolation. Based on the post-mortem analysis, it highlights the importance of pre-sodiation in the manganese oxide-based cathode for AZIBs, which effectively alleviates the capacity fading issue predominantly observed in the case of manganese oxide-based cathodes. Thus, this work might help future researchers in studying various other pre-sodiated manganese oxide cathodes for AZIB application.
In order to demonstrate the practical application, an aqueous Zn||Na0.6MnO2 coin-cell was charged to 1.9 V and then connected to a red LED. Fig. 13 shows that the aqueous Zn||Na0.6MnO2 battery can power a red LED for 30 min, which indeed shows its practical applicability. Hence, AZIBs are a promising candidate for large-scale stationary energy storage applications in future. This brings us one step closer towards the development of sustainable energy storage devices based on abundant, low-cost, and environmentally friendly pre-sodiated manganese oxides and aqueous electrolytes.
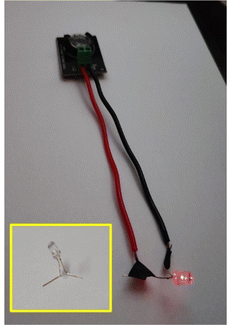 | ||
| Fig. 13 Digital image of the Zn||Na0.6MnO2 battery powering a red LED. Inset: LED without connection to the Zn||Na0.6MnO2 battery. | ||
4. Conclusions
The P2-Na0.6MnO2 material is synthesized by a simple hydrothermal method, followed by annealing at 900 °C, and its electrochemical performance for AZIB was studied. HRSEM and HRTEM show the morphology of Mn2O3 to be agglomerated particles, whereas that of Na0.6MnO2 was hexagonal sheets. HRTEM and XRD analysis confirmed the formation of different crystalline Mn2O3 and Na0.6MnO2. Although Mn2O3 exhibited an initial high specific capacity of 208 mA h g−1, it can retain only 26% capacity, whereas Na0.6MnO2 can retain up to 77% capacity after 150 cycles. In addition, the EIS data support the high diffusion coefficient of Zn2+ and less charge transfer resistance of the Na0.6MnO2 cathode. The post-mortem analysis by SEM shows that Na0.6MnO2 retains its morphology even after 150 cycles, which supports its long-term cycling stability. While Mn2O3 possesses an initial high diffusion coefficient, there is a drastic change upon prolonged cycling. This may be due to the structural change that results in a large capacity fading. Therefore, the pre-sodiation strategy is found to be beneficial and imparts new insights into developing alkali metal cation (Na+ in particular)-inserted Mn-oxide-based advanced cathodes for sustainable rechargeable AZIBs.Author contributions
Anjeline W. and P. K. Nayak conceptualized the work. Anjeline synthesized the sample, performed the experiments, and wrote the original draft, which was reviewed and edited by P. K. Nayak.Data availability
The data supporting this article have been included in the main text and ESI.†Conflicts of interest
There are no conflicts of interest to declare.Acknowledgements
The authors would like to thank the SRM Institute of Science and Technology (SRMIST) for providing all the research facilities, including SRM-SCIF and Nanotechnology Research Centre (NRC) for structural measurements. P. K. Nayak is grateful for the funding support within Start-up Research Grant (SRG/2022/001178) by SERB, India.References
- J. B. Goodenough and K. S. Park, The Li-Ion Rechargeable Battery: A Perspective, J. Am. Chem. Soc., 2013, 135, 1167–1176 CrossRef CAS.
- J. O. G. Posada, A. J. R. Rennie, S. P. Villar, V. L. Martins, J. Marinaccio, A. Barnes, C. F. Glover, D. A. Worsley and P. J. Hall, Aqueous Batteries as Grid Scale Energy Storage Solutions, Renewable Sustainable Energy Rev., 2017, 68, 1174–1182 CrossRef CAS.
- Z. Pan, X. Liu, J. Yang, X. Li, Z. Liu, X. J. Loh and J. Wang, Aqueous Rechargeable Multivalent Metal-Ion Batteries: Advances and Challenges, Adv. Energy Mater., 2021, 11, 2100608 CrossRef CAS.
- J. Liu, J. Hu, Q. Deng, J. Mo, H. Xie, Z. Liu, Y. Xiong, X. Wu and Y. Wu, Aqueous Rechargeable Batteries for Large-Scale Energy Storage, Isr. J. Chem., 2015, 55, 521–536 CrossRef CAS.
- C. Wu, H. Tan, W. Huang, C. Liu, W. Wei, L. Chen and Q. Yan, The Strategies to Improve the Layered-Structure Cathodes for Aqueous Multivalent Metal-Ion Batteries, Mater. Today Energy, 2021, 19, 100595 CrossRef CAS.
- G. Fang, J. Zhou, A. Pan and S. Liang, Recent Advances in Aqueous Zinc-Ion Batteries, ACS Energy Lett., 2018, 3, 2480–2501 CrossRef CAS.
- F. Wan, X. Zhou, Y. Lu, Z. Niu and J. Chen, Energy Storage Chemistry in Aqueous Zinc Metal Batteries, ACS Energy Lett., 2020, 5, 3569–3590 CrossRef CAS.
- J. Shin, J. Lee, Y. Park and J. W. Choi, Aqueous Zinc Ion Batteries: Focus on Zinc Metal Anodes, Chem. Sci., 2020, 11, 2028–2044 RSC.
- L. Chen, Q. An and L. Mai, Recent Advances and Prospects of Cathode Materials for Rechargeable Aqueous Zinc-Ion Batteries, Adv. Mater. Interfaces, 2019, 6, 1900387 CrossRef.
- B. Lee, C. S. Yoon, H. R. Lee, K. Y. Chung, B. W. Cho and S. H. Oh, Electrochemically-Induced Reversible Transition from the Tunneled to Layered Polymorphs of Manganese Dioxide, Sci. Rep., 2014, 4, 6066 CrossRef CAS.
- Z. Zhou, L. Wang, J. Liang, C. Zhang, W. Peng, Y. Li, G. Zhang, F. Zhang and X. Fan, Two-Dimensional Hierarchical Mn2O3@graphene as a High Rate and Ultrastable Cathode for Aqueous Zinc-Ion Batteries, J. Mater. Chem. C, 2021, 9, 1326–1332 RSC.
- M. Mao, X. Wu, Y. Hu, Q. Yuan, Y.-B. He and F. Kang, Charge Storage Mechanism of MOF-Derived Mn2O3 as High Performance Cathode of Aqueous Zinc-Ion Batteries, J. Energy Chem., 2021, 52, 277–283 CrossRef CAS.
- Q. L. Gao, D. S. Li, X. M. Liu, Y. F. Wang, W. L. Liu, M. M. Ren, F. G. Kong, S. J. Wang and R. C. Zhou, Biomass-Derived Mesoporous Carbons Materials Coated by α-Mn3O4 with Ultrafast Zinc-Ion Diffusion Ability as Cathode for Aqueous Zinc Ion Batteries, Electrochim. Acta, 2020, 335, 135642 CrossRef CAS.
- D. Kundu, B. D. Adams, V. Duffort, S. H. Vajargah and L. F. Nazar, A High-Capacity and Long-Life Aqueous Rechargeable Zinc Battery Using a Metal Oxide Intercalation Cathode, Nat. Energy, 2016, 1, 1–8 Search PubMed.
- Y. Liu, C. Li, J. Xu, M. Ou, C. Fang, S. Sun, Y. Qiu, J. Peng, G. Lu, Q. Li, J. Han and Y. Huang, Electroactivation-Induced Spinel ZnV2O4 as a High-Performance Cathode Material for Aqueous Zinc-Ion Battery, Nano Energy, 2020, 67, 104211 CrossRef CAS.
- H. Liang, Z. Cao, F. Ming, W. Zhang, D. H. Anjum, Y. Cui, L. Cavallo and H. N. Alshareef, Aqueous Zinc-Ion Storage in MoS2 by Tuning the Intercalation Energy, Nano Lett., 2019, 19, 3199–3206 CrossRef CAS PubMed.
- Z. Liu, G. Pulletikurthi and F. Endres, A Prussian Blue/Zinc Secondary Battery with a Bio-Ionic Liquid-Water Mixture as Electrolyte, ACS Appl. Mater. Interfaces, 2016, 8, 12158–12164 CrossRef CAS PubMed.
- R. Trócoli, G. Kasiri and F. La Mantia, Phase Transformation of Copper Hexacyanoferrate (KCuFe(CN)6) during Zinc Insertion: Effect of Co-Ion Intercalation, J. Power Sources, 2018, 400, 167–171 CrossRef.
- M. S. Chae and S. T. Hong, Prototype System of Rocking-Chair Zn-Ion Battery Adopting Zinc Chevrel Phase Anode and Rhombohedral Zinc Hexacyanoferrate Cathode, Batteries, 2019, 5, 3–15 CrossRef CAS.
- G. Li, Z. Yang, Y. Jiang, C. Jin, W. Huang, X. Ding and Y. Huang, Towards Polyvalent Ion Batteries: A Zinc-Ion Battery Based on NASICON Structured Na3V2(PO4)3, Nano Energy, 2016, 25, 211–217 CrossRef CAS.
- D. Zhang, J. Cao, X. Zhang, N. Insin, S. Wang, J. Han, Y. Zhao, J. Qin and Y. Huang, Inhibition of Manganese Dissolution in Mn2O3 Cathode with Controllable Ni2+ Incorporation for High-Performance Zinc Ion Battery, Adv. Funct. Mater., 2021, 31, 2009412 CrossRef CAS.
- A. Huang, W. Zhou, A. Wang, M. Chen, J. Chen, Q. Tian and J. Xu, Self-Initiated Coating of Polypyrrole on MnO2/Mn2O3 Nanocomposite for High-Performance Aqueous Zinc-Ion Batteries, Appl. Surf. Sci., 2021, 545, 149041 CrossRef CAS.
- X. Z. Zhai, J. Qu, S. M. Hao, Y. Q. Jing, W. Chang, J. Wang, W. Li, Y. Abdelkrim, H. Yuan and Z. Z. Yu, Layered Birnessite Cathode with a Displacement/Intercalation Mechanism for High-Performance Aqueous Zinc-Ion Batteries, Nanomicro Lett., 2020, 12, 1–15 Search PubMed.
- B. Zhang, P. Dong, S. Yuan, Y. Zhang, Y. Zhang and Y. Wang, Manganese-Based Oxide Cathode Materials for Aqueous Zinc-Ion Batteries: Materials, Mechanism, Challenges, and Strategies, Chem Bio Eng., 2024, 1, 113–132 CrossRef CAS.
- S. Jia, L. Li, Y. Shi, C. Wang, M. Cao, Y. Ji and D. Zhang, Recent development of manganese dioxide-based materials as zinc-ion battery cathode, Nanoscale, 2024, 16, 1539–1576 RSC.
- Q. Qu, P. Zhang, B. Wang, Y. Chen, S. Tian, Y. Wu and R. Holze, Electrochemical performance of MnO2 nanorods in neutral aqueous electrolytes as a cathode for asymmetric supercapacitors, J. Phys. Chem. C, 2009, 113, 14020–14027 CrossRef CAS.
- P. Ragupathy, D. H. Park, G. Campet, H. N. Vasan, S. J. Hwang, J. H. Choy and N. Munichandraiah, Remarkable capacity retention of nanostructured manganese oxide upon cycling as an electrode material for supercapacitor, J. Phys. Chem. C, 2009, 113, 6303–6309 CrossRef CAS.
- S. Devaraj and N. Munichandraiah, Effect of crystallographic structure of MnO2 on its electrochemical capacitance properties, J. Phys. Chem. C, 2008, 112, 4406–4417 CrossRef CAS.
- N. Zhang, X. Chen, M. Yu, Z. Niu, F. Cheng and J. Chen, Materials Chemistry for Rechargeable Zinc-Ion Batteries, Chem. Soc. Rev., 2020, 49, 4203–4219 RSC.
- Y. Zhao, Y. Zhu and X. Zhang, Challenges and Perspectives for Manganese-Based Oxides for Advanced Aqueous Zinc-Ion Batteries, Info. Mat., 2020, 2, 237–260 CAS.
- H. Pan, Y. Shao, P. Yan, Y. Cheng, K. S. Han, Z. Nie, C. Wang, J. Yang, X. Li, P. Bhattacharya, K. T. Mueller and J. Liu, Reversible Aqueous Zinc/Manganese Oxide Energy Storage from Conversion Reactions, Nat. Energy, 2016, 1, 1–7 Search PubMed.
- H. Lv, Y. Song, Z. Qin, M. Zhang, D. Yang, Q. Pan, Z. Wang, X. Mu, J. Meng, X. Sun and X. X. Liu, Disproportionation enabling reversible MnO2/Mn2+ transformation in a mild aqueous Zn-MnO2 hybrid battery, Chem. Eng. J., 2022, 430, 133064 CrossRef CAS.
- B. Wu, G. Zhang, M. Yan, T. Xiong, P. He, L. He, X. Xu and L. Mai, Graphene Scroll-Coated α-MnO2 Nanowires as High-Performance Cathode Materials for Aqueous Zn-Ion Battery, Small, 2018, 14, 1703850 CrossRef.
- C. Liu, Q. Li, H. Sun, Z. Wang, W. Gong, S. Cong, Y. Yao and Z. Zhao, MOF-Derived Vertically Stacked Mn2O3@C Flakes for Fiber-Shaped Zinc-Ion Batteries, J. Mater. Chem. A, 2020, 8(45), 24031–24039 RSC.
- S. Saadi-motaallegh, M. Javanbakht, H. Omidvar and S. Habibzadeh, A Novel Ni-Doped ZnMn2O4/Mn2O3 Nanocomposite Synthesized by Pulsed Potential as Superior Zinc Ion Battery Cathode Material, J. Alloys Compd., 2023, 963, 171119 CrossRef CAS.
- Y. He, Y. Pu, Y. Zheng, B. Zhu, P. Guo, X. Zhang, L. He, X. Wan and H. Tang, Carbon Nanofiber-Coated MnO Composite as High-Performance Cathode Material for Aqueous Zinc-Ion Batteries, J. Phys. Chem. Solids, 2024, 184, 111669 CrossRef CAS.
- W. Zhao, Q. Kong, X. Wu, X. An, J. Zhang, X. Liu and W. Yao, ε-MnO2@C Cathode with High Stability for Aqueous Zinc-Ion Batteries, Appl. Surf. Sci., 2022, 605, 154685 CrossRef CAS.
- P. F. Wang, Y. You, Y. X. Yin and Y. G. Guo, Layered Oxide Cathodes for Sodium-Ion Batteries: Phase Transition, Air Stability, and Performance, Adv. Energy Mater., 2018, 8, 1701912 CrossRef.
- A. A. Nechikott and P. K. Nayak, Electrochemical Capacitance Properties of Pre-Sodiated Manganese Oxide for Aqueous Na-Ion Supercapacitors, RSC Adv., 2023, 13, 14139–14149 RSC.
- Z. Liu, X. Xu, S. Ji, L. Zeng, D. Zhang and J. Liu, Recent Progress of P2-Type Layered Transition-Metal Oxide Cathodes for Sodium-Ion Batteries, Chem. Eur. J., 2020, 26, 7747–7766 CrossRef PubMed.
- J. Li, L. Li, H. Shi, Z. Zhong, X. Niu, P. Zeng, Z. Long, X. Chen, J. Peng, Z. Luo, X. Wang and S. Liang, Electrochemical Energy Storage Behavior of Na0.44MnO2 in Aqueous Zinc-Ion Battery, ACS Sustainable Chem. Eng., 2020, 8, 10673–10681 CAS.
- T. H. Wu, L. H. Yen and Y. Q. Lin, Defect Regulated Spinel Mn3O4 Obtained by Glycerol–Assisted Method for High–Energy–Density Aqueous Zinc–Ion Batteries, J. Colloid Interface Sci., 2022, 625, 354–362 CrossRef CAS PubMed.
- T. Yuan, J. Zhang, X. Pu, Z. Chen, C. Tang, X. Zhang, X. Ai, Y. Huang, H. Yang and Y. Cao, A Novel Alkaline Zn/Na0.44MnO2 Dual-Ion Battery with a High Capacity and Long Cycle Lifespan, ACS Appl. Mater. Interfaces, 2018, 10, 34108–34115 CrossRef CAS PubMed.
- T. Sun, X. Yao, Y. Luo, M. Fang, M. Shui, J. Shu and Y. Ren, Micron-sized Na0.7MnO2.05 as cathode materials for aqueous rechargeable magnesium-ion batteries, Ionics, 2019, 25, 4805–4815 CrossRef CAS.
- N. Pal, A. Sharma, V. Acharya, N. K. Chourasia, S. Biring and B. N. Pal, Gate interface engineering for subvolt metal oxide transistor fabrication by using ion-conducting dielectric with Mn2O3 gate interface, ACS Appl. Electron. Mater., 2020, 2, 25–34 CrossRef CAS.
- X. Gao, H. Wu, W. Li, Y. Tian, Y. Zhang, H. Wu, L. Yang, G. Zou, H. Hou and X. Ji, H+-insertion boosted α-MnO2 for an aqueous Zn-ion battery, Small, 2020, 16, 1905842 CrossRef CAS PubMed.
- J. Yao, T. Yu, Q. Huang, Y. Li, B. Huang and J. Yang, Preparation of Mn2O3/Fe2O3 Composite Cathode Material for Zinc Ion Batteries from the Reduction Leaching Solution of Manganese Ore Tailing, J. Ind. Eng. Chem., 2024, 136, 524–531 CrossRef CAS.
- L. Chen, Z. Yang, H. Qin, X. Zeng, J. Meng and H. Chen, Graphene-Wrapped Hollow ZnMn2O4 Microspheres for High-Performance Cathode Materials of Aqueous Zinc Ion Batteries, Electrochim. Acta, 2019, 317, 155–163 CrossRef CAS.
- R. Liang, J. Fu, Y. P. Deng, Y. Pei, M. Zhang, A. Yu and Z. Chen, Parasitic Electrodeposition in Zn-MnO2 Batteries and Its Suppression for Prolonged Cyclability, Energy Storage Mater., 2021, 36, 478–484 CrossRef.
- S. Cui, D. Zhang and Y. Gan, Traditional Electrochemical Zn2+ Intercalation/Extraction Mechanism Revisited: Unveiling Ion-Exchange Mediated Irreversible Zn2+ Intercalation for the δ-MnO2 Cathode in Aqueous Zn Ion Batteries, Adv. Energy Mater., 2024, 14, 2302655 CrossRef CAS.
- N. Zhang, F. Cheng, J. Liu, L. Wang, X. Long, X. Liu, F. Li and J. Chen, Rechargeable aqueous zinc-manganese dioxide batteries with high energy and power densities, Nat. Commun., 2017, 8, 1–9 CrossRef.
- Y. Zhao, Y. Zhu and X. Zhang, Challenges and perspectives for manganese-based oxides for advanced advanced aqueous zinc-ion batteries, InfoMat, 2020, 2, 237–260 CrossRef CAS.
- K. W. Nam, H. Kim, J. H. Choi and J. W. Choi, Crystal water for high performance layered manganese oxide cathodes in aqueous rechargeable zinc batteries, Energy Environ. Sci., 2019, 12, 1999–2009 RSC.
- B. Jiang, C. Xu, C. Wu, L. Dong, J. Li and F. Kang, Manganese sesquioxide as cathode material for multivalent zinc ion battery with high capacity and long cycle life, Electrochim. Acta, 2017, 229, 422–428 CrossRef CAS.
- N. Zhang, F. Cheng, Y. Liu, Q. Zhao, K. Lei, C. Chen, X. Liu and J. Chen, Cation-deficient spinel ZnMn2O4 cathode in Zn(CF3SO3)2 electrolyte for rechargeable aqueous Zn-ion battery, J. Am. Chem. Soc., 2016, 138, 12894–12901 CrossRef CAS PubMed.
Footnote |
| † Electronic supplementary information (ESI) available. See DOI: https://doi.org/10.1039/d4ma00824c |
| This journal is © The Royal Society of Chemistry 2024 |

