DOI:
10.1039/D4MA00926F
(Paper)
Mater. Adv., 2024,
5, 9756-9773
Structural, thermal, and optical spectroscopic studies of Sm3+-doped Ba2ZnSi2O7 phosphors for optical thermometry applications
Received
14th September 2024
, Accepted 1st November 2024
First published on 21st November 2024
Abstract
Samarium-doped Ba2ZnSi2O7 orange red-emitting phosphors for novel applications in temperature measurement were prepared by a solid-state synthesis method. A Ba2ZnSi2O7 akermanite-structured Sm3+ phosphor was allocated to the C2/c space group and monoclinic system. Using FTIR, identification of different bonds with their vibrational modes has been done. Stimulated at 403 nm, the as-prepared phosphors show yellow (560 nm), orange (600 and 645 nm), and red (705 nm) emissions, which were also used to maximize the dopant concentration. Sm3+ ions may be uniformly dispersed throughout the Ba2ZnSi2O7 matrix, and Sm3+ consists of irregular microparticles. Optical energy bandgap values for Ba2ZnSi2O7 and 0.4 mol%Sm3+ (∼3.33 eV and ∼3.40 eV) reveal the formation of faulty energy levels in the band gap. Sm3+ quenching at an appropriate concentration of 0.4 mol%, with a critical distance of approximately 44.33 Å, and a θ value of 3.93, almost equal to 4, was found to be indicative of the dipole–dipole type of electric multipolar interaction. Excellent thermal stability of the PL peaks was observed in Ba2ZnSi2O7:0.4%Sm3+. A novel dual-model thermometry approach based on an adjusted Boltzmann population distribution and an exponential function would be put forward. The Ba2ZnSi2O7:Sm3+ phosphor exhibited relative sensitivities of 2.02% K−1 based on modified Boltzmann population distribution through the FIR strategy and temperature-dependent lifetime was also employed to calculate relative sensitivities of 3.25% K−1 based on exponential function. In light of these experimental results, the produced Sm3+ doped Ba2ZnSi2O7 phosphors can thus be a promising choice for UV-excitable warm lighting systems and non-contact optical thermometry measurements.
Introduction
In this modern era of digitalization and industrialization, several environmental factors such as pressure, humidity, and temperature affect the environment.1 Temperature is one such parameter that needs to be detected and controlled to have a healthy environment. In everyday life, and in chemistry, medicine, the military, and other sectors, temperature sensors are often utilized.2–5 Electro-mechanical temperature sensors, thermocouple sensors, and optical temperature sensors are the three categories of temperature sensors.6–8 The contact type of electro-mechanical temperature sensors, which measure temperature based on material expansion and contraction, has limited the range of applications. Because of their simplicity, usability, and broad measurement range, thermocouples are frequently utilized as temperature sensors. Nevertheless, thermocouples frequently experience limited sensitivity and interference from the surrounding environment. In recent times, optical temperature sensors have gained significant attention due to their advantages over traditional thermometers. These advantages include fast response times, high sensitivity, non-invasive detection, anti-electromagnetic interference, and the ability to measure the local microenvironment's temperature distribution.9,10 Optical temperature sensing technology can be explored by manifesting different optical information such as luminescence intensity,11 lifetime,12 band shift, bandwidth,13 and polarization.14
To obtain highly precise and good sensing optical thermometers it is necessary to have a chemically, thermally, and optically stable luminescent material that is preferential. Phosphors are one such material that intrigued researchers’ interest for several applications including optical thermometry. These inorganic materials consist of two distinct compositions, the host and activator. Selecting a suitable host is a key factor in having stable material at high temperatures, different chemical environments, and high pressures. Among different host systems, alkaline earth silicates have recently attracted attention from material scientists due to their outstanding properties. A2BSi2O7 (A = Ca, Ba, Sr; B = Mg, Zn) generally has akermanite-based structures but it does not belong to the melilite groups of sorosilicate.15 Trivalent lanthanide ions are unique and attractive due to their remarkable luminescence properties, which include sharp emission lines and high lumen equivalent.16 Samarium exhibits visible and near-infrared fluorescence, and its energy level structure is complicated, with ground 6HJ and 6FJ multiplets and an excited 4G5/2 level. Sm3+ ions are efficiently emitted in association with the intra-4f shell transition. As a result, Sm3+ ions frequently have a significant impact on how materials glow.17,18 Until now, a lot of scholars have delved into and examined the characteristics of A2BSi2O7 (A = Ca, Ba, Sr; B = Mg, Zn) phosphor hosts. Among the phosphors that have been reported are Ca2MgSi2O7,19 Ca2MgSi2O7:Eu3+,20 Ca2MgSi2O7:Eu2+,Dy3+,21 Ca2MgSi2O7:Eu2+,22 Sr2MgSi2O7:Eu2+,Dy3+,23 Sr2MgSi2O7:Tb3+,Eu3+,24 Ba2MgSi2O7:Eu2+/Eu3+,25 Ba2MgSi2O7:Sm3+,Bi3+,26 Ca2ZnSi2O7:Sm3+,27 Ca2ZnSi2O7:Pr3+, A (A = Li+, Na+, K+),28 Ca2ZnSi2O7:Dy3+,29 Ca2ZnSi2O7:Eu3+/Al3+,30 Sr2ZnSi2O7:Mn2+,31 and Sr2ZnSi2O7:Dy3+.32 Y. Patel et al. synthesized Dy3+ doped Ba2ZnSi2O7 phosphors and studied their optical properties for solid-state lighting applications at room temperature, finding an optimum concentration of 0.2 mol%. The PL study also demonstrates low color purity values and CIE color coordinate positions to promote the emission of white light, with CCT values falling in the cool range. The double exponent approximation provided a good match for the afterglow decay curve and estimates of the fast and slow decay lifetimes were found.15 S. Chandraker et al. found the PL optimum concentration to be 1.5 mol%. TL glow curve revealed a composite composition and a maximum intensity at 300 °C. The TL response rate rises linearly with increasing UV exposure, and the order of kinetics was first order. They found that for traps at increasing temperatures, the trap depth increases.33 Z. Yang et al. studied Ce3+, Tb3+ doped Ba2ZnSi2O7 phosphors and their color-tuning properties for lighting applications. They found that in the co-doped samples, an effective energy transfer occurs from Ce3+ to Tb3+ through a non-radiative mechanism, leading to increased green emission from them. When exposed to UV radiation, the color of the particles can change from blue to green, resulting from an increase in Tb3+ concentrations from 0.00 to 0.06 with a fixed Ce3+ concentration of 0.02.34 D. Shengzhi and his coworkers synthesized tricolour emitting triply doped Ba2ZnSi2O7:Ce3+,Eu3+,Eu2+ phosphors using a solid-state reaction method and studied their energy transfer techniques. They concluded that under UV excitation, energy would pass from Eu2+ → Eu3+via Ce3+ upon excitation by near-UV light. As a consequence, the concentration of Eu3+ and Ce3+ could be adjusted to modify the relative strength of red, green, and blue emissions.35 Notably, studies on Sm3+ doped Ba2ZnSi2O7 at different concentrations and its structural, optical, and thermal properties have remained unexplored in the mentioned papers.
Therefore, in the current study, Ba2ZnSi2O7:xSm3+ (x = 0.2, 0.4, 0.6, 0.8, and 1.0 mol%) were synthesized utilizing the solid-state reaction technique. Various characterization approaches were used with the profound purpose of researching and integrating the optical, thermal, structural, and morphological features. We have thoroughly analyzed the TDPL and room-temperature photoluminescence (PL) spectra. We also looked at the nonradiative cross-relaxation mechanism, energy transfer, thermal stability, and temperature-dependent photoluminescence properties of the phosphor for non-contact optical thermometry applications.
Experimental details
Synthesis process
The solid-state reaction method was used to synthesize a Ba(2−x)ZnSi2O7:xSm3+ (x = 0.2, 0.4, 0.6, 0.8 and 1 mol%) series. BaCO3 (MolyChem, 99%), ZnO (Alfa-Aesar, 99%), SiO2 (Sigma-Aldrich, 99%), and Sm2O3 (MolyChem, 99.9%) were used as raw materials. Appropriate amounts of raw materials were weighed on an electronic balance, transferred to a mortar and pestle and finely ground for 1 hour with a few drops of ethanol to attain homogeneity. After grinding for 1 hour, the mixture was transferred to an alumina crucible which was kept in a muffle furnace for heating at 1200 °C for 6 hours at a heating rate of 5 °C min−1 in an oxygen environment. Later the sample was naturally cooled to room temperature, further ground and subjected to different characterization studies. Balanced chemical equations which were used to attain stoichiometry are given below.
Characterization techniques
The examination of the crystal structure of the prepared specimen was conducted through X-ray diffraction (XRD) utilizing nickel-filtered Cu-Kα radiation (λ = 1.540 Å) within the 2θ range spanning from 20° to 80°. Data collection was carried out employing a Rigaku Mini Flex 600, 5th Gen X-ray diffractometer. The determination of the lattice parameters was accomplished utilizing the FullProf suite software. An analysis of the morphology and elemental composition of the sample was performed using scanning electron microscopy (SEM) coupled with energy-dispersive X-ray spectroscopy (EDS) on a ZEISS EVO MA18 SEM equipped with an Oxford X-act detector. The investigation of the optical properties of the material was undertaken through diffuse reflectance spectroscopy (DRS) utilizing a PerkinElmer Lambda 950 spectrometer. To identify the functional groups and chemical bonds present in the sample, Fourier Transform Infrared (FTIR) spectroscopy was conducted employing a Shimadzu spectrometer. Photoluminescence excitation (PLE) and emission (PL) spectra were acquired through the utilization of a Jasco FP-8500 spectrofluorometer employing a xenon flash lamp for excitation purposes. Analysis of thermal characteristics was carried out utilizing a PerkinElmer TGA 4000 thermogravimetric analyzer (TGA) to examine the thermal stability and decomposition patterns of the specimen. Investigation into the temperature-dependent optical properties of the material was performed by measuring temperature-dependent photoluminescence spectra using an Agilent Cary Eclipse fluorescence spectrophotometer integrated with a heating unit.
Results and discussion
XRD analysis
The XRD patterns of the synthesized Ba2−xZnSi2O7:xSm3+ (x = 0.2, 0.4, 0.6, 0.8, and 1.0 mol%) phosphors are displayed in Fig. 1. All diffraction peaks show that the Sm3+ ions were effectively doped into the Ba2ZnSi2O7 host, similar to those of the standard JCPDS card PDF #28-0846.36
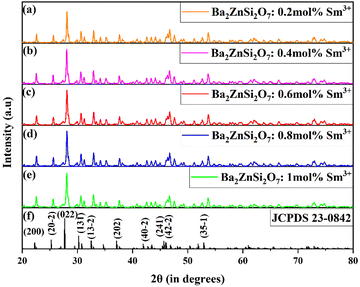 |
| | Fig. 1 (a)–(e) Powder XRD patterns of Ba(2−x)ZnSi2O7:xSm3+ (x = 0.1, 0.2, 0.4, 0.6, 0.8, 1.0 mol%) phosphors. (f) Reference pattern of Ba2ZnSi2O7. | |
The XRD patterns of the synthesized phosphors show good agreement with the reference pattern, confirming the formation of the desired phase. However, a small shift in the XRD peaks towards higher angles is observed upon doping Sm3+ ions into the Ba2+ sites of the host lattice. This shift can be attributed to the difference in ionic radii between Sm3+ (1.07 Å) and Ba2+ (1.35 Å), which causes lattice distortion and a slight contraction of the unit cell. In order to fathom the slight shift in the XRD pattern we calculate allowed radius percentage (DR) values, by which we can attribute the possible substitution of dopants in the host sites. The permissible relative error in the dopant radius for a successful substitution is predetermined, and the DR number represents this limit. If the calculated DR value falls below the threshold, typically set at 30%, the dopant ion will replace the host ion.37 Radius difference percentage DR can be calculated using the formula38
| |  | (1) |
where the dopant's ionic radius is
R2, and the host cation's ionic radius is
R1. The coordination number for an ion is CN. We have calculated
DR values for various combinations by using the atomic radii of the dopant and host ions.
Table 1 displays the outcomes of these calculations.
Table 1 The relative error between the dopant's radius and the host ions
| Host |
CN |
R
1
|
Dopant |
CN |
R
2
|
D
R
|
| Ba2+ |
6 |
1.35 |
Sm3+ |
6 |
0.95 |
29.62 |
| Ba2+ |
6 |
1.35 |
Sm3+ |
8 |
1.07 |
15.67 |
| Ba2+ |
8 |
1.42 |
Sm3+ |
6 |
0.95 |
49.82 |
| Ba2+ |
8 |
1.42 |
Sm3+ |
8 |
1.07 |
24.64 |
| Zn2+ |
6 |
0.74 |
Sm3+ |
6 |
0.95 |
28.37 |
| Zn2+ |
6 |
0.74 |
Sm3+ |
8 |
1.07 |
92.79 |
| Zn2+ |
8 |
0.9 |
Sm3+ |
6 |
0.95 |
20.83 |
| Zn2+ |
8 |
0.9 |
Sm3+ |
8 |
1.07 |
18.88 |
| Si4+ |
6 |
0.4 |
Sm3+ |
6 |
0.95 |
137.5 |
| Si4+ |
6 |
0.4 |
Sm3+ |
8 |
1.07 |
256.66 |
The data make it apparent that the DR values for Sm3+ and Ba2+ varied from 15.67% to 49.82%. However, the values for Zn2+ and Sm3+ varied from 18.88% to 92.79%. Thus, it can be inferred that the remarkably low DR values allow for the efficient substitution of Sm3+ with an atomic radius of 1.07 Å for Ba2+ with an atomic radius of 1.35 Å. The crystallite size was calculated using a size–strain plot using the equation given below39
| |  | (2) |
where
β is the FWHM corresponding to the peak at Bragg's angle
θ and
dhkl is the lattice distance between the (
h k l) planes. The slope of the linear fit of the (
βhkldhkl![[thin space (1/6-em)]](https://www.rsc.org/images/entities/char_2009.gif)
cos
![[thin space (1/6-em)]](https://www.rsc.org/images/entities/char_2009.gif) θ
θ)
2versus (
dhkl2βhkl![[thin space (1/6-em)]](https://www.rsc.org/images/entities/char_2009.gif)
cos
![[thin space (1/6-em)]](https://www.rsc.org/images/entities/char_2009.gif) θ
θ) plot indicates the size of the crystallite. The crystallite sizes for the phosphors are found to be 20.9, 44.0, 37.5, 32.4, 35.6, and 32.9 nm respectively. The size–strain curve is shown in
Fig. 2(a)–(f). The average strain was found to be 0.0084.
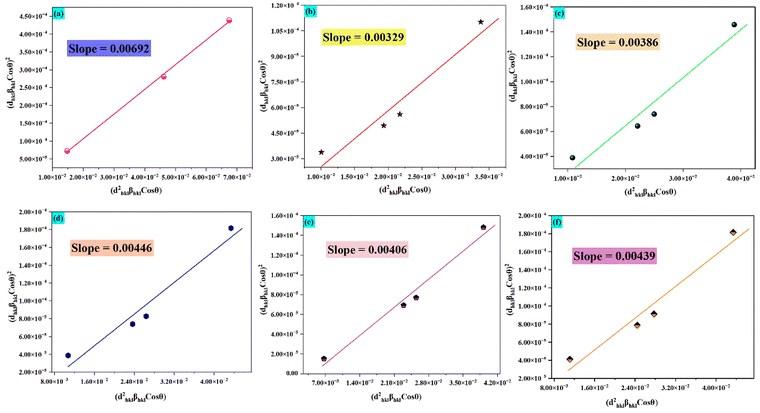 |
| | Fig. 2 (a)–(f) Size–strain plot for the prepared phosphors for crystallite size determination. | |
To comprehend the crystal structure, we perform Rietveld refinement on the Ba2ZnSi2O7:xSm3+ (x = 0.4 mol%) phosphor. The convergence of the refinement was seen at Rwp = 11.2%, Rp = 14.1%, and χ2 = 1.68, suggesting a clear introduction of Sm3+ ions into the host lattice. The refined parameters are as follows: with a = 8.5013 Å, b = 10.8150 Å, and c = 8.5082 Å, we have α = γ = 90°, β = 111.01°. Fig. 3 displays the Rietveld refinement of the optimum phosphor. Ba2ZnSi2O7 is a monoclinic compound with a space group of C2/c which is in line with previous reported works.15Fig. 4 shows the 2D structure of the Sm3+ doped Ba2ZnSi2O7 phosphor in visual appearances.
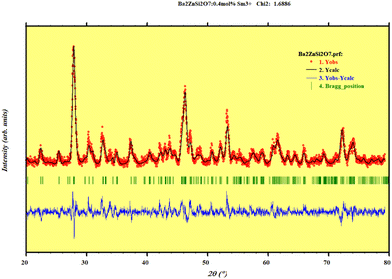 |
| | Fig. 3 Rietveld refinement plot of Ba2−xZnSi2O7:xSm3+ (x = 0.4 mol%) phosphors. | |
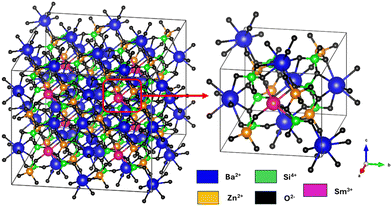 |
| | Fig. 4 Pictorial representation of Sm3+ doped Ba2ZnSi2O7 phosphor. | |
FTIR studies
The molecular vibrations were identified by employing Fourier Transform Infrared (FTIR) Spectroscopy. The synthesized sample's transmittance was measured as a function of wavenumbers, and the wavenumbers that corresponded to various vibrations were determined and are listed in Table 2. Fig. 5 displays the FTIR spectra of the undoped and Sm3+ doped Ba2ZnSi2O7 phosphors. The FTIR spectra provided the wavenumbers for the Ba–O stretching, Si–O asymmetric stretching, Zn–O stretching, and SiO4 bending. Corresponding to the XRD data, the existence of identical functional groups in all the samples was confirmed and the saturated region in the spectra around 800–1030 cm−1 was found in both the pristine and doped samples even after repeated trials.
Table 2 Different vibrational modes of the Sm3+ doped Ba2ZnSi2O7 phosphor
| Wavenumber (cm−1) |
Vibrational modes |
| 450 |
Ba–O stretching40 |
| 510 |
Si–O vibrations41 |
| 547 |
Si–O–Si bending41 |
| 633 |
Ba–O vibrations40 |
| 822 |
Zn–O stretching42 |
| 1437 |
Si–O vibrations41 |
| 1600 |
Si–O–Si bond stretching41 |
| 1795 |
Si–Si stretching41 |
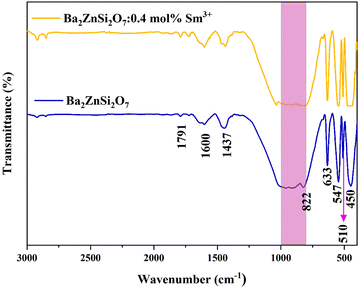 |
| | Fig. 5 FTIR spectrum of Ba2−xZnSi2O7:xSm3+(x = 0, 0.4 mol%) phosphors. | |
Photoluminescence studies
We thereafter conduct photoluminescence investigations to optimize the concentration of Sm3+ in the derived Ba2ZnSi2O7 matrix and investigate its optical characteristics. Fixing the emission wavelength at 600 nm, Fig. 6 shows the photoluminescence excitation spectrum of 0.4 mol% of Sm3+ doped Ba2ZnSi2O phosphor at normal temperature.
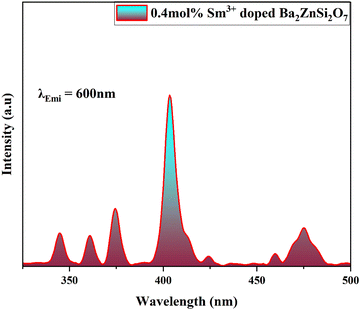 |
| | Fig. 6 PL excitation spectra of 0.4 mol% Sm3+ doped Ba2ZnSi2O7 phosphor at 600 nm emission wavelength. | |
In the spectra, we observe 7 excitation peaks at 344 nm, 360 nm, 374 nm, 403 nm, 424 nm, 460 nm, and 475 nm corresponding to the transition from the ground energy level 6H5/2 to 4H9/2, 4D3/2, 6P7/2, 4P3/2, 6P5/2, 4I13/2, and 6I11/2, respectively.43,44 Out of all the peaks that could be identified, the excitation peak with the highest intensity was found at 403 nm. It originated from the Sm3+ ion's transition from 6H5/2 to 4P3/2. As a result, to get the emission spectra of each synthesized phosphor, we selected 403 nm as the excitation wavelength. Fig. 7(a) manifests the emission spectra of the 0.4 mol% Sm3+ doped Ba2ZnSi2O7 phosphor when excited at 403 nm. The emission spectra comprise four different peaks centered at 560, 600, 645, and 705 nm corresponding to the transitions 4G5/2 → 6H5/2, 4G5/2 → 6H7/2, 4G5/2 → 6H9/2, and 4G5/2 → 6H11/2 respectively.45 The emission intensity that is the strongest is attributed to the 4G5/2 → 6H7/2 transition, which is located at 600 nm and meets the ΔJ = ±1 selection criteria. It is established that the electric dipole transitions only follow the selection rule of ΔJ ≤ 6 when J or J′ = 0 and ΔJ = 2, 4, 6 otherwise, the magnetic dipole transitions follow the selection rule of ΔJ = 0 and ±1.46,47 Transition 4G5/2 → 6H5/2 is an allowed transition for a magnetic dipole (MD), transition 4G5/2 → 6H7/2 is a partially forced and partially magnetic electric–dipole (ED) transition, and transition 4G5/2 → 6H9/2 is a pure ED transition that is allowed and sensitive to the crystal field.48 The degree of asymmetry increases with the strength of the ED transition. The symmetry of the local environment of the trivalent 4f ions has often been measured using the intensity ratio of ED to MD transitions.49 The current study found that the Sm3+ ion exhibited a stronger 4G5/2 → 6H5/2 MD transition than the 4G5/2 → 6H9/2 ED transition, suggesting that the Sm3+ ions were more symmetric in the host matrix. We are aware that greater distortion from the inversion symmetry results from higher intensity ratio values. However, the obtained values were found to be within the range of 1.1–1.4 as shown in Fig. 7(b), indicating that Ba2ZnSi2O7 exhibits no change from its original symmetry.50
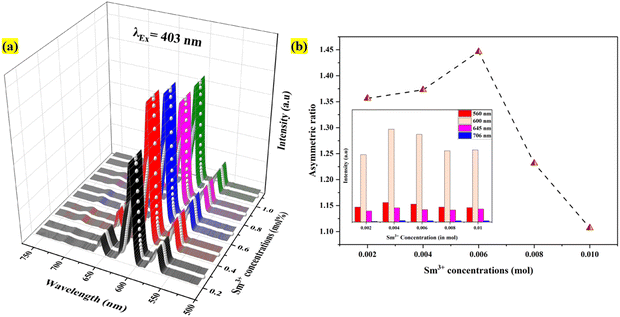 |
| | Fig. 7 (a) PL emission spectra and (b) asymmetric ratio variation with Sm3+ concentration, with an inset displaying the peak intensities variation for Ba2ZnSi2O7:xSm3+ (x = 0.2, 0.4, 0.6, 0.8 and 1 mol%) phosphors. | |
The transition in the emission spectra corresponding to 4G5/2 → 6H9/2, centered at 600 nm, has the highest intensity and is hence the main cause of the phosphor's reddish-orange emission. Furthermore, it is evident that the emission intensity achieves its peak at a Sm3+ concentration of 0.4 mol%. After 0.4 mol% of Sm3+, the emission intensity decreases due to concentration quenching. Therefore, 0.4 mol% is considered to be the optimum Sm3+ concentration for the Ba2ZnSi2O7 host. The concentration quenching can be explained using the energy transfer process arising from the cross-relaxation (CR) between Sm3+ ion pairs and the energy level diagram of Sm3+ ions as indicated in Fig. 8(a) and (b). Four energy transfer (ET) routes are available for a potential CR between two Sm3+ ions in Ba2ZnSi2O7: CR1, CR2, CR3, and CR4.51,52 These channels comprise two associated transitions with close proximate energies, as depicted in Fig. 8(b). These channels are given by
| CR1: 4G5/2 → 6F5/2 ≈ 6H5/2 → 6F11/2 |
| CR2: 4G5/2 → 6F7/2 ≈ 6H5/2 → 6F9/2 |
| CR3: 4G5/2 → 6F9/2 ≈ 6H5/2 → 6F7/2 |
| CR4: 4G5/2 → 6F11/2 ≈ 6H5/2 → 6F5/2 |
One of the two main causes of nonradiative energy transfer is exchange interaction or multipole–multipole interaction. We calculate the critical distance (
Rc) in order to determine which is more dominating. Critical distance indicates the distance at which the chances of radiation emission and energy transfer are equal. In the event where nonradiative energy transfer occurred between two distinct atoms, the essential distance was determined using,
53| |  | (3) |
where
QA is the absorption cross-section,
fs(
E) and
FA(
E) represent the normalized shape of the emission band of the sensitizer and the absorption band of the activator, respectively. Nonradiative ET takes place between comparable atoms and is one of the specific examples of exchange interaction. At this time, it is possible to determine the critical distance due to exchange interaction using the equation given below,
54| |  | (4) |
where
V is the volume of the unit cell,
N is the number of cations per unit cell, and
xc is the ideal concentration of activator ions. Following analysis of the refining data, the findings were made as
N = 4,
xc = 0.004, and
V = 730.225 Å
3. For the present system, the predicted critical energy transfer distance is 44.33 Å.
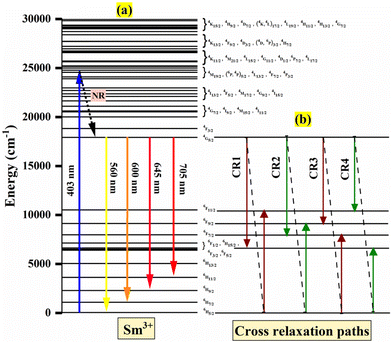 |
| | Fig. 8 (a) Energy level diagram of Sm3+ ions. (b) Cross relaxation paths. | |
Since Rc is a distance greater than 5 Å, the multipole–multipole interaction was primarily responsible for the energy transfer. As before, dipole–dipole (d–d), dipole–quadrupole (d–q), and quadrupole–quadrupole (q–q) interactions are subcategories of multipole–multipole interactions. Using Dexter's plot, the type of multipolar interaction may be ascertained. Dexter's hypothesis is given by,55
| |  | (5) |
where
A is the constant and
Q is the type of interaction that takes place between the rare earth ions. The electric dipole–dipole (d–d), dipole–quadrupole (d–q), and quadrupole–quadrupole (q–q) interactions, respectively, are the source of the interactions if
Q = 6, 8, and 10.
56
The Dexter plot for the phosphor with a slope of 1.31 is seen in Fig. 9(a). As a result, it was shown that θ = 3.93. Given that θ was near 4, it was possible to deduce that a dipole–dipole interaction was responsible for the nonradiative energy transfer from one excited ion to another ion. Another thing to keep in mind is that when the dopant ion Sm3+ is substituted for Ba2+ in the host lattice, an imbalance in charges occurs, leading to a net positive charge at the point of substitution. Ba2+ will cause defects (vacancies) in the charge balance, distorting the host lattice. These flaws lower the photoluminescence intensity by producing electron-capturing centers. Therefore, for the host lattice,55
| |  | (6) |
where

is the donor,

is the acceptor.
| |  | (7) |
| |  | (8) |
The lattice charge's neutrality before excitation by 403 nm is represented by
eqn (6).
Eqn (7) and (8) relate to electron self-trapping following excitation by 403 nm radiation.
Eqn (1) indicates that in the sample Ba
2ZnSi
2O
7:0.4 mol% Sm
3+, the barium vacancy is created, and two samarium atoms replace one barium atom. Hence, the two-fold barium vacancy created in the sample of Ba
2ZnSi
2O
7:0.4 mol% Sm
3+, compared to Ba
2ZnSi
2O
7:0.2 mol% Sm
3+, results in the double self-trapping. Consequently, the energy transfer mechanism involving cross-relaxation between the neighbouring Sm
3+ ions and energy transfer between Sm
3+ ions and barium vacancies causes a considerable decrease in photoluminescence intensity.
57,58 As seen in
Fig. 10, A further explanation for emission intensity is the energy transfer between Sm
3+ and Ba
2+ vacancies.
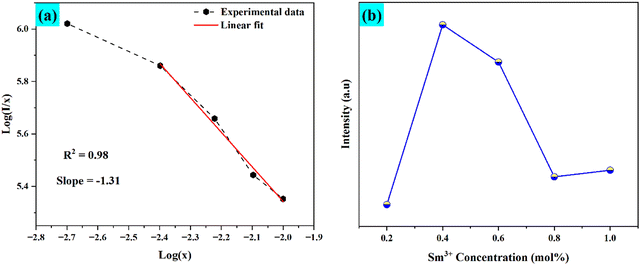 |
| | Fig. 9 (a) Dexter plot for the phosphors that were produced and (b) illustrates the concentration of Sm3+ alters emission intensity. | |
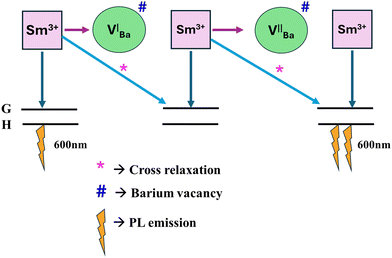 |
| | Fig. 10 Energy transfer mechanism Sm3+ to Ba2+ vacancy. | |
The most common approach for characterizing and expressing color that is produced by phosphor material is the Commission Internationale de I′Eclairage (CIE) system. Fig. 11 displays the CIE chromatic diagram of synthesized Ba2−xZnSi2O7:xSm3+ (x = 0.2, 0.4, 0.6, 0.8, and 1.0 mol%) phosphor at excitation wavelength at 403 nm, which is derived from emission spectra. These CIE coordinates were calculated using these equations,59
| |  | (9) |
| |  | (10) |
Using these CIE coordinates we have calculated Colour-correlated temperature (CCT) values by approximating McCamy's equation,
60,61| | | CCT = −449n3 + 352n2 − 6823.3n + 5520.33 | (11) |
where
n represents the inverse slope line and is computed as

where the chromatic coordinates of the prepared phosphor are represented by (
xp,
yp) and the epicenter of convergence is represented by (
x0,
y0) = (0.332, 0.186). To compute
λd, a line connecting (
xp,
yp) and (
x0,
y0) will be drawn. It is then extended to a point on the edge of the diagram after that. The wavelength that matches the coordinates of the perimeter is called
λd. With the use of all these findings, we can use the formula to determine color purity.
62| |  | (12) |
Table 3 presents the CCT,
λd, and C.P. values for the Sm
3+ doped Ba
2ZnSi
2O
7 phosphors. The phosphor is seen to have a C.P. of about 100% and CCT values that are in the range of 1416–1491 K, suggesting that it might be a good option for the production of warm light.
63
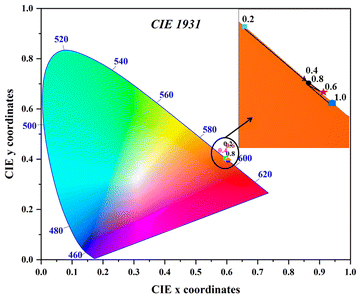 |
| | Fig. 11 CIE chromaticity coordinates of Ba2−xZnSi2O7:xSm3+ (x = 0.2, 0.4, 0.6, 0.8 and 1.0 mol%) phosphors. | |
Table 3 CIE chromaticity coordinates (xp, yp), dominant wavelength (λd), color purity (C.P.), and CCT values for Ba2−xZnSi2O7:xSm3+ (x = 0.2, 0.4, 0.6, 0.8 and 1.0 mol%)
| Sm3+ concentrations (mol%) |
(xp, yp) |
(xd, yd) |
λ
d (nm) |
C.P. (%) |
CCT (K) |
| 0.2 |
(0.5965, 0.4030) |
(0.3592, 0.5460) |
593.8 |
100.0 |
1491 |
| 0.4 |
(0.6017, 0.3976) |
(0.3665, 0.5449) |
594.8 |
100.0 |
1439 |
| 0.6 |
(0.6033, 0.3963) |
(0.3685, 0.5447) |
595.1 |
100.0 |
1426 |
| 0.8 |
(0.6021, 0.3973) |
(0.3669, 0.5448) |
594.9 |
100.0 |
1436 |
| 1.0 |
(0.6042, 0.3951) |
(0.3699, 0.5443) |
595.3 |
100.0 |
1416 |
Surface morphology
Next, the optimized phosphor's morphological characteristics were examined using a scanning electron microscope (SEM). Fig. 12(a)–(h) shows the elemental mapping for energy dispersive Xray (EDX) and SEM images for Ba2−xZnSi2O7:xSm3+ (x = 0.4 mol%). The even distribution of every element in a chosen region is verified by EDX. The SEM photos clearly show that the synthesized phosphor particles had uneven shapes which caused the grains to aggregate into an agglomerated structure. This characteristic is inherent in the morphology of phosphors made by the high-temperature solid-state technique.64
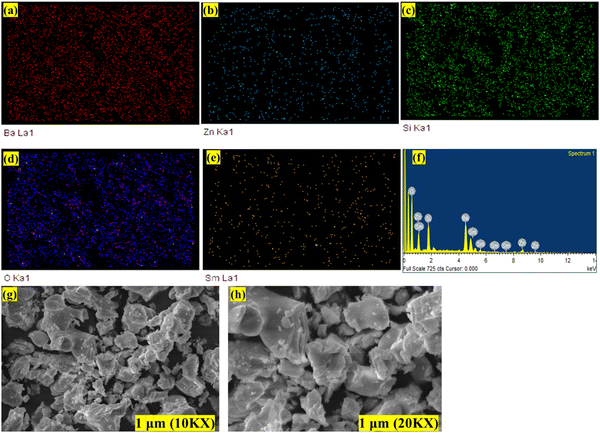 |
| | Fig. 12 (a)–(e) Elemental mapping (f) EDAX spectra (g) and (h) SEM images at different magnifications of Ba2−xZnSi2O7:xSm3+ (x = 0.4 mol%) phosphor. | |
UV-vis-NIR spectra analysis
The reflection and absorbance spectra are shown in Fig. 13(A). Due to spin and parity-allowed ligand (O2−) to metal charge transfer (CT) transitions by the Sm3+ ions in the Ba2ZnSi2O7 host, the shorter wavelength range displays broadband. Sm3+ ion 4f–4f transitions are linked to the absorption peaks at around 400 nm. The spectrum demonstrates the transitions 6H5/2 → 6F9/2, 6H5/2 → 6F7/2, and 6H5/2 → 6F5/2 are attributed to the wide peaks at about 1078, 1218, and 1392 nm, respectively.65,66 The band gap of the samples was calculated using Tauc's equation,67| | | [F(R)hϑ]n = A(hϑ − Eg) | (13) |
where F(R) is a Kubelka–Munk function, A is a proportional constant, Eg is the optical band gap value, and n = 2 for an indirect transition or  for a direct transition,67
| |  | (14) |
As seen in Fig. 13(B), the predicted Eg values for pure host matrix are about 3.33 eV and for 0.4 mol% Sm3+ ion doped Ba2ZnSi2O7 were found to be 3.40 eV, respectively. On doping there is a slight increase in the energy band gap.
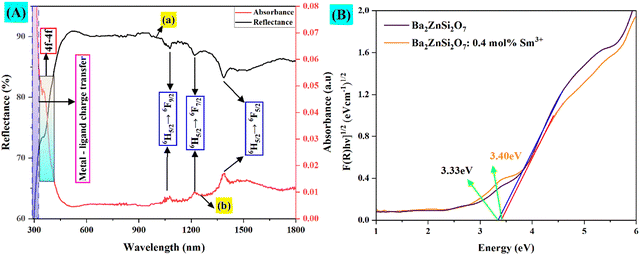 |
| | Fig. 13 (A) (a) and (b) Reflectance and absorption band spectra. (B) Tauc plot for Ba2−xZnSi2O7:xSm3+(x = 0.4 mol%) phosphors. | |
Moreover, we may use the Dimithrov–Sakka equation to find the material's refractive index,68
| |  | (15) |
where
n is the material's refractive index and
Eg is its optical energy band gap. Refractive indices were determined to be 5.35 for undoped Ba
2ZnSi
2O
7 and 5.27 for Ba
2ZnSi
2O
7 doped with 0.4 mol% Sm
3+.
Understanding the kind of Sm3+–ligand bond found in the produced phosphors is possible by calculating the values of the bonding parameter (δ) and nephelauxetic ratio (β). One may find the nephelauxetic ratio by utilizing,69
| |  | (16) |
where
ϑc and
ϑa are the wave numbers for a certain Sm
3+ transition in the host and aqueous solution, respectively. One may use an equation to calculate the bonding parameter (
δ),
69| |  | (17) |
where
![[small beta, Greek, macron]](https://www.rsc.org/images/entities/i_char_e0c3.gif)
is the average nephelauxetic ratio value. The specific kind of Sm
3+–ligand bond is classified as ionic when
δ is negative and as covalent when
δ is positive.
70 The band assignments, nephelauxetic ratio (
β), and bonding parameter (
δ) for the system are listed in
Table 4. Since the bonding value was discovered to be −1.6264,
δ < 0. Due to the negative value of the bonding parameter, the Sm
3+–ligand bonds are ionic in nature.
Table 4 Band transitions, nephelauxetic ratio (β), and bonding parameter δ for the 0.4 mol% Sm3+ phosphors in Ba2ZnSi2O7
| Sl. no. |
Transitions |
ϑ
c (cm−1) |
ϑ
a (cm−1) |
β
|
| 1 |
6H5/2 → 6F9/2 |
9233 |
9136 |
1.0107 |
| 2 |
6H5/2 → 6F7/2 |
8151 |
7977 |
1.0218 |
| 3 |
6H5/2 → 6F5/2 |
7253 |
7131 |
1.0171 |
![[small beta, Greek, macron]](https://www.rsc.org/images/entities/i_char_e0c3.gif)
|
1.0165 |
Thermo-gravimetry analysis
The study focused on the thermal stability of an optimized Ba2−xZnSi2O7:xSm3+ (x = 0.4 mol%) phosphor. The produced phosphor exhibits good thermal stability at high temperatures (up to 600 °C), according to the results. Fig. 14 illustrates that not much mass loss was seen. A small amount of mass loss is emphasized in the inset figure.
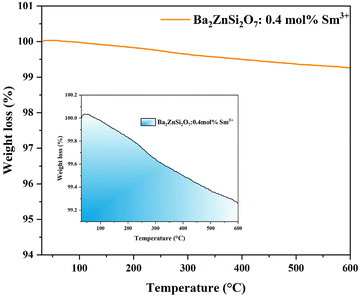 |
| | Fig. 14 Ba2−xZnSi2O7 TGA curve:xSm3+ (x = 0.4 mol%) phosphors, with an inset graph that displays mass loss on a magnified scale. | |
Lifetime measurements studies
We determine the lifetimes of Ba2−xZnSi2O7:xSm3+ (0.2 mol% ≤ x ≤ 1 mol%) by measuring their decay curves at room temperature. The results are displayed in Fig. 15(a). With 403 nm excitation wavelength, and 600 nm emission wavelength the measurement has been made. All decay curves were fitted using the single – exponential function, which is given as ref. 71 and 72,| |  | (18) |
where I0 and I(t) are the luminescence intensities at times 0 and t, respectively, and τ is the decay time.
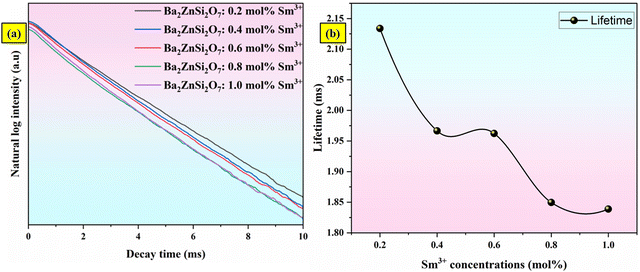 |
| | Fig. 15 (a) The decay curves (b) variation of decay time for Ba2ZnSi2O7:xSm3+ (x = 0.2, 0.4, 0.6, 0.8 and 1 mol%) phosphors. | |
The decay time values of Ba2ZnSi2O7:xSm3+ (x = 0.2, 0.4, 0.6, 0.8 and 1 mol%) phosphors are 2.133, 1.966, 1.962, 1.849 and 1.838 ms respectively.73 The variation of decay time with different concentrations was shown in Fig. 15(b).
Temperature-dependent optical studies
Fig. 16(a) shows the Ba2−xZnSi2O7:xSm3+ (x = 0.4 mol%) phosphor with variable-temperature fluorescence spectra in the 303–483 K range. It is clearly visible that the emission of Sm3+ ions is evident with different temperatures. All the emission peaks that we observed at room temperature were observed at high temperatures, but the intensity counts were decreased by about 30–40% compared to room temperature. At 560, 600, 645, and 705 nm, distinct emission was seen, which corresponded to the transitions 4G5/2 → 6H5/2, 4G5/2 → 6H7/2, 4G5/2 → 6H9/2, and 4G5/2 → 6H11/2, in that order.74,75Fig. 16(b) clearly shows the decrease in the normalized emission intensity at elevated temperatures. Even at higher temperatures, the position of the peaks remained as such compared to room temperature.
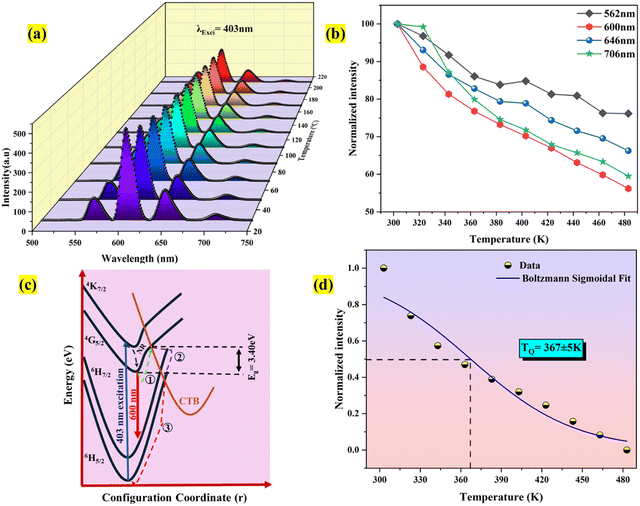 |
| | Fig. 16 (a) PL emission spectra that are temperature-dependent (b) normalized TDPL emission intensity (c) the schematic diagram for configurational coordinates (d) Boltzmann fit for the temperature-dependent emission spectra of phosphors Ba2ZnSi2O7:Sm3+. | |
The quenching of intensity at elevated temperature can be described using a configurational coordination model as shown in Fig. 16(c). At 403 nm excitation, the electron excites to the excited state from the ground state. Since the electrons are not stable at higher energy levels for longer periods, they eventually try to lose their energy by making a transition from higher energy to lower energy level. Here, we can get strong red emission due to the transition from higher energy to ground state followed by a large number of electrons traveling through a non-radiative transition from the lowest point of the 4G5/2 energy level to the ground state. Due to the strong phonon–electron interaction, it is possible that the excited state electrons passed the activation energy (Ea) (Route 1) and entered the CTB directly (Route 2). When electrons follow route 3, they eventually arrive in their ground state and radiate heat. The thermal quenching temperature (TQ) of the Ba2ZnSi2O7:Sm3+ phosphor may thus be used to assess its thermal stability. The term “quenching temperature” refers to the temperature at which the photoluminescence emission emits half of its initial intensity.76 The Boltzmann sigmoidal fit plot, which is used to calculate the thermal quenching temperature (TQ), is shown in Fig. 16(d). The Boltzmann sigmoidal fitting function is given by ref. 77,
| |  | (19) |
I(
T) is the normalized emission intensity at a given temperature.
A1 and
A2 represent the starting and ultimate emission intensity levels, respectively. Since we standardized the emission intensity value in this instance between 1 and 0,
A1 = 1,
A2 = 0.
TQ is the sigmoid's center, while d
T displays its fluctuation.
78 From the fitted plot, the quenching temperature was found to be 367 ± 5 K, which represented it has good thermal stability.
Fig. 17 displays the FWHM variation of TDPL emission peaks with temperature for the Ba2ZnSi2O7:Sm3+ (x = 0.4 mol%) phosphor. It is evident that the FWHM of the emission increased gradually for 562 nm, 600 nm, and 646 nm emission. A small emission peak at 706 nm decreases at first and then increases due to interactions of RE–RE ions in the host. The FWHM of the emission spectrum increases due to a strong interaction between the thermally active phonons and the thermally activated luminescent core. At high temperatures, the electron–phonon interaction becomes more noticeable due to an increase in the phonon population density.79 Mathematically, an increase in FWHM is given by,
| |  | (20) |
where
ħω represents the effective phonon energy,
Γ(
T) indicates the temperature-dependent FWHM, and
k and
S stand for the Boltzmann and Huang–Rhys parameters, respectively.
80 The intensity ratios of anti-Stokes peaks to Stokes peaks (
Ia/
Is) followed the Boltzmann-type distribution function, which contributed to the difference in thermal behavior provided by,
81| |  | (21) |
where
T is the absolute temperature and
C is the proportionality constant. One potential technique for thermal sensing is to use the variation in the intensity of the anti-Stokes emission line concerning the Stokes emission line.
Eqn (21) may be taken as natural logarithmic,
82,83| |  | (22) |
where
Ia and
Is are 562 and 600,706 nm, respectively. The fluctuation of log
e(
I562/
I600)
vs. 1/
T and log
e(
I562/
I706) are seen in
Fig. 18(a) and (b) respectively. After doing a linear fit on the graph,

with
ħω/
k = 94.41 K was found to be the best match. It was found that the fitted value of phonon energy
ħω was 65.61 cm
−1. Similarly, for

with
ħω/
k = 91.84 K was discovered to be the ideal fit. It was discovered that 63.83 cm
−1 was the fitting value of phonon energy. These findings suggested that temperature sensing may also be accomplished with the optimized phosphor due to the lowest phonon energy.
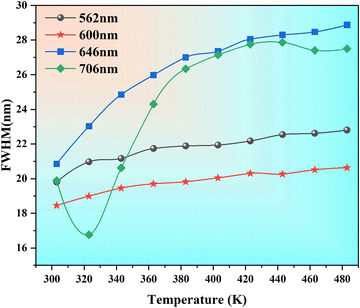 |
| | Fig. 17 Changes in FWHM of emission peaks at various temperatures for Ba2−xZnSi2O7:xSm3+ (x = 0.4 mol%) phosphors. | |
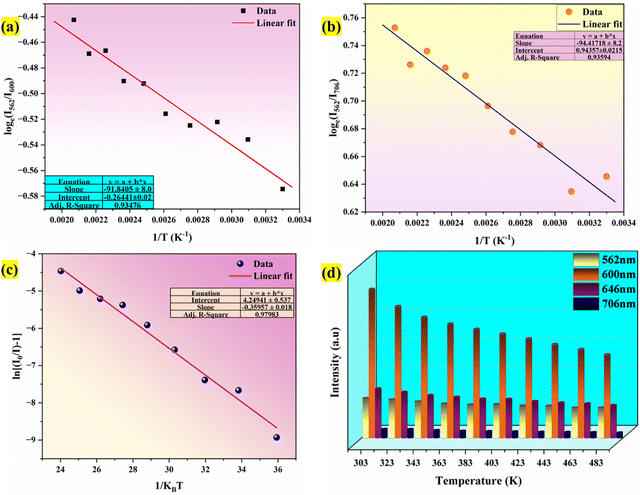 |
| | Fig. 18 (a) Plot of log(I562/I600) v/s 1/T (b) plot of log(I562/I706) v/s 1/T (c) Arrhenius plot for 600 nm emission (d) intensity variation of different emission peaks at various temperatures for Ba2−xZnSi2O7:xSm3+ (x = 0.4 mol%) phosphors. | |
The activation energy, or ΔE, is the energy difference between the ground state and the lowest excited state. Electrons in lower excited levels will be thermally aroused to higher energy states if the phosphor receives more thermal energy than ΔE. Then, in order to get back to the ground state, they will pass via the crossover points between the excited and ground states.84 The thermal stability of the phosphor will rise along with the magnitude of ΔE as non-radiative relaxation rises with temperature. One may define activation energy by applying the Arrhenius equation, which is provided by,85
| |  | (23) |
where intensities at lower and higher temperatures are denoted, respectively, by
I and
I0. The symbols Δ
E,
k, and
C represent the activation energy, Boltzmann constant, and constant, respectively. We took natural logs on both sides of
eqn (23) to simplify it and get Δ
E,
| |  | (24) |
In
Fig. 18(c) we have calculated the activation energy which was found to be 0.359 eV for 600 nm respectively. To more clearly see the distinction between the luminous thermal quenching trend of different emissions of Sm
3+ as a function of temperature is displayed in
Fig. 18(d).
Thermal sensing studies
Fluorescence intensity ratio method (FIR).
Exploring the temperature dependence of FIR between two different emissions of Sm3+ is essential to further understand the temperature sensing behavior of the Ba2ZnSi2O7:xSm3+ (x = 0.4 mol%) phosphor. The link between temperature and integrated PL intensity of the Sm3+ anti-Stokes peak (Ias) and Stokes peak (Is) may be expressed using the Struck and Fonger hypothesis.86 The relative population of the thermally related energy levels follows the Boltzmann distribution law. The Boltzmann distribution of thermally linked energy levels and temperature affects emission intensities. The following expression can be used to express the relationship between temperature and PL intensity of the excited rare earth ions,87,88| |  | (25) |
where kB is the Boltzmann constant, B is an offset parameter, ΔE is the activation energy required to move an electron from its emission state to the quenching state, and A is the proportional parameter. The experimental data and the fitting outcomes derived from the above equation represent the actual points and lines, respectively. Fig. 19(a) shows the variation of FIR of (I600/I562) intensities concerning temperature and we can observe it is decreased at elevated temperatures from 303–483 K. Additionally, Fig. 19(b) illustrates the change in the FIR of (I706/I562) intensities with temperature. It also decreased monotonically with temperature. Both the plots were fitted with eqn (25) which is given by,| |  | (26) |
| |  | (27) |
It is crucial to look into the sensing sensitivity of Ba2ZnSi2O7:Sm3+ phosphor for temperature sensing to learn more about temperature sensitivity. The performance of the temperature sensors may be assessed using two important parameters: relative sensitivity (SR) and absolute sensitivity (SA). The SR and SA, which are the relative and absolute changes in the FIR in response to temperature fluctuations, may be obtained using the following equation.89,90| |  | (28) |
| |  | (29) |
The values of absolute and relative sensitivity at different temperatures for (I600/I562) and (I706/I562) are measured and shown in Fig. 19(c) and (d) respectively. The absolute and relative sensitivity decreased monotonically for higher temperatures. For (I600/I562), the maximum relative sensitivity was found to be 2.02% K−1 at 303 K and SA as 0.074 K−1 at 303 K. Similarly for other transition (I706/I562), the maximum relative sensitivity was found to be 1.98% K−1 at 303 K and SA as 0.0045 K−1 at 303 K. Since the intensity counts are less for 706 nm compared to 600 nm the sensitivities also decreased which also revealed that sensitivity is directly in line with intensity of emission. Table 4 lists a few bright thermometers based on Sm3+ doped phosphors that have been previously discussed. It is demonstrated that the Ba2ZnSi2O7:Sm3+ (x = 0.4 mol%) phosphor has a rather high SR value. The Ba2ZnSi2O7:Sm3+ phosphor may therefore be employed in optical thermometry and show good optical thermometric performance.
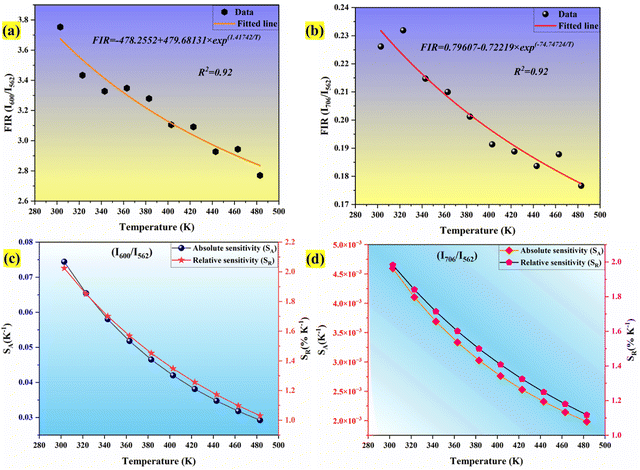 |
| | Fig. 19 (a) Fluorescence intensity ratio for I600/I562 (b) fluorescence intensity ratio for I706/I562 (c) SA and SR for I600/I562 using Boltzmann distribution (d) SA and SR for I706/I562. | |
Fluorescence lifetime method.
We also obtained measurements of the Ba2ZnSi2O7:Sm3+ decay curves at 600 nm emission when excited at 403 nm over the temperature range of 303–483 K as shown in Fig. 20(a). The decay curves are found to be well-fitted to the single exponential decay equation given below,91,92| |  | (30) |
where I0 and I(t) are the luminescence intensities at times 0 and t, respectively, and τ is the decay time. The decay of Ba2ZnSi2O7:Sm3+ for different temperatures fits very well in eqn (30). At 303, 323, 343, 363, 383, 403, 423, 443, 463, and 483 K, the decay lifetimes are found to be 1.56, 1.57, 1.58, 1.59, 1.60, 1.61, 1.62, 1.64, 1.66, and 1.69 ms. It is evident from Fig. 20(b) that temperature has a significant impact on the emission decay characteristics of Ba2ZnSi2O7:Sm3+. Under stimulation with 403 nm, the lifespan slightly increases from 1.569 ms at 303 K to 1.692 ms at 483 K. Moreover, the thermal-quenching activation energy of Sm3+ is found to be 2045.169 cm−1. Using equations given below, which resemble the FIR-based method, can be used to compute the absolute sensitivity SA-lifetime and the relative sensitivity SR-lifetime based on the emission lifespan of Sm3+, respectively.93,94| |  | (31) |
| |  | (32) |
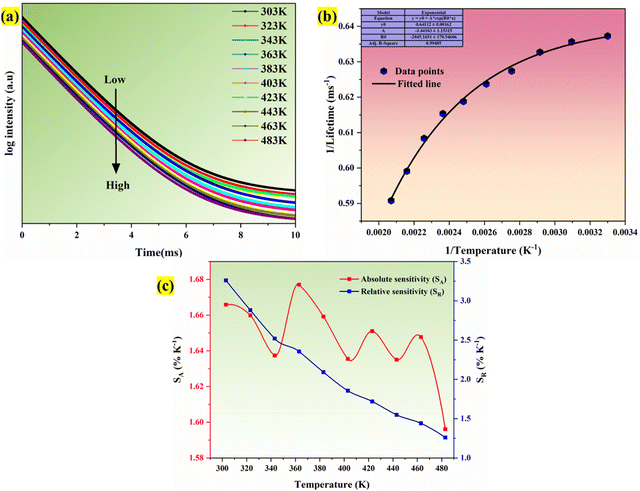 |
| | Fig. 20 (a) Temperature-dependent lifetime spectra (b) inverse of lifetime of Sm3+ emission versus 1/temperature (c) the relative sensitivity SR and absolute sensitivity SA based on the emission lifetime of Sm3+. | |
Based on the Sm3+ emission lifetime, Fig. 20(c) displays the absolute sensitivity SA-lifetime and the relative sensitivity SR-lifetime. The basic trend for both SA-lifetime and SR-lifetime is different in this case. Relative sensitivity decreased as we increased the temperature providing a maximum relative sensitivity of 3.25% K−1 at 303 K, but absolute sensitivity initially decreased up to 343 K, later reached the maximum of 0.0167 K−1 at 363 K and started to decrease up to high temperature. Thus, the highest values of SA-lifetime and SR-lifetime are determined to be 0.0167 K−1 at 363 K and 3.25% K−1 at 303 K respectively. The lifetime-based value of SR is higher than the FIR-based SR value when the relative sensitivity values based on lifetime and FIR are compared. This is because the Sm3+ emission in the FIR-based system varies very little. Temperature-related changes in emission intensity cause a little shift, but they have minimal effect on the FIR. Table 5 shows that the values of SR based on both lifetime and FIR are better than prior findings.
Table 5 Temperature-sensitive properties based on RE-doped luminescent materials
| Materials |
Temperature range (K) |
S
R-max (% K−1) |
Mode |
Ref. |
| Ca2LaNbO6:Sm3+ |
313–573 |
0.23 |
FIR |
95
|
| YVO4:Sm3+ |
299–466 |
0.31 |
FIR |
96
|
| YNbO4:Sm3+ |
303–773 |
0.43 |
FIR |
97
|
| SrMoO4:Sm3+ |
273–573 |
0.60 |
FIR |
98
|
| Ca3LiMgV3O12:Sm3+ |
303–483 |
1.600 |
FIR |
99
|
| Sr2YF7:Tm3+ |
303–663 |
1.16 |
FLT |
100
|
| CaGdMgSbO6:Mn4+/Sm3+ |
298–575 |
1.23 |
FLT |
91
|
| BaGd2O4:Bi3+/Sm3+ |
293–473 |
1.66 |
FLT |
101
|
| Sr2V2O7:Sm3+ |
38–298 |
3.12 |
FLT |
102
|
| Lu2MoO6:Sm3+ |
273–483 |
4.9 |
FLT |
103
|
| Ba2ZnSi2O7:Sm3+ |
303–483 |
2.02 |
FIR |
This work |
| 3.25 |
FLT |
Conclusion
Ba2ZnSi2O7:Sm3+ phosphors with varying doping concentrations were successfully synthesized using the high-temperature solid-state reaction method. XRD patterns and refinements confirmed the satisfied phase purity and unaltered monoclinic crystal structure with the C2/c space group after Sm3+ doping. The phosphor emits orangish-red light at 600 nm under UV excitation, and the optimal Sm3+ dopant concentration was determined to be x = 0.004 mol. The photoluminescent emission spectra show red and yellow emissions corresponding to the 4G5/2 → 6H5/2, 4G5/2 → 6H7/2, 4G5/2 → 6H9/2, and 4G5/2 → 6H11/2 transitions of Sm3+. Concentration quenching was observed due to dipole–dipole interaction, as investigated using the Dexter theory. The optimized phosphor's CIE chromaticity coordinates and CCT value were found to be (0.6017, 0.3976) and 1439 K respectively with 100% color purity. The optical band gap was determined to be 3.40 eV. FTIR spectra confirmed the various Ba–O, Zn–O, and Si–O vibrational modes and the absence of additional phases during phosphor preparation. The phosphor exhibited excellent thermal stability up to 600 °C and a 30% drop in emission intensity compared to ambient temperature at high temperatures. The activation energy and phonon energy were calculated to be 0.359 eV and 63.83 cm−1, respectively. The quenching temperature was found to be 367 K. The Ba2ZnSi2O7:0.004Sm3+ phosphor demonstrated excellent temperature sensing performance using the FIR strategy of I600/I562, with a maximum relative sensitivity (SR) value of 2.02% K−1 at 303 K. The fluorescence lifetime of Sm3+ luminescence (λExci = 403 nm, λEmi = 600 nm) slowly increased with increasing temperature, suggesting its suitability for lifetime-based luminous thermometry with a maximum SR value of 3.25% K−1 at 303 K. This dual-mode optical temperature sensing approach, based on both FIR and variable lifetime, is a novel design concept presented for the first time in this study. The optimized phosphor's good thermal stability, high activation energy, and excellent thermal sensing abilities make it a promising candidate for practical applications in optical temperature detection.
Author contributions
Tejas: methodology, formal analysis, validation, investigation, data curation, writing – original draft, writing – review & editing. Princy A: validation, software, resources, investigation. S Masilla Moses Kennedy: visualization, software, resources. Vikash Mishra – validation, resources, software. M. I. Sayyed – investigation, validation, resources. Taha. A. Hanafy – resources, software. Sudha D. Kamath: writing – review & editing, visualization, validation, supervision, resources, project administration, investigation, formal analysis, data curation.
Data availability
The data that support the findings of this study are available from the corresponding author upon reasonable request.
Conflicts of interest
The authors declare that they have no known competing financial interests or personal relationships that could have appeared to influence the work reported in this paper.
Acknowledgements
The authors acknowledge the financial support from the Manipal Academy of Higher Education to carry out this research work.
References
- G. B. Nair, H. C. Swart and S. J. Dhoble, A review on the advancements in phosphor-converted light emitting diodes (pc-LEDs): phosphor synthesis, device fabrication and characterization, Prog. Mater. Sci., 2020, 109, 100622 CrossRef CAS.
- K. Yang, Y. Shen, K. He, T. Zhang, R. Xu and S. Zhao,
et al., An optical fiber temperature sensor based on fluorescence intensity ratio used for real-time monitoring of chemical reactions, Ceram. Int., 2021, 47(23), 33537–33543 CrossRef CAS.
- T. Q. Trung, T. M. L. Dang, S. Ramasundaram, P. T. Toi, S. Y. Park and N. E. Lee, A Stretchable Strain-Insensitive Temperature Sensor Based on Free-Standing Elastomeric Composite Fibers for On-Body Monitoring of Skin Temperature, ACS Appl. Mater. Interfaces, 2019, 11(2), 2317–2327 CrossRef CAS PubMed.
- R. Chen, T. Luo, D. Geng, Z. Shen and W. Zhou, Facile fabrication of a fast-response flexible temperature sensor via laser reduced graphene oxide for contactless human-machine interface, Carbon N. Y., 2022, 187, 35–46 CrossRef CAS.
- G. Yan, T. Wang, L. Zhu, F. Meng and W. Zhuang, A novel strain-decoupled sensitized FBG temperature sensor and its applications to aircraft thermal management, Opt. Laser Technol., 2021, 140, 106597 CrossRef CAS.
- B. Arman Kuzubasoglu and S. Kursun Bahadir, Flexible temperature sensors: a review, Sens. Actuators, A, 2020, 315, 112282 CrossRef CAS.
- Y. Guo, J. Xie, M. Yu, W. Huang, H. Yang and X. Li,
et al., The enhanced up-conversion green by Yb–Mn dimer in NaBiF4:Yb3+/Er3+/Mn2+ for optical fiber temperature sensor, J. Alloys Compd., 2021, 888, 161497 CrossRef CAS.
- J. Wang, H. Shen, Y. Xia and S. Komarneni, Light-activated room-temperature gas sensors based on metal oxide nanostructures: a review on recent advances, Ceram. Int., 2021, 47, 7353–7368 CrossRef CAS.
- D. Chen, M. Xu, S. Liu and X. Li, Eu2+/Eu3+ dual-emitting glass ceramic for self-calibrated optical thermometry, Sens. Actuators, B, 2017, 246, 756–760 CrossRef CAS.
- V. Lojpur, Ž. Antić and M. D. Dramićanin, Temperature sensing from the emission rise times of Eu3+ in SrY2O4, Phys. Chem. Chem. Phys., 2014, 16(46), 25636–25641 RSC.
- W. Xu, H. Zhao, Y. Li, L. Zheng, Z. Zhang and W. Cao, Optical temperature sensing through the upconversion luminescence from Ho3+/Yb3+ codoped CaWO4, Sens. Actuators, B, 2013, 188, 1096–1100 CrossRef CAS.
- I. E. Kolesnikov, A. A. Kalinichev, M. A. Kurochkin, E. Y. Kolesnikov and E. Lähderanta, Porphyrins as efficient ratiometric and lifetime-based contactless optical thermometers, Mater. Des., 2019, 184, 108188 CrossRef CAS.
- I. E. Kolesnikov, M. A. Kurochkin, E. V. Golyeva, D. V. Mamonova, A. A. Kalinichev and E. Y. Kolesnikov,
et al., Multimode high-sensitivity optical YVO4:Ln3+ nanothermometers (Ln3+ = Eu3+, Dy3+, Sm3+) using charge transfer band features, Phys. Chem. Chem. Phys., 2020, 22(48), 28183–28190 RSC.
- S. Lin, Z. Liao, H. Zheng, C. Li, Y. Cui and Z. Wang,
et al., A polarized luminescence thermometer based on a dye encapsulated metal–organic framework, J. Mater. Chem. C, 2024, 12(7), 2391–2397 RSC.
- Y. Patle, N. Brahme, D. P. Bisen, T. Richhariya, E. Chandrawanshi and A. Choubey,
et al., Study of Photoluminescence,Thermoluminescence, and Afterglow properties of Dy3+ doped Ba2ZnSi2O7 phosphor, Optik, 2021, 226, 165896 CrossRef CAS.
- I. Gupta, S. Singh, S. Bhagwan and D. Singh, Rare earth (RE) doped phosphors and their emerging applications: a review, Ceram. Int., 2021, 47, 19282–19303 CrossRef CAS.
- H. R. Shih and Y. S. Chang, Structure and photoluminescence properties of Sm3+ ion-doped YInGe2O7 phosphor, Materials, 2017, 10(7), 779 CrossRef PubMed.
- A. Z. M. Al-Juboori, Rare earth (Sm3+ and Dy3+)-doped gadolinium oxide nanomaterials for luminescence thermometry, Phys. Scr., 2013, 014004 CrossRef CAS.
- S. Sharma, S. Kumar Dubey and A. K. Diwakar, Luminescence investigation on Ca2MgSi2O7:Eu2+,Dy3+ phosphor, Int. J. Mater. Sci., 2021, 2(2), 08–15 Search PubMed.
- K. Igashira, D. Nakauchi, T. Ogawa, T. Kato, N. Kawaguchi and T. Yanagida, Effects of dopant concentration in Eu-doped Ca2MgSi2O7 single crystalline scintillators, Mater. Res. Bull., 2021, 135, 111155 CrossRef CAS.
- S. Sharma and S. K. Dubey, 5 Structural, morphological, thermal, and long persistent properties of synthesized nanostructured phosphor, Nanocomposite Nanohybrid Mater.: Process. Appl., 2023, 17, 99 Search PubMed.
- I. P. Sahu, D. P. Bisen and N. Brahme, Luminescence properties of green-emitting Ca2MgSi2O7:Eu2+ phosphor by a solid-state reaction method, Luminescence., 2015, 30(7), 1125–1132 CrossRef CAS PubMed.
- Y. Wang, S. Wu, W. Lei, M. Wu, Y. Wang and F. Li,
et al., A new method for preparing cubic-shaped Sr2MgSi2O7:Eu2+,Dy3+ phosphors and the effect of sintering temperature, Ceram. Int., 2022, 48(4), 5397–5403 CrossRef CAS.
- M. A. Tshabalala, H. C. Swart, F. B. Dejene, E. Coetsee and O. M. Ntwaeaborwa, Structure, surface analysis, photoluminescent properties and decay characteristics of Tb3+–Eu3+ co-activated Sr2MgSi2O7 phosphor, Appl. Surf. Sci., 2016, 360, 409–418 CrossRef CAS.
- W. Teng, H. Dong, C. Hu, X. Yang, J. Wang and X. Liang,
et al., Achieving multi-wavelength excitation and multi-color tunable emission in self-reducing phosphor of Ba2MgSi2O7:Eu2+/Eu3+, J. Lumin., 2024, 269, 120524 CrossRef CAS.
- R. Cao, J. Wei, T. Chen, B. Lan, L. Li and R. Liu,
et al., Synthesis, adjustable-color emission and energy transfer of Ba2MgSi2O7:Sm3+,Bi3+ phosphors, J. Mol. Struct., 2023, 1274, 134404 CrossRef CAS.
- X. Shui, C. Zou, W. Zhang, C. Bao and Y. Huang, Effect of M3+ (M = Bi, Al) co-doping on the luminescence enhancement of Ca2ZnSi2O7:Sm3+ orange-red-emitting phosphors, Ceram. Int., 2021, 47(6), 8228–8235 CrossRef CAS.
- C. Yao and C. Zhang, Photoluminescence enhancement and excellent thermal stability of Ca2ZnSi2O7:Pr3+ red-emitting phosphors through charge compensator A+ (Li+, Na+ and K+) co-doping for w-LED applications, Spectrochim. Acta, Part A, 2023, 303, 123177 CrossRef CAS PubMed.
- S. Chandraker, J. Kaur, R. Priya, V. Dubey and N. Dubey, White light emission and thermoluminescence studies of Dy3+-activated hardystonite (Ca2ZnSi2O7) phosphor, Luminescence, 2021, 36(6), 1507–1512 CrossRef CAS PubMed.
- B. Tian, K. Chen, J. Zhou, F. Shang, A. Manan and G. Chen, Photoluminescence properties of Eu3+ and Al3+-doped Ca2ZnSi2O7 red phosphors for plant growth LEDs, J. Mater. Sci.: Mater. Electron., 2024, 35(12), 863 CrossRef CAS.
- V. Singh, N. Deopa, S. Kaur, A. S. Rao, J. L. Rao and G. Lakshminarayana, EPR and Optical Properties of Green Emitting Mn Activated Sr2ZnSi2O7 Phosphors Prepared by Sol–Gel Method, J. Electron. Mater., 2020, 49(3), 2265–2272 CrossRef CAS.
- S. Chandraker, J. Kaur, V. Dubey and N. Dubey, Composite nature of thermo luminescence studies in Dy3+ activated Sr2ZnSi2O7 phosphor, Optik, 2021, 241, 166904 CrossRef CAS.
- S. Chandraker, J. Kaur and V. Dubey, Determination of spectroscopic parameters and thermoluminescence studies of Dy3+-activated Ba2ZnSi2O7 phosphor, Radiat. Eff. Defects Solids, 2021, 176(11–12), 1116–1128 CrossRef CAS.
- Z. Yang, Y. Hu, L. Chen and X. Wang, Color tuning of Ba2ZnSi2O7:Ce3+,Tb3+ phosphor via energy transfer, J. Lumin., 2014, 153, 412–416 CrossRef CAS.
- S. Deng, Z. Qiu, M. Zhang, W. Zhou, J. Zhang and C. Li,
et al., Tricolor emitting and energy transfer in the phosphor Ba2ZnSi2O7:Ce3+,Eu3+,Eu2+ for white-LED based near-UV chips, J. Rare Earths, 2015, 33(5), 463–468 CrossRef CAS.
- Z. Y. Zou, K. Du, X. K. Lan, W. Z. Lu, X. C. Wang and X. H. Wang,
et al., Anti-reductive characteristics and dielectric loss mechanisms of Ba2ZnSi2O7 microwave dielectric ceramic, Ceram. Int., 2019, 45(15), 19415–19419 CrossRef CAS.
- A. M. Pire and M. R. Davolos, Luminescence of europium(III) and manganese(II) in barium and zinc orthosilicate, Chem. Mater., 2001, 13(1), 21–27 CrossRef.
- H. Li, R. Pang, G. Liu, W. Sun, D. Li and L. Jiang,
et al., Synthesis and Luminescence Properties of Bi3+-Activated K2MgGeO4: A Promising High-Brightness Orange-Emitting Phosphor for WLEDs Conversion, Inorg. Chem., 2018, 57(19), 12303–12311 CrossRef CAS PubMed.
- R. Naik, S. C. Prashantha, H. Nagabhushana, H. P. Nagaswarupa, K. S. Anantharaju and S. C. Sharma,
et al., Mg2SiO4:Tb3+ nanophosphor: auto ignition route and near UV excited photoluminescence properties for WLEDs, J. Alloys Compd., 2014, 617, 69–75 CrossRef CAS.
- R. Hepzi and P. Devamani, Synthesis and characterization of barium hydroxide nanoparticles, Asian Acad. Res. J. Multidisciplinary, 2014, 58–68 Search PubMed.
- M. Riaz, H. Imtiaz, M. Hussain, A. Qamar, F. Bashir and T. Hussain, A study on synthesis and characterization of non-stoichiometric hardystonite Ca2ZnSi2O7 for optical and dielectric applications, Opt. Mater., 2022, 131, 112699 CrossRef CAS.
- C. Kumas and A. Obut, Effect of heating on structure and leaching characteristics of a zinc carbonate ore, Physicochem. Probl. Miner. Process., 2021, 57(5), 23–32 CAS.
- X. Zhang, C. Zhang, Y. Li, J. Li, J. Zhang, H. Liu, W. Ai, R. Wang, D. Huang and C. K. Mahadevan, Structural and optical properties of Sm3+ doped Sr2SiO4 phosphor prepared from coal gasification slag for the LED application, Opt. Mater., 2024, 148, 114954 CrossRef CAS.
- A. S. Priya, S. Ramachandran, S. D. Vasantha and H. P. Kumar, Delineating Dy3+ and Sm3+ in thermally stable strontium silicate apatites for multifunctional applications, J. Mol. Struct., 2024, 1312, 138540 CrossRef CAS.
- Y. Li, S. Xu, J. Chen, Y. Gao, X. Zhang, K. Pang, H. Liu, Y. Chi, X. Sun and C. K. Mahadevan, A novel Sm3+ doped niobium silicate luminescent glass with high thermal stability for the temperature sensing and LED applications, Opt. Mater., 2024, 153, 115607 CrossRef CAS.
- G. Ramakrishna, H. Nagabhushana, S. C. Prashantha, S. C. Sharma and B. M. Nagabhushana, Role of flux on morphology and luminescence properties of Sm3+ doped Y2SiO5 nanopowders for WLEDs, Spectrochim. Acta, Part A, 2015, 136(PB), 356–365 CrossRef CAS PubMed.
- G. S. R. Raju and S. Buddhudu, Emission analysis of Sm3+ and Dy3+:MgLaLiSi2O7 powder phosphors, Spectrochim. Acta, Part A, 2008, 70(3), 601–605 CrossRef PubMed.
- B. V. Ratnam, M. Jayasimhadri and K. Jang, Luminescent properties of orange emissive Sm3+-activated thermally stable phosphate phosphor for optical devices, Spectrochim. Acta, Part A, 2014, 132, 563–567 CrossRef CAS PubMed.
- Z. Wang, P. Li, Z. Yang and Q. Guo, A novel red phosphor BaZn2(PO4)2:Sm3+,R+ (R = Li, Na, K), J. Lumin., 2012, 132(8), 1944–1948 CrossRef CAS.
- R. Yu, H. Mi Noh, B. Kee Moon, B. Chun Choi, J. Hyun Jeong and H. Sueb Lee,
et al., Photoluminescence characteristics of Sm3+-doped Ba2CaWO6 as new orange-red emitting phosphors, J. Lumin., 2014, 152, 133–137 CrossRef CAS.
- Z. Wu, B. Chen, X. Li, J. Zhang, J. Sun and H. Zhong,
et al., Optical transition properties, energy transfer mechanism and luminescent thermal stability of Sm3+-doped silicate glasses, J. Alloys Compd., 2016, 663, 545–551 CrossRef CAS.
- S. A. R. Sekaran, R. K. Padhi, E. S. Yousef and K. Marimuthu, Spectroscopic studies on Sm3+ ions doped modifiers incited calcium phospho-silicate glasses for photonic and optoelectronic applications, J. Non-Cryst. Solids, 2024, 623, 122692 CrossRef CAS.
- Q. Xu, J. Sun, D. Cui, Q. Di and J. Zeng, Synthesis and luminescence properties of novel Sr3Gd(PO4)3:Dy3+ phosphor, J. Lumin., 2015, 158, 301–305 CrossRef CAS.
- X. Wu, X. Zhao, Q. Ren, L. Du, M. Pei and O. Hai, Design efficient energy transfer Ca2Al2SiO7:Bi3+,Eu3+ phosphors by cationic substitution for full-spectrum W-LED lighting, Ceram. Int., 2023, 49(11), 18852–18860 CrossRef CAS.
- D. L. Dexter, A theory of sensitized luminescence in solids, J. Chem. Phys., 1953, 21(5), 836–850 CrossRef CAS.
- K. Cheng, Y. Xu, X. Liu, J. Long, W. Huang and C. Deng, A novel far-red phosphors Li2ZnTi3O8:Cr3+ for indoor plant cultivation: synthesis and luminescence properties, Ceram. Int., 2023, 49(4), 6343–6350 CrossRef.
- T. M. Mazzo, M. L. Moreira, I. M. Pinatti, F. C. Picon, E. R. Leite and I. L. V. Rosa,
et al., CaTiO3:Eu3+ obtained by microwave assisted hydrothermal method: a photoluminescent approach, Opt. Mater., 2010, 32(9), 990–997 CrossRef CAS.
- in Luminescence of Inorganic Solids, ed. B. Di Bartolo, V. Godberg and D. Pacheco, Springer US, Boston, MA, 1978. Available from: https://link.springer.com/10.1007/978-1-4684-3375-3 Search PubMed.
- A. K. Vishwakarma, K. Jha, M. Jayasimhadri, B. Sivaiah, B. Gahtori and D. Haranath, Emerging cool white light emission from Dy3+ doped single phase alkaline earth niobate phosphors for indoor lighting applications, Dalton Trans., 2015, 44(39), 17166–17174 RSC.
- C. S. McCamy, Correlated color temperature as an explicit function of chromaticity coordinates, Color Res. Appl., 1992, 17(2), 142–144 CrossRef.
- P. Sharma and M. Jayasimhadri, Exploration of efficient photoluminescence properties of intense green emitting Er3+ activated NaBi(MoO4)2 phosphor for white LED applications, J. Mater. Res., 2023, 38(20), 4655–4664 CrossRef.
- S. G. M. Mushtaque, A. R. Kadam and S. J. Dhoble, High color purity and color tunability in Sm3+/Eu3+ activated/co-activated Sr6Ca4(PO4)6F2 phosphor for WLED and display devices application, J. Mol. Struct., 2023, 1274, 134510 CrossRef CAS.
- R. M. Evans and B. K. Swenholt, Chromatic Strength of Colors: Dominant Wavelength and Purity, J. Opt. Soc. Am., 1967, 57(11), 1319–1324 CrossRef CAS PubMed.
- Y. C. Jiang, Y. Tong, S. Y. Z. Chen, W. N. Zhang, F. F. Hu and R. F. Wei,
et al., A three-mode self-referenced optical thermometry based on up-conversion luminescence of Ca2MgWO6:Er3+,Yb3+ phosphors, Chem. Eng. J., 2021, 413, 127470 CrossRef CAS.
- R. Mahajan and R. Prakash, Effect of Sm3+ doping on optical properties of Mg2P2O7 and Mg3P2O8 phosphors, Mater. Chem. Phys., 2020, 246, 122826 CrossRef CAS.
- M. Farooq, M. H. Rasool, H. Rafiq, I. Nazir and S. Rubab, Synthesis, characterization and optical tuning of Sm3+ doped NaZnPO4 phosphors for white LED technology, Ceram. Int., 2024, 50(12), 21118–21129 CrossRef CAS.
- P. Khajuria, V. D. Sharma, A. Khajuria, R. Prakash and R. J. Choudhary, Synthesis and Spectroscopic Investigations of Sm3+ Activated ZrO2 and Na2ZrO3 as Warm Light Phosphors, J. Fluoresc., 2024, 1–16 Search PubMed.
- A. Saeed, S. Sobaih, W. A. Abu-raia, A. Abdelghany and S. Heikal, Novel Er3+ doped heavy metals-oxyfluorophosphate glass as a blue emitter, Opt. Quantum Electron., 2021, 53(8), 482 CrossRef CAS.
- G. Sun and Q. Chen, Novel red-emitting Ca2LiScB4O10:Sm3+ phosphor for WLED: photoluminescence, thermal stability, crystal structure, Judd-Ofelt parameters and energy band gap studies, J. Alloys Compd., 2023, 936, 168263 CrossRef CAS.
- L. S. Archana, D. N. Rajendran, K. Sreelatha and J. Cyriac, Effect of Sm3+ ions doping on the structural and optical properties, Judd-Ofelt and radiative parameters of ZnS phosphor materials, Mater. Chem. Phys., 2023, 305, 127934 CrossRef CAS.
- R. Cao, T. Huang, J. Nie, L. Zhang, Y. Chen and L. Li,
et al., Energy transfer and tunable-color luminescence properties of a single-phase CaSrNb2O7:Sm3+,Bi3+, J. Mol. Struct., 2024, 1297, 136962 CrossRef CAS.
- C. Y. Chang, T. H. Hsu and C. L. Huang, Novel and thermostable double-perovskite La2ZnTiO6:Sm3+,Dy3+ phosphors with high quantum efficiency, Opt. Mater., 2023, 135, 113361 CrossRef CAS.
- R. Cao, J. Lin, B. Lan, F. Cheng, T. Chen and L. Li,
et al., Luminescence properties, tunable emission and energy transfer of Na3Sc2(PO4)3:Sm3+,Bi3+ phosphors, J. Mol. Struct., 2023, 1282, 135221 CrossRef CAS.
- X. Li, J. Ding, Z. Tang, X. Lin, H. Dong and A. Wu,
et al., Novel orange-red emitting Sr3Ga2Ge4O14:Sm3+ phosphors with high color purity for red-backlight display and white LEDs, Ceram. Int., 2024, 50, 20–28 CrossRef CAS.
- A. Y. Madkhli, H. Kaynar, M. B. Coban, M. Ayvacikli, A. Canimoglu and N. Can, Characterization, room and low temperature photoluminescence of yttrium aluminium borate activated with Sm3+ ions, Mater. Res. Bull., 2023, 161, 112167 CrossRef CAS.
- L. Mukhopadhyay and V. K. Rai, Thermally stable red emitting xenotime phosphate nanophosphors for displays, Mater. Res. Bull., 2020, 121, 110628 CrossRef CAS.
- M. Prasad and V. K. Rai, Coactivated cyan emitting phosphors in optical thermometry using thermally and non-thermally coupled levels, Mater. Res. Bull., 2023, 160, 112116 CrossRef CAS.
- S. Pattnaik and V. K. Rai, Tailoring of upconversion luminescence of Al3+ engineered titanate phosphor for non-invasive thermometry, Methods Appl. Fluoresc., 2022, 10(3), 034002 CrossRef CAS PubMed.
- Y. Yang, Z. Lu, H. Fan, M. Chen, L. Shen and X. Zhang,
et al., Ultra-Broadband Near-Infrared Phosphors Realized by the Heterovalent Substitution Strategy, Inorg. Chem., 2023, 62(8), 3601–3608 CrossRef CAS PubMed.
- D. Wu, L. Liu, H. Liang, H. Duan, W. Nie and J. Wang,
et al., LiBAlF6:Cr3+ (B = Ca, Sr) fluoride phosphors with ultra-broad near-infrared emission for NIR pc-LEDs, Ceram. Int., 2022, 48(1), 387–396 CrossRef CAS.
- Z. Tian, B. Liu, Y. Xiao, Z. Wang, L. Zhang and S. Xu,
et al., Unveiling the phonon effect on the narrow-band deep-red emission from solution–combustion synthesized Mn4+ doped CaYAlO4 microcrystals, J. Alloys Compd., 2022, 923, 166280 CrossRef CAS.
- C. Li, F. Tang, Y. Xiao, Y. Zhou, B. Zhao and S. Lv, High brightness and vibronic luminescent behavior of YAG: Mn4+/Ca2+ red phosphor for preparing phosphor-in-glass in white LED, J. Mater. Chem. C, 2023, 11(41), 14413–14420 RSC.
- J. W. de Wit, T. P. van Swieten, M. A. van de Haar, A. Meijerink and F. T. Rabouw, Increasing the Power: Absorption Bleach, Thermal Quenching, and Auger Quenching of the Red-Emitting Phosphor K2TiF6:Mn4+, Adv. Opt. Mater., 2023, 11(9), 2202974 CrossRef CAS.
- B. Vasanthi, N. Gopakumar and P. S. Anjana, Thermally stable and red emitting bismuth ions sensitized SrGa2O4:Eu3+ phosphors for phosphor converted WLED applications, Solid State Sci., 2024, 151, 107526 CrossRef CAS.
- J. Zheng, Q. Cheng, C. Zheng, G. Chen, F. Shi and C. Chen, Correlated color temperature tunability and energy transfer phenomenon in the NaBaBO3:Dy3+/Eu3+ phosphor for white light application. Functional, Mater. Lett., 2015, 8(6), 1550077 CAS.
- B. Klimesz, R. Lisiecki and W. Ryba-Romanowski, Sm3+-doped oxyfluorotellurite glasses – spectroscopic, luminescence and temperature sensor properties, J. Alloys Compd., 2019, 788, 658–665 CrossRef CAS.
- J. Liao, M. Wang, L. Kong, J. Chen, X. Wang, H. Yan, J. Huang and C. Tu, Dual-mode optical temperature sensing behavior of double-perovskite CaGdMgSbO6: Mn4+/Sm3+ phosphors, J. Lumin., 2020, 226, 117492 CrossRef CAS.
- Q. Chen, X. Yang, G. Zhang, Q. Ma, S. Han and B. Ma, Color-tunable Eu3+ – or Sm3+-doped perovskite phosphors as optical temperature-sensing materials, Opt. Mater., 2021, 111, 110585 CrossRef CAS.
- Y. Gao, F. Huang, H. Lin, J. Zhou, J. Xu and Y. Wang, A Novel Optical Thermometry Strategy Based on Diverse Thermal Response from Two Intervalence Charge Transfer States, Adv. Funct. Mater., 2016, 26(18), 3139–3145 CrossRef CAS.
- F. Huang and D. Chen, Synthesis of Mn2+:Zn2SiO4-Eu3+:Gd2O3 nanocomposites for highly sensitive optical thermometry through the synergistic luminescence from lanthanide-transition metal ions, J. Mater. Chem. C, 2017, 5(21), 5176–5182 RSC.
- J. Liao, M. Wang, L. Kong, J. Chen, X. Wang and H. Yan,
et al., Dual-mode optical temperature sensing behavior of double-perovskite CaGdMgSbO6:Mn4+/Sm3+ phosphors, J. Lumin., 2020, 226, 117492 CrossRef CAS.
- S. Zhang and Y. Hu, Photoluminescence spectroscopies and temperature-dependent luminescence of Mn4+ in BaGe4O9 phosphor, J. Lumin., 2016, 177, 394–401 CrossRef CAS.
- A. Mamedov, Urbach rule and optical properties of the LiNbO3 and LiTaO3, J. Opt. A: Pure Appl. Opt., 1999, 1(3), 424 CrossRef.
- H. Luo, X. Li, X. Wang and M. Peng, Highly thermal-sensitive robust LaTiSbO6:Mn4+ with a single-band emission and its topological architecture for single/dual-mode optical thermometry, Chem. Eng. J., 2020, 384, 1223272 CrossRef.
- A. Zhang, Z. Sun, M. Jia, Z. Fu, B. C. Choi and J. H. Jeong,
et al., Sm3+-doped niobate orange-red phosphors with a double-perovskite structure for plant cultivation and temperature sensing, J. Alloys Compd., 2022, 889, 161671 CrossRef CAS.
- I. E. Kolesnikov, E. V. Golyeva, M. A. Kurochkin, E. Y. Kolesnikov and E. Lähderanta, Concentration series of Sm3+-doped YVO4 nanoparticles: structural, luminescence and thermal properties, J. Lumin., 2020, 219, 116946 CrossRef CAS.
- L. R. Dačanin, S. R. Lukić-Petrović, D. M. Petrović, M. G. Nikolić and M. D. Dramićanin, Temperature quenching of luminescence emission in Eu3+ – and Sm3+-doped YNbO4 powders, J. Lumin., 2014, 151, 82–87 CrossRef.
- X. Tian, L. Guo, J. Wen, L. Zhu, C. Ji and Z. Huang,
et al., Anti-thermal quenching behavior of Sm3+ doped SrMoO4 phosphor for new application in temperature sensing, J. Alloys Compd., 2023, 959, 170574 CrossRef CAS.
- J. Q. Chen, J. Y. Chen, W. N. Zhang, S. J. Xu, L. P. Chen and H. Guo, Three-mode optical thermometer based on Ca3LiMgV3O12:Sm3+ phosphors, Ceram. Int., 2023, 49(10), 16252–16259 CrossRef CAS.
- W. P. Chen, F. F. Hu, R. F. Wei, Q. G. Zeng, L. P. Chen and H. Guo, Optical thermometry based on up-conversion luminescence of Tm3+ doped transparent Sr2YF7 glass ceramics, J. Lumin., 2017, 192, 303–309 CrossRef CAS.
- J. Fu, L. Zhou, Y. Chen, J. Lin, R. Ye and D. Deng,
et al., Dual-mode optical thermometry based on Bi3+/Sm3+ co-activated BaGd2O4 phosphor with tunable sensitivity, J. Alloys Compd., 2022, 897, 163034 CrossRef CAS.
- H. Li, L. Li, L. Mei, W. Zhao, X. Zhou and Y. Hua, Energy transfer from VO43− to Sm3+ ions in α-Sr2V2O7 phosphors for full-spectrum warm-WLED device and low-temperature luminescence lifetime thermometry, Mater. Today Chem., 2023, 32, 101661 CrossRef CAS.
- L. Li, S. Fu, Y. Zheng, C. Li, P. Chen and G. Xiang,
et al., Near-ultraviolet and blue light excited Sm3+ doped Lu2MoO6 phosphor for potential solid-state lighting and temperature sensing, J. Alloys Compd., 2018, 738, 473–483 CrossRef CAS.
|
| This journal is © The Royal Society of Chemistry 2024 |
Click here to see how this site uses Cookies. View our privacy policy here.  Open Access Article
 *a
*a


![[thin space (1/6-em)]](https://www.rsc.org/images/entities/char_2009.gif) cos
cos![[thin space (1/6-em)]](https://www.rsc.org/images/entities/char_2009.gif) θ)2versus (dhkl2βhkl
θ)2versus (dhkl2βhkl![[thin space (1/6-em)]](https://www.rsc.org/images/entities/char_2009.gif) cos
cos![[thin space (1/6-em)]](https://www.rsc.org/images/entities/char_2009.gif) θ) plot indicates the size of the crystallite. The crystallite sizes for the phosphors are found to be 20.9, 44.0, 37.5, 32.4, 35.6, and 32.9 nm respectively. The size–strain curve is shown in Fig. 2(a)–(f). The average strain was found to be 0.0084.
θ) plot indicates the size of the crystallite. The crystallite sizes for the phosphors are found to be 20.9, 44.0, 37.5, 32.4, 35.6, and 32.9 nm respectively. The size–strain curve is shown in Fig. 2(a)–(f). The average strain was found to be 0.0084.


 is the donor,
  is the acceptor.


 where the chromatic coordinates of the prepared phosphor are represented by (xp, yp) and the epicenter of convergence is represented by (x0, y0) = (0.332, 0.186). To compute λd, a line connecting (xp, yp) and (x0, y0) will be drawn. It is then extended to a point on the edge of the diagram after that. The wavelength that matches the coordinates of the perimeter is called λd. With the use of all these findings, we can use the formula to determine color purity.62


 for a direct transition,67


![[small beta, Greek, macron]](https://www.rsc.org/images/entities/i_char_e0c3.gif) is the average nephelauxetic ratio value. The specific kind of Sm3+–ligand bond is classified as ionic when δ is negative and as covalent when δ is positive.70 The band assignments, nephelauxetic ratio (β), and bonding parameter (δ) for the system are listed in Table 4. Since the bonding value was discovered to be −1.6264, δ < 0. Due to the negative value of the bonding parameter, the Sm3+–ligand bonds are ionic in nature.
is the average nephelauxetic ratio value. The specific kind of Sm3+–ligand bond is classified as ionic when δ is negative and as covalent when δ is positive.70 The band assignments, nephelauxetic ratio (β), and bonding parameter (δ) for the system are listed in Table 4. Since the bonding value was discovered to be −1.6264, δ < 0. Due to the negative value of the bonding parameter, the Sm3+–ligand bonds are ionic in nature.
![[small beta, Greek, macron]](https://www.rsc.org/images/entities/i_char_e0c3.gif)


 with ħω/k = 94.41 K was found to be the best match. It was found that the fitted value of phonon energy ħω was 65.61 cm−1. Similarly, for
  with ħω/k = 91.84 K was discovered to be the ideal fit. It was discovered that 63.83 cm−1 was the fitting value of phonon energy. These findings suggested that temperature sensing may also be accomplished with the optimized phosphor due to the lowest phonon energy.


