 Open Access Article
Creative Commons Attribution 3.0 Unported Licence
Promising single crystal host for bulk scintillators: luminescence and energy migration in (Gd,Y)AlO3
Monika
Kotyková
 *ab,
Romana
Kučerková
 a,
Alena
Beitlerová
 a,
Vladimir
Babin
 a,
Vítězslav
Jarý
 a,
Jan
Touš
b,
Jan
Polák
b,
Karel
Blažek
b and
Martin
Nikl
 a
a
aInstitute of Physics of the Czech Academy of Sciences, Prague, Czech Republic. E-mail: kotykova@fzu.cz
bCRYTUR spol. s r. o., Turnov, Czech Republic
First published on 12th November 2024
Abstract
The optical and photoluminescent characteristics of the heavy perovskite (Gd0.40,Y0.60)AlO3 single crystal were evaluated. Typical Gd3+ transitions were observed in the absorption spectrum. The photoluminescent kinetics and temperature dependence of the Gd3+ emission line at 312 nm were examined in order to study the energy migration within the Gd3+ sublattice. In comparison to multicomponent (Gd,Y)3(Ga,Al)5O12 garnet, the migration in (Gd0.40,Y0.60)AlO3 was demonstrated to be more rapid and more efficient at lower temperatures. The radioluminescent spectrum demonstrated the existence of accidental impurities, namely Ce3+, Fe3+ and Cr3+, within the primary material, which were subsequently verified through the observation of their distinctive kinetic properties. In excitation spectra within the VUV-UV range at room temperature the band-to-band transition is situated at about 180 nm, in which also an efficient excitation of Ce3+ emission occurs. Such a host paves the way to economic industrial production of heavy aluminum perovskite-based single crystal scintillators.
1. Introduction
The well-known scintillation material YAlO3:Ce (YAP:Ce) is a widely used component in a number of fields, including electron microscopy, X-ray imaging, electron beam inspection systems and medical applications. The most appealing characteristics of this material are its rapid luminescence and scintillation decay time (18–30 ns), minimal afterglow, and favourable proportionality of the response resulting in excellent energy resolution. However, its utilisation is constrained by its low density (5.37 g cm−3), low effective atomic number (Zeff = 32), and a limited light (LY) yield of approximately 20![[thin space (1/6-em)]](https://www.rsc.org/images/entities/char_2009.gif) 000 photons per MeV.1,2 These properties can be enhanced by substituting heavy rare earth ions, such as Lu or Gd, for Y. However, the growth process of LuAlO3:Ce was challenging due to its instability and the frequent appearance of a garnet phase.3 The perovskite phase was stabilised more effectively by the addition of Y cations to (Lu,Y)AlO3:Ce crystals.4 Furthermore, industrial-scale crystals of this type were produced later.5 However, the reported light yield was significantly lower than that of YAP:Ce. This issue was addressed by incorporating Gd3+ cations, which stabilised the growth process.6 The effective atomic number was increased to 64.9 and a competitive light yield of 21
000 photons per MeV.1,2 These properties can be enhanced by substituting heavy rare earth ions, such as Lu or Gd, for Y. However, the growth process of LuAlO3:Ce was challenging due to its instability and the frequent appearance of a garnet phase.3 The perovskite phase was stabilised more effectively by the addition of Y cations to (Lu,Y)AlO3:Ce crystals.4 Furthermore, industrial-scale crystals of this type were produced later.5 However, the reported light yield was significantly lower than that of YAP:Ce. This issue was addressed by incorporating Gd3+ cations, which stabilised the growth process.6 The effective atomic number was increased to 64.9 and a competitive light yield of 21![[thin space (1/6-em)]](https://www.rsc.org/images/entities/char_2009.gif) 000 photons per MeV was achieved.
000 photons per MeV was achieved.
It is known that the Gd3+ cations act as the energy donor to the majority of rare earth ions, including Ce3+. The energy transfer process Gd3+ → Ce3+ was studied in silicates,7 garnets,8 and perovskites.9
In GdAlO3:Ce, the bidirectional energy transfer Gd3+ ↔ Ce3+ was demonstrated, resulting in a notable reduction in LY.10 The scintillation kinetics was accelerated from 28 ns in YAP:Ce to 2 ns in GdAlO3:Ce as a consequence of the reverse Ce3+ → Gd3+ energy transfer causing a loss of light yield.9 Though, up to medium Gd concentration, the reverse energy transfer is not a significant issue in (Gd,Y)AlO3:Ce, and such a material shows an increased density of 6.2 g cm−3 and an effective atomic number of approximately 50, which varies depending on the Gd content.9 Micropullingdown grown small crystals of GdxY1−xAlO3:Ce show a comparable light yield for x = 0.5 and x = 0 samples.11Fig. 1 shows the comparison of the attenuation coefficient for (Gd0.5,Y0.5)AlO3 and YAlO3. The values were evaluated using the NIST-XCOM database.12 The Czech patent13 proves the possibility of growing (Gdy,Y1−x−y)AlO3:Cex crystals with a diameter greater than a few mm using the Czochralski method. This indicates that this material is well suited for high-energy gamma detection, particularly in the form of high-volume detectors with high detection efficiency. The ratio of Gd to Y is in the range y = 0.4–0.6 and the Ce3+ content is x = 0.005–0.015. Depending on the Gd/Y ratio, the effective atomic number varies from 45 to 49.
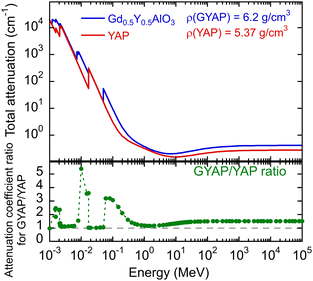 | ||
| Fig. 1 Total attenuation coefficient according to NIST-XCOM and a ratio of coefficients for (Gd0.5,Y0.5)AlO3 and YAlO3. | ||
This study focuses on undoped material (Gd0.40,Y0.60)AlO3, which was grown by the CRYTUR company. The energy migration in the Gd sublattice was investigated by an examination of the temperature dependence of the emission intensity and the decay kinetics of the Gd3+ 312 nm emission line. The presence of impurities in the initial material is identified and characterised through the analysis of their photoluminescence spectra and decay kinetics.
2. Experimental
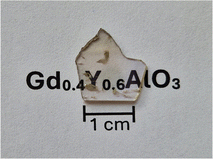
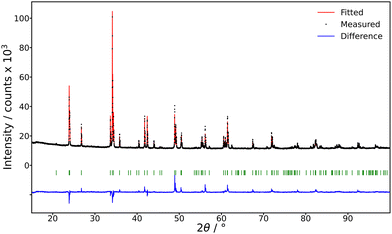
The undoped crystal of (Gd0.40Y0.60)AlO3 (further noted as (Gd,Y)AlO3) was prepared using the Czochralski method in the CRYTUR company. The photograph of the sample is in Fig. 2.The composition was verified by means of microanalysis, using the JEOL JXA-8230 apparatus. For X-ray diffraction (XRD) analysis, the powder diffraction data were collected using the Bragg–Brentano focusing configuration on the powder diffractometer Empyrean of PANalytical (λCu, Kα = 1.54184 Å), which was equipped with a fixed divergent slit and a PIXcel3D detector. The sample corresponds to the PDF card 00-060-0774 (PDF 5+ 2024) of the (Gd0.5Y0.5)AlO3 compound, see Fig. 3.
A polished plate with dimensions 7 × 7 × 1.4 mm3 was prepared for optical and luminescence measurements. Absorption spectra were measured with a Shimadzu 3101 PC spectrometer (Shimadzu). A custom-made 5000 M spectrofluorimeter (Horiba Jobin Yvon, Wildwood, MA, USA) equipped with a TBX-04 photon-counting detector (IBH Scotland) and a single-grating monochromator was used for PL and radioluminescence (RL) measurements within the 200–800 nm range. The RL spectra in the far red part of the spectra were measured by the ANDOR (Oxford Instruments) 193 mm focal length Czerny–Turner spectrograph Kymera 193i, equipped with a Back Illuminated CCD detector iDus 420. As excitation sources, the laser driven xenon lamp (EQ-99X LDLSEnergetic, Hamamatsu Company) for the PL and PLE spectra, and Mo X-ray tube (40 kV, 15 mA, Seifert) for the RL spectra were used. Nanosecond nano-LED pulsed light sources (IBH Scotland) were used to excite fast luminescence decays measured by the time-correlated single-photon counting technique. A microsecond xenon flash-lamp was used for the measurement of slow PL decays using the multichannel scaling method. The measured spectra were corrected for the spectral dependence of excitation energy (PLE) and the spectral dependence of detection sensitivity (RL, PL). To determine the true decay times, the convolution procedure was applied to the decay curves (SpectraSolve software package, Ames Photonics). Measurements within the temperature region of 77–690 K were performed using the high-temperature LN2 bath cryostat (VPF series, Janis Research Company, Inc., USA); in the region of 9–300 K, a closed-cycle refrigerator (Janis Research Company, Inc., USA) was used.
PLE spectra in the VUV-UV region were measured at the SUPERLUMI station of the P66 beamline at DESY (Hamburg, Germany) under pulsed excitation by synchrotron radiation in the range of 30–330 nm from the PETRA III storage ring. The excitation monochromator is of 2-m normal incidence McPherson-type equipped with a holder for two Al and Pt interchangeable gratings. Excitation spectra were measured with an instrumental resolution of about 0.3 nm. The luminescence was detected by a photomultiplier (Hamamatsu R6358) working in the 185–830 nm range. The samples were located on the cold finger of the He-flow cryostat, enabling temperature regulation in the range of 10–300 K. The excitation spectra are corrected using sodium salicylate.
3. Results and discussion
3.1. Absorption and radioluminescence spectra
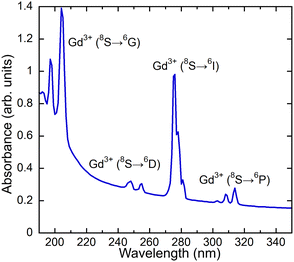
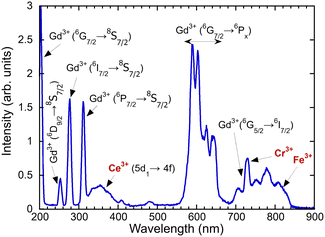
An absorption spectrum of the single crystal (Gd,Y)AlO3 at room temperature is shown in Fig. 4. It can be observed that only the lines related to the transitions of Gd3+ from the ground state 8S7/2 to the higher levels 6GJ, 6DJ, 6IJ, and 6PJ are observable. The positions of the transitions from the ground state to 6DJ, 6IJ, and 6PJ correspond to the Gd3+ absorption lines in Gd-containing undoped aluminum garnets,14,15 as the position of 4f–4f transition shows only weak dependence on the matrix. The transitions 8S–6GJ are clearly observable in the region of 200 nm, whereas in Gd2YGaAl4O12 garnets, they are obscured by the strong absorption of the host lattice below 220 nm.15In the measured radioluminescence spectrum, all dominant emission lines below 320 nm can be ascribed to the transitions of Gd3+ from higher levels to the ground state; see Fig. 5. The transitions 6G7/2–6PJ are placed in the region 550–650 nm and 6G5/2–6I7/2 above 700 nm. In addition to the Gd3+ lines, some impurity emissions can be seen. The broad band with a maximum at approximately 350 nm is attributed to the 5d–4f transition of Ce3+, typical for aluminum perovskite hosts.6,9,16 Moreover, the accidental impurities Cr3+ and Fe3+ are responsible for the emission observed above 700 nm that will be discussed in greater detail later.
3.2. Photoluminescence spectra
The emission and excitation spectra illustrated in Fig. 6 were obtained at room temperature for a range of excitation and emission wavelengths. As expected, the well-known Gd3+ emission at 312 nm was observed under 271 nm excitation (see black line in Fig. 6(a)). The corresponding PL excitation spectrum of Gd3+, as illustrated in Fig. 6(b), is in agreement with the absorption spectrum, which demonstrates all transitions to higher 4f levels of Gd3+. The excitation spectrum for 589 nm emission confirms the occurrence of transitions originating from the 6GJ levels around 200 nm. The emission spectra presented in Fig. 6(a), excited at 271, 310 and 370 nm, indicate the potential presence of impurities or defects in the material. The presence of Ce3+, Cr3+, and Fe3+ will be demonstrated also by their typical kinetic behaviour later.In addition to the Gd3+ emissions illustrated in Fig. 6(a), the emission from Ce3+ at 360 nm can be observed. The position is consistent with that observed in the radioluminescence spectrum. Fig. 6(c) shows the excitation spectrum for the emission of Ce3+ at 354 nm. The peaks observed at 191, 200 and 271 nm demonstrate the energy transfer from Gd3+ towards Ce3+. Direct excitations of Ce3+ ions are also noticeable matching the Ce3+ 4f–5d absorption bands in heavy aluminum perovskites.17
The sharp emission line at 725 nm can be attributed to Cr3+ in perovskites, as evidenced by previous studies.18,19 As illustrated in Fig. 6(b), the excitation spectrum demonstrates the energy transfer from Gd3+ to Cr3+, as previously reported in GdAlO320 and garnets.21 The low concentration of Cr3+ ions in the initial material precludes the observation of typical excitation bands.
Another common impurity in oxide crystals such as YAP, YAG and Al2O3 is Fe3+.22,23 Typically, the emission occurs at approximately 750 nm. As illustrated in Fig. 6(c), the presence of only Gd3+ lines is indicative of the infrequent occurrence of Fe3+.
The radioluminescence spectrum exhibited emissions from Ce3+, Cr3+, and Fe3+, which were also observed in the PL spectra. In contrast, the broad emission band with a maximum at 525 nm in the emission spectrum depicted in Fig. 6 is not observable in radioluminescence. The position of the band corresponds to that of Mn2+ ions in YAP:Ce.24,25 The measured decay time does not correspond to typical Mn values as will be discussed below. Typically, excitation spectra of Mn2+ exhibit a sharp excitation band at approximately 410 nm, accompanied by slow decay kinetics around 3.5 ms.26 As can be observed in Fig. 6(c), the excitation spectrum of 525 nm emission exhibits two broad bands at 310 and 380 nm. We note that in gamma irradiated YAP an induced broad absorption band at 400 nm was identified (close to the excitation band at 380 nm in Fig. 6(c)) and ascribed to an F+ center located close to the cation vacancy.22
3.3. Photoluminescence decay
The energy migration in the Gd sublattice can be characterized by the decay of the Gd3+ 312 nm emission line. Fig. 7 illustrates the decay curve of (Gd,Y)AlO3 at room temperature. The decay curve was approximated with an exponential function composed of the rise time and decay time components:I(t) = −A1![[thin space (1/6-em)]](https://www.rsc.org/images/entities/char_2009.gif) exp(−t/τr) + A2 exp(−t/τr) + A2![[thin space (1/6-em)]](https://www.rsc.org/images/entities/char_2009.gif) exp(−t/τ) exp(−t/τ) | (1) |
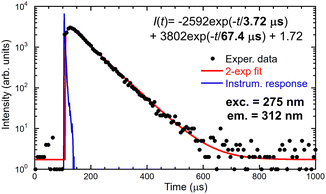 | ||
| Fig. 7 Decay curve of 312 nm emission of Gd3+, the measured data are the convolution of IRF and decay equation in the figure. | ||
Directly excited emission of Ce3+ shows acceleration in the first component of 2 ns as a result of energy transfer towards Gd3+, see Table 1. The second component of 14 ns is consistent with the known decay time of Ce3+ in YAP:Ce. The energy transfer from Gd3+ to Ce3+ is demonstrated by the existence of a slow component in Ce3+ decay when excited through the Gd3+ sublattice at 271 nm.
 background. The error of decay time τi values is of the order of 1% or less
| Exc. (nm) | Em. (nm) | τ r (μs) | τ 1 (μs) | τ 2 (μs) | |
|---|---|---|---|---|---|
| Ce3+ (5d → 4f) | 266 | 350 | 0.002 (60%) | 0.014 (40%) | |
| Gd3+ (6DJ → 8S7/2) | 241 | 278 | 6.5 | 17.0 (100%) | |
| Gd3+ (6IJ → 8S7/2) | 275 | 312 | 3.7 | 67.4 (100%) | |
| Gd3+ → Ce3+ | 271 | 350 | 15.1 (54%) | 62.5 (46%) | |
| Gd3+ → defect | 271 | 522 | 32.2 (74%) | 109.6 (26%) | |
| Gd3+ (6G7/2 → 6PJ) | 203 | 590 | 35.0 (97%) | 1470 (3%) | |
| Gd3+ → Cr3+ | 310 | 723 | 81.9 (23%) | 18![[thin space (1/6-em)]](https://www.rsc.org/images/entities/char_2009.gif) 200 (77%) 200 (77%) |
The decay time of Cr3+ in YAP was reported of 34 ms coming from a couple of R-lines at about 725 nm.18 The dominant decay time for this emission at 723 nm was then measured of 18.2 ms in (Gd,Y)AlO3, see Table 1. Such a difference might arise from different electron–phonon interaction in the (Gd,Y)AlO3 host compared to YAP which is determining the transition dipole moment.28
The measured decay curve at 522 nm can be described by two components, with decay time values of 32.2 and 109.6 μs. The absence of a long decay component in the ms time scale, typical for Mn2+ ions,26 points to a different emission center attributed by us to an unidentified defect within the crystal structure.
3.4. VUV-UV excitation
This section presents a comparative analysis of the excitation spectra of (Gd,Y)AlO3 and other materials under VUV-UV excitation at the synchrotron in DESY, Hamburk. Fig. 8 illustrates the excitation spectra for Gd3+ and Ce3+ emission in the VUV-UV range at room temperature and 10 K. The energy transfer to Ce3+ is evidenced from the excitation spectrum for 370 nm emission. In all excitation spectra, sharp Gd3+ lines in the range of 185–210 nm can be observed, as well as around 250 and 280 nm. The peak of the broad VUV excitation band may be indicative of a band-to-band transition in the host. From its position, an estimate of the energy gap (Eg) can be made. At 10 K, the band-to-band transition is observed at 160 nm (illustrated by the blue arrow in Fig. 8), which is in accordance with the findings of previous research.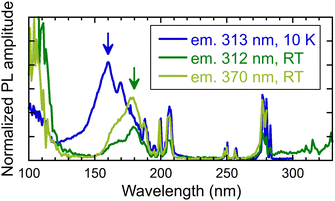 | ||
| Fig. 8 Excitation spectra measured for different emission wavelengths (313 and 370 nm) and temperature 10 K and RT. Measured at the PETRA III storage ring. | ||
At the same temperature, the transition was observed at 7.85 eV (158 nm) in YAP, at 7.07 eV (175 nm) in GdAlO3 and at 7.59 eV (163 nm) in Y0.85Gd0.15AlO3.29 In contrast to YAP, the emission of excitons is not detectable in (Gd,Y)AlO3 due to the energy transfer from excitons to Gd3+, as observed in garnets.30 In perovskite YAlO3, exciton emission was observed at 220 and 301 nm.31 These emissions were ascribed to excitons that are localised in proximity to Y3+Al-related defects.31 At room temperature, the band-to-band transition is shifted to 178 nm (green arrow in Fig. 8).
3.5. Temperature dependence
The intensity of the photoluminescence emission depends on the efficiency of energy migration within the Gd3+ sublattice, which is a function of temperature. Fig. 9 shows the dependence of the integrals of the PL spectra in the range of 295–325 nm and the decay time on the temperature. The values were normalised in order to enable comparison of their decrease in the low-temperature region. Fig. 10 illustrates the decay curves of the Gd3+ ions in (Gd,Y)AlO3 at varying temperatures. As the temperature increases from the lowest values, the decay time decreases. The rise time component was found to be approximately 50 μs in the range of 9–40 K. In the range of 60–690 K, a slight decrease in the rise time was observed.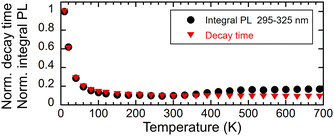 | ||
| Fig. 9 Temperature dependence of a normalised integral of PL spectra in the range of 295–325 nm excited with 275 nm and normalised PL decay time (exc. 275 nm, em. 312 nm), both norm. at 9 K. | ||
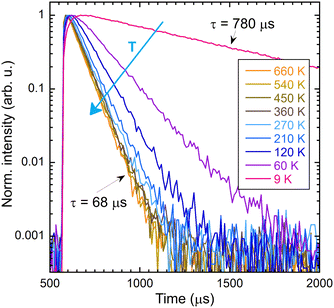 | ||
| Fig. 10 Decay curves of the intrinsic Gd3+ emission 312 nm as a function of temperature; the sample was excited at 275 nm. | ||
It has been observed that the integral of emission and the decay time exhibit similar behaviour up to a temperature of 300 K. The observed decrease in emission intensity can be explained in terms of energy migration within the Gd3+ sublattice. The energy transfer process is dependent on the assistance of lattice phonons, and thus becomes less efficient at low temperatures. As the temperature increases, the migration process becomes more efficient, involving the participation of numerous lattice constants. Subsequently, the non-radiative transfer of energy to defects, which results in energy loss, becomes more probable, leading to an acceleration in the decay process.
In contrast to the Ce-doped multicomponent garnets, migration remains effective at 9 K in (Gd,Y)AlO3 with a decay time of 780 μs that is faster than the expected decay time of Gd3+ in the order of ms. The migration of energy in garnets is limited up to 100 K. In Gd3Ga3Al2O12, the migration process becomes frozen around 60 K.15 In Gd2YGaAl4O12, the PL intensity at a temperature of 8 K is approximately 25× higher than the intensity at 300 K. The temperature at which migration is frozen in (Gd,Y)AlO3 is unknown. However, the PL intensity at 9 K is approximately ten times higher than at 300 K. It can be reasonably assumed that the ratio would be even higher if migration were still effective at the lowest temperature.
The observed increase in PL emission above 280 K is most probably caused by a combination of three factors. The first factor may be attributed to the presence of a shallow trap operating near room temperature. Thermal detrapping from such a trap at higher temperatures would return the charge carrier back to the energy migration process and increase the observed emission intensity. The second factor is an experimental artifact caused by the movement of the sample holder with a change in temperature causing an optical misalignment. The third potential contributor is a temperature-dependent absorption spectrum, as illustrated in Fig. 11. In examining the temperature dependence of the integral of absorption spectra within the range of 265–285 nm, a slight increase was observed. However, this change did not correlate with the intensity of emission (see inset in Fig. 11). Therefore, this contribution to the PL emission intensity increase can be considered minor.
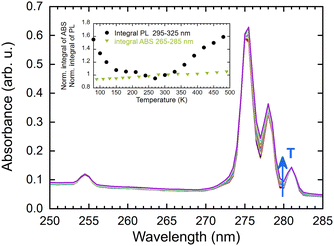 | ||
| Fig. 11 Absorption spectra as a function of temperature (77–490 K), inset: normalised integral of absorbance and PL spectra in a range of 265–285 nm (norm. at 300 K). | ||
4. Conclusions
An undoped crystal of heavy aluminum perovskite (Gd0.40,Y0.60)AlO3 was prepared by the Czochralski method and its optical and luminescence characteristics were studied. Typical Gd3+ transitions were observed in the absorption, radioluminescence, and photoluminescence spectra. The energy migration in the Gd-sublattice was monitored by analysing the Gd3+ PL decay kinetics. The presence of the Cr3+, Fe3+ and Ce3+ impurities was verified by means of RL, PL and PLE spectra, as well as through the observation of their typical characteristic decay kinetics. The transfer of energy from Gd3+ to Ce3+ was demonstrated through the examination of the PLE and decay kinetics features. The temperature dependence of the photoluminescence spectra and the decays of the Gd3+ 312 nm emission line were examined to study energy migration in the Gd sublattice. This dependence demonstrated that it is more efficient in the perovskite structure compared to that of the garnet structure. The observed decrease in PL intensity is accompanied by an acceleration of the PL decay of the 312 nm emission line. The comparable energy migration speed in the Gd sublattice in Gd0.4Y0.6AlO3 and fully concentrated GAGG garnet, along with the effective energy transfer from the host towards an accidental Ce3+ impurity of extremely low concentration, indicates the potential for the (Gd,Y)AlO3 host crystal to be used as an effective scintillator with optimized Ce3+ doping. This will be the subject of future research.Data availability
Data are available upon request from the corresponding author, and they will also be appended to the gold open access reprint with an independent doi.Conflicts of interest
There are no conflicts to declare.Acknowledgements
This research was supported by the project no. FW06010047 of Technological Agency of the Czech Republic. We would like to acknowledge DESY (Hamburg, Germany), a member of the Helmholtz Association HGF, for the provision of experimental facilities. Parts of this research were carried out at PETRA III and we would like to thank Dr Aleksei Kotlov for assistance in using P66 (PETRA III facility). Beamtime was allocated for proposal I-20221111 EC. We would like to express our gratitude to Markéta Jarošová and Karel Jurek for conducting the sample composition microanalysis and to Jan Rohlíček for undertaking the XRD measurement.Notes and references
- M. Moszynski, M. Kapusta, D. Wolski, W. Klamra and B. Cederwall, Nucl. Instrum. Methods Phys. Res., Sect. A, 1998, 404, 157–165 CrossRef CAS.
- F. Moretti, K. Hovhannesyan, M. Derdzyan, G. A. Bizarri, E. D. Bourret, A. G. Petrosyan and C. Dujardin, ChemPhysChem, 2017, 18, 493–499 CrossRef CAS PubMed.
- W. Moses, S. Derenzo, A. Fyodorov, M. Korzhik, A. Gektin, B. Minkov and V. Aslanov, IEEE Trans. Nucl. Sci., 1995, 42, 275–279 CAS.
- A. Petrosyan, G. Shirinyan, K. Ovanesyan, C. Pedrini and C. Dujardin, J. Cryst. Growth, 1999, 198–199, 492–496 CrossRef.
- J. Trummer, E. Auffray, P. Lecoq, A. Petrosyan and P. Sempere-Roldan, Nucl. Instrum. Methods, 2005, 551, 339–351 CrossRef CAS.
- M. Pokorný, V. Babin, A. Beitlerová, K. Jurek, J. Polák, J. Houžvička, D. Panek, T. Parkman, V. Vaněček and M. Nikl, NPG Asia Mater., 2021, 13, 66 CrossRef.
- E. Bosze, G. Hirata, L. Shea-Rohwer and J. McKittrick, J. Lumin., 2003, 104, 47–54 CrossRef CAS.
- M. Kučera, M. Nikl, M. Hanuš and Z. Onderisinova, Phys. Status Solidi RRL, 2013, 7, 571–574 CrossRef.
- M. Kučera, M. Rathaiah, A. Beitlerová, R. Kučerková and M. Nikl, IEEE Trans. Nucl. Sci., 2020, 67, 1049–1054 Search PubMed.
- J. A. Mareš, M. Nikl, C. Pedrini, D. Bouttet, C. Dujardin, B. Moine, J. W. M. Verweij and J. Kvapil, Radiat. Eff. Defects Solids, 1995, 135, 369–373 CrossRef.
- K. Kamada, T. Endo, K. Tsutsumi and A. Yoshikawa, Phys. Status Solidi C, 2012, 9, 2263–2266 CrossRef CAS.
- S. Seltzer, XCOM-Photon Cross Sections Database, NIST Standard Reference Database 8, 1987, https://www.nist.gov/pml/data/xcom/index.cfm.
- K. Blažek, M. Nikl, J. Touš, K. Bartoš, J. Polák and T. Marek, A method of producing a crystal for a scintillation crystal detector and a crystal for a scintillation crystal detector, Czech patent no. 309877, 2022.
- D. Spassky, F. Fedyunin, E. Rubtsova, N. Tarabrina, V. Morozov, P. Dzhevakov, K. Chernenko, N. Kozlova, E. Zabelina, V. Kasimova and O. Buzanov, Opt. Mater., 2022, 125, 112079 CrossRef CAS.
- K. Bartosiewicz, V. Babin, K. Kamada, A. Yoshikawa and M. Nikl, J. Lumin., 2015, 166, 117–122 CrossRef CAS.
- M. J. Weber, J. Appl. Phys., 1973, 44, 3205–3208 CrossRef CAS.
- E. Mihóková, M. Nikl, M. Bacci, M. Dušek and V. Petříček, Phys. Rev. B, 2009, 79, 195130 CrossRef.
- M. J. Weber, J. Appl. Phys., 1973, 44, 4058–4064 CrossRef CAS.
- M. Yamaga, H. Takeuchi, T. P. J. Han and B. Henderson, J. Phys.: Condens. Matter, 1993, 5, 8097–8104 CrossRef CAS.
- A. De Vries, W. Smeets and G. Blasse, Mater. Chem. Phys., 1987, 18, 81–92 CrossRef CAS.
- S. Vargas and D. Hamilton, J. Lumin., 1997, 72–74, 904–905 CrossRef CAS.
- Y. Dong, J. Xu, G. Zhou, G. Zhao, L. Su, X. Xu, H. Li and J. Si, Phys. Status Solidi A, 2007, 204, 608–612 CrossRef CAS.
- S. R. Rotman, C. Warde, H. L. Tuller and J. Haggerty, J. Appl. Phys., 1989, 66, 3207–3210 CrossRef CAS.
- M. A. Noginov, G. B. Loutts and M. Warren, J. Opt. Soc. Am. B, 1999, 16, 475 CrossRef CAS.
- Y. Zhydachevskii, I. Kamińska, K. Fronc, A. Reszka, W. Paszkowicz, S. Warchol, M. Berkowski, D. Elbaum and A. Suchocki, Opt. Mater., 2014, 37, 125–131 CrossRef CAS.
- Y. Zhydachevskii, A. Luchechko, D. Maraba, N. Martynyuk, M. Glowacki, E. Bulur, S. Ubizskii, M. Berkowski and A. Suchocki, Radiat. Meas., 2016, 94, 18–22 CrossRef CAS.
- V. Babin, M. Nikl, K. Kamada, A. Beitlerová and A. Yoshikawa, J. Phys. D: Appl. Phys., 2013, 46, 365303 CrossRef.
- Z. Wen-Chen, L. Bang-Xing, F. Guo-Ying and L. Hong-Gang, J. Lumin., 2013, 138, 214–217 CrossRef.
- Y. Zhydachevskii, Y. Hizhnyi, S. G. Nedilko, I. Kudryavtseva, V. Pankratov, V. Stasiv, L. Vasylechko, D. Sugak, A. Lushchik, M. Berkowski, A. Suchocki and N. Klyui, J. Phys. Chem. C, 2021, 125, 26698–26710 CrossRef PubMed.
- V. Khanin, I. Venevtsev, K. Chernenko, V. Pankratov, K. Klementiev, T. Van Swieten, A. J. Van Bunningen, I. Vrubel, R. Shendrik, C. Ronda, P. Rodnyi and A. Meijerink, J. Lumin., 2021, 237, 118150 CrossRef CAS.
- V. Babin, V. Gorbenko, I. Kondakova, T. Kärner, V. V. Laguta, M. Nikl, S. Zazubovich and Y. Zorenko, J. Phys. D: Appl. Phys., 2011, 44, 315402 CrossRef.
| This journal is © The Royal Society of Chemistry 2024 |

