Strength–ductility materials by engineering a coherent interface at incoherent precipitates†
Dongxin
Mao‡
a,
Yuming
Xie‡
ab,
Xiangchen
Meng‡
ab,
Xiaotian
Ma
b,
Zeyu
Zhang
a,
Xiuwen
Sun
a,
Long
Wan
a,
Korzhyk
Volodymyr
 c and
Yongxian
Huang
 *ab
*ab
aState Key Laboratory of Advanced Welding and Joining, Harbin Institute of Technology, Harbin 150001, China. E-mail: yxhuang@hit.edu.cn; Tel: 86-451-86413951
bZhengzhou Research Institute, Harbin Institute of Technology, Zhengzhou 450000, China
cThe E.O. Paton Electric Welding Institute of the NASU Kazymyr Malevich Str. 11, 03 150 Kyiv, Ukraine
First published on 20th April 2024
Abstract
In the quest for excellent light-structural materials that can withstand mechanical extremes for advanced applications, design and control of microstructures beyond current material design strategies have become paramount. Herein, we design a coherent shell at incoherent precipitates in the 2195 aluminum alloy with multi-step metastable phase transitions. A high local strain rate via a neoteric deformation-driven metallurgy method facilitated the diffusion of Li. The original T1 (Al2CuLi) phases were transformed into coherent-shell (Li-rich) irregular-coated incoherent-core (Al2Cu) precipitates. The ultimate tensile strength and elongation reached 620 ± 18 MPa and 22.3 ± 2.2%, exhibiting excellent strength–ductility synergy. Grain boundaries, dislocation, solid solution atoms, and precipitates all contributed to the yield strength of the materials, among which precipitates occupied a dominant position, contributing approximately 56.07%. A new “incoherent–coherent interact” strain-hardening mechanism was also clarified, which was believed to be promoted in other heat-treatable alloy systems, especially with multi-step metastable phase transitions.
New conceptsBreaking through the strength–ductility trade-off dilemma is a significant challenge in materials science. An effective strategy to design the core–shell microstructures of 2195 aluminum alloys with both coherent and incoherent features was provided. A high local strain rate via a neoteric deformation-driven metallurgy method facilitated the diffusion of Li. The original T1 (Al2CuLi) phases were transformed into coherent-shell (Li-rich) irregular-coated incoherent-core (Al2Cu) precipitates. The coherent structure activated the planar slip and expanded the mean free path for dislocation movement to increase ductility. Simultaneously, the long-range stress field caused by the incoherent precipitates strengthened the local cutting stress to avoid the dislocation overly accumulation timely. The ultimate tensile strength and elongation were 620 ± 18 MPa and 22.3 ± 2.2%, respectively, exhibiting the highest strength–ductility synergy to our best knowledge. Grain boundaries, dislocation, solid solution atoms, and precipitates all contributed to the yield strength of the materials, among which precipitates occupied a dominant position, contributing approximately 56.07%. Such an effective strategy was believed to be promoted in other heat-treatable alloy systems, especially with multi-step metastable phase transitions. |
1. Introduction
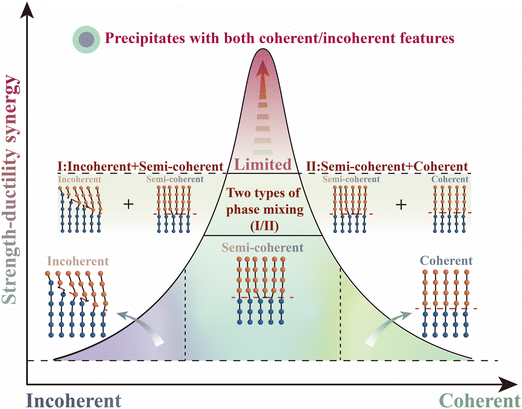
Alloys represent a vast material design space for our modern industrial development.1–3 Simultaneously, possessing superior strength and excellent ductility has been in imperious demand, as it defines the ability of an alloy to resist fracture in advanced applications at extreme conditions.4 Breaking through the strength–ductility trade-off dilemma is a significant challenge in the materials science community.5–8Precipitate control is one of the effective ways to achieve desirable strength–ductility synergy alloys, as shown in Fig. 1. Having neither the incoherent phase nor the coherent phase alone can achieve better strength–ductility synergy. That is, only by moving closer to the middle of the abscissa (combination of coherent or incoherent) can we get the “top of the curve” – the optimal solution for strength–ductility synergy. The strength improvement of alloys achieved by the incoherent precipitate is limited, as the dislocations are easily concentrated around. The strength enhancement by such a strategy is usually at the expense of a considerable ductility loss.9 The optimized coherent precipitate can modify the ductility, as the mean free path of the dislocation could be increased.10 However, the strength efficiency is sacrificed, and the plane softening behavior tends to be induced with the activation of the dislocation planar slip, which is detrimental to the maintenance of ductility.11,12 Hence, the semi-coherent precipitation becomes a compromise choice. Typically, in the third-generation 2195 Al–Li alloys, the Li level was lowered (ranging from 1.1 to 1.8 wt%) to inhibit the formation of the coherent δ′ (Al3Li) phase and tailor the semi-coherent T1(Al2CuLi) phase as the dominant strengthening phase.13 Besides, the mixed mode containing two types of phases (incoherent + semi-coherent; semi-coherent + coherent) can further promote the strength–ductility synergy,14,15 which requires strict control of the alloy components and multi-step preparation processes. The downside is that the improvement of the strength–ductility was still limited, as the simple combination of the two types of phases leads to no progress in the strain-hardening mechanism.
Herein, we attempt to design precipitates with both coherent and incoherent features via a neoteric deformation-driven metallurgy (DDM) method based on a 2195 Al–Cu–Li alloy with typical multi-step metastable phase transitions. A significant enhancement in local strain rate was introduced to induce numerous dislocations, which could provide more diffusion paths for alloy elements, especially the element Li. Thus, the specific coherent metastable microstructure can be obtained by tailoring the precipitation process of the original T1 phases. A new strain-hardening mechanism may emerge, giving a unique insight into the strength–ductility balance of the alloys.
2. Results
2.1 Tensile properties of the strength–ductility alloys
We conduct tensile tests to characterize the mechanical performances of the prepared strength–ductility 2195 aluminum alloys (DDMed 2195 aluminum alloys) in Fig. 2. Commercial 2195 aluminum alloy and 1060 pure aluminum were taken as control groups, and the sizes of the tensile specimens were kept the same to minish the size effect. The ultimate tensile strength of the DDMed 2195 aluminum alloy reached 620 ± 18 MPa and maintained a high elongation of about 22.3 ± 2.2%, which was about twice that of the commercial 2195 aluminum alloy and equivalent to that of pure aluminum. Apparently, the DDMed 2195 aluminum alloy showed excellent strength–ductility synergy. Different from the commercial 2195 aluminum alloy, deep dimples were found at the fracture surface of the DDMed 2195 aluminum alloy (Fig. 2B), further confirming great ductility.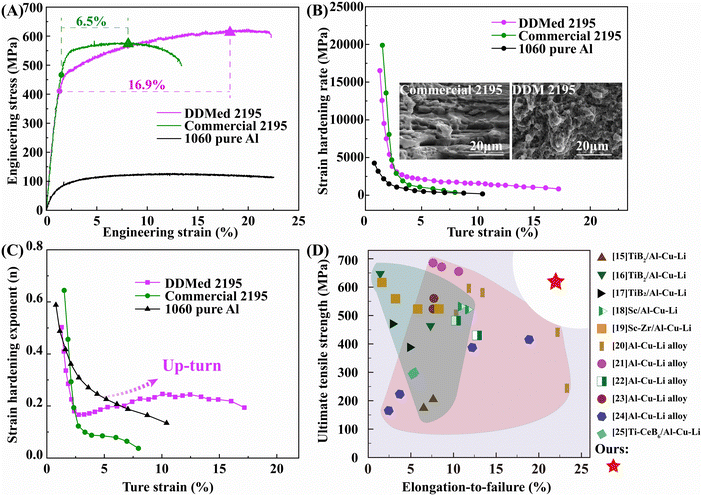 | ||
| Fig. 2 Tensile properties. (A) Engineering stress/strain curves. (B) Strain hardening rate vs. true strain curves and the typical fracture morphologies. (C) Strain hardening exponent vs. true strain curves. (D) Comparison of ultimate tensile strength vs. strain in the present work and the reported literature.18–28 | ||
Particularly notable is the uniform-elongation regime (removed the elastic strain from the uniform elongation), which represents the work-hardening capacity. The uniform-elongation regime of the DDMed 2195 aluminum alloy was about 16.9%, which was 1.6 times higher than that of the commercial 2195 aluminum alloy (6.5%), as depicted in Fig. 2. According to strain-hardening rate/exponent equations, the stress–strain curves were further processed.16,17 The related curves of strain-hardening rate/exponent changing with true strain are shown in Fig. 2B and C, respectively.
The strain-hardening rate of the DDMed 2195 aluminum alloy was higher than that of the commercial 2195 aluminum alloy and pure aluminum, as shown in Fig. 2B and C. During the strain process, the strain-hardening exponent of the DDMed 2195 aluminum alloy dropped at first, which was followed by a rapid up-turn (Fig. 2C). The typical instantaneous “up-turn” phenomenon reflected the strain-hardening capability of the DDMed 2195 aluminum alloy, whose strain-hardening exponent was 0.28, reaching 3.5 times that of the commercial 2195 aluminum alloy (0.08).
The excellent strain-hardening capability was the key factor that determined the strength–ductility synergy, which indicated that no stress concentrations occurred. This means that the dislocation density of the DDMed 2195 aluminum alloy can be increased uniformly and steadily during the plastic deformation. Fig. 2D summarizes the strength–ductility properties of 2195 aluminum alloys strengthened by rare earth/reinforcements (green part in Fig. 2D) or processed under various preparation methods/after-treatments (pink part in Fig. 2D). The ultimate tensile strength and elongation of the prepared 2195 aluminum alloys via DDM exhibited the highest strength–ductility synergy to our best knowledge.
2.2 Coherent–incoherent precipitates and fine grains
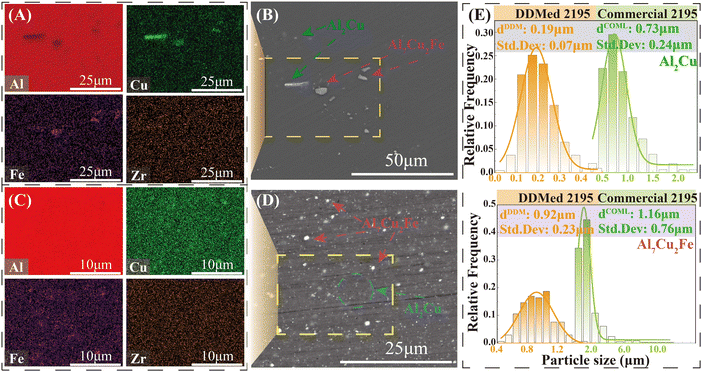
A scanning electron microscope (SEM) equipped with energy dispersive spectroscopy (EDS) was used to characterize the microstructures of the alloy. Some localize-distributed Al7Cu2Fe phases were found in commercial 2195 aluminum alloy (Fig. 3A and B), which were introduced by the nucleating agent in the 2195 aluminum alloy and confirmed as the impurity phase. Its average size was around 1.16 ± 0.76 μm with a large statistical standard deviation, which had a certain influence on the ductility. The Al7Cu2Fe phases with an average size of 0.92 ± 0.23 μm were also found in the DDMed 2195 aluminum alloy, which were broken and re-dispersed uniformly under severe plastic deformation. The DDM method modified the size and distribution of the Al7Cu2Fe impurity phases in 2195 aluminum alloys, improving tensile properties. More distribution information of the Al7Cu2Fe phase in commercial 2195 aluminum alloy and DDMed 2195 aluminum alloy is given in Fig. S1 and S2 in the ESI.†Except for a few coarse spherical/stick-shaped phases (Fig. 3B), the Al2Cu phases generally existed as a fine needle-shaped phase in the 2195 aluminum alloy,27,29 which was only visible via a transmission electron microscope (TEM). Contrastively, tested by backscattered electron imaging in the present investigation, the Al2Cu phases of the DDMed 2195 aluminum alloy were found to be dispersed with a high density. The average size of the Al2Cu phases was about 0.19 ± 0.07 μm, which was 74% smaller than that of the coarse Al2Cu phases in the commercial 2195 aluminum alloy (0.73 ± 0.24 μm). This phenomenon indicated that the DDM method had changed the precipitation behavior of the Al2Cu phase.
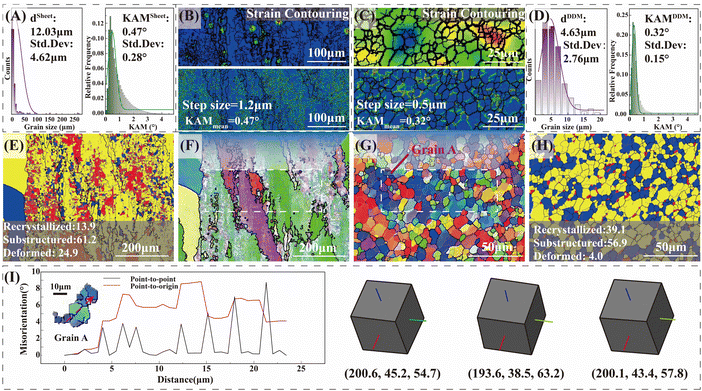
Further, the difference in the grain structure between commercial 2195 aluminum alloys and the DDM method was investigated using electron backscatter diffraction (EBSD). The grain structure of the commercial 2195 aluminum alloy had typical rolling characteristics, as shown in Fig. 4A, F and E. Lots of fine-equiaxed dynamic-recrystallized grains were distributed around the large elongated grains. The statistical average grain size was about 12.03 μm with a standard deviation of about 4.62 μm. The grains of the DDMed 2195 aluminum alloys were refined uniformly, undergoing dynamic recrystallization, whose average grain size was about 4.63 μm ± 2.76 μm. The proportion of the recrystallized grains was 39.1%, which was about 1.8 times higher than that of the commercial 2195 aluminum alloy. The grain structure or grain boundary characteristic also affects plastic deformation.30,31 Compared with the rolling grain structure, the recrystallized equiaxed grains were beneficial to ductility because the rolling grain structure has undergone a certain deformation in the rolling direction and lost the ability to deform further.
The kernel average misorientations (KAM) of the 2195 aluminum alloys were further analyzed, and the dislocation densities were estimated according to the dislocation density estimating equation.32 The KAM value of the commercial 2195 aluminum alloy at a step size of 1.2 μm was 0.47°, and the KAM value of the DDMed 2195 aluminum alloy was 0.32° at a step size of 0.5 μm. Calculated according to the dislocation density estimating equation,32 the dislocation density in the DDMed 2195 aluminum alloy was about 1.6 times that of the commercial 2195 aluminum alloy. Obviously, the DDMed 2195 aluminum alloy still retained considerable dislocation density even after the competition between dislocation consumption by dynamic recrystallization and dislocation generation by severe plastic deformation.
Besides, the average misorientation per grain was calculated and the value was assigned to each grain to make the stress contouring map shown in Fig. 4B and C. The stress condition between different grains was further analyzed. The stress inside the grain increased with the accumulation of misorientation per grain. The stress difference between grains of the DDMed 2195 aluminum alloy was small, and its stress distribution was relatively uniform, whose stress level was improved integrally compared with the commercial 2195 aluminum alloy (Fig. 4B and C).
The typical grain A in the DDMed 2195 aluminum alloy (Fig. 4G) was selected. The internal misorientation within grains was analyzed to further clarify the dynamic recrystallization characteristics. As shown in Fig. 4I, the misorientation angle within the grain gradually changed during the dynamic recrystallization process, as the rearrangement of dislocations induced the local lattice rotation. The specific feature was that more peaks of point-to-point misorientation profiles were generated within a short distance. Besides, the point-to-origin misorientation varied between approximately 1° and 9° and did not accumulate across the grain. A typical multi-peak distribution (red line in Fig. 4I) was presented, which was attributed to the intragranular-distributed substructure. That is, the tendency of strain-induced substructure formation during the preparation process was enhanced, while the effect of dynamic recovery was relatively weakened. Such a phenomenon further clarified the typical characteristics of the DDM method with a high instantaneous plastic strain rate and its dominant continuous dynamic recrystallization mode. More EBSD data are given in Fig. S3 and S4 (in the ESI†).
The precipitate and dislocation distribution were characterized by the transmission electron microscope (TEM) test, as exhibited in Fig. 5. Combined with the EDS test (Fig. 5G) and diffraction spot patterns (Fig. 6D and F), the spherical phase (in the yellow dotted line circles) was identified as the Al2Cu phase, and the phase within the green dotted line circles was the Al7Cu2Fe phase. The nano-sized spherical phase in the red dashed box may be the Al3Zr or the Al3Li phase, as the two phases have a similar lattice structure. Tested by using a high-resolution transmission electron microscope (HR-TEM), the selected nanophase was determined to be Al3Zr. As reported, the Li level was lowered in the 2195 aluminum alloy to inhibit the formation of δ′ (Al3Li).13 Therefore, the Al3Zr should be the main nano-sized spherical phase in the present research. The detailed crystallographic information of the phases is given in Table S2 in the ESI.† The interaction (Fig. 5B) between the Al3Zr and the dislocations was observed, where dislocations accumulated around the Al3Zr phase or bowed out between the Al3Zr phases. The average size of the Al3Zr phase was about 0.04 μm, together with the Al2Cu phase and the Al7Cu2Fe phase, which formed the three-scale multilevel precipitate structure. An inverse fast Fourier transform (IFFT) of the HR-TEM map was taken at the interface between the Al3Zr phase and the Al matrix (Fig. 5F). Only a slight distortion occurred at the interface without dislocations. Geometric phase analysis (GPA) was carried out in this region (Fig. 5F) further. The normal or shear strain at the Al3Zr/matrix interface was low (Fig. 5D), whose strain value was similar to that of the matrix. That is, the coherent relationship between the Al3Zr phase and the matrix was excellent without interfacial strain. Fine coherent Al3Zr phases within the grain were beneficial to promoting the strength–ductility synergy.
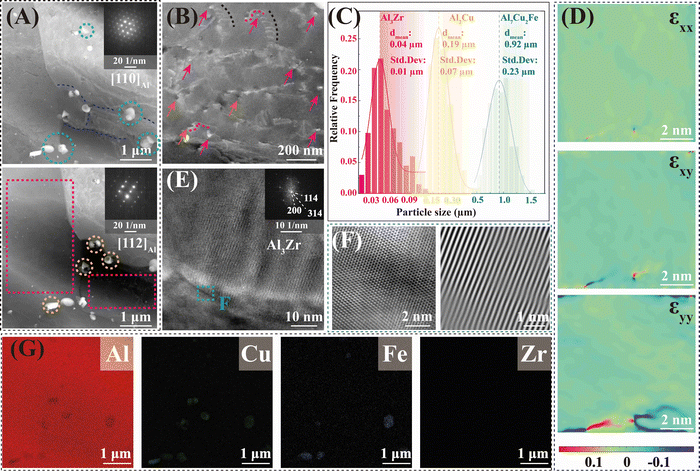 | ||
| Fig. 5 The TEM characterization of precipitates in the DDMed 2195 aluminum alloy. (A) Two different bright field images of the same place in the DDMed 2195 aluminum alloy taken along the [110]Al and [112]Al zone axes, respectively. (B) The interaction between the Al3Zr/Al3Li phases and the dislocations. (C) Size statistical map of different precipitates. (D) The normal or shear strain of Fig. 5E. (E) HR-TEM image of Al3Zr phases. (F) HR-TEM image and the IFFT pattern of the Al3Zr/Al interface. (G) The EDS map corresponding to the bright field images. | ||
As depicted in Fig. 5A, two bright field images of the same place in the DDMed 2195 aluminum alloy were taken along the [110]Al and [112]Al zone axes, respectively. Apparently, no typical T1 needle-like phases (Al2CuLi) were observed. A similar phenomenon has been reported a lot that the T1 needle-like phases and θ′(Al2Cu) phases in 2195 aluminum alloys were re-dissolved into the matrix under severe plastic deformation.33,34 However, the Al2Cu phase still existed at a high density (Fig. 3), and only the T1 (Al2CuLi) phases were missing in the present investigation. It can be speculated that the Li elements may present in the matrix in a new form under the effect of a high local strain rate.
3. Discussion
3.1 Microstructural evolution
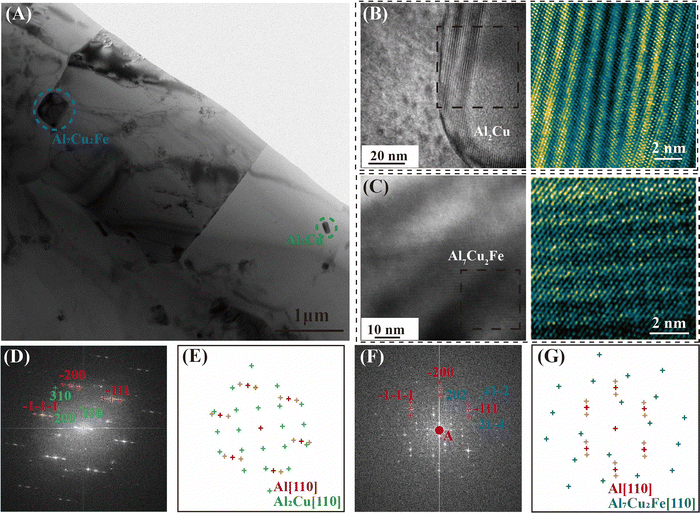
The typical Al7Cu2Fe phase, as well as Al2Cu phases shown in Fig. 6A, was selected to investigate their phase/matrix interface morphology via HR-TEM. Selected-area electron diffraction (SAED) was also conducted to characterize the phase structure. Wave-like stripes with a certain thickness appeared at the interface between the two phases with their matrix, showing an irregular-coated structure. Such wave-like stripes looked the same as the HR-TEM image of the long period stacking ordered structure, which usually formed in materials with low stacking fault energy.35 Pairs of symmetrical satellite diffraction spot patterns were also found around the main diffraction spot of the Al (Fig. 6D and F). These phenomena were usually caused by the solid solution atoms, which in turn caused small fluctuations in the interplanar spacing of the matrix. Such fluctuation of interplanar spacing, as reflected in the diffraction spot pattern, would induce the formation of satellite diffraction spots around the main diffraction spot (Fig. 6D and F). The diffraction spots changing at the phase/Al interface are shown in Videos S1 and S2 in the ESI.† Similar results were reported in Al–Ag or Al–Cu–Li alloys.13,36 Juan Ma et al. found that the satellite diffraction spots were formed, caused by the ordering solid solute of Li forming Guinier Preston-Li zones.13 Zenji Horita et al. reported that the ordered Zn-rich η-zones were formed with the satellite diffraction spots around the main diffraction spot.36Furthermore, except for the satellite spots, superlattice spots (diffraction spots around the main diffraction spot A in Fig. 6F) were also observed simultaneously at the Al7Cu2Fe/Al interface, which was a typical L12-type ordered structure in metals with a FCC structure. It was supposed to be the Al3Li type ordered structure, as one of the four typical L12-type phases, which was reported to be observed in the friction stir welded nugget zone in the 2195 aluminum alloy.13,33,37,38
In the present investigation, considering the disappearance of the typical T1 phase in the 2195 aluminum alloy, it was highly likely that the Li elements were ordered solid solution in the Al matrix and induced the formation of the satellite diffraction spot patterns. To further clarify the key role of Li, specially designed supplemented experiments (Fig. S5 in the ESI†) were conducted. Al–Cu series aluminum alloys with/without Li were chosen. Such two sheets were placed together and underwent the friction stir process39 under the same condition. The detailed results are depicted in Fig. S5 (ESI†). Only in the Al–Cu–Li alloy, the matrix with ordered solid solution was found with satellite diffraction spot patterns. The long period stacking ordered structure was also formed, which utilized the ordered solid solution matrix as the precursor. The LPSO structure was not formed in the present DDM process instead of the Al2Cu phases, which may be caused by the difference in processing method. However, one thing that can be confirmed was that Li played a key role in the whole phase transformation process, which was ordered-solid dissolved in the matrix. Furthermore, contrast changes (corresponding to the coherent or incoherent part) were found in the single precipitate. These types of coherent–incoherent precipitates were a lot in Fig. S5 and S6. This means that the formation of such precipitates was not an accidental phenomenon and widely occurred.
As depicted in Fig. 6D–G, a certain interfacial relationship between Al2Cu/Al7Cu2Fe phases and the Al matrix existed, which can be measured by the disregistry. The disregistries δ for the phase interface orientation relationships were evaluated according to the Bramfitt modified equation:40
 | (1) |
The calculated results are shown in Table S3 (ESI†). The Al2Cu/Al interface was incoherent (δ > 15%) with large interfacial energy, as well as the Al7Cu2Fe/Al interface.
Based on the above analysis, the evolution of the coherent–incoherent structure of the Li-rich coherent shell irregular-coated Al2Cu/Al7Cu2Fe precipitate can be presumed as the following steps: (a) Li, alloying elements, were all solid-dissolved in the matrix, forming a supersaturated solid solution; (b) as solid phase sintering proceeded via DDM, the ordering process took place in the 2195 aluminum alloy through the diffusion of Li. In this step, only the short-range diffusion of Li was required, which was kinetically preferable; (c) then, the Al2Cu and Al7Cu2Fe phases preferred to precipitate on the pre-formed ordering structure, as the activation energy barrier of the precipitate was lowered, namely precursor-dominated nucleation mechanism.41
3.2 Strength–ductility synergy mechanism
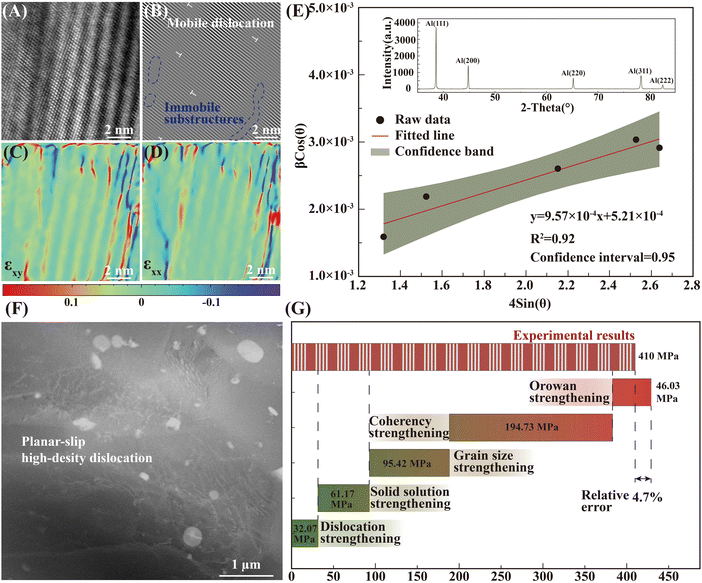
GPA was further conducted to investigate the normal strain and shear strain distribution of the shell structure along with the HR-TEM test. An incoherent precipitate (Al2Cu & Al7Cu2Fe) irregular-coated by a coherent shell structure was observed, which was the key to the excellent strength–ductility synergy of the prepared 2195 aluminum alloy. Wave-like strain stripes with the content of solid solution Li were observed (strain contrast) at the precipitate/phase interface, which induced the short-range stress in this region (Fig. 7A, C and D). As the stacking fault of the ordering structure was low, dissociation of perfect dislocations onto partial dislocations was easily promoted.35,42 Thus, different from the common climb or cross-slip of dislocations in Al alloys (with high stacking fault energy), the planar slip was activated during the plastic strain. Except for the coherent structure, the dislocations gliding in planar mode could also cut through the pre-existing dislocations (Fig. 7B, mobile dislocations). Thus, the mean free path for dislocation movements was expanded further even with the high-density pre-existing dislocations. The ductility of the prepared alloy was thus increased as the plastic strain was proportional to the moving distance of the mobile dislocations.10 As shown in Fig. 7F, different from the typical cell structure caused by dislocation cross-slipping,43–45 the observed high-density dislocations appeared to be parallel or grid-like, which was the typical planar slip characteristic.However, once the planner slip was activated, the leading dislocations would destroy the local structure and lower the energy barrier. The local cutting stress was decreased, and thus, the following dislocations would glide on the same plane with faster slip velocity, namely, “glide plane softening”.10,11,46 During the subsequent plastic deformation, the dislocations in the activated plane would be rapidly saturated and restricted to such an isolated glide plane. The strain concentrations would be increased around the grain boundary, inducing crack initiation and accelerating material failure. The strain-hardening capability of the materials was thus destroyed. Apparently, the lacking of the local cutting stress would influence the dislocation movement.10
In the present research, with the incoherent structure inside the prepared phase, long-range elastic interactions were induced, which timely offset the decrease of local cutting stress. The “glide plane softening” was avoided. The dislocations did not accumulate and saturate rapidly in a single slip plane. Also, lots of immobile substructures (Fig. 7B) were formed after cutting by the dislocations, which exhibited a resistance to further cutting, too. The speculation of dislocation and coherent–incoherent precipitate interaction process is given in ESI† (Fig. S7), which was a unique strain-hardening process that also required further observation and verification. As shown in Fig. 7F, the dislocation density in grains could be increased uniformly with increasing strain, which was reflected as the continuous work-hardening part in the tensile property curves (Fig. 2). Obviously, the “coherent–incoherent” structure was complementary, which promoted the uniform and dynamic increase of the dislocation density with plastic deformation.
Based on various strengthening models, the strengthening mechanism in the material was further quantitatively analyzed, and the strengthening contributions of each mechanism in the DDMed 2195 aluminum alloy were investigated. In addition to the precipitate in the alloy, a certain amount of alloying elements were still dissolved in the matrix to play the role of solid solution strengthening. The effect of Ag on the solid solution strengthening was negligible due to the small difference in radius between Ag and Al atoms.47 The strengthening effect of solid solution of Li in the matrix was calculated according to other strengthening models. Therefore, among the main alloying elements, only the solid solution strengthening effect of Mg and Cu was considered. A part of Cu element was dissolved in the matrix, and another part of Cu element was precipitated to form the strengthening phase. The concentration of Cu in the solid solution can be estimated using the lever rule:48
 | (2) |
 | (3) |
 | (4) |
The solid solution strengthening caused by the elements dissolved in the matrix was calculated from eqn (5):47
 | (5) |
The contribution of the dislocation was calculated by eqn (9). Based on the XRD data in Fig. 7E, the crystallite size (D) and microstrain (ε) are calculated from eqn (6) and (7).
 | (6) |
| βhkl = (βhkl2M − βhkl2ln)0.5 | (7) |
 | (8) |
| σ = MαGbρ0.5 | (9) |
![[thin space (1/6-em)]](https://www.rsc.org/images/entities/char_2009.gif) M and βhkl
M and βhkl![[thin space (1/6-em)]](https://www.rsc.org/images/entities/char_2009.gif) ln represent the observed and instrumental peak broadening, respectively. The dislocation density was calculated from eqn (9), namely, the Williamson–Hall method. M = 3.06 is the Taylor factor, and G = 25.4 GPa is the shear modulus of the Al alloy. b is the Burger vector, taken as 0.286 nm for aluminum.
ln represent the observed and instrumental peak broadening, respectively. The dislocation density was calculated from eqn (9), namely, the Williamson–Hall method. M = 3.06 is the Taylor factor, and G = 25.4 GPa is the shear modulus of the Al alloy. b is the Burger vector, taken as 0.286 nm for aluminum.
The value of the grain size strengthening was estimated by the Hall–Petch relationship viaeqn (10):53
 | (10) |
The internal coherency stress field induced by the Li-rich coherent shell was considered.54 Long-range elastic stress caused by the core-incoherent phase was evaluated by the Orowan strengthening theory (15).32 And it is assumed that the strengthening effect of the core and shell structure in the present research can be linearly superimposed. The volume fraction of the precipitate was calculated by formula (4). The average diameter of the precipitate was evaluated according to the SEM and TEM figures statistically. The spacing of the precipitate was calculated viaeqn (11).49
 | (11) |
 | (12) |
The coherency strengthening caused by strain-field interactions between a coherent precipitate and a dislocation was evaluated viaeqn (13)55 and eqn (14):56,57
 | (13) |
 | (14) |
The calculation results of the overall strengthening mechanisms are shown in Fig. 7G, and the calculated values matched the measured values well with a relative error of about only 4.7%. The strengthening effect of the core–shell structure (simplified: linear superposition of Orowan and coherent strengthening) accounted for about 56.07% of the overall yield strength, which played a dominant role in the entire strengthening system. Obviously, the precipitate with the core–shell structure prepared by the DDM method, in which an incoherent precipitate (Al2Cu & Al7Cu2Fe) was coated by a coherent shell structure, determined the excellent strength–ductility synergy of the material.
In summary, the high local strain rate provided by the solid-phase DDM method could change the formation of the T1 phase in the 2195 aluminum alloy, and promote the diffusion of Li. An incoherent precipitate (Al2Cu & Al7Cu2Fe) irregular-coated by a coherent shell structure was finally achieved, activating a new strength–ductility synergy mechanism induced by the “coherent–incoherent” structure. This effective strategy to design the novel “coherent–incoherent” microstructure of the 2195 aluminum alloy was provided, which was believed to be promoted in other heat-treatable alloy systems, especially with multi-step metastable phase transitions.
4. Conclusions
We demonstrate an effective strategy to achieve desirable strength–ductility synergy alloys. An incoherent-core phase structure irregular-coated by a coherent Li-rich shell was achieved. The specific microstructural evolution and strength–ductility synergy mechanism were revealed as follows:(1) The high local strain rate facilitated the diffusion of Li, and promoted the formation of a coherent shell structure. The original T1 (Al2CuLi) phases in 2195 aluminum alloys were transformed into coherent-shell (Li-rich) irregular-coated incoherent-core (Al2Cu) precipitates.
(2) The coherent shell structure activated the planar slip and expanded the mean free path for dislocation movement to increase ductility. Simultaneously, the long-range stress field caused by the incoherent precipitates strengthened the local cutting stress to avoid the dislocation overly accumulation timely. The strength–ductility trade-off was balanced well.
(3) The strengthening effect of the coherent–incoherent structure accounted for about 56.07% of the overall yield strength, which played a dominant role in the entire behavior. The ultimate tensile strength and elongation were 620 ± 18 MPa and 22.3 ± 2.2%, respectively, exhibiting the highest strength–ductility synergy to our best knowledge.
An effective strategy to design the coherent–incoherent microstructures of 2195 aluminum alloys towards superior strength–ductility synergy was provided, which was believed to be promoted in other heat-treatable alloy systems, especially with multi-step metastable phase transitions.
5. Experimental details
5.1 Materials and preparation process
The chemical composition (in wt%) of spherical 2195 aluminum powder is composed of 3.99 Cu, 1.09 Li, 0.38 Mg, 0.42 Ag, 0.1 Zr, 0.17 Fe, and balance Al (Table S1, ESI†). The 2195 aluminum alloy powder was pre-compacted at 200 MPa for 60 s by using a cold tubular mold. Then, the round preform was further processed in the Al mold by a processing tool for 30 s with a rotational velocity of 600 rpm. The compaction ratio was set as about 2![[thin space (1/6-em)]](https://www.rsc.org/images/entities/char_2009.gif) :
:![[thin space (1/6-em)]](https://www.rsc.org/images/entities/char_2009.gif) 1. A disc sample with a thickness of 1 mm and a diameter of 16 mm can be prepared at one time. The detailed preparation process is shown in Fig. S8 (ESI†). The temperature–time curve during the process was tested by using an SH-32XL multi-channel temperature recorder setting the thermocouple against the Al mold inner wall (Fig. S8, ESI†).
1. A disc sample with a thickness of 1 mm and a diameter of 16 mm can be prepared at one time. The detailed preparation process is shown in Fig. S8 (ESI†). The temperature–time curve during the process was tested by using an SH-32XL multi-channel temperature recorder setting the thermocouple against the Al mold inner wall (Fig. S8, ESI†).
As depicted from the temperature–time curve, a peak temperature of 333 °C occurred after pressing for 21 s, which was about half of the melting point of aluminum alloy. During the dwelling process (which lasted for 30 s), the temperature curve had a temperature platform (red line in the temperature–time curve) with a small drop (about 31 °C). It could be speculated that the alloy powder sintering was nearly completed when the processing tool stopped pressing. The friction and plastic deformation between powders were weakened, and the heat at this stage mainly came from the friction between the tool surface and the alloy surface. That is, the whole sintering process was about 30 s or even less, and the sintering temperature was kept low. After stage III (temperature–time curve in Fig. S8, ESI†), the temperature dropped below 100 °C within the 30 s due to the excellent thermal conductivity of aluminum.
5.2 Characterization
A SEM equipped with attachments for EDS was used to characterize the alloy and fracture morphologies at a working voltage of 20 kV. EBSD was applied to determine the grain structure setting a step size of 0.2 μm. The EBSD specimen was polished by using a JEOL IB-09020CP cross-section polisher for 3.5 h. The raw EBSD data was further analyzed by using HKL Channel 5 software. The specimens were carefully polished by hand using 5000 grit sandpaper to less than 50 μm. The specimen for TEM was ion-milled by using a GATAN695 Precision ion polishing system. To characterize the phase structure, a HR-TEM was chosen with a working voltage of 200 kV. Open-source Strain++ software was used to measure strains in HR-TEM micrographs, called the GPA method.58 For all GPA analyses, the selected diffraction spots we used are given in the ESI† (Fig. S9). XRD was utilized to determine the alloy phase composition and dislocation density. The XRD scanning range was set from 30° to 90° using a Cu Kα (λ = 0.1541 nm). The tensile properties of the samples were tested three times for each parameter by using an Instron 5569 tester with a strain rate of 3.3 × 10⁻⁴ s−1 at room temperature. The geometry of the tensile samples was given in our previous research.59,60 The dimensions of the tested samples were 14 × 5 mm × 1 mm.Author contributions
Conceptualization: Dongxin Mao, Yongxian Huang; methodology: Dongxin Mao, Yuming Xie, Xiangchen Meng, Zeyu Zhang, Xiuwen Sun, Long Wan, Korzhyk Volodymyr; investigation: Dongxin Mao, Yuming Xie, Xiaotian Ma; visualization: Dongxin Mao, Yuming Xie, Xiangchen Meng, Xiaotian Ma; supervision: Yongxian Huang; writing—original draft: Dongxin Mao; writing—review & editing: Dongxin Mao, Yuming Xie, Xiangchen Meng, Xiaotian Ma, Zeyu Zhang, Long Wan, Korzhyk Volodymyr.Conflicts of interest
The authors declare that they have no known competing financial interests or personal relationships that could have appeared to influence the work reported in this paper.Acknowledgements
The work was supported by the National Natural Science Foundation of China (No. 52175301, 52205350, 52305345).References
- Z. C. Sims, O. R. Rios, D. Weiss, P. E. A. Turchi, A. Perron, J. R. I. Lee, T. T. Li, J. A. Hammons, M. Bagge-Hansen, T. M. Willey, K. An, Y. Chen, A. H. King and S. K. McCall, Mater. Horizons, 2017, 4, 1070–1078 RSC.
- Y. Hu, Mater. Horizons, 2021, 8, 885–911 RSC.
- J. Li, B. Xie, L. Li, B. Liu, Y. Liu, D. Shaysultanov, Q. Fang, N. Stepanov and P. K. Liaw, Mater. Horizons, 2022, 9, 1518–1525 RSC.
- Y. Zhu, M. Zhou, Y. Geng, S. Zhang, T. Xin, G. Chen, Y. Zhou, X. Zhou, R. Wu and Q. Shi, J. Mater. Sci. Technol., 2024, 184, 245–255 CrossRef.
- Z. An, S. Mao, T. Yang, C. T. Liu, B. Zhang, E. Ma, H. Zhou, Z. Zhang, L. Wang and X. Han, Mater. Horizons, 2021, 8, 948–955 RSC.
- L. Liu, Q. Ding, Y. Zhong, J. Zou, J. Wu, Y.-L. Chiu, J. Li, Z. Zhang, Q. Yu and Z. Shen, Mater. Today, 2018, 21, 354–361 CrossRef CAS.
- E. Ma and T. Zhu, Mater. Today, 2017, 20, 323–331 CrossRef CAS.
- C. X. Huang, Y. F. Wang, X. L. Ma, S. Yin, H. W. Höppel, M. Göken, X. L. Wu, H. J. Gao and Y. T. Zhu, Mater. Today, 2018, 21, 713–719 CrossRef CAS.
- K. Lu, L. Lu and S. Suresh, Science, 2009, 324, 349–352 CrossRef CAS PubMed.
- S. H. Jiang, X. Q. Xu, W. Li, B. Peng, Y. Wu, X. J. Liu, H. Wang, X. Z. Wang and Z. P. Lu, Acta Mater., 2021, 213, 116984 CrossRef CAS.
- R. Zhang, S. Zhao, J. Ding, Y. Chong, T. Jia, C. Ophus, M. Asta, R. O. Ritchie and A. M. Minor, Nature, 2020, 581, 283–287 CrossRef CAS PubMed.
- X. H. An, S. D. Wu, Z. G. Wang and Z. F. Zhang, Prog. Mater. Sci., 2019, 101, 1–45 CrossRef CAS.
- J. Ma, X. Liu, D. Yan and L. Rong, Acta Mater., 2023, 243, 118442 CrossRef CAS.
- F. Guo, W. Huang, X. Yang, H. Dong, H. Yu, Q. Chen, L. Hu and L. Jiang, J. Mater. Sci. Technol., 2022, 110, 198–209 CrossRef CAS.
- S. Cheng, Y. H. Zhao, Y. T. Zhu and E. Ma, Acta Mater., 2007, 55, 5822–5832 CrossRef CAS.
- Z. Li, Y. Zhang, Z. Zhang, Y.-T. Cui, Q. Guo, P. Liu, S. Jin, G. Sha, K. Ding, Z. Li, T. Fan, H. M. Urbassek, Q. Yu, T. Zhu, D. Zhang and Y. M. Wang, Nat. Commun., 2022, 13, 5581 CrossRef CAS PubMed.
- M. Yang, Y. Pan, F. Yuan, Y. Zhu and X. Wu, Mater. Res. Lett., 2016, 4, 145–151 CrossRef CAS.
- Z. Xie, R. Jiang, X. Li, L. Zhang, A. Li and Z. He, Ultrason. Sonochem., 2022, 90, 106203 CrossRef CAS PubMed.
- B. Zhao, Q. Yang, L. Wu, X. Li, M. Wang and H. Wang, Mater. Sci. Eng., A, 2019, 742, 573–583 CrossRef CAS.
- Y. Shen, X. Li, T. Hong, J. Geng and H. Wang, Mater. Sci. Eng., A, 2016, 655, 265–268 CrossRef CAS.
- L. Huang, J. Huang, W. Liu, L. Cao and S. Li, J. Alloys Compd., 2022, 927, 166860 CrossRef CAS.
- Y. Qi, H. Zhang, W. Zhang, Z. Hu and H. Zhu, Mater. Charact., 2023, 195, 112505 CrossRef CAS.
- B. Xie, L. Huang, J. Xu, H. Su, H. Zhang, Y. Xu, J. Li and Y. Wang, Mater. Sci. Eng., A, 2022, 832, 142394 CrossRef CAS.
- B. I. Rodgers and P. B. Prangnell, Acta Mater., 2016, 108, 55–67 CrossRef CAS.
- Y. Xie, Y. Deng, Y. Wang and X. Guo, J. Alloys Compd., 2020, 836, 155445 CrossRef CAS.
- P. Ma, L. Zhan, C. Liu, Q. Wang, H. Li, D. Liu and Z. Hu, J. Alloys Compd., 2019, 790, 8–19 CrossRef CAS.
- Q. Pu, Z. Jia, Y. Kong, Q. Yang, Z. Zhang, X. Fan, H. Zhang, L. Lin and Q. Liu, Mater. Sci. Eng., A, 2020, 784, 139337 CrossRef CAS.
- L. Xi, J. Xu, D. Gu, L. Feng, Q. Lu and K. G. Prashanth, Mater. Lett., 2023, 333, 133572 CrossRef CAS.
- Q. Liu, G. Fan, Z. Tan, Z. Li, D. Zhang, J. Wang and H. Zhang, Mater. Sci. Eng., A, 2021, 821, 141637 CrossRef CAS.
- L. Wang, Y. Zhang, Z. Zeng, H. Zhou, J. He, P. Liu, M. Chen, J. Han, D. J. Srolovitz, J. Teng, Y. Guo, G. Yang, D. Kong, E. Ma, Y. Hu, B. Yin, X. Huang, Z. Zhang, T. Zhu and X. Han, Science, 2022, 375, 1261–1265 CrossRef CAS PubMed.
- S. Sun, D. Li, C. Yang, L. Fu, D. Kong, Y. Lu, Y. Guo, D. Liu, P. Guan, Z. Zhang, J. Chen, W. Ming, L. Wang and X. Han, Phys. Rev. Lett., 2022, 128, 015701 CrossRef CAS PubMed.
- D. Mao, X. Meng, Y. Xie, Y. Chang, Z. Qin, S. Xu, L. Wan and Y. Huang, Sci. China Mater., 2023, 66, 1649–1658 CrossRef CAS.
- L. Shi, X. Dai, C. Tian and C. Wu, Mater. Sci. Eng., A, 2022, 858, 144169 CrossRef CAS.
- Y. Tao, Z. Zhang, P. Xue, D. R. Ni, B. L. Xiao and Z. Y. Ma, J. Mater. Sci. Technol., 2022, 123, 92–112 CrossRef CAS.
- K. Guan, D. Egusa and E. Abe, J. Magnes. Alloy., 2022, 10, 1573–1580 CrossRef CAS.
- Z. Horita, K. Ohashi, T. Fujita, K. Kaneko and T. G. Langdon, Adv. Mater., 2005, 17, 1599–1602 CrossRef CAS.
- T. Yang, B. X. Cao, T. L. Zhang, Y. L. Zhao, W. H. Liu, H. J. Kong, J. H. Luan, J. J. Kai, W. Kuo and C. T. Liu, Mater. Today, 2022, 52, 161–174 CrossRef CAS.
- J.-Q. Su, T. Nelson, R. Mishra and M. Mahoney, Acta Mater., 2003, 51, 713–729 CrossRef CAS.
- J. Li, Y. Li, F. Wang, X. Meng, L. Wan, Z. Dong and Y. Huang, Mater. Sci. Eng., A, 2020, 792, 139755 CrossRef CAS.
- X. Li, Z. Zhang, Y. Wang, Y. Peng, D. Yan, Z. Tan, Q. Zhou and K. Wang, Sci. Technol. Weld. Join., 2022, 27, 664–671 CrossRef CAS.
- M. R. Gazizov, A. N. Belyakov, R. Holmestad, M. Y. Gazizova, V. S. Krasnikov, P. A. Bezborodova and R. O. Kaibyshev, Acta Mater., 2023, 243, 118534 CrossRef CAS.
- L. Wang, J. Ding, S. Chen, K. Jin, Q. Zhang, J. Cui, B. Wang, B. Chen, T. Li, Y. Ren, S. Zheng, K. Ming, W. Lu, J. Hou, G. Sha, J. Liang, L. Wang, Y. Xue and E. Ma, Nat. Mater., 2023, 22, 950–957 CrossRef CAS PubMed.
- D. Mao, X. Meng, Y. Xie, Y. Yang, Y. Xu, Z. Qin, Y. Chang, L. Wan and Y. Huang, J. Alloys Compd., 2022, 891, 162078 CrossRef CAS.
- N. A. Koneva, V. A. Starenchenko, D. V. Lychagin, L. I. Trishkina, N. A. Popova and E. V. Kozlov, Mater. Sci. Eng., A, 2008, 483–484, 179–183 CrossRef.
- F. He, C. Wang, B. Han, G. Yeli, X. Lin, Z. Wang, L. Wang and J. Kai, Int. J. Plast., 2022, 156, 103346 CrossRef CAS.
- R. Niu, X. An, L. Li, Z. Zhang, Y.-W. Mai and X. Liao, Acta Mater., 2022, 223, 117460 CrossRef CAS.
- J. Wang, Z. Liu, S. Bai, J. Cao, J. Zhao, L. Luo and J. Li, Mater. Sci. Eng., A, 2021, 801, 140363 CrossRef CAS.
- M. Gazizov and R. Kaibyshev, Mater. Sci. Eng., A, 2017, 702, 29–40 CrossRef CAS.
- J. F. Nie and B. C. Muddle, Acta Mater., 2008, 56, 3490–3501 CrossRef CAS.
- W. Zhang, Z. Zhao, J. Fang, P. He, Z. Chao, D. Gong, G. Chen and L. Jiang, J. Alloys Compd., 2021, 857, 157601 CrossRef CAS.
- M. Zhang, J. Wang, B. Wang, C. Xue and X. Liu, Mater. Sci. Eng., A, 2022, 831, 142355 CrossRef CAS.
- T. S. Orlova, T. A. Latynina, M. Y. Murashkin, F. Chabanais, L. Rigutti and W. Lefebvre, J. Alloys Compd., 2021, 859, 157775 CrossRef CAS.
- T. Shanmugasundaram, M. Heilmaier, B. S. Murty and V. S. Sarma, Mater. Sci. Eng., A, 2010, 527, 7821–7825 CrossRef.
- M. Kato, T. Mori and L. H. Schwartz, Acta Metall., 1980, 28, 285–290 CrossRef CAS.
- H. Wen, T. D. Topping, D. Isheim, D. N. Seidman and E. J. Lavernia, Acta Mater., 2013, 61, 2769–2782 CrossRef CAS.
- S. D. Dahlgren, Metall. Trans. A, 1977, 8, 347–351 CrossRef.
- D. N. Seidman, E. A. Marquis and D. C. Dunand, Acta Mater., 2002, 50, 4021–4035 CrossRef CAS.
- M. J. Hÿtch, E. Snoeck and R. Kilaas, Ultramicroscopy, 1998, 74, 131–146 CrossRef.
- Y. Xie, X. Meng, Y. Huang, J. Li and J. Cao, Compos. Part B Eng., 2019, 177, 107413 CrossRef CAS.
- D. Mao, X. Ma, Y. Xie, X. Meng, N. Wang, Z. Zhang, X. Sun and Y. Huang, Composites, Part A, 2024, 182, 108174 CrossRef.
Footnotes |
| † Electronic supplementary information (ESI) available. See DOI: https://doi.org/10.1039/d4mh00139g |
| ‡ These authors contributed equally to this work. |
| This journal is © The Royal Society of Chemistry 2024 |

