Single cell proteomics analysis of drug response shows its potential as a drug discovery platform†
Juerg
Straubhaar‡§
a,
Alexandria
D’Souza‡¶
a,
Zachary
Niziolek
 b and
Bogdan
Budnik||
*c
aResearch Computing, FAS, Division of Science, Harvard University, Cambridge, MA02138, USA
bBauer Core, FAS, Division of Science, Harvard University, Cambridge, MA02138, USA
cMSPRL, FAS, Division of Science, Harvard University, Cambridge, MA02138, USA. E-mail: Bogdan.Budnik@wyss.harvard.edu
First published on 16th August 2023
Abstract
Single-cell analysis has clearly established itself in biology and biomedical fields as an invaluable tool that allows one to comprehensively understand the relationship between cells, including their types, states, transitions, trajectories, and spatial position. Scientific methods such as fluorescence labeling, nanoscale super-resolution microscopy, advances in single cell RNAseq and proteomics technologies, provide more detailed information about biological processes which were not evident with the analysis of bulk material. This new era of single-cell biology provides a better understanding of such complex biological systems as cancer, inflammation, immunity mechanism and aging processes, and opens the door into the field of drug response heterogeneity. The latest discoveries of cellular heterogeneity gives us a unique understanding of complex biological processes, such as disease mechanism, and will lead to new strategies for better and personalized treatment strategies. Recently, single-cell proteomics techniques that allow quantification of thousands of proteins from single mammalian cells have been introduced. Here we present an improved single-cell mass spectrometry-based proteomics platform called SCREEN (Single Cell pRotEomE aNalysis) for deep and high-throughput single-cell proteome coverage with high efficiency, less turnaround time and with an improved ability for protein quantitation across more cells than previously achieved. We applied this new platform to analyze the single-cell proteomic landscape under different drug treatment over time to uncover heterogeneity in cancer cell response, which for the first time, to our knowledge, has been achieved by mass spectrometry based analytical methods. We discuss challenges in single-cell proteomics, future improvements and general trends with the goal to encourage forthcoming technical developments.
Background
All organs consist of many different cell types. The discovery of heterogeneity in individual cells, even from the same population, establishes the need for single-cell analysis (SCA) to improve our understanding of rare cellular events that may alter biological functions. SCA allows insights into cellular events in disease progression such as cancer, autoimmune disorders, allergic reactions, neuro degeneration processes, inflammation and also can shed light on mechanisms behind drug resistance.Many analytical tools have become available in the last decade to study multiple biomarkers from DNA, RNA, proteins, and their correlations.1,2 Transcriptomics and confocal microscopy are established techniques at the single-cell level, but single-cell RNAseq is probably the best amongst these methods, producing unique and powerful biological insights from complex biological systems and revealing cell heterogeneity invisible to bulk analytical methods. Recently mass cytometry techniques (Fluidigm, Cy-TOF) as well as spectral flow cytometry (Cytek, Aurora) were introduced to measure up to 62 proteins from a single cell with good precision and high throughput.3,4 However, the cost to run these experiments can be prohibitive, especially given the limited number of proteins that can be measured and its strong dependence on the existence of specific antibodies. Currently, liquid chromatography tandem mass spectrometry (LC-MS/MS) is the most promising method that can allow quantification of more than a thousand protein abundances in a single cell at proteome wide level.5 There are many technical challenges to this workflow, which includes challenges in sample preparation, mass spectrometry (MS) acquisition strategies and data analysis, where each plays a vital role in the successful quantification of proteins in a single cell. An original technique developed by us and others, SCoPE MS, allowed quantification of large numbers of proteins, but required a substantial amount of MS time and had a lot of missing data over the analytical domain.5,6
Here we detail a new platform, SCREEN, that improves upon the original SCoPE MS technique which had pioneered our ability to measure thousands of proteins in quantitative mode across many hundreds of single mammalian cells.6,7 This new platform, compared to the original, can quantify many more proteins per cell and is more sensitive to changes in protein abundance in single cells. In addition to providing much deeper proteome coverage, SCREEN also targets specific parts of the proteome, such as transcription factors, that represent low abundance proteins, in order to detect subtle differences in the proteome of cells upon different treatment conditions. This was not possible with the original SCoPE MS.
Results
The first step that significantly improved single cell proteome analysis is the recently developed cell disruption technique called mPOP (minimal ProteOmics Preparation), which uses a physical rather than a chemical cell lysis protocol.8 To improve the procedure further we employed an automated sample preparation protocol based on a 96 well plate format using a Mantis™ (Formulatrix, MA) robot in which the sample preparation procedure was performed in low volume of buffer with much higher reproducibility than could have been achieved by the previous operator-based preparation technique. Eppendorf 96 well plates (Microplate 96/V, wells clear, RecoverMax® well design, PCR clean, Eppendorf, Germany), were used for all preparations. Plates are washed with 50% acetonitrile, 5 μl (microliter) in each well for 5 min, then all liquid is shaken off, subsequently 1 μl of water is deposited by Mantis in each well in preparation for FACS (fluorescence-activated cell sorting) sorting. After FACS sorting the cells in 3 nl of PBS buffer (phosphate-buffered saline, pH 7.4, Thermo-Fisher, CA) the droplets go into 1 μl of 18 MΩ dd H2O, the cells are burst by mPOP method as previously described,8 followed by 3 hours trypsin Gold™ (Promega, WI) digestion, TMT™ (Tandem Mass Tag, Thermo-Fisher, Germany) labeling and quenching procedures in a total volume of 1 μl. All procedures are completed in a fully automated manner by the Mantis robot (Fig. 1).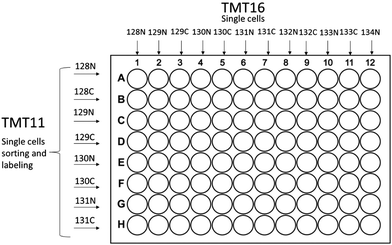 | ||
| Fig. 1 Sorting and labeling schemes for single-cell experiments based on 96 well plate format for both TMT11plex and TMT16plex PRO are shown. | ||
Buffers with single cell labeled peptides are first transferred into a glass vial (Thermo, CA) starting with 1 μl of the carrier channel to passivate the glass surface and then all of single cell material is added to the vial. The final volume for MS injection is typically 10 microliters.
The original SCoPE MS method had a fundamental limitation in the number of cells that can be analyzed as well as the number of proteins that can be detected across all the cells in a given study. There are two fundamental challenges to a successful study where cell heterogeneity are the protein level must be resolved – depth of the proteome coverage and the consistency of protein abundance measurements across all studied cells. These two factors determine the amount of protein that can be used for the final analysis. The amount of carrier channel is usually around 100 cells, which typically provides several hundred proteins that can be detected across all cells in the study. Several techniques like DO-MS9 and DART ID10 were developed to overcome these issues and increase the total number of proteins that were consistently detected in such studies. We believe that a greater number of cells in the carrier channel can serve to improve the stability of large number of protein detection across all cells in a given study. A direct increase in the carrier channel shows that after about 200 cells the original SCoPE technique starts losing peptide identification rates and shows a decrease in the total amount of proteins that had been detected across the study due to high peaks of TMT label from the carrier channel. To overcome this issue, we proposed to move the carrier proteome labeling channel from the 131 position to the 126 position and to remove this peak from MS2 spectra detection to improve spectra quality and create an environment where more MS2 spectra can be identified across many more single cells. To implement this feature, we simply acquire all MS2 spectra with a QE HF-X Orbitrap instrument starting from fixed mass of 126.5 m/z. This type of acquisition allows us to detect all channels except the carrier channel itself. While the MS2 acquisition starts at 126.5 Th, that does not physically remove or filter out the TMT126 ions that are transported to the orbitrap analyzer. Reporter ions from the single cell channels can be impacted by these large numbers of TMT126 peak in MS2 spectra. Overfilling the C-trap with fragment ions from the bulk carrier leads to this loss in MS2 sampling. C-Trap is designed to fill up with fragment ions over a maximum time of 200 ms, but quickly fills with fragment ions from bulk carriers, including TMT126 ions, which under samples all other fragment ions from single cells. Our “not-detecting” of actually 126 m/z resulted in the single main peak no longer being present in the spectra, resulting in a lower noise level, which enabled more fragments to be identified to provide more confident peptide identification compared to the spectra that detected TMT126. It is also important to consider the amount of carrier channels. It follows that the carrier channel has negative effects on S/N and sensitivity after about 200 cells. With 300% AGC, we were able to observe more single cell fragment ions, improving the MS2 spectral data quality. Because we detect 127N and 127C channels in each MS2 spectra we always have an indication of how much carrier channel isotopic impurity has leaked into 127C channel and we always have 127N channel as our internal “true empty” channel to detect the noise level of each mass spectrometry run. If 127N and 127C are not of interest to monitor carrier channel leakage and have an empty channel data for true noise estimation, then all MS2 spectra can be started from 127.5 m/z to include only single cell channels. Currently all ions including carrier channel TMT (for SCREEN this is 126 channel) are transported into the orbitrap for detection, in some cases, since majority of ions are TMT126 ions, that could lead to fast filling of the orbitrap cell, depending upon the AGC (automatic gain control) settings that was set for the analysis. We are actively working with Thermo-Fisher on an update to the method acquisition where the carrier channel for TMT126 is completely removed by RF burst prior to injection to the orbitrap cell for spectra detection. Though we believe such injection of 126 ions can be performed in Orbitrap cell before each detection, the instrument vendor has not implemented this feature to our knowledge, so 126 ions are still being detected along with all other ions. The implementation of this feature by the instrument vendor will improve the ability of the instruments to obtain better MS2 spectra for low abundance proteins and to support further our efforts to explore the proteome of a single cell.
The new method of acquisition for HCD (Higher Energy Collisional Dissociation) MS2 spectra detection without the carrier channel is called SCoPE X (Single Cell ProtEomics eXclude carrier). This new method of detection with the same number of carrier channel (<100 cells) shows marginal increase in peptide identification with about 10% of the total amount of identified peptides but increasing the carrier channel number of cells beyond 200 shows improvement in the peptide identification rate by up to 40% as compared to the standard SCoPE MS type of acquisition.
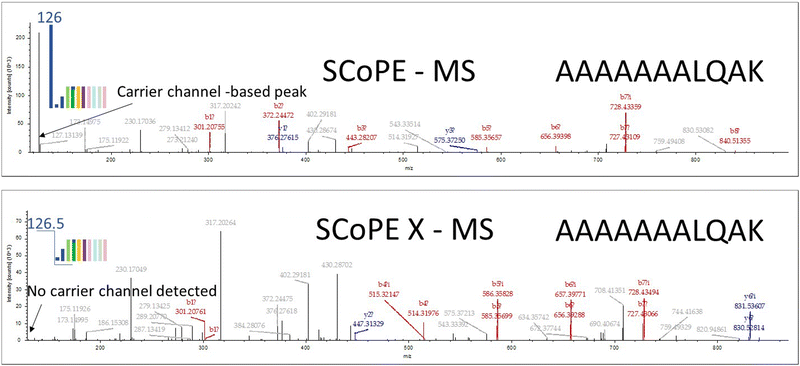
In Fig. 2 spectra of the same peptide are shown. The carrier channel has 50 cells. Data was acquired in two acquisition modes and the peptide fragmentation patterns are shown: SCoPE (top panel) and SCoPE X MS2 (bottom panel). The data was analyzed by Proteome Discoverer using standard search mode parameters. It can be seen that many more peptide fragments were assigned in the SCoPE X MS mode with the same number carrier channel cells. With larger number of cells in the carrier channel even more peptides are identified from single cell analysis in all our studies as described below.
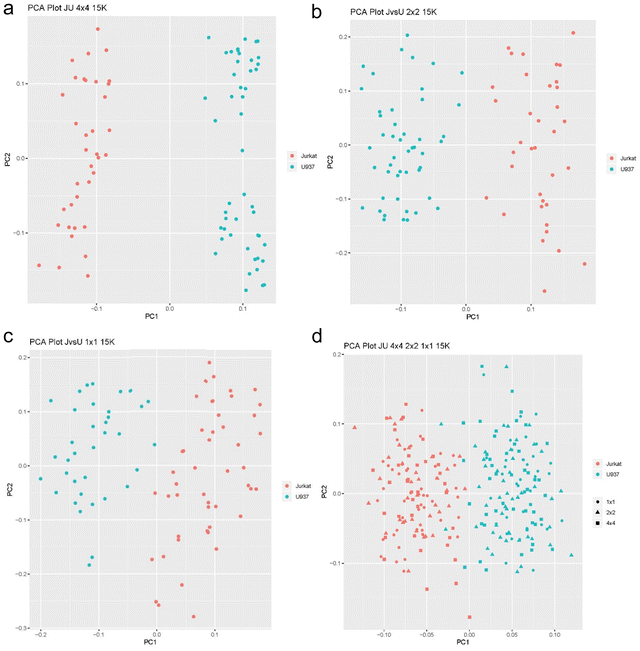
We first tested the new SCREEN platform using the same type of differential analysis involving Jurkat and U937 cells used in our original SCoPE MS paper.5 Hundred thousand Jurkat cells were collected by FACS sorting and underwent our typical mPOP procedure with 3 hour trypsin digest. The digested cells were separated by homemade micro high pH cartridge based on standard Thermo high pH separation spin column (Thermo-Fisher, CA) and fractionated into 5 fractions. All 5 fractions were run on the same type of gradient since single cells will be run to build a library of targeted masses. Searches were submitted to Proteome Discoverer 2.4 (Thermo-Fisher, CA) with the Byonic 3.5 (Protein Metrix, CA) search engine for combined protein Identification with Percolator as a last step and keeping all identifications at standard 1% false discovery rate (FDR). The final targeted library containing a list of 15 to 30 thousand unique peptides was created based on this run and exported as a library for targeted masses for single cell analysis runs. The analyzed three plates were FACS sorted with 4 × 4 (ABCD rows are J cells; EFGH rows are U cells), 2 × 2 (AB rows J cells; CD rows U cells; JE rows J cells; FG U cells) and 1 × 1 sorting methods (A raw J cells; B raw U cells; C raw J cells; D raw U cells etc.). Single cell analysis based on these three FACS sorting methods are shown in Fig. 3a–d. Results from these three plates demonstrate that in each plate an average of 2900 proteins per each of 96 wells were identified, and from the three plates a combined total of 3006 proteins were identified. This was accomplished with a combined standard search with Proteome Discoverer 2.4 and Byonic 3.5 search engine. FDR of 1% was set for both peptide and protein levels and a scrambled database was used to estimate the true false discovery rate. The IMBR (isobaric matching between runs) technique11 that was recently introduced in the MaxQuant search engine will increase this number further.
Another boost to the identification rate comes from CID (collision-induced dissociation) type of ion trap fragmentation, which is available on the Tribrid Lumos Orbitraps (Thermo Fisher, CA). Fig. 4 shows the results of trial runs with roughly 200 cells of carrier channel that was run with an identical 90 min gradient either on the QE HF-X (Thermo Fisher, CA) instrument or the Fusion Lumos Tribrid Orbitrap instrument. CID type of fragmentation in addition to standard HCD scan for single cell analysis were used. If we compare only the HCD identifications, then HF-X and Fusion Lumos were within 10% of each other. The identifications were from the same sample where the presence of the ion trap MS2 spectra, in addition to each event in HCD MS, improved peptide identification rates drastically. We can, therefore, speculate that SCREEN will have the ability to quantify 5000 proteins or greater with CID on new generation of tribrid type of orbitraps called Eclipse.12 We expect similar results from TIMS TOF PRO (Bruker, Billerica, MA) and Zeno TOF (SCIEX, Canada) due to the speed of MS2 data collection and better separation of ions clouds before entering the TOF instrument.
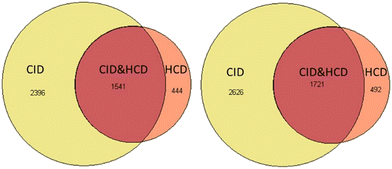 | ||
| Fig. 4 Venn diagrams for protein and peptide identification for Jurkat cells on a Lumos Orbitrap with HCD and CID type of fragmentation. | ||
Another important factor for the new platform's identification rate is the amount of data quantified for the same protein across all cells in the study. In the original SCoPE method only the most abundant 150–200 proteins were identified in all cells across the study. Subsequently this percent dropped very quickly with only about 5% of the cells identified with 1200 proteins. With the new platform approximately 500 proteins with quantitative data were analyzed for cell heterogeneity from all cells in the study. This improvement was possible with only two changes (1) more that 200 cells are now allowed in the carrier channels under the SCoPE X MS2 type of acquisition mode and (2) the instrument no longer operating in DDA (data dependent acquisition) mode, but rather it operates under the strict LTA (library based targeted acquisition) approach to remove any stochasticity of ion detection-isolation for MS2 mode due to the undersampling effect.
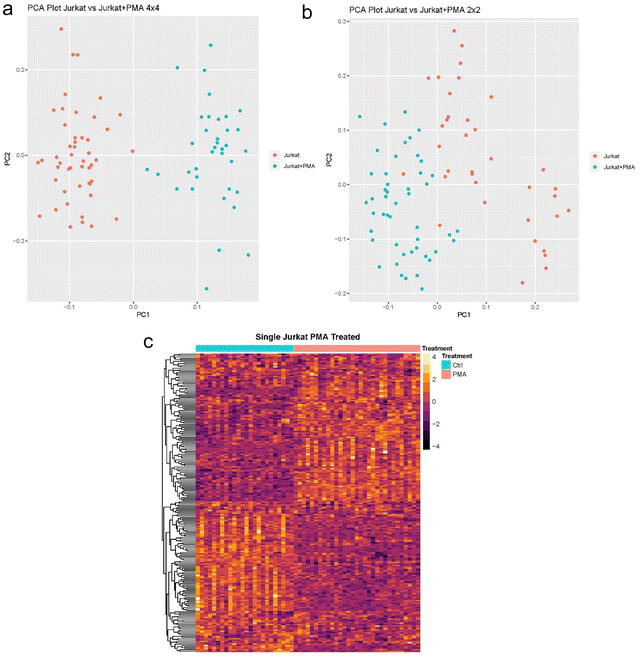
We then applied SCREEN to analyze Jurkat cells treated with Phorbol 12-myristate 13-acetate (PMA) and Ionomycin (PMAi). Analysis of the single cell proteomes under these two treatments show a significant shift in protein abundances, a clear separation between treated and untreated cells, and unique clusters within treated cells are also observed. Analysis of the differentially expressed proteins show multiple pathways being activated due to drug response. Activated pathways are primarily responsible for cell death/differentiation, which indicates that either the majority of the cells were apoptotic at time of sample collection or they started differentiating into other cells types. The separation between the different conditions are shown in Fig. 5 with PCA and heatmap plots.
To demonstrate that SCREEN has the ability to see a digital response upon drug treatment on a specific area of the proteome using a focused targeted approach, we repeated the experiment with Jurkat cells treated with PMAi for just 30 min and extracted to 96 well plates. We compared these experimental conditions to Jurkat cells that were treated for 4 hours before extraction to 96 well plates with 4 × 4 and 2 × 2 sorting schemes. For this experiment, the HFX Orbitrap mass spectrometer instrument was instructed to target only a limited number of proteins (100 proteins in total) selected from our general Jurkat cells protein library and representing biologically important but low abundant proteins in the human proteome that are related to cell cycle control. We targeted histones, cyclin dependent kinases and kinase inhibitors as well as zinc-finger proteins and cell cycle regulation proteins that are known to be affected by PMAi treatment. Upon database identification by Proteome Discoverer (PD), we identified 165 proteins from these runs, where about 50 proteins appeared to be extra proteins that we did not target. These were mostly keratins and other common lab contaminates, usually present in sample preparation procedure. Lastly, the next 20 proteins showed random behavior identified in this targeted run, most commonly represented by proteins which are naturally most abundant in the human proteome like actin, tubulin, and trypsin hits.
Fig. 6a and b show that Jurkat cells treated for 30 min are distinguishable from cells that are treated for 4 hours, and this separation is due to the different type of pathways that had been activated upon PMAi treatment. The separation of the cells by PCA is not as clear as in the case where we compared untreated and treated cells – most likely due to two facts: one is that this analysis is based only on 95 targeted proteins which are not very abundant, and the other most likely due to cells having a similar proteome level at both the 30 min and the 4 hour mark of PMAi treatment. Differentially expressed proteins from this data provide evidence that several pathways which are responsible for mitotic regulation, kinase activity, G1/S phase cell cycle/division, cellular response to oxygen containing compound and P53-signaling are more prominent after 4 hours of drug treatment and that these pathways show secondary response to drug activity. Output from STRING cluster analysis on the differentially expressed proteins are summarized in Tables S1 and S2 (ESI†).
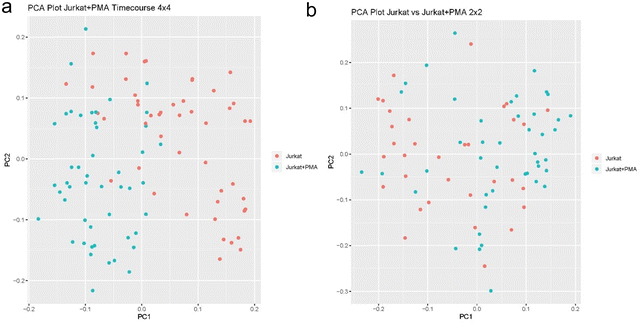 | ||
| Fig. 6 (a) PCA plots of Jurkat PMAi drug treated cells for 30 min vs. 4 hours with 4 × 4 sorting scheme. (b) Same results shows with 2 × 2 sorting scheme. | ||
In Fig. 7a and b two plots of Jurkat cells FACS sorted by the 4 × 4 and 2 × 2 patterns are shown for drug treatment timepoints of 30 min and 4 hour. The Same data used in Fig. 6 were analyzed and represented by SIMLER10 using another type of dimension reduction technique. This type of plot shows a better clustering representation of the different cell types. Further analysis of the data shows that at both treatment times, cells show heterogeneity in their response to the drug treatment forming 4 clusters where cells from both timepoints are found in each of the clusters. To our knowledge, this is the first report of a digital drug response based on the proteome state of single mammalian cells.
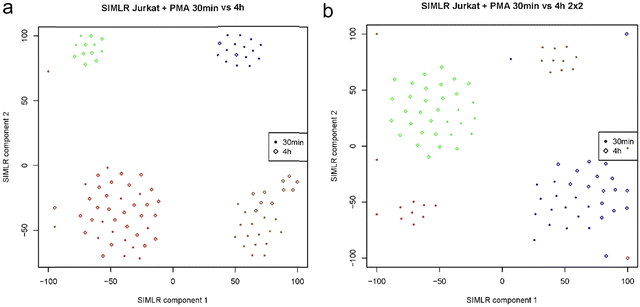 | ||
| Fig. 7 (a) and (b) SIMLER plots of Jurkat cell with PMAi drug treatment for 30 min and 4 hour timepoints show cell heterogeneity, using 4 × 4 and 2 × 2 sorting patterns respectively. | ||
The next experiment that we performed demonstrates SCREEN's ability to distinguish cancer cell types that can be treated by drug and those that are resistant to drugs. We used HL60 cancer cell line as an example of Doxorubicin treatable cancer and the MX2 cancer cell line that is multi drug resistant. This experiment was designed to show that SCREEN can distinguish essentially the same type of leukemia cancer cells that differ only by its drug resistance to doxorubicin.11 The cancer cells were sorted by the standard FACS 2 × 2 and 4 × 4 sorting patterns to prove that the sorting pattern doesn’t impact SCEEEN's ability to separate these cell types. In Fig. 8a and b respectively with the two types of FACS sorting patterns, SCREEN shows clear differences between the two states of the same leukemia cancer cells.
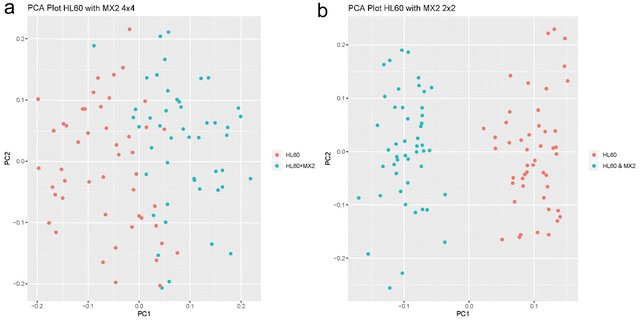 | ||
| Fig. 8 (a) PCA analysis of HL60 and MX2 cancer cell types with the 4 × 4 FACS sorting scheme. (b) PCA analysis of HL60 and MX2 with the 2 × 2 FACS sorting scheme. | ||
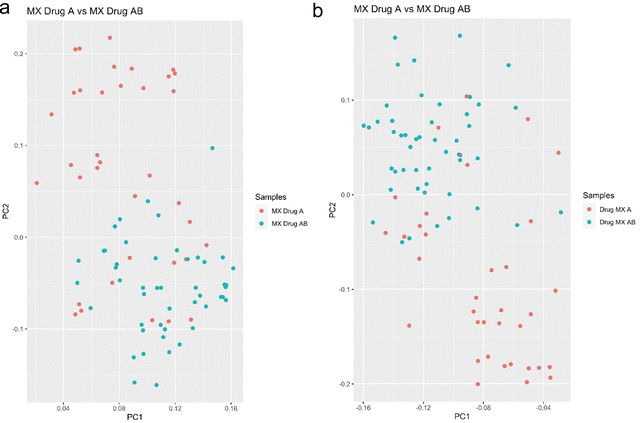
The next experiment shows the ability of SCREEN to differentiate leukemia cancer cells MX2 treated with Doxorubicin drug and the same cells that were treated with a drug cocktail of Doxorubicin and Camptothecin with 10 micromolar concentration for 16 hours. The MX2 cancer cells were FACS sorted as before with two sorting schemes (2 × 2 and 4 × 4) to exclude any dependence of analysis on the cell sorting procedure.
Mass spectrometry analysis of these cells show clear ability of SCREEN to distinguish cells that were treated by drugs cocktail, and this separation is due to changes in the proteome where proteins most probably are responsible for cell activation of death pathways. Cells that were treated by doxorubicin solo treatment are still remain resistant to that type of treatment. This exemplifies a clear advantage of this type of analysis over bulk measurements, where we see single cell reaction to drugs cocktail treatment for leukemia doxorubicin resistant cells (Fig. 9).
Single cell data analysis workflow
Data and format
Mass spectra were searched against the UniProt protein sequence database with Protein Discoverer. Only the SwissProt section of Human UniProt was used with 20![[thin space (1/6-em)]](https://www.rsc.org/images/entities/char_2009.gif) 197 entries. For all analyses we recovered the PSM abundance result from the Protein Discoverer in an excel spreadsheet which we converted to a tab delimited data table using a python script. This table is in long format with each PSM belonging to a run and a TMT channel. A 96-well plate provides sources for several TMTplex runs. Each TMTplex run was filtered and normalized separately which required reformatting the table into the wide form.
197 entries. For all analyses we recovered the PSM abundance result from the Protein Discoverer in an excel spreadsheet which we converted to a tab delimited data table using a python script. This table is in long format with each PSM belonging to a run and a TMT channel. A 96-well plate provides sources for several TMTplex runs. Each TMTplex run was filtered and normalized separately which required reformatting the table into the wide form.
Data filtering
We removed PSMs from the data table identified as part of a contaminating protein from the sample preparation steps or being highly expressed in most cells. We then reduced the variable columns of the Protein Discoverer result table and retained only those referring to the mass spectrometry TMT run and to the isolation interference percentage in addition to the PSM expression values. We next filtered the PSMs with respect to isolation interference and retained only those with less than 70% of spectrum overlap. We experimented with several interference thresholds and settled on a rather high value to increase the number of PSMS without adding noise to the data. We plotted the total amount of abundance for each TMT run and each channel in a bar plot and removed cell without abundances.Imputation
We extrapolated missing abundance values with data from PSMs of the same protein. The data table was split into abundance matrices specific for single TMT mass spectrometry cycles. Looping over proteins of these matrices we partitioned the protein specific data matrices into sample specific matrices. For binary sample types this resulted in 2 matrices per protein each with one or more rows according to PSM multiplicity. Duplicates were removed and the matrices scanned first row wise and then column wise and checked for missing abundances. If all values were missing the matrix row was marked for later evaluation. If a single value was missing but there were values for more than 50% of abundances the missing value was filled with the average of the available values. Row wise and column scanning and filling of missing data was applied twice. If after these steps the protein specific abundance matrix still contained missing values, these were filled by sampling from existing data. Specifically, data were sampled from a sequence of 10 evenly spaced numbers between the minimum and maximum of existing values. Protein PSMs with missing values after these operations had most or all values lacking. These, we surmised, were proteins at the limit of the mass spectrometry detection level. Instead of setting their abundances to zero we sampled them from a range of values between the global abundance minimum, the smallest value in the mass spectrometry data, and 75% of this minimum. Proteins with all abundances missing in all samples were discarded.Normalization
PSM abundances were aggregated to protein abundances by selecting the maximum values and the individual TMT run data merged. The run data were separately either quantile normalized or normalized by centering each TMT channel around its mean or around the median of all channels and selected the appropriate method by visual inspection of boxplots of the merged normalized data. We removed batch effects by regressing on the TMT runs13 and retained the residual matrix which was subjected to a variance stabilizing transformation for subsequent manipulations.14Principal component analysis
To develop our methodology, we used data sets of treated and untreated cells or cells of a different type and we assumed this classification to be known. This enabled a basic quality assessment such that we should expect, after clustering the processed data, cells to partition into different clusters based on their known designation. We used principal component analysis to monitor our clustering expectation, calculated a matrix decomposition into singular values and plotted the first 2 components of the loadings. In some cases, there was clear separation of the know sample classes, especially in repeat experiments with optimized mass spec processing. But often we observed residual noise or unwanted variation in the data the known cell types mixing in a single cluster. We therefore undertook to isolate this variation by factor analysis.Removal of noise
An example of non-biological, unwanted variance is the batch effect, but we have already taken care of this effect by adding it to a linear model. But more noise needs to be removed to obtain the expected clustering of the samples. The source of this variation is unknown. We therefore resort to factor analysis and infer the factors from the data and incorporate into the linear model for differential expression analysis. There are several reports15–17 that use factor analysis for normalization, but care must be taken to separate biological factors from unwanted variation. This is not possible in a rigorous way, but we believe that using the knowledge of sample identities will limit the effect of removing biological information together with non-biological factors. We start with a log-linear regression model.log![[thin space (1/6-em)]](https://www.rsc.org/images/entities/char_2009.gif) E[Y|W;X] = Wα + Xβ E[Y|W;X] = Wα + Xβ | (1) |
We therefore run a regression without W and perform a single value decomposition of the residual matrix R = UΛVT. We estimate W with W = UΛ which is a n × k matrix with n the number of cells. Finally, we substitute W into (1).
> removeVar ← function(mses, fnum) {
+ # fnum: integer, num factors to remove
+ fnum ← as.integer(fnum)
++ dsgn ← model.matrix(∼0 + factor(pData(mses)$TreatmentGroup))
+ colnames(dsgn) ← c(′Ctrl′, ′4 h′)
++ fit ← lmFit(mses, dsgn)
+ residuals.m ← residuals.MArrayLM(fit, exprs(mses))
+ e ← exprs(mses)
+ te ← t(e)
+ E ← t(residuals.m)
+ svdWa ← svd(E)
+ W ← svdWa$u[, fnum]
+ alpha ← solve(t(W) %*% W) %*% t(W) %*% te
+ cY ← te – W %*% alpha
+ cY ← t(cY)
++ return(cY)
+}
>
Discussion
We present our new single cell proteome platform called SCREEN, a robust technique and methodology enabling simultaneous deep proteome analysis of multiple single cell preparations. This new platform makes improvements in all areas of the original SCoPE MS technique. The enhancements include fast sample preparation time, inexpensive chemistry, free single cell lysis, 96-well plate format, low volume, fully automated single cell preparation procedure. We have also improved the mass spectrometry acquisition method that allows the use of more than 200 cells in the carrier channel, which increases the depth of coverage and, most importantly, it increases the number of cells that have a larger numbers of proteins quantified across a given study. Finally, we made improvements to the single cell data analysis procedure, which includes data cleanup, TMT channel normalization, plate batch effect normalization, and the critical step of data imputation allowing use of a larger number of cells needed for rigorous statistical analysis. As a result of the strictly targeted approach and the new data acquisition of MS2 spectra (SCoPE X), and the new analysis method to quantify single cell data, we have significantly improved coverage of quantified proteins across all cells by more than 10-fold, goring from below 50 in our original SCoPE method to above 600 with SCREEN. The total number of proteins detected has increased from around 1200 (SCoPE) to above 2900 as an average number detected per well in a 96 well plate format. A total of 3006 proteins were identified and quantified at 1% FDR across three plates in our study of Jurkat vs. U936 cells. A critical parameter in the identification process is the depth of quantitative data from the identified proteins – only 170 proteins were identified and quantified respectively with single peptide and on average each protein was quantified with 4 unique peptides at a 1% FDR. Such deep proteome coverage as well as multi-peptide quantitation of each protein provides rich analytical data that can be used in the analysis of global cell heterogeneity, never achieved previously at single cell resolution.In developing this new platform our philosophy was to not only achieve depth of proteome coverage for each single cell and demonstrate that we can specifically target the low abundance part of the proteome, but to also show the practicality and applicability of this innovative workflow. For example, we showed that we can monitor cell heterogeneity under different biological conditions and study particular pathways. The platform also lays the foundation for rigorously investigating protein post-translational modifications (PTMs) at single cell resolution. We purposefully built SCREEN to allow proteomics laboratories around the world to reproduce what we have done and perform their own high quality single cell analysis. To this end, all required reagents and consumables for this platform are commercially available and don’t require specialized solutions such as ultra-precise microfluidics, hard to achieve chromatographic performance from nano columns, and ultra-low flow rate liquid chromatography setup which make the analysis time impractical for large cell population studies. All parts of the platform have been tested successfully for reproducibility and the platform has been applied to a variety of cell types under different biological and experimental setups. We have also benchmarked the platform. The current throughput is 700 cells per week utilizing a single mass spectrometer equipped with a tandem nano HPLC pump, fast trapping column injections and a double column set up for TMT11plex method. Under this configuration 8 single cells can be quantified per mass spec run. Utilizing a TMT18plex based scheme performing 15 single cells per mass spec run, we can analyze at least 360 cells per day of mass spec analysis or 1000 cells project in three days.
Conclusion
The newly developed SCREEN platform has been successfully applied to the classical single cell proteomics experiment of separating Jurkat cells from U937 human blood cancer cells. By using a library targeted acquisition (LTA) approach, we demonstrate that SCREEN performs better than the original SCoPE method and that the SCoPE X acquisition method offers enhanced proteome coverage by removing stochasticity in the MS2 triggering process, resulting in dramatically improved protein coverage among individual cells. Furthermore, we used Jurkat cells treated with PMAi to show that SCREEN allows not only a clear distinction between treated and untreated cell populations based on their proteome shift, but also displays a digital response. It is encouraging to not only observe differences in cell response due to drug treatment, but when targeted approaches are applied to the same cells, we can also see the time course of drug treatment.SCREEN targeted analysis focused only on 95 biologically important proteins that were found to be at low abundances per cell. As a result of the different pathways that were activated by the same drug treatment, our platform was able to differentiate cells based on the time and duration of the drug treatment. As a result of this new targeted approach, we have achieved an important milestone in single cell proteome analysis (SCPA), namely, we are now able to focus on a specific part of the proteome that is biologically relevant to a particular study and quantify low abundance proteins despite the presence of highly abundant structural proteomes embedded within it. Moreover, SCREEN was able to differentiate drug-sensitive and drug-resistant leukemia cancer cells from the same cell line, according to additional experiments. According to these results, the newly developed SCREEN platform can be used to analyze biologically complex systems to identify unique drug response signatures derived from changes in the proteome of individual cells, making it a powerful analytical tool for studying biologically complex systems. This new development in single cell proteomic analysis and single cell biology is a significant leap forward in impactful clinical applications since we are now able to analyze cancer cell heterogeneity and drug resistance mechanisms based on proteome changes at single cell resolution based on drug and drug combination responses. Although single cell proteomics still has lower coverage of the proteome than SC RNA sequencing or slower technique than spectral flow cytometry, it has been clearly shown that it can reveal unique biological functions of each individual cell, which opens up new ways to analyze cell heterogeneity and drug response. Single cell proteomics also offers a higher temporal resolution than other methods, allowing for the study of dynamic processes at the single cell level. It is also a powerful tool for validating the results obtained from bulk assays. Finally, single cell proteomics allows for the quantification of signaling pathways at the single cell level.
Methods
Cell culture
Human Jurkat (lymphocytes T-cells) cells were grown as suspension cultures in RPMI medium (HyClone 16777-145) supplemented with 10% fetal bovine serum (FBS) and 1% pen/strep. Cells were passaged until a density of 1 M cells per mL was reached, which is approximately every third day.Drug treatment
Jurkat cells were treated by adding PMA (10 ng mL−1) and Ionomycin (1 μg mL−1) to the culture medium for 30 minutes or for 4 hours at 37 °C. Jurkat cells having undergone PMAi treatment were washed twice with ice-cold phosphate buffered saline (PBS). Cell suspensions of Jurkat cells were pelleted and washed quickly with cold PBS at 4 °C and diluted in final PBS solution. For the carrier channel, bulk cells were carefully pelleted with a Eppendorf 5804 model centrifuge at 7 °C for 1000 rpm for 10 min, all liquid was discarded by careful pipetting and replaced by 20 μl of dd 18 MΩ water and frozen immediately at −80 °C for additional mPOP procedure.Cell sorting
Single Jurkat or U937 cells were isolated and distributed into standard 96-well plates using a MoFlo Astrios EQ Cell Sorter (Beckman Coulter) into 1 μl of pure dd 18 MΩ water within each well of the 96-well plate (Eppendorf). Carrier channels containing 100–500 K cells were prepared separately by FACS sorting into 1.5 milliliter Eppendorf tubes and used in all sets across multiple plates.SCREEN sample preparation
Single cells and carrier cells were lysed by freezing at −80 °C for at least 5 min and heating to 95 °C for 5 min. Then, samples were centrifuged briefly to collect liquid, 0.5 microliter of trypsin (Promega Trypsin Gold) in 100 mM triethylammonium bicarbonate (TEAB) (pH 8.5) were added to 1 μl of single cell suspension in clean water. The samples were digested for 3 hours in an oven at 38 °C (Thermo). Samples were cooled to room temperature and labeled with 0.5 microliter of 7.8 mM (10 μg μl−1 final concentration for average TMT mass of 128.5 Da) TMT label (TMT11 kit, ThermoFisher, Germany) for 1 hour. The unreacted TMT label in each sample was quenched with 0.5 μl of 100 mM ammonia bicarbonate for 30 minutes at room temperature. The samples corresponding to one TMT11 plex were then mixed in a single glass HPLC vial (Thermo-Fisher, CA) to a standard volume of 12 μl for injection to nanoHPLC. Material equivalent up to 500 cells in carrier channel and 8 cells in the eight other channels was injected for analysis by nano HPLC-MS/MS for TMT11plex type of analysis or 12 cells for TMT16pro type of analysis.Targeted library generation
Carrier channels after mPOP, trypsin digest and labeling, single cells were quenched with 5% hydroxyl solution to remove access of 126 channel to exclude any possibility for cross labeling with single cell channels. Carrier proteome peptides labeled with TMT126 channel were separated by help of home-made mini high pH cartridges based on commercially available Pierce™ high pH reversed-phase peptide fractionation kit (Thermo-Fisher, CA) to 3–5 fractions. Each fraction was run on QE HFX instrument with identical gradient that is used to do analysis of sing cell run on both columns that were installed on a tandem Ultimate 3000 nano HPLC system. Despite the fact that PharmaFluidics columns are chip-based production and have identical dimensions and dead volumes, but internal dead volume of each valve/pump and some extra tubing between two 10 port vales Valco (Houston, TX) creates a unique elution times for each column/pump pair. To resolve this issue two independent libraries were prepared for each pair of column/pump. Alternative single cell library can be created with large 10 min windows to accommodate both pumps elution times that are usually differ by 3–7 minutes across the LC gradient. To improve this situation and create an ability to use general library for tandem pump acquisition that would be applicable to all runs requires a rewiring of an LC system. In this column independent mode where 1 valve is used for all trapping runs and second valve is used for all elution analytical runs, this type of tandem pump acquisition mode will be column independent (assuming the same dead volumes for both analytical columns) and allows very tight windows for tandem library that will enable even a larger targeted list across 90 min gradients (data not shown, work in progress). Currently we been able to upload up to 30 thousand unique peptides into the targeting list on QE HFX Orbitrap for LTA runs based on unique peptide identification from combined fractionated ID of carrier channel.Mass spectrometry analysis
SCREEN samples were separated via online nano LC on a Dionex UltiMate Tandem 3000 UHPLC instrument. All samples were loaded for 5 min at 5 μl per minute to μPAC ThermoScientific trapping column with 100% of buffer A (0.1% formic acid in water). A constant flow rate of 200 nl min−1 was used during separation gradient of 90 min. After sample loading and port valve switch to elute samples into μPAC ThermoScientific 50 cm analytical columns on HPLC active gradient ramped from 0–5% B buffer (0.1% formic acid in acetonitrile) in 5 min followed by linear part of the gradient from 5 to 30% B buffer over 60 min gradient then ramped to 98% B buffer over 10 min and stayed at that level for 15 min of the active gradient. During injection of single cell sample on analytical column 1, second trapping column and second analytical column on tandem UltiMate 3000 pump underwent wash gradient for the first 3–50 min followed by the next step with the last 20 minute of equilibration procedure with 98% A as a preparation step for next injection cycle. All samples were analyzed by a Thermo Scientific Q-Exactive HFX mass spectrometer from 20 to 90 minutes of the nano HPLC gradient. Trial samples that contained only carrier channel were run on Tribrid Lumos Orbitrap instrument to compare identification rates with and without help of ions trap MS2 scans.Electrospray voltage was set to 2000 V, applied at the end of the analytical column to stainless steel needle from Pepsep (Odense, Denmark) and was inserted in a custom holder for Valco (Houston, TX) liquid junction that is available from ESI Source Solution (Woburn, MA). To reduce common laboratory atmospheric background ions and enhance peptide signal to single charged general noise ratio, an ABIRD (Active Background Ion Reduction Device by ESI Source Solutions, Woburn MA) was used at the nano spray interface. The temperature of ion transfer tube was 275 degrees Celsius and the S-lens RF level set to 60. After a precursor scan from 400 to 1400 m/z at 120![[thin space (1/6-em)]](https://www.rsc.org/images/entities/char_2009.gif) 000 resolving power, MS2 method with the top 10 most intense precursor ions with charges 2 to 4 and above the AGC min threshold of 10
000 resolving power, MS2 method with the top 10 most intense precursor ions with charges 2 to 4 and above the AGC min threshold of 10![[thin space (1/6-em)]](https://www.rsc.org/images/entities/char_2009.gif) 000 were isolated for MS2 analysis via a 0.8 Th isolation window with offset settled to 0.3 Th. These ions were accumulated for at most 100 ms. Then they were fragmented via HCD at a normalized collision energy of 34 eV and MS2 spectra were detected at 60
000 were isolated for MS2 analysis via a 0.8 Th isolation window with offset settled to 0.3 Th. These ions were accumulated for at most 100 ms. Then they were fragmented via HCD at a normalized collision energy of 34 eV and MS2 spectra were detected at 60![[thin space (1/6-em)]](https://www.rsc.org/images/entities/char_2009.gif) 000 resolving power. Dynamic exclusion was used with a duration of 60 seconds with a mass tolerance of ±5 ppm. Raw MS data Raw data were searched by Proteome Discoverer 2.4 with Bionic 3.5 node against protein sequence database including all entries from the Human SwissProt database (downloaded January 2018; 20
000 resolving power. Dynamic exclusion was used with a duration of 60 seconds with a mass tolerance of ±5 ppm. Raw MS data Raw data were searched by Proteome Discoverer 2.4 with Bionic 3.5 node against protein sequence database including all entries from the Human SwissProt database (downloaded January 2018; 20![[thin space (1/6-em)]](https://www.rsc.org/images/entities/char_2009.gif) 197 entries) and with a home curated contaminants database containing proteins such as human keratins and common lab contaminants.
197 entries) and with a home curated contaminants database containing proteins such as human keratins and common lab contaminants.
We specified trypsin/P digestion and allowed for up to two missed cleavages for peptides with 6 to 25 amino acids. Tandem mass tags (11plex TMT) were specified as fixed modifications. Methionine oxidation (+15.99492 Da), asparagine deamidation (+0.98402 Da), protein N-terminal acetylation (+42.01056 Da) were set as variable modifications. As reduction and alkylation steps were not performed during sample preparation procedure no other modification were set. False discovery rate (FDR) calculations were performed by Proteome Discoverer search engine by Percolator module for Sequest search and Byonic hits were evaluated inside of the Byonic node independently.
Data analysis was done in the R programming language environment, based on Bioconductor original methods that allows analysis of mass spec data starting from PSM hits. Such lists were exported from Proteome discoverer for further analysis. Each plate runs (12 LC MS/MS runs per 96 well plater) were analyzed separately for statistical evaluation and normalization purposes, and the data subsequently were combined for the normalization step to remove batch effect amongst the different 96 well plates. After the normalization procedure all data were consolidated for the DE (differentially expressed) analysis workflow.
Abbreviations
| SCoPE | Single cell ProtEomics |
| SCREEN | Single cell pRotEomE aNalysis |
| mPOP | minimal proteOmics preparation |
| FACS | Fluorescence-activated cell sorting |
| CID | Collision-induced dissociation |
| HCD | Higher energy collisional dissociation |
| QE HF-X | Q Exactive high field mass spectrometer |
| DNA | Deoxyribonucleic acid |
| RNA | Ribonucleic acid |
| RNAseq | Ribonucleic acid sequencing |
| LC-MS/MS | Liquid chromatography tandem mass spectrometry |
| TMT | Tandem mass tag |
| ESI | Electro spray ionization |
| DDA | Data dependent acquisition |
| TA | Targeted acquisition |
| IMBR | Isobaric matching between runs |
| LTA | Library (based) targeted acquisition |
| PBS | Phosphate buffered saline |
| MS2 | Fragmentation scan in mass spectrometry |
| UHPLC | Ultra high pressure liquid chromatography |
| PMA | Phorbol 12-myristate 13-acetate |
| PMAi | Phorbol 12-myristate 13-acetate and ionomycin |
Data availability
The data has been released into the public domain and can be downloaded here: https://ftp://massive.ucsd.edu/MSV000088243/Conflicts of interest
BB is patent holder of SCoPE MS method; BB is scientific adviser to Novelnaand Preverna.Acknowledgements
Authors thank FAS Division of Science of Harvard University for supporting this project. Authors thank Dr Rushdy Ahmad at the Wyss Institute at Harvard University for reviewing, commenting and editing the manuscript. Authors also thank Zubarev R, Moritz R, Sackton T, Herland A and Maoz B for their helpful comments.References
- S. Skylaki, O. Hilsenbeck and T. Schroeder, Challenges in long-term imaging and quantification of single-cell dynamics, Nat. Biotechnol., 2016, 34, 1137 CrossRef CAS PubMed
.
- T. Haselgrübler, M. Haider, B. Ji, K. Juhasz, A. Sonnleitner, Z. Balogi and J. Hesse, High-throughput, multiparameter analysis of single cells, Anal. Bioanal. Chem., 2014, 406, 3279 CrossRef
.
- M. H. Spitzer and G. P. Nolan, Mass Cytometry: Single Cells, Many Features, Cell, 2016, 165(4), 780 CrossRef CAS
.
- C. Brown, H. Gudjonson, Y. Pritykin, D. Deep, V. P. Lavallée, A. Mendoza, R. Fromme, L. Mazutis, C. Ariyan, C. Lesli, D. Pe’er and A. Y. Rudensky, Transcriptional Basis of Mouse and Human Dendritic Cell Heterogeneity, Cell, 2019, 179(4), 846–886 CrossRef CAS PubMed
.
- B. Budnik, E. Levy, G. Harmange and N. Slavov, SCoPE-MS: mass spectrometry of single mammalian cells quantifies proteome heterogeneity during cell differentiation, Genome Biol., 2018, 19, 161 CrossRef
.
- J. Kagan, R. L. Moritz, R. Mazurchuk, J. H. Lee, P. V. Kharchenko, O. R. Rosen, E. Ruppin, F. Edfors, F. Ginty, Y. Goltsev, J. A. Wells, J. LaCava, J. L. Riesterer, R. N. Germain, T. Shi, M. S. Chee, B. A. Budnik, J. R. Yates III, B. T. Chait, J. R. Moffitt, R. D. Smith and S. Srivastava, National Cancer Institute Think-Tank Meeting Report on Proteomic Cartography and Biomarkers at the Single-Cell Level: Interrogation of Premalignant Lesions, J. Proteome Res., 2020, 19(5), 1900–1912 CrossRef CAS
.
- N. Slavov, Unpicking the proteome in single cells, Science, 2020, 367(6477), 512–513 CrossRef CAS PubMed
.
- H. Specht, G. Harmange, D. H. Perlman, E. Emmott, Z. Niziolek, B. Budnik and N. Slavov, Automated sample preparation for high-throughput single-cell proteomics, BioRxiv, 2019 DOI:10.1101/399774
.
- R. G. Huffman, A. Chen, H. Specht and N. Slavov, DO-MS: Data-Driven Optimization of Mass Spectrometry Methods, J. Proteome Res., 2019, 18(6), 2493 CrossRef CAS PubMed
.
- A. T. Chen, A. Franks and N. Slavov, DART-ID Increases Single-Cell Proteome Coverage, PLoS Comput. Biol., 2019, 15, 7, DOI:10.1371/journal.pcbi.1007082
.
- S. H. Yu, P. Kiriakidou and J. Cox, Isobaric matching between runs and novel PSM-level normalization in MaxQuant strongly improve reporter ion-based quantification, J. Proteome Res., 2020, 19(10), 3945–3954, DOI:10.1021/acs.jproteome.0c00209
.
- E. Borras, O. Pastor and E. Sabido, Use of linear ion trap in data independent acquisition methods benefits low-input proteomics, Anal. Chem., 2021, 93(34), 11649–11653 CrossRef CAS PubMed
.
- B. Wang, J. J. Zhu, E. Pierson, D. Ramazzotti, S. Batzoglou and S. Batzoglou, Visualization and analysis of single-cell RNA-seq data by kernel-based similarity learning, Nat. Methods, 2017, 14(4), 414 CrossRef CAS PubMed
.
- W. G. Harker, D. L. Slade, W. S. Dalton, P. S. Meltzer and J. M. Trent, Multidrug Resistance in Mitoxantrone-selected HL-60 Leukemia Cells in the Absence of P-Glycoprotein Overexpression, Cancer Res., 1989, 49, 4542 CAS
.
- W. E. Johnson, C. Li and A. Rabinovic, Biostatistics Adjusting batch effects in microarray expression data using empirical, Bayes Methods, 2007, 8(1), 118 Search PubMed
.
- W. Huber, A. von Heydebreck, H. Sueltmann, A. Poustka and M. Vingron, Variance Stabilization Applied to Microarray
Data Calibration and to the Quantification of Differential Expression, Bioinformatics, 2002, 18(1), 96 CrossRef
.
- D. Risso, J. Ngai, T. P. Speed and S. Dudoit, Normalization of RNA-seq data using factor analysis of control genes or samples, Nat. Biotechnol., 2014, 32, 896 CrossRef CAS
.
Footnotes |
| † Electronic supplementary information (ESI) available. See DOI: https://doi.org/10.1039/d3mo00124e |
| ‡ Co-first authorship. |
| § Current address: Mass Eye and Ear Center, Boston MA. |
| ¶ Current address: Broad Institute of MIT and Harvard, Cambridge, MA. |
| || Current address: Wyss Institute, Harvard, Boston, MA02115. |
| This journal is © The Royal Society of Chemistry 2024 |

