DOI:
10.1039/D3NA00876B
(Paper)
Nanoscale Adv., 2024,
6, 1880-1891
Radiofrequency absorption of coated ellipsoidal gold nanoparticles in human tissue
Received
12th October 2023
, Accepted 14th January 2024
First published on 15th January 2024
Abstract
Electromagnetic radiofrequency heating of gold nanoparticles for use in remote hyperthermia cancer treatment has seen rapidly growing interest in the last decade. While most of the focus has been on studying spherical nanoparticles, recent research suggests that using ellipsoidal particles can significantly increase the Joule heating. However, it is still unclear how the presence of ligands affects the electromagnetic absorption in this context. In the present paper, we study the effects of adding a surface coating to ellipsoidal gold nanoparticles, and investigate the change in absorption with respect to coating properties, particle aspect-ratio, and frequency. Both the case of a single nanoparticle and the case of a suspension of nanoparticles are studied. The introduction of a dielectric coating increases the absorption rate for particles with lower aspect ratios and at lower frequencies, potentially improving the flexibility of parameter configurations that can be used in treatment. A thermal analysis reveals that the absorption in the parameter space of lower aspect ratios translate to negligible differential temperature increase, even with the addition of coating. Furthermore, nanoparticles with very large aspect ratios (nanowires) generate less heat with coating compared to no coating. Thus, it is shown that the presence of coating and choice of aspect ratio, have significant impact on the absorption response and must be accounted for in the analysis of ligand-capped nanoparticles. The findings in the present paper provide a valuable tool to optimize the coated gold nanoparticle design parameters, in order to secure clinically useful differential heating.
1 Introduction
Gold nanoparticles (AuNPs) as mediators for non-invasive hyperthermic cancer therapy by their exposure to electromagnetic radiation and the subsequent heating of the nanoparticles has been under copious research for the past two decades.1,2 AuNP-mediated hyperthermia treatment offers the possibility to avoid the side effects typical for X-ray radiation treatments, and the possibility to obtain a more localized heating specific to the tumor location,3 with the potential to tremendously impact cancer therapies in the future. Compared to optical frequencies, radiofrequencies (RFs) offer longer penetration depth in biological tissues, allowing access to deeper tumor locations.
The exact nature of the heating mechanism of AuNPs under RF radiation has been debated, and undergone controversies of contradicting reports.2 Joule heating has previously been discounted for spherical AuNPs in RF,4 while the electrophoretic motion of charged AuNPs oscillating with the alternating electric field has gained convincing ground.5,6 However, the situation remains ambiguous as new studies supporting Joule heating in elongated AuNPs are reported,7 and others questioning whether the presence of AuNPs in tissues has any effect on the observed heating at all.8
In light of a recent report by Rommelfanger et al.7 on RF Joule heating in uncoated ellipsoidal nanoparticles with high eccentricities, we wish to bring some attention back to this potential heating mechanism. Rommelfanger reported significant RF absorption in thin nanowires extending into micrometers in length. Previously, Hanson et al.4 found that metal nanospheres produce several orders of magnitudes more absorption if they are supplemented with a thin coating, but concluded that the resistive heating in both coated and uncoated spherical nanoparticles could not sufficiently account for the observed heating. Such coatings are relevant for this medical application, since the method of localizing the AuNPs within the tumors relies on functionalized organic molecular ligands adsorbed onto their metallic surfaces.
In the literature, many different ligands have been proposed for conjugation with nanoparticles for biomedical applications. These include carbohydrates, proteins, peptides, polymers, oligonucleotides, DNA/RNA, antibodies and many others,9,10 as illustrated in Fig. 1. As can be seen in the figure, the ligands in biomedical applications vary greatly in molecular composition, and thus also with respect to morphology and dielectric properties. The permittivity of ligands may even have a spatial variety, e.g. such as mixed-ligand shells.11
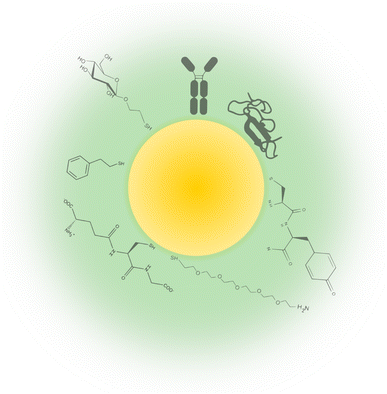 |
| | Fig. 1 Gold nanoparticle coated with ligands. A variety of examples are shown, starting from top and going clockwise: antibodies,10 proteins,16 peptides,17 polyethylene glycol,18 glutathione,6 phenylethanethiol,6 and glucose.18 | |
In this paper, we investigate the impact of adding a dielectric surface layer to ellipsoidal AuNPs embedded in a host medium of different human tissues (healthy and cancerous). We assume that the ligands can be modelled as a dielectric coating from the perspective of Mie scattering in the electrostatic approximation. At this stage, we assume a coating permittivity with no spatial variation. Thereby, we move towards a more realistic representation of the medical application than previously reported in ref. 7, where the AuNPs were studied without coatings.
This study is built upon the work done by Rommelfanger et al.,7 Hanson et al.,4,12 and Dalarsson et al.13 that investigate the absorption cross section and relative absorption ratio for AuNPs, in order to assess whether differential heating can be achieved for the medical application. In the present work, the dependence of the relative absorption ratio on particle shape and coating materials is investigated for a wide range of frequencies between 1 MHz and 10 GHz. It should be emphasized at this point, that there is a lack of comprehensive understanding of the electromagnetic properties of ligand coatings. No quantitatively accurate electromagnetic models for ligand structures exist in the literature, and the values of the model parameters in the literature are largely varying. Therefore, in the present paper, we perform the parameter studies over a relatively large parameter space. Values for the coating conductivity used here ranges from almost lossless to almost metallic in nature, chosen similar to Hanson et al.12 for ease of comparison. The parameter ranges for coating thickness and permittivity are also conceivably large, and thus the electromagnetic response presented in this report accounts for any type of coating of ligands used in gold nanoparticle applications.
Although the recent research7 suggests that using ellipsoidal particles can significantly increase the Joule heating, it is well known that ellipsoidal AuNPs are extremely difficult to synthesize, because the current Au crystal growth method (mainly seed-growth method) does not allow AuNPs to grow into ellipsoidal shape. However, the ellipsoidal AuNPs are a suitable theoretical model of practical cylindrical nanowires and nanodiscs as limiting cases of ellipsoidal particles. Thus, the present paper accommodates the simulation of both nanowires and nanodiscs, and can thereby benefit a suitable experimental study.
Thyroid is the tissue of choice for the ambient medium for most studies reported here. This choice is motivated by its dielectric function having similar magnitude as many other human tissues, in contrast to e.g. adipose tissues such as breast fat.14 Furthermore, it allows a more direct comparison with the results for uncoated AuNPs reported in ref. 7, where the same dielectric function is used for the pancreas. For modelling the dielectric coating, a simple dielectric function will in most cases be used, which allows full control of coating permittivity and conductivity when investigating how the coating affects the overall absorption. In addition, one smaller case study is done for a carbohydrate ligand using a realistic dielectric relaxation model.
In addition to the absorption in single particles, a short study on multiple particle absorption is also performed. We have derived new formulas for multiple particle absorption based on the volume fraction of AuNPs in the tissue. These formulas are not readily found in the literature, which we believe is a valuable contribution of the work presented in this paper. The paper is concluded with a thermal analysis, using the absorption cross sections derived in the earlier sections as an input parameter. The thermal analysis also includes an example of differential heating in breast cancer with carbohydrate-functionalized gold nanowires.
Our approach is based on an analytical description of coated spheroids using an effective medium model,15 which assumes the electrostatic approximation. Some authors have argued that AuNP surface coatings cannot be properly modeled using this approximation, since the electric field within the coating is expected to be non-uniform, and that they therefore must be studied using numerical simulations.7 In this work however, we present new results that support the validity of the electrostatic approach, by comparing our analytical results to accurate numerical finite element models implemented in COMSOL Multiphysics. Our numerical simulations turn out to be in excellent agreement with the analytical results presented here.
As far as we are aware, the present work is the first attempt to model realistic non-spherical NPs with ligand coatings in the literature, with respect to the potential impact of differential RF heating of tissues that are treated with such NPs. The advantage of our results is that they can be used to study the impact of both coating, frequency and aspect ratio of the NPs all at the same time, and thus be able to find the optimal parameter combinations for clinically useful differential heating.
2 Theory
2.1 Notation and conventions
We assume the e−iωt convention, such that the complex relative permittivity has a positive imaginary part for passive materials, i.e. ε = ε′ + iε′′. The permeability, permittivity, and speed of light in vacuum are denoted as μ0, ε0 and c0, respectively. The vacuum wavenumber is thus given by k0 = ω/c0 where ω = 2πf is the angular frequency and  . The wavenumber within a material with complex permittivity ε is given by
  .
.
2.2 Dielectric function of a metal nanoparticle
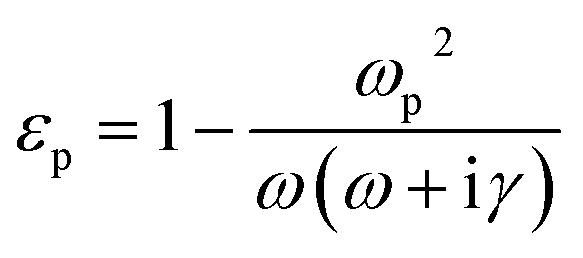
The dielectric function of the metallic core of the nanoparticle (NP) is assumed to be given by the Drude model,| |  | (1) |
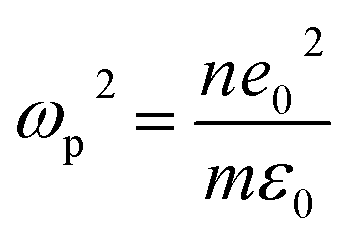
where the plasma frequency is given by| |  | (2) |
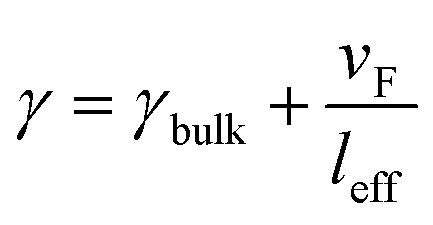
with n being the number density of free electrons, e0 the electron charge, and m the effective electron mass. The scattering rate γ depends on the shape and size of the NP. In the classical treatment, it is calculated as γ = vF/l, where vF is the Fermi velocity and l is the electron mean free path. In this work however, a shape-dependent term is added to account for scattering from the nanoparticle surface19,20| |  | (3) |
where γbulk is the scattering rate of bulk gold proportional to vF/l, and leff is the shape-dependent effective mean free path.
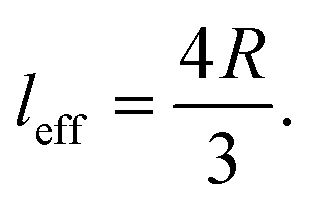
The effective mean free path leff is calculated in an analogous way as in ref. 7, and is briefly outlined here. For a spherical NP with radius R, the effective mean free path is
| |  | (4) |
For an oblate spheroid with diameter D and thickness T,
| |  | (5) |
with
| |  | (6) |
where
e2 = 1 − (
T/
D)
2. For a prolate spheroid with diameter
D and length
L, we have
| |  | (7) |
with
| |  | (8) |
where in this case
e2 = 1 − (
D/
L)
2. As an important special case of prolate spheroids, when
D/
L → 0 and
e → 1, we obtain thin circular cylinders or nanowires. For nanowires, using the above formulas, we obtain
| | 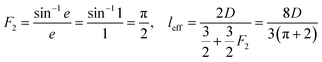 | (9) |
Using these parameter values, we can treat the cylindrical nanowires as the actual particles to study. Thus, with the above formulas, the current paper is easily generalized to accommodate modelling of nanowires. The same discussion also applies for nanodiscs, with oblates in the limit T/D → 0.
Otherwise, for the sake of completeness, we also note that when an oblate or prolate spheroid approaches the shape of a sphere (T/D → 1 and F1 → 2, or D/L → 1 and F2 → 1, respectively), then as one would expect, the effective mean free path approaches that of a sphere leff → 4R/3.
2.3 Dielectric function of biological tissues
The dielectric properties of biological tissues are generally described by the Debye relaxation model. The Cole–Cole model is one of its variants and is commonly used for human tissues.21 Each term of the dielectric relaxation is then described by| | 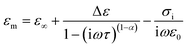 | (10) |
where ε∞ is the high frequency permittivity at ωτ ≫ 1, Δε = εstatic − ε∞ is the magnitude of dispersion, with εstatic being the permittivity at ωτ ≪ 1, τ is the relaxation time constant, and finally α is the distribution parameter characteristic for the Cole–Cole model, which specifies the symmetrical broadening of the dielectric loss peak. Over a wide frequency range, several relaxations are expected, and thus several terms of (10) are required. In this study, we use the parameter values acquired by Gabriel et al.22 for healthy human tissues and those by Lazebnik et al.23 for breast cancer tissue.
2.4 Dielectric function of the coating
In the majority of the cases studied in this paper, the permittivity of the dielectric surface coating on the NPs is described by a simple dielectric function with a constant real part and dispersive imaginary part| |  | (11) |
where σc is the conductivity of the coating. However, when modelling a surface coating of carbohydrate ligands, the Cole–Cole model (10) is more appropriate to use than (11).24
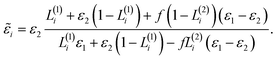
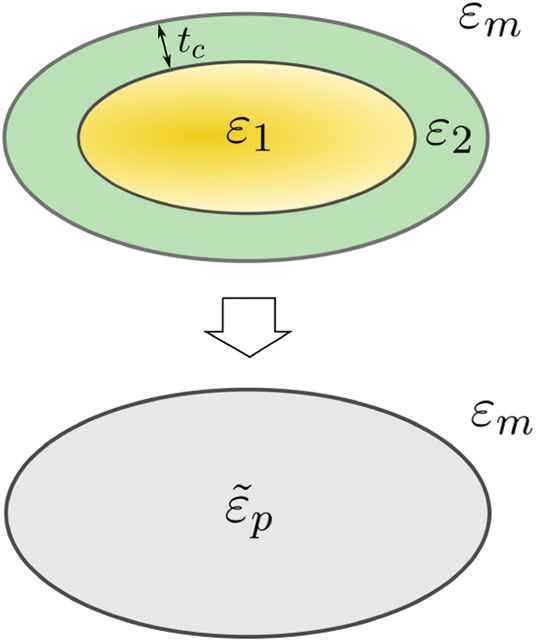
2.5 Absorption cross section of a coated ellipsoid
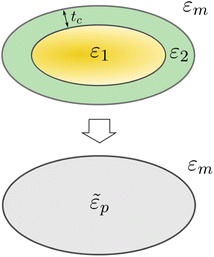
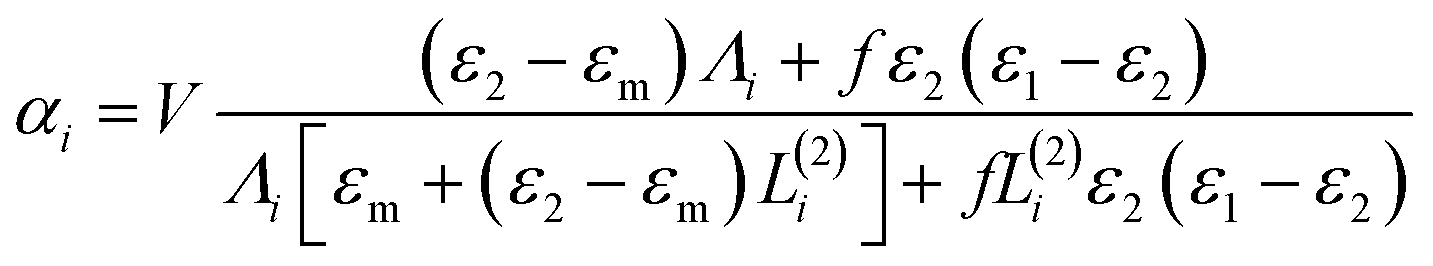
Consider a coated ellipsoid in a lossy medium with permittivity εm as in Fig. 2. Let the inner ellipsoid with permittivity ε1 have semi-axes a11, a12, a13, and let the outer ellipsoid with permittivity ε2 have semi-axes a21, a22, a23. Assuming the NP is small compared to the wavelength, we can approximate the particle as a dipole with polarizability α.25 When the electric field is aligned with the ith semi-axis of the NP, we obtain the polarizability of the coated ellipsoid as25| | 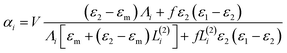 | (12) |
with| | | Λi = ε2 + (ε1 − ε2)(L(1)i − fL(2)i), | (13) |
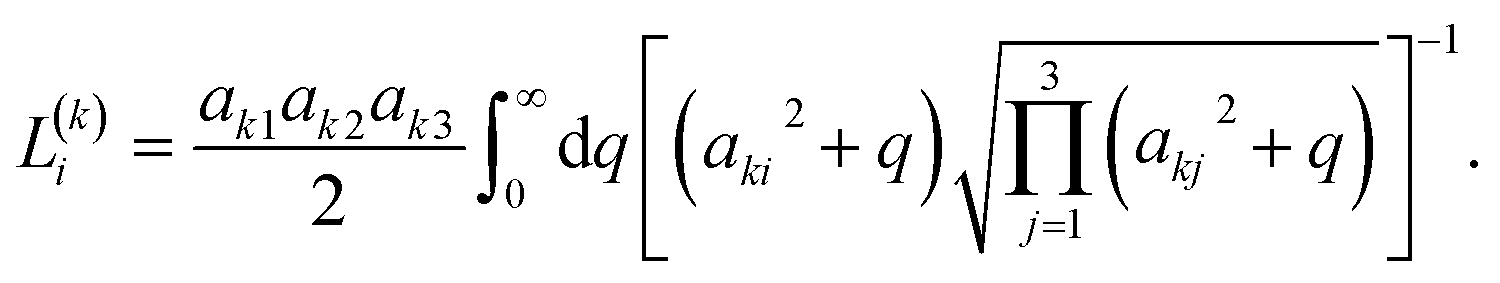
where V = 4πa21a22a23/3 is the outer volume of the particle, and f = (a11a12a13)/(a21a22a23) is the fraction of the total volume occupied by the inner ellipsoid. The geometrical factors L(1)i and L(2)i of the inner and outer ellipsoids are calculated from| | 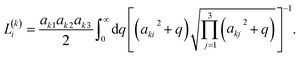 | (14) |
 |
| | Fig. 2 A coated ellipsoid with core permittivity ε1 and shell permittivity ε2 can be approximated by a single effective permittivity ![[small epsilon, Greek, tilde]](https://www.rsc.org/images/entities/i_char_e0de.gif) p. p. | |
All the ellipsoids in this study have at least two axes of equal length, meaning that two out of the three Li have the same values.
In order to simplify our calculations, we aim to derive an expression for the effective permittivity of the equivalent homogeneous ellipsoid with the same polarizability as the coated ellipsoid, see Fig. 2. We can do this using a similar method to the one by Chettiar and Engheta26 for the effective permittivity of a coated sphere. First, we calculate the polarizability of an anisotropic homogeneous ellipsoid with semi-axes a21, a22, a23 and principal permittivities i aligned with its semi-axes. Thus we obtain25
| | 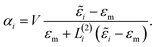 | (15) |
Finally, we obtain the expression for the effective permittivity of the coated ellipsoid by equating (12) and (15), resulting in
| |  | (16) |
This result matches the effective permittivity of a coated ellipsoid under the effect of a uniform field derived by Giordano et al.15
Since the effective ellipsoid has the same polarizability as the coated ellipsoid, we know that the absorption cross section of the coated ellipsoid is the same as that of the effective ellipsoid if the surrounding medium is non-absorbing.25 We therefore assume that this is the case in an absorbing medium as well. In that case, we can obtain an expression for the absorption cross section of the coated ellipsoid by calculating the equivalent for the effective homogeneous ellipsoid. The absorption cross section of an isotropic homogeneous ellipsoid in an absorbing medium has been derived by Dalarsson et al.13 Following a similar derivation using the anisotropic effective permittivity (16), we get
| |  | (17) |
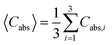
We are primarily interested in results closely matching the conditions for a collection of NPs in human tissue. Such particles are assumed to be randomly oriented, so we are therefore interested in the average absorption cross section 〈Cabs〉 across all particle orientations. This can be calculated as
| |  | (18) |
In order to measure the differential heating by the NPs compared to the surrounding tissue we use the relative absorption ratio Fabs,
| |  | (19) |
where
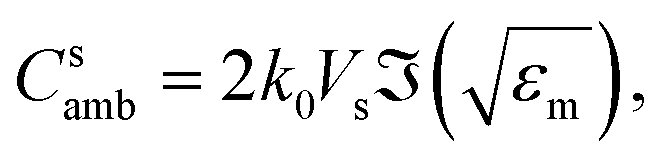
| |  | (20) |
is the absorption cross section of the surrounding tissue of identical volume
V. Differential heating occurs when
Fabs > 1, meaning that the absorption in the coated NP is greater than the absorption in the ambient medium.
When we investigate the resistive Joule heating of coated AuNPs in a biological tissue, the inner ellipsoid is labelled as ε1 → εp, being the dielectric function of the shape-dependent Drude model (1) where the appropriate effective mean free path depends on whether the NP shape is spherical, prolate, or oblate. The outer ellipsoid is henceforth labelled as ε2 → εc with dielectric functions (11) or (10) depending on the study. A coated ellipsoid with coating thickness tc refers to the coated ellipsoid with inner semi-axes a1i and outer semi-axes a2i = a1i + tc, i ∈ {1, 2, 3}. Thus, a coated prolate spheroid has inner diameter D, inner length L, outer diameter D + 2tc and outer length L + 2tc. The inner core of a coated oblate spheroid has thickness T and diameter D, with outer thickness T + 2tc and outer diameter D + 2tc.
2.6 Multiple particle absorption
A more realistic approach to the medical application is to consider the absorption of multiple NPs within the tissue. A simple approach to this is to apply the theory from Section 2.5 to reasonable quantities of multiple NPs in a studied volume of the tissue. Here we assume that the distance between particles is sufficiently large, such that single-particle scattering can be assumed.25 This assumption is highly applicable to coated NPs, since it has been shown that the presence of ligands prevents clustering and accumulation of the NPs. In this scenario, the total absorption cross section of all particles in the suspension can be obtained by summing the absorption cross sections of the individual NPs. If we denote the average absorption cross section of a single particle as 〈Cnpabs〉 and let the number of particles be N, then the total absorption cross section of all particles is N〈Cnpabs〉.
The total absorption cross section of the suspension volume without the nanoparticles present is
| |  | (21) |
where
Vs is the volume of the suspension. With
N nanoparticles with volume
V present in the tissue, we must subtract the portion of the ambient that is now occupied by the NPs from the total absorption cross section of the ambient medium. This gives
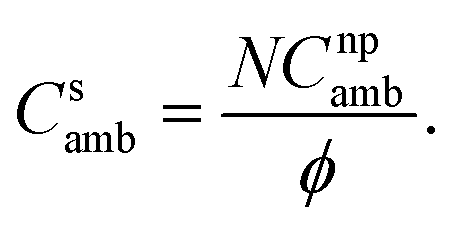
| | | Csamb − NCnpamb = (1 − ϕ)Csamb, | (22) |
where
Cnpamb is given by
(20) and the volume fraction
ϕ =
NV/
Vs is introduced. The total absorption cross section of nanoparticles and tissue can then be expressed as
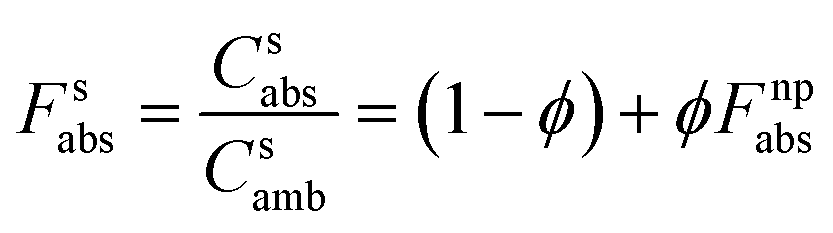
| | | Csabs = N〈Cnpabs〉 + (1 − ϕ)Csamb. | (23) |
The relative absorption ratio of the particle suspension is then
| |  | (24) |
where
Fnpabs is the relative absorption ratio of a single NP given by
(19). In deriving
(24), we have used the volume fraction together with
(20) and
(22) to express that
| |  | (25) |
3 Results
3.1 Relative absorption of a coated sphere
The relative absorption ratio of a coated gold sphere in tissue is here calculated using (19). The effective permittivity of the NP is calculated using (16), which is reduced to a simpler form, due to that all the geometrical factors become 1/3 for spheres. The dielectric function of the gold core (1) is attained with parameters ωp = 2.18 PHz and γ0 = 6.45 THz from ref. 27, and vF = 1.4 × 10⁶ m s−1 from ref. 28. The dielectric function of the coating (11) assumes a constant real-part  . In Fig. 3, the relative absorption ratio as a function of coating conductivity is plotted for a 10 nm diameter gold core coated with a 1 nm thick lossy dielectric material surrounded by thyroid tissue as the ambient at 1 GHz. For most values of σc, the addition of the thin coating increases the relative absorption by several orders of magnitude. This agrees with the results already established by Hanson and Patch,12 where a coated gold sphere in a lossless medium was studied. The relative absorption ratio peaks when the coating conductivity is around 1 S m−1. Around this peak, Fabs > 1, meaning that the gold nanosphere achieves differential heating compared to the surrounding tissue. Specifically, Fabs = 5.14 at σc = 1 S m−1 which can be compared to Fabs = 1.52 × 10⁻⁵ for the uncoated nanosphere. On the other hand, as can be seen from Fig. 3, the relative absorption ratio is lower than the uncoated sphere for coatings that are either highly conducting σc > 107 S m−1 or poorly conducting σc < 10−6 S m−1.
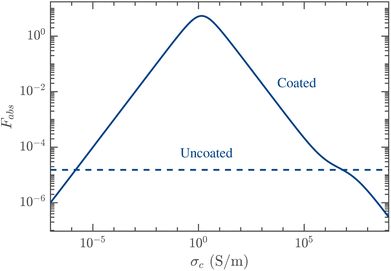 |
| | Fig. 3 Relative absorption ratio as a function of coating conductivity for a spherical AuNP relative to thyroid tissue. The sphere has diameter D = 10 nm, coating thickness 1 nm and coating permittivity  , at 1 GHz frequency. The dashed line represent the relative absorption ratio for an uncoated particle. , at 1 GHz frequency. The dashed line represent the relative absorption ratio for an uncoated particle. | |
3.2 Relative absorption of a coated prolate and nanowire
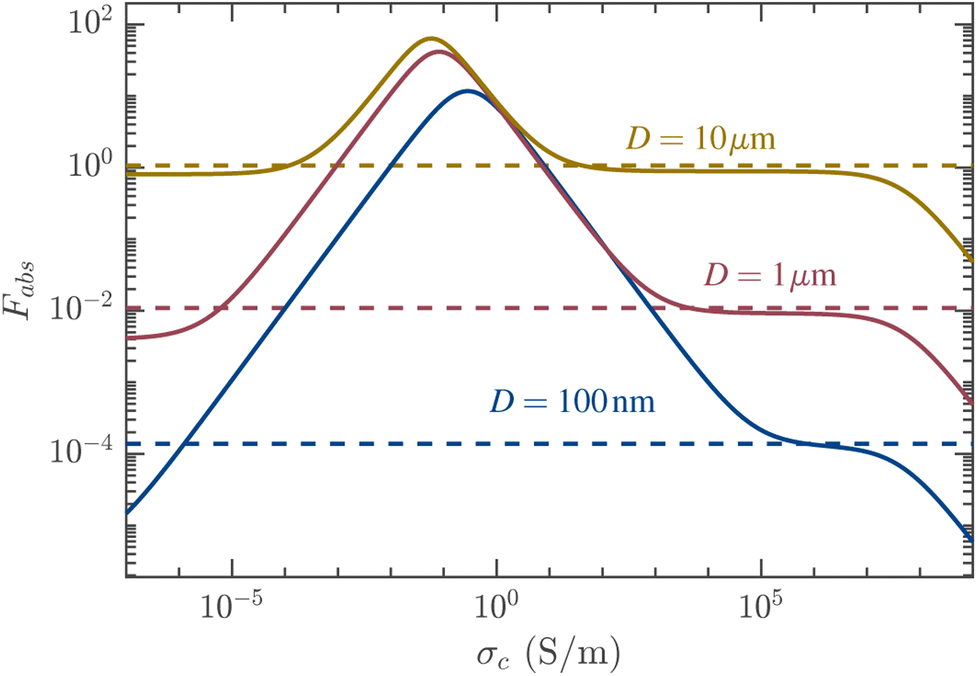
In Fig. 4, the relative absorption ratio Fabsversus coating conductivity σc at 1 GHz is plotted for three different coated prolate spheroids with lengths 100 nm, 1 μm and 10 μm, with the same diameter D = 10 nm and coating permittivity  . These prolates correspond to nanowires as their aspect-ratios are so large that they satisfy the eccentricity limit e → 1 leading to (9). Furthermore, the ambient medium is assumed to be thyroid tissue.
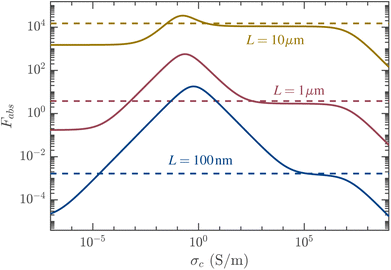 |
| | Fig. 4 Relative absorption ratio as a function of coating conductivity for a prolate AuNP with L = 100 nm, and two nanowires with L = {1, 10} μm, relative to thyroid tissue. All cases have diameters D = 10 nm, coating thickness 1 nm, coating permittivity  , and varying lengths L, at 1 GHz frequency. , and varying lengths L, at 1 GHz frequency. | |
We see from Fig. 4 that the presence of a dielectric coating improves the differential heating in for all three particles around an optimal value of the conductivity σc. However, for the higher eccentricities, we observe a smaller maximum increase in Fabs for the same coating thickness. The range of values of σc for which the coated particle has greater absorption than the uncoated particle is also smaller. For low conductivities, the relative absorption ratio appears to approach a constant value in the parameter range studied. This value is a decrease in Fabs by approximately a factor 10 for L = 10 μm compared to the uncoated case, with a greater decrease for lower eccentricities. Note from the figure that the decrease becomes larger relative to the maximum increase, with increasing L. For high conductivities, we observe that Fabs reaches a plateau close to that of the uncoated particle, but starts decreasing again after σc ≈ 1 × 10⁷ for all particle lengths.
3.3 Relative absorption of a coated oblate
In Fig. 5, we plot the relative absorption ratio Fabs against the coating conductivity σc for three coated oblate spheroids with diameters 10 nm, 1 μm and 10 μm, and thickness T = 10 nm with coating permittivity  in thyroid tissue at 1 GHz. Here we observe a similar result to that of the prolate spheroids in Fig. 4. For oblate spheroids with low coating conductivities, the decrease in Fabs compared to the uncoated case is less than for prolate spheroids, only decreasing by approximately 20% for D = 10 μm. For high conductivities on the other hand, the behaviour is similar between the two particle types, with a plateau in Fabs close to that of the uncoated particles. Notably, for D = 1 μm and D = 10 μm, the peaks in Fabs are comparable even though the values for the uncoated particles differ by a factor 100. The most notable observation from Fig. 5, however, is that the presence of a dielectric coating with appropriate conductivity results in differential heating, although still moderate, whereas the uncoated case reported in ref. 7 does not. For example, Fabs > 1 for the D = 100 nm case with coating conductivities between 10−2 S m−1 and 101 S m−1 at the selected frequency, reaching a maximum at Fabs = 11.7 when σc = 0.3 S m−1.
 |
| | Fig. 5 Relative absorption ratio as a function of coating conductivity for three different oblate AuNPs relative to thyroid tissue. The oblates have thickness T = 10 nm, coating thickness 1 nm, coating permittivity  , and varying diameters D, at 1 GHz frequency. , and varying diameters D, at 1 GHz frequency. | |
3.4 Dependency of Fabs on coating parameters
The impact of the coating parameters is studied in Fig. 6, specifically the coating thickness tc, conductivity σc, and real-part permittivity  , for a prolate spheroid with D = 10 nm, L = 10 μm and an oblate spheroid with T = 10 nm, D = 10 μm. For both NP types, we plot Fabs against the coating thickness tc and σc with
  , and Fabs against σc and
  with tc = 1 nm. From the figure, it is clear that there exists a region of optimal values of tc and σc such that Fabs is maximized. The optimal coating thickness differs between the two particles, being approximately 1 nm for the prolate spheroid and approximately 10 nm for the oblate spheroid. As tc → 0, the relative absorption Fabs evens out across the parameter space, tending toward the value of the uncoated particles, as expected. It can also be observed that as the permittivity
  increases, the optimal value for σc increases while the corresponding peak in Fabs decreases. For the prolate spheroid, an increase in
  leads to a higher Fabs for lower conductivities, evening out the overall response.
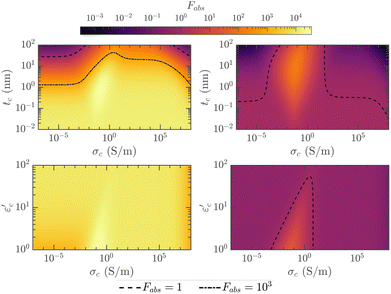 |
| | Fig. 6 Relative absorption ratio of AuNPs in thyroid tissue as a function of coating conductivity σc, coating thickness tc, and permittivity  , at frequency f = 1 GHz. Left column: coated prolates with D = 10 nm and L = 10 μm. Right column: coated oblates with T = 10 nm and D = 10 μm. The top subfigures show the coating thickness and conductivity variation of Fabs for a fixed value of , at frequency f = 1 GHz. Left column: coated prolates with D = 10 nm and L = 10 μm. Right column: coated oblates with T = 10 nm and D = 10 μm. The top subfigures show the coating thickness and conductivity variation of Fabs for a fixed value of  . The bottom subfigures show the coating permittivity and conductivity variations of Fabs for fixed coating thickness tc = 1 nm. In all subfigures, isolines are used to indicate regions where Fabs > 1 and Fabs > 1000. . The bottom subfigures show the coating permittivity and conductivity variations of Fabs for fixed coating thickness tc = 1 nm. In all subfigures, isolines are used to indicate regions where Fabs > 1 and Fabs > 1000. | |
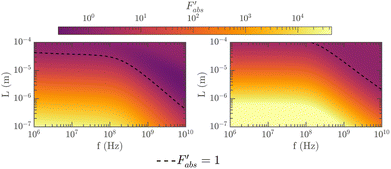
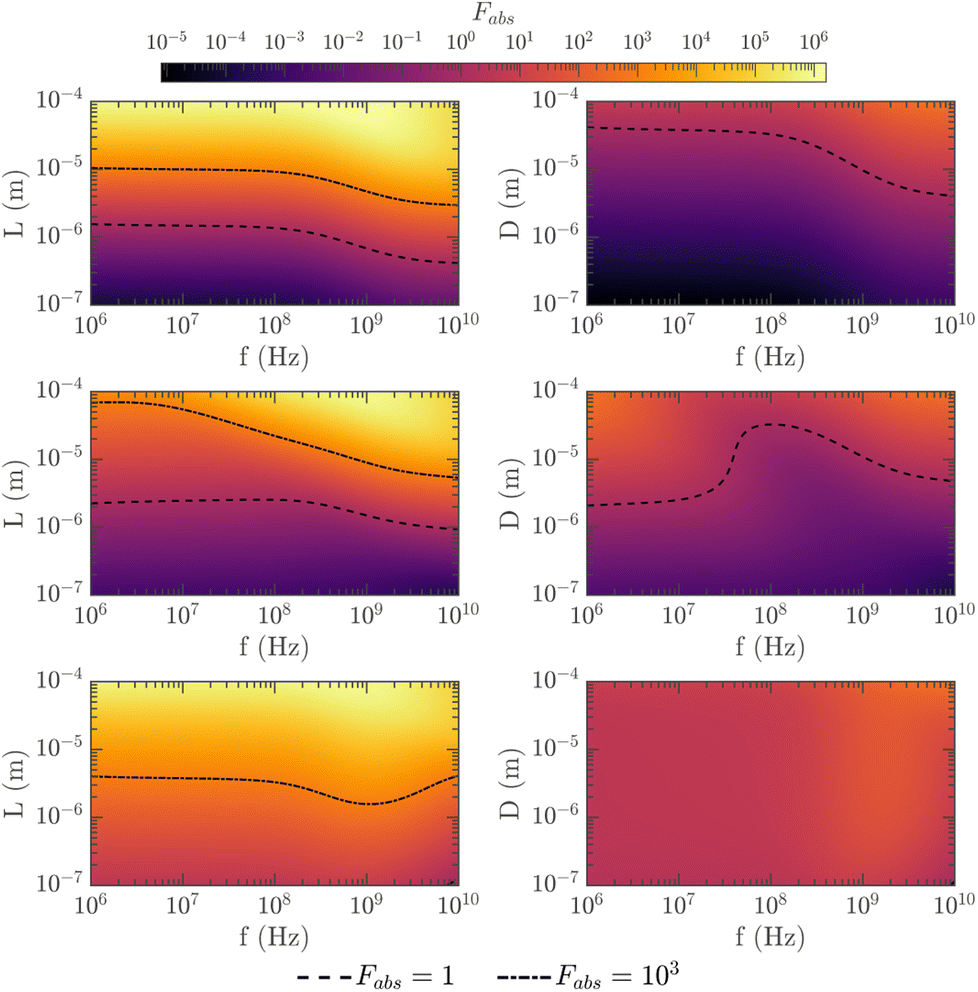
3.5 Dependency of Fabs on frequency and size
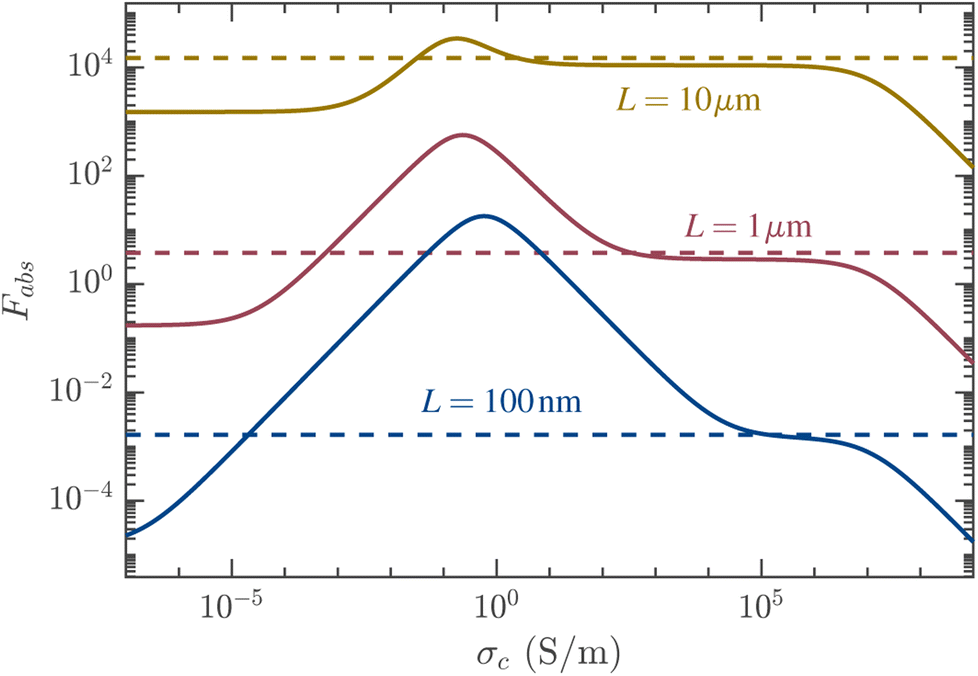
In Fig. 7, Fabs is plotted for prolate spheroids with varying length and fixed diameter D = 10 nm, and oblate spheroids with varying diameter and fixed thickness T = 10 nm, at frequencies ranging from 1 MHz to 10 GHz. Results are shown for particles with two different coatings, and compared to uncoated particles similar to Fig. 3(b) and 4(b) in ref. 7 for prolates and oblates, respectively. The first coating has tc = 1 nm,  , and a conductivity close to the optimal value from Fig. 4 and 5, i.e. at σc = 0.1 S m−1. The second coating has tc = 1 nm,
  , and a lower conductivity at σc = 10−5 S m−1. From 7, for σc = 0.1 S m−1 we see a significant increase in Fabs for lower frequencies and lower particle eccentricities compared to uncoated particles. The coated particles achieve differential heating for most of the parameter space. The largest increase in Fabs compared to the uncoated particles is seen for frequencies below 1 GHz for oblate spheroids with low eccentricities. On the other hand, for σc = 10−5 S m−1, we observe that for prolate spheroids, Fabs is reduced for higher eccentricities at frequencies below 100 MHz and for lower eccentricities at frequencies above 1 GHz. Overall, the portion of the parameter space for which Fabs > 1, is reduced compared to the uncoated prolate spheroids. For the oblate particles, we still see a significant increase in Fabs at frequencies below 100 MHz. We also observe that for both coating examples, Fabs remains mostly unchanged for very high particle eccentricities at frequencies above 100 MHz.
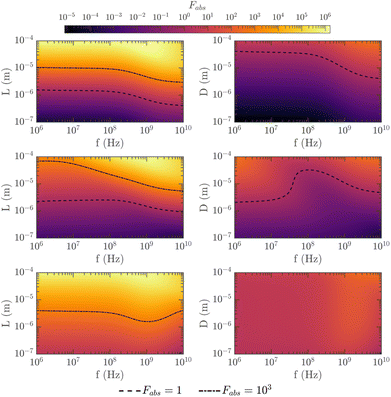 |
| | Fig. 7 Relative absorption ratio versus length L and frequency f for coated AuNPs in thyroid tissue. Left column: prolates with D = 10 nm. Right column: oblates with T = 10 nm. Top row: without coating. Middle row: with coating σc = 10−5 S m−1. Bottom row: with coating σc = 0.1 S m−1. In all subfigures, the coatings have tc = 1 nm and  . In all subfigures, isolines are used to indicate regions where Fabs > 1 and Fabs > 1000. . In all subfigures, isolines are used to indicate regions where Fabs > 1 and Fabs > 1000. | |
3.6 Comparison between coated and uncoated AuNPs
In Fig. 8 the relative absorption ratios of coated versus uncoated AuNPs are directly compared. That is, in this figure, we have calculated and plotted the ratio| | 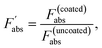 | (26) |
where F(coated)abs is found using (19) with a thin coating, while F(uncoated)abs are the equivalent uncoated cases, similar to Rommelfanger et al.,7 found using (19) with tc = 0. Two tissues are chosen to illustrate variability: breast fat, due to it being an outlier on the very lower end of dispersion magnitude for human tissues, and thyroid, since it has a higher dispersion magnitude similar to many other tissues in the human body. The values for the uncoated cases F(uncoated)abs used in Fig. 8 are thus equal to Fig. 3(b) and (i) in ref. 7. Fig. 8 clearly shows that the presence of a coating leads to increased absorption for most combinations of eccentricity and frequency. However, at high eccentricities and high frequencies, the absorption is either unchanged or slightly reduced, which are typically the regions of maxima in Fabs as can be seen in Fig. 7 and 11.
 |
| | Fig. 8 The ratio  of prolate AuNP with D = 10 nm illustrates clearly the threshold of prolate AuNP with D = 10 nm illustrates clearly the threshold  where the addition of coating results in either increased or decreased absorption compared to the uncoated case, when the surrounding medium is thyroid (left) and breast fat (right). Coating has parameters tc = 1 nm, where the addition of coating results in either increased or decreased absorption compared to the uncoated case, when the surrounding medium is thyroid (left) and breast fat (right). Coating has parameters tc = 1 nm,  , σc = 0.1 S m−1. In both subfigures, isolines indicate regions where , σc = 0.1 S m−1. In both subfigures, isolines indicate regions where  as defined in (26) is greater than 1. as defined in (26) is greater than 1. | |
It should be noted that the coating dispersion in these examples is unrealistically taken to be vacuum  . If we instead choose a coating permittivity with a real part similar (but slightly lower in order to create a contrast) to the surrounding medium, say
 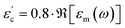 , then Fig. 8 would still show the same conclusion but with an even further shrinked region of increased absorption (isoline pulled down and shifted left). So, plotting with
  really shows the best-case scenario.
In Fig. 9, the coating parameters tc and σc are studied, similar to the top plots of Fig. 6, but here calculated from (26). Thereby, we aim to assess the change in relative absorption due to the presence of a coating with thickness tc and conductivity σc compared to the relative absorption in an equivalent uncoated AuNP. Interestingly, we see from Fig. 9 that oblate AuNPs experience the largest change in absorption with the addition of a dielectric coating. Differential heating is achieved for coatings with conductivity between 10−5 < σc < 105 S m−1, regardless of thickness. Recall, however, that the differential heating in oblates is still considerably lower than prolates, as already established by Fig. 6 and 7. For both the prolate and oblate AuNPs, the largest increase in relative absorption at 1 GHz is achieved for a coating conductivity around 0.1 S m−1. In Fig. 9, both thyroid tissue and breast fat as the surrounding medium is calculated to illustrate the effect that the ambient has on the absorption. Breast fat tissue allows differential heating for a wider spectrum of coating parameters, due to its lower magnitude of permittivity compared to thyroid tissue.
 |
| | Fig. 9 Ratio of absorption cross sections between coated and uncoated AuNPs in thyroid tissue as a function of coating conductivity σc and coating thickness tc, with ε′ = 1 at frequency f = 1 GHz, using (26). Left figures are prolates with D = 10 nm and L = 10 μm, right figures are oblates with T = 10 nm and D = 10 μm. Top figures use thyroid as the surrounding medium, while bottom figures use breast fat. | |
3.7 Numerical simulation
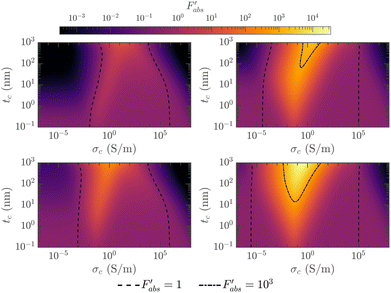
A numerical finite element model was developed in COMSOL Multiphysics in an effort to validate the analytical investigation. It should be noted that the analytical method presented in this paper on the absorption of coated NPs assumes the electrostatic approximation, which does not consider retardation effects and structural inhomogeneities. A full-wave simulation accounts for these, however, and thus a numerical finite element model can provide insight into the legitimacy of the assumptions made in the analytical derivation.
Two models were tested: one in COMSOL's ACDC module where electrostatics is enforced, and the other one in COMSOL's RF module which provides full-wave calculations. We performed the following parametric studies in COMSOL: absorption cross section of a coated gold prolate spheroid as a function of coating conductivity, coating thickness, particle length (eccentricity), and frequency. However, due to page limitations of the present paper, only the result of the absorption cross section of a coated gold prolate spheroid plotted against coating conductivity is shown here, in Fig. 10. The top part of Fig. 10 also illustrates the magnitude of the electric field inside a prolate spheroid. For visibility reasons, the particle dimensions for the top subfigure has low eccentricity (D = 10 nm, L = 30 nm, tc = 2 nm) and therefore does not correspond to the prolate studied in the bottom subfigures. However, the field distribution shown in the top subfigure is representative for prolate spheroids in general, regardless of eccentricity. The simulation run-time was 18 seconds (wall clock) per iteration on a laptop computer with i5-10310U CPU and 16 GB RAM.
 |
| | Fig. 10 Top: Electric field distribution within cross-sections of a coated prolate. Bottom: Absorption cross section of a coated gold prolate spheroid with diameter D = 10 nm and length L = 10 μm versus coating conductivity in thyroid tissue at 1 GHz, calculated numerically with COMSOL's ACDC module and analytically. The coating is tc = 1 nm thick with permittivity  . . | |
For all the performed parameter studies, the results obtained from the ACDC simulations are in excellent agreement with the analytical results. This can be expected though, since the ACDC module enforces electrostatics. The RF simulations, on the other hand, provides full-wave calculations. Also in the case of the RF simulations, we obtained a very good agreement with the analytical results for coated NPs. For all the abovementioned parameter studies, the relative error between simulated and analytical absorption cross section was satisfyingly low, although slightly higher than the ACDC module. Due to space limitations however, we can not repeat all the results here. We did however note that the RF model is more sensitive to particle size, and required larger NP sizes to avoid convergence issues.
3.8 Multiple particle absorption
The relative absorption for multiple particles suspended in tissue is presented in Fig. 11, calculated using (24). Here, Fsabs is plotted for prolate spheroids of varying lengths suspended in thyroid tissue with volume fraction ϕ = 10−3, at frequencies ranging from 1 MHz to 10 GHz, similar to Fig. 7. From (24) we see that in order to achieve a significant differential heating of the particle suspension of Fsabs = 2 or higher, the relative absorption ratio of the individual particles needs to be greater than (1 + ϕ−1). For a volume fraction of ϕ = 10−3, this means that the threshold is Fnpabs ≳ 103. A glance at Fig. 7 shows that this is not the case for oblate spheroids. For this reason, particle suspensions containing oblate spheroids have not been included in Fig. 11. In Fig. 11, the result for uncoated particles is compared to the results for three different coated particles with coating conductivities σc = {0.1, 0.01, 10−5} S m−1. For σc = 0.01 S m−1 and σc = 0.1 S m−1 we see that significant differential heating (Fsabs > 2) of the particle suspension occurs for lower frequencies and smaller particle aspect ratios compared to uncoated particles. On the other hand, for σc = 10−5 S m−1, absorption is decreased compared to uncoated particles, especially for frequencies below 100 MHz.
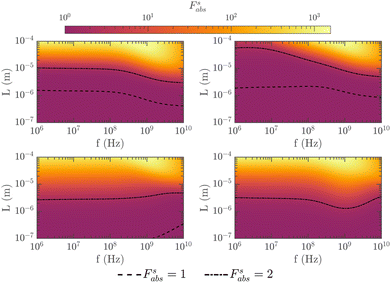 |
| | Fig. 11 Multiple particle absorption. Relative absorption ratio for prolate spheroids with D = 10 nm with respect to length L and frequency f suspended in thyroid tissue at volume fraction ϕ = 10−3. Top left: no coating. Top right: with coating σc = 10−5 S m−1. Bottom left: with coating σc = 10−2 S m−1. Bottom right: with coating σc = 10−1 S m−1. All coatings have tc = 1 nm,  . . | |
3.9 Thermal analysis
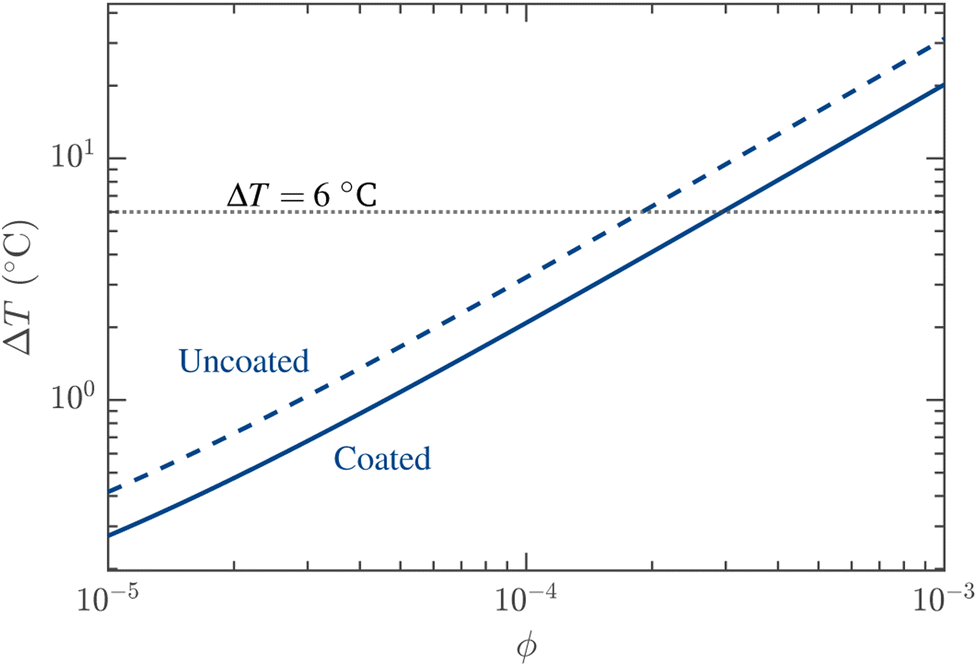
A thermal study was performed using the bioheatExact function in the k-Wave MATLAB toolbox,29 which solves the three-dimensional Pennes bioheat equation with the absorption cross section of the AuNPs (18) and the ambient medium cross-section (20) as inputs. The example considered here is a 2 mm3 bolus injection of prolate AuNPs with diameter D = 10 nm and lengths L at volume fraction ϕ = 10−3. These parameters were chosen based on the most promising results from the previous sections, at 1 GHz frequency: coating thickness tc = 1 nm, coating permittivity  and coating conductivity σc = 0.1 S m−1. The thermal properties for thyroid tissue was taken from ref. 30. The 2 mm3 sphere of injected thyroid and the surrounding normal thyroid tissue were exposed to a 300 V m−1 electric field over 10 seconds. The temperature increase of the surrounding healthy thyroid tissue with these settings remained a steady 0.1 °C throughout the results presented here. The results of the temperature change measured at the center of the injection volume is shown in Fig. 12. Cells are known to undergo aptosis at 43 °C and necrosis occurring at 50 °C or higher,31 meaning that the minimum differential heating of the body temperature needed for cell death is 6 °C. With the given parameters, Fig. 12 shows that this is achievable when L ≥ 24 μm for uncoated AuNPs, and L ≥ 30 μm for coated AuNPs.
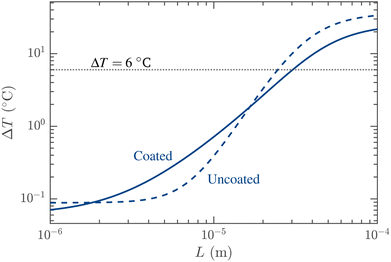 |
| | Fig. 12 Change in local temperature from body temperature 37 °C measured at the center of a 2 mm3 volume of thyroid tissue injected with prolate AuNPs with diameter D = 10 nm, length L, and particle concentration ϕ = 10−3. Horizontal dotted line represent the minimum temperature increase to achieve cell aptosis. | |
Based on the discussion in Section 3.6 regarding Fig. 8, more heating is expected for larger particle aspect-ratios when the prolates are uncoated rather than coated, which is also observed here in Fig. 12. At the same time, one would expect higher ΔT for coated prolates at moderate lengths, which is seen here as well for 2 μm < L < 16 μm. However, the actual temperature increase in this region of increased absorption due to coating is very small, below 1 °C.
As discussed in Section 3.8, the differential heating within the injected tissue becomes greater than the differential heating in the surrounding normal tissue approximately when Fnpabs ≥ ϕ−1. For this case in Fig. 12, where ϕ = 10−3, the power absorption in the injection volume is larger than the power absorption in the ambient tissue when the NP lengths are greater than L = 1.3 μm for the coated case, and L = 4.7 μm for the uncoated case. This can also be seen in Fig. 7 top-left and bottom-left plots where Fnpabs surpasses 103 for L at 1 GHz. However, even though the power absorption is larger in the injection volume than in the ambient tissue at these lengths L, the actual temperature increase is negligible, around 0.1 °C as can be seen in Fig. 12.
In Fig. 13, the Pennes bioheat equation has similarly been solved as a function of particle concentration ϕ, where the parameters are chosen based on the example in Fig. 12 with the highest differential temperature, i.e. L = 100 μm. Sufficient temperature increase is gained for ϕ > 2 × 10⁻⁴ for uncoated AuNPs, and ϕ > 3 × 10⁻⁴ for uncoated AuNPs. For this particular particle size, the uncoated AuNPs always achieve more heating compared to the coated AuNPs, with respect to volume fraction. If we instead plot Fig. 13 for other particle lengths, for example 2 μm < L < 16 μm at the same frequency and other parameters, then the coated particle achieves more heating. However, similarly to Fig. 12, the change in temperature is very small, or even negligible.
 |
| | Fig. 13 Change in local temperature from body temperature 37 °C measured at the center of a 2 mm3 volume of thyroid tissue injected with prolate AuNPs with diameter D = 10 nm, length L = 100 μm, and particle concentration ϕ. Horizontal dotted line represent the minimum temperature increase to achieve cell aptosis. | |
3.10 Differential heating in breast cancer with carbohydrate-functionalized prolate AuNPs
NPs functionalized with carbohydrate surface ligands have shown promising rate of cellular uptake,18 owing to the cancer cells overexpressing glycolytic enzymes and glucose transporters compared to normal tissue.32 Here, we present the results of a thermal analysis of gold nanowires coated with carbohydrate ligands, where the complex coating permittivity εc now follows a Cole–Cole model (10) for an aqueous solution of D-glucose24 instead of the simple formula (11). Additionally, for this example the surrounding tissue εm is breast cancer, also based on a dispersive Cole–Cole model23 with thermal properties as used in ref. 33. The same field strength and tissue volume as in Section 3.9 is used. In this case, for a gold nanowire with 10 nm diameter and 1 nm thick surface coating at volume fraction ϕ = 10−3, a change of over 6 °C of local temperature at 1 GHz was achieved when L > 28 μm.
4 Discussion
Even though the relative absorption ratio Fabs for most configurations of coated AuNP size and frequency is generally increased compared to the uncoated cases, the maximum values of Fabs for uncoated AuNPs, that occur for prolate particles, are higher than the maximum Fabs for the corresponding coated prolate AuNPs. This implies that the optimal parameters for differential heating for uncoated parameters in ref. 7 are less effective than anticipated when taking into account a thin surface coating. In Sections 3.9 and 3.10, we studied concentrations of AuNPs that may achieve the necessary differential heating for cell aptosis or necrosis, with approximate examples of ligand properties. The required change in local temperature was achieved for prolate particles in tens of micrometers in length, assuming a volume fraction in the order of 10−3. It should be noted that a volume fraction of this magnitude is an optimistic estimate. While a sufficiently high magnitude of volume fraction is required for achieving differential heating, it is at the same time necessary to limit ϕ due to that high concentrations of AuNPs may exceed toxic levels.8 The toxicity of AuNPs depends on the type of ligands used, and for each type the maximum dosage may vary. The toxicity is also size dependent because of the presence of the surface coated with ligands, as a larger particle has a larger surface-area-to-volume ratio.34,35 It is therefore complicated to determine a maximum volume fraction ϕ for ligand types that can be used in a numerical example. In general, the volume fraction values throughout this paper do not take into account the safety limits of toxicity related to the biodistribution. Such a limit has been suggested to be around 100 μg ml−1,36 which for a 5 nm size AuNP including a ligand coating and a small gold core corresponds to approximately ϕ = 2 × 10⁻⁶. As future work building on this study, a parameter study on the maximum permissible volume fraction ϕ with respect to the toxicity limits, should be performed.
We have seen that ellipsoidal AuNPs with diameters in tens of nanometers and lengths stretching into micrometers may achieve significant Joule heating. With an aspect ratio of around 1000, these dimensions equate to nanowires. Last but not the least, while the analysis based on Fabs favours that coated AuNPs perform better for moderate aspect-ratios compared to uncoated AuNPs, the thermal analysis shows a negative result for the coated particles: the increase in Fabs due to coating is not sufficient enough to translate to any substantial change in temperature for moderate aspect-ratios.
5 Conclusion
The relative absorption ratio of coated ellipsoidal gold nanoparticles in human tissue has been analytically examined using an effective medium model for a coated ellipsoid in the electrostatic approximation. The electromagnetic absorption due to the dielectric coating was studied over a broad range of parameter values. Thus, the findings presented here may also be applied to other applications involving coated ellipsoids in lossy media, in the same way as for the medical application under investigation here. Both the case of a single nanoparticle and the case of a suspension of nanoparticles were studied, in addition to translating the absorption cross section results to a thermal analysis. The analytical results were confirmed by numerical simulations, proving that the analytical description of coated nanoparticles in the electrostatic approximation is valid to the degree shown in this report.
It was found that the addition of a thin coating can significantly improve the absorption of ellipsoidal and nanowire AuNPs, but the effect is heavily dependent on the electromagnetic properties of the coating, the shape of the NPs and the operational frequency. For certain coating materials we observe that, compared to uncoated particles, differential heating can occur at lower frequencies and smaller aspect ratios compared to earlier works. This is potentially useful in hyperthermia treatment, since these particle shapes may be more practical to manufacture, and lower frequencies have longer penetration depth into tissue. However, our thermal analysis on the absorption cross section reveals that the additional absorption translates to only a very small change in temperature for parameters relevant to the medical application. Furthermore, the NP parameter configurations that lead to the greatest change in local temperature for uncoated AuNPs (extremely elongated prolates; nanowires) experience smaller temperature change after the addition of a coated surface layer.
In conclusion, the addition of coating and choice of AuNP aspect ratio significantly impacts the overall response of the RF absorption, and must be taken properly into account when evaluating the potential of such NPs for RF hyperthermia cancer treatment. Thus, the findings in the present paper provide a valuable tool to optimize the coated AuNP design parameters, in order to secure clinically useful differential heating.
Author contributions
Conceptualization, B. B. S. and M. D.; methodology, B. B. S. and M. D.; software, B. B. S., O. H. and R. T.; validation, B. B. S., O. H. and R. T.; formal analysis, B. B. S., M. D., O. H. and R. T.; investigation, M. D., B. B. S., O. H. and R. T.; resources, M. D.; data curation, O. H., R. T. and B. B. S.; writing—original draft preparation, B. B. S. and M. D.; writing—review and editing, M. D. and B. B. S.; visualization, B. B. S., O. H. and R. T.; supervision, M. D. and B. B. S.; project administration, M. D.; funding acquisition, M. D. All authors have read and agreed to the published version of the manuscript.
Conflicts of interest
There are no conflicts to declare.
Acknowledgements
The work of M. D. was supported by the Swedish Research Council (VR) under project number 2018-05001.
Notes and references
- X. Liu, H.-j. Chen, X. Chen, Y. Alfadhl, J. Yu and D. Wen, Appl. Phys. Rev., 2015, 2, 011103 Search PubMed.
- C. B. Collins, R. S. McCoy, B. J. Ackerson, G. J. Collins and C. J. Ackerson, Nanoscale, 2014, 6, 8459–8472 RSC.
- D. K. Chatterjee, P. Diagaradjane and S. Krishnan, Ther. Delivery, 2011, 2, 1001–1014 CrossRef CAS PubMed.
- G. W. Hanson, R. C. Monreal and S. P. Apell, J. Appl. Phys., 2011, 109, 124306 CrossRef.
- S. Nordebo, M. Dalarsson, Y. Ivanenko, D. Sjöberg and R. Bayford, J. Phys. D: Appl. Phys., 2017, 50, 155401 CrossRef.
- C. B. Collins, M. A. Tofanelli, S. D. Noblitt and C. J. Ackerson, J. Phys. Chem. Lett., 2018, 9, 1516–1521 CrossRef CAS PubMed.
- N. J. Rommelfanger, Z. Ou, C. H. Keck and G. Hong, Phys. Rev. Appl., 2021, 15, 054007 CrossRef CAS PubMed.
- A. K. Narasimh, G. Chakaravarthi, M. S. R. Rao and K. Arunachalam, Electromagn. Biol. Med., 2020, 39, 183–195 CrossRef PubMed.
- A. Heuer-Jungemann, N. Feliu, I. Bakaimi, M. Hamaly, A. Alkilany, I. Chakraborty, A. Masood, M. F. Casula, A. Kostopoulou, E. Oh, K. Susumu, M. H. Stewart, I. L. Medintz, E. Stratakis, W. J. Parak and A. G. Kanaras, Chem. Rev., 2019, 119, 4819–4880 CrossRef CAS PubMed.
- Z. R. Goddard, M. J. Marín, D. A. Russell and M. Searcey, Chem. Soc. Rev., 2020, 49, 8774–8789 RSC.
- Q. Ong, Z. Luo and F. Stellacci, Acc. Chem. Res., 2017, 50, 1911–1919 CrossRef CAS PubMed.
- G. W. Hanson and S. K. Patch, J. Appl. Phys., 2009, 106, 054309 CrossRef.
- M. Dalarsson, S. Nordebo, D. Sjöberg and R. Bayford, J. Phys. D: Appl. Phys., 2017, 50, 155401 CrossRef.
- S. Gabriel, R. W. Lau and C. Gabriel, Phys. Med. Biol., 1996, 41, 2251–2269 CrossRef CAS PubMed.
- S. Giordano, P. L. Palla and L. Colombo, Eur. Phys. J. B, 2008, 66, 29–35 CrossRef CAS.
- L. Song, N. Falzone and K. A. Vallis, Int. J. Radiat. Biol., 2016, 92, 716–723 CrossRef CAS PubMed.
- G. Liang, X. Jin, S. Zhang and D. Xing, Biomaterials, 2017, 144, 95–104 CrossRef CAS PubMed.
- T. Lund, M. F. Callaghan, P. Williams, M. Turmaine, C. Bachmann, T. Rademacher, I. M. Roitt and R. Bayford, Biomaterials, 2011, 32, 9776–9784 CrossRef CAS PubMed.
- E. A. Coronado and G. C. Schatz, J. Chem. Phys., 2003, 119, 3926–3934 CrossRef CAS.
- U. Kreibig and L. Genzel, Surf. Sci., 1985, 156, 678–700 CrossRef CAS.
- K. Foster and H. Schwan, Crit. Rev. Biomed. Eng., 1989, 17, 25–104 CAS.
- S. Gabriel, R. W. Lau and C. Gabriel, Phys. Med. Biol., 1996, 41, 2271–2293 CrossRef CAS PubMed.
- M. Lazebnik, D. Popovic, L. McCartney, C.
B. Watkins, M. J. Lindstrom, J. Harter, S. Sewall, T. Ogilvie, A. Magliocco, T. M. Breslin, W. Temple, D. Mew, J. H. Booske, M. Okoniewski and S. C. Hagness, Phys. Med. Biol., 2007, 52, 6093 CrossRef PubMed.
- K. Fuchs and U. Kaatze, J. Phys. Chem. B, 2001, 105, 2036–2042 CrossRef CAS.
-
C. F. Bohren and D. R. Huffman, Absorption and Scattering of Light by Small Particles, John Wiley & Sons, New York, 1983 Search PubMed.
- U. K. Chettiar and N. Engheta, Opt. Express, 2012, 20, 22976–22986 CrossRef PubMed.
- M. A. Ordal, R. J. Bell, R. W. Alexander, L. L. Long and M. R. Querry, Appl. Opt., 1985, 24, 4493–4499 CrossRef CAS PubMed.
- N. P. Singh, S. C. Gupta and B. R. Sood, Am. J. Phys., 2002, 70, 845–846 CrossRef CAS.
- E. T. Bradley and T. C. Benjamin, J. Biomed. Opt., 2010, 15, 021314 CrossRef PubMed.
-
P. Hasgall, F. Di Gennaro, C. Baumgartner, E. Neufeld, B. Lloyd, M. Gosselin, D. Payne, A. Klingenböck and N. Kuster, IT'IS Database for Thermal and Electromagnetic Parameters of Biological Tissues, 2022, https://itis.swiss/virtual-population/tissue-properties/ Search PubMed.
- M. Kim, G. Kim, D. Kim, J. Yoo, D. K. Kim and H. Kim, Cancers, 2019, 11, 764 CrossRef CAS PubMed.
- M. M. Fuster and J. D. Esko, Nat. Rev. Cancer, 2005, 5, 526–542 CrossRef CAS PubMed.
-
A. Chanmugam, R. Hatwar and C. Herman, Thermal Analysis of Cancerous Breast Model, 2012, pp. 135–143, DOI:10.1115/IMECE2012-88244.
- A. Sani, C. Cao and D. Cui, Biochem. Biophys. Rep., 2021, 26, 100991 CAS.
- Y. Pan, S. Neuss, A. Leifert, M. Fischler, F. Wen, U. Simon, G. Schmid, W. Brandau and W. Jahnen-Dechent, Small, 2007, 3, 1941–1949 CrossRef CAS PubMed.
- A. M. Alkilany and C. J. Murphy, J. Nanopart. Res., 2010, 12, 2313–2333 CrossRef CAS PubMed.
|
| This journal is © The Royal Society of Chemistry 2024 |
Click here to see how this site uses Cookies. View our privacy policy here. 
 Open Access Article
 This Open Access Article is licensed under a Creative Commons Attribution-Non Commercial 3.0 Unported Licence
 *,
Olle
Hennert
,
Robert
Themptander
and
Mariana
Dalarsson
*,
Olle
Hennert
,
Robert
Themptander
and
Mariana
Dalarsson

 . The wavenumber within a material with complex permittivity ε is given by
  .
.


 . In Fig. 3, the relative absorption ratio as a function of coating conductivity is plotted for a 10 nm diameter gold core coated with a 1 nm thick lossy dielectric material surrounded by thyroid tissue as the ambient at 1 GHz. For most values of σc, the addition of the thin coating increases the relative absorption by several orders of magnitude. This agrees with the results already established by Hanson and Patch,12 where a coated gold sphere in a lossless medium was studied. The relative absorption ratio peaks when the coating conductivity is around 1 S m−1. Around this peak, Fabs > 1, meaning that the gold nanosphere achieves differential heating compared to the surrounding tissue. Specifically, Fabs = 5.14 at σc = 1 S m−1 which can be compared to Fabs = 1.52 × 10⁻⁵ for the uncoated nanosphere. On the other hand, as can be seen from Fig. 3, the relative absorption ratio is lower than the uncoated sphere for coatings that are either highly conducting σc > 107 S m−1 or poorly conducting σc < 10−6 S m−1.

 , at 1 GHz frequency. The dashed line represent the relative absorption ratio for an uncoated particle.
 . These prolates correspond to nanowires as their aspect-ratios are so large that they satisfy the eccentricity limit e → 1 leading to (9). Furthermore, the ambient medium is assumed to be thyroid tissue.
 , and varying lengths L, at 1 GHz frequency.
 in thyroid tissue at 1 GHz. Here we observe a similar result to that of the prolate spheroids in Fig. 4. For oblate spheroids with low coating conductivities, the decrease in Fabs compared to the uncoated case is less than for prolate spheroids, only decreasing by approximately 20% for D = 10 μm. For high conductivities on the other hand, the behaviour is similar between the two particle types, with a plateau in Fabs close to that of the uncoated particles. Notably, for D = 1 μm and D = 10 μm, the peaks in Fabs are comparable even though the values for the uncoated particles differ by a factor 100. The most notable observation from Fig. 5, however, is that the presence of a dielectric coating with appropriate conductivity results in differential heating, although still moderate, whereas the uncoated case reported in ref. 7 does not. For example, Fabs > 1 for the D = 100 nm case with coating conductivities between 10−2 S m−1 and 101 S m−1 at the selected frequency, reaching a maximum at Fabs = 11.7 when σc = 0.3 S m−1.
 , and varying diameters D, at 1 GHz frequency.
 , for a prolate spheroid with D = 10 nm, L = 10 μm and an oblate spheroid with T = 10 nm, D = 10 μm. For both NP types, we plot Fabs against the coating thickness tc and σc with
  , and Fabs against σc and
  with tc = 1 nm. From the figure, it is clear that there exists a region of optimal values of tc and σc such that Fabs is maximized. The optimal coating thickness differs between the two particles, being approximately 1 nm for the prolate spheroid and approximately 10 nm for the oblate spheroid. As tc → 0, the relative absorption Fabs evens out across the parameter space, tending toward the value of the uncoated particles, as expected. It can also be observed that as the permittivity
  increases, the optimal value for σc increases while the corresponding peak in Fabs decreases. For the prolate spheroid, an increase in
  leads to a higher Fabs for lower conductivities, evening out the overall response.

 , at frequency f = 1 GHz. Left column: coated prolates with D = 10 nm and L = 10 μm. Right column: coated oblates with T = 10 nm and D = 10 μm. The top subfigures show the coating thickness and conductivity variation of Fabs for a fixed value of
  . The bottom subfigures show the coating permittivity and conductivity variations of Fabs for fixed coating thickness tc = 1 nm. In all subfigures, isolines are used to indicate regions where Fabs > 1 and Fabs > 1000.
 , and a conductivity close to the optimal value from Fig. 4 and 5, i.e. at σc = 0.1 S m−1. The second coating has tc = 1 nm,
  , and a lower conductivity at σc = 10−5 S m−1. From 7, for σc = 0.1 S m−1 we see a significant increase in Fabs for lower frequencies and lower particle eccentricities compared to uncoated particles. The coated particles achieve differential heating for most of the parameter space. The largest increase in Fabs compared to the uncoated particles is seen for frequencies below 1 GHz for oblate spheroids with low eccentricities. On the other hand, for σc = 10−5 S m−1, we observe that for prolate spheroids, Fabs is reduced for higher eccentricities at frequencies below 100 MHz and for lower eccentricities at frequencies above 1 GHz. Overall, the portion of the parameter space for which Fabs > 1, is reduced compared to the uncoated prolate spheroids. For the oblate particles, we still see a significant increase in Fabs at frequencies below 100 MHz. We also observe that for both coating examples, Fabs remains mostly unchanged for very high particle eccentricities at frequencies above 100 MHz.
 . In all subfigures, isolines are used to indicate regions where Fabs > 1 and Fabs > 1000.

 of prolate AuNP with D = 10 nm illustrates clearly the threshold
  where the addition of coating results in either increased or decreased absorption compared to the uncoated case, when the surrounding medium is thyroid (left) and breast fat (right). Coating has parameters tc = 1 nm,
  , σc = 0.1 S m−1. In both subfigures, isolines indicate regions where
  as defined in (26) is greater than 1.
 . If we instead choose a coating permittivity with a real part similar (but slightly lower in order to create a contrast) to the surrounding medium, say
  , then Fig. 8 would still show the same conclusion but with an even further shrinked region of increased absorption (isoline pulled down and shifted left). So, plotting with
  really shows the best-case scenario.
 .
.
 .
. and coating conductivity σc = 0.1 S m−1. The thermal properties for thyroid tissue was taken from ref. 30. The 2 mm3 sphere of injected thyroid and the surrounding normal thyroid tissue were exposed to a 300 V m−1 electric field over 10 seconds. The temperature increase of the surrounding healthy thyroid tissue with these settings remained a steady 0.1 °C throughout the results presented here. The results of the temperature change measured at the center of the injection volume is shown in Fig. 12. Cells are known to undergo aptosis at 43 °C and necrosis occurring at 50 °C or higher,31 meaning that the minimum differential heating of the body temperature needed for cell death is 6 °C. With the given parameters, Fig. 12 shows that this is achievable when L ≥ 24 μm for uncoated AuNPs, and L ≥ 30 μm for coated AuNPs.