 Open Access Article
Multifunctional polymer-based nanocomposites for synergistic adsorption and photocatalytic degradation of mixed pollutants in water†
Jiao
Wang
 ab,
Nadia
Licciardello
 *a,
Massimo
Sgarzi
 *c and
Gianaurelio
Cuniberti
 *a
*a
aInstitute for Materials Science, Max Bergmann Center of Biomaterials and Dresden Center for Nanoanalysis, TU Dresden, 01062, Dresden, Germany. E-mail: nadia.licciardello@tu-dresden.de; gianaurelio.cuniberti@tu-dresden.de
bNorthwest Institute for Non-ferrous Metal Research, Xi'an, 710016, Shaanxi, P. R. China
cDepartment of Molecular Sciences and Nanosystems, Ca’ Foscari University of Venice, Via Torino 155, 30172, Venezia Mestre, Italy. E-mail: massimo.sgarzi@unive.it
First published on 4th December 2023
Abstract
Water pollution is a growing concern for mankind due to its harmful effects on humans, animals and plants. Usually, several pollutants are present in wastewater. For example, dyes and antibiotics are found in wastewater because of their widespread use in factories and hospitals. However, one single technique, e.g. either adsorption or photocatalysis, cannot easily remove more than one kind of pollutant, especially by using one single material in water. For this reason, here multifunctional iron(II,III) oxide/poly(N-isopropylacrylamide-co-methacrylic acid)/silver-titanium dioxide (Fe3O4/P(NIPAM-co-MAA)/Ag–TiO2) nanocomposites were used to remove a mixture of pollutants from water. Specifically, three types of experiments were performed to evaluate the adsorption capacity and photodegradation activity of the nanocomposites towards the dye basic fuchsin (BF) and the antibiotic ciprofloxacin (CIP), which were added sequentially to the nanocomposites dispersion or were concurrently present as a mixture. The results demonstrated that the nanocomposites could adsorb BF, and subsequently photodegrade CIP under visible-light irradiation, if BF was the first added pollutant. As well, the nanocomposites could first degrade CIP under visible-light irradiation, and then adsorb BF if they were initially put in contact with CIP. Finally, the ability of adsorbing BF and photodegrading CIP was confirmed in the co-presence of the two pollutants.
Introduction
With the development of economy and technology, various pollutants produced by human activities end up in wastewater, which is a complex matrix composed of a mixture of different kinds of pollutants.1 Among them, organic dyes and antibiotics, which are common in industrial and hospital wastewater, are harmful for water bodies, humans and animals due to their low level of biodegradability and their persistency in the environment.2–5 In particular, organic dyes are genotoxic, cytotoxic and carcinogenic,6–8 while antibiotics can enhance the antibiotic resistance of bacteria in the environment.9Tertiary treatment techniques are fundamental for the removal of persistent pollutants. Among them, adsorption6,10 is endowed with ease of processing and operation, but is problematic in terms of regeneration and disposal of the adsorbents. Moreover, one major drawback is that the removal of different kinds of pollutants cannot be achieved using one single adsorbent.11 In this context, photocatalysis,12 another important wastewater treatment technique, can represent a suitable solution to couple with adsorption for a multi-pollutants removal process. Recently, Wang et al.13 prepared a series of very efficient 9,9′-bifluorenylidene-based conjugated microporous/mesoporous polymers (BF-CMPs) exhibiting a synergistic behaviour of adsorption and photocatalytic activity towards Rhodamine B (RhB). Among these BF-CMPs, a pyrene-derivatized BF-CMP featured high adsorption (99%) and photocatalytic degradation (92%) towards RhB even after 10 recycles. However, the removal of other pollutants or mixtures of different pollutants was not investigated. Yin et al.14 synthesized an oxygen-vacancy-rich Cu-doped UiO-66 metal organic framework (MOF), which displays a concurrent adsorption and photocatalytic degradation of CIP. Nevertheless, experiments with dye pollutants or mixtures of different pollutants using this MOF were not reported. Rashed et al.15 used TiO2/ASS (TiO2 nanoparticle coated sewage sludge-based activated carbon) to enhance simultaneous adsorption and photocatalytic degradation of methyl orange (MO) and Cd2+ under UV irradiation. The removal efficiency of MO by TiO2/ASS (1![[thin space (1/6-em)]](https://www.rsc.org/images/entities/char_2009.gif) :
:![[thin space (1/6-em)]](https://www.rsc.org/images/entities/char_2009.gif) 2) nanocomposite at pH = 7 was 94.28% while it was more than 90% for Cd2+. However, the photocatalytic degradation was performed only using UV light. In our previous publication,16 Fe3O4/P(NIPAM-co-MAA)/Ag–TiO2 nanocomposites were prepared and used to either adsorb BF or degrade CIP in water through visible-light activated-photocatalysis. Here, we went one step further and used the nanocomposites to perform both adsorption and photocatalysis of a mixture of BF and CIP in water.
2) nanocomposite at pH = 7 was 94.28% while it was more than 90% for Cd2+. However, the photocatalytic degradation was performed only using UV light. In our previous publication,16 Fe3O4/P(NIPAM-co-MAA)/Ag–TiO2 nanocomposites were prepared and used to either adsorb BF or degrade CIP in water through visible-light activated-photocatalysis. Here, we went one step further and used the nanocomposites to perform both adsorption and photocatalysis of a mixture of BF and CIP in water.
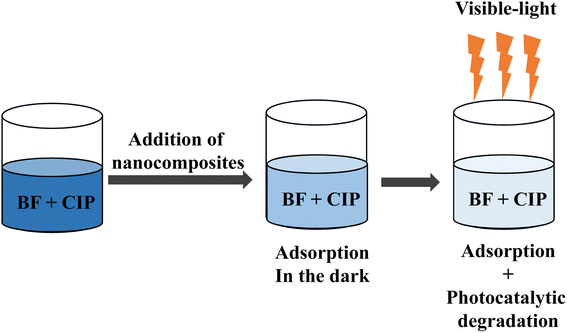
More specifically, the adsorption capacity and the photocatalytic activity of the nanocomposites were assessed in three different experimental conditions (i) co-adsorption in dark conditions of a mixture of BF and CIP followed by irradiation with visible-light; (ii) dark adsorption of BF followed by the dark adsorption of CIP and subsequent visible-light irradiation of the mixture: (iii) dark adsorption of CIP, irradiation with visible-light followed by the addition of BF and immediate visible-light irradiation of the mixture. The results indicated that the nanocomposites could keep the dual ability of adsorbing and degrading, through visible-light-driven photocatalysis, an equiconcentrated mixture of BF and CIP paving the path for the treatment of complex mixtures of pollutants by means of a single nanomaterial.
Results and discussion
The Fe3O4/P(NIPAM-co-MAA)/Ag–TiO2 nanocomposites herein reported were synthesized and fully characterized in our previous publication,16 where they were tested for their capacity to remove either BF or CIP from water. In order to move one step forward towards the removal of complex mixtures of pollutants in water, here a study of the removal activity towards mixtures of BF and CIP was performed.As we reported previously,16 BF could be adsorbed by the Fe3O4/P(NIPAM-co-MAA)/Ag–TiO2 nanocomposites with high efficiency (CBF = 5 mg L−1, 87% removal in 100 min). In order to determine the adsorption capacity and the photodegradation ability of the nanocomposites towards BF at the initial concentration of 1 mg L−1, adsorption and photodegradation experiments were performed. As shown in Fig. S1–S3 and Table S1 (ESI†), the photodegradation ability of the nanocomposites towards BF was negligible. On the other hand, CIP (5 mg L−1, pH = 3) could only be degraded by the nanocomposites through photocatalysis under visible-light irradiation, but no adsorption was observed, as reported in our previous work.16
In order to determine the adsorption capacity and the photodegradation ability of the nanocomposites towards CIP at the initial concentration of 1 mg L−1 (pH = 4.3), adsorption and photodegradation experiments were performed. Fig. S4, S5 and Table S2† show that, in these experimental conditions, 21% of CIP could be adsorbed on the nanocomposites. This result, in contrast with our previously published work,16 where no adsorption of CIP was registered, could be ascribed to the different ratio of CIP/nanocomposites and to the different pH of the mixture (4.3 vs. 3), which increased the number of deprotonated methacrylate groups (pKa = 4.28) able to interact with CIP. Moreover, 89% of the CIP was degraded under visible-light irradiation by the nanocomposites, with a degradation rate constant of 4.31 × 10⁻³ min−1.
The adsorption capacity and photocatalytic degradation activity of the nanocomposites towards a mixture of BF and CIP were investigated by three different experiments, called Mixture 1, Mixture 2 and Mixture 3.
Mixture 1
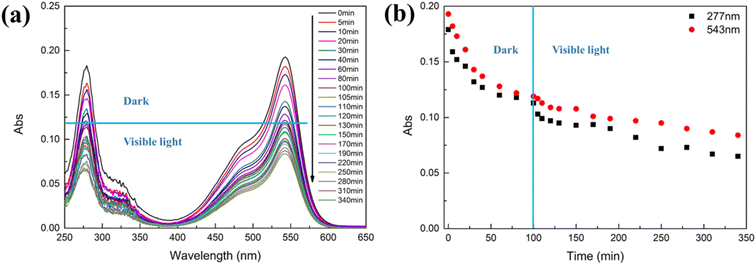
In this experiment (Fig. 4), the nanocomposites were dispersed in a mixture of equiconcentrated BF and CIP solutions (1 mg L−1) and placed under stirring and dark conditions at first and, subsequently, under visible-light irradiation. The pH of the mixture was 4.4. After 100 min of dark adsorption, the adsorption–desorption equilibrium was reached and the mixture was placed under visible-light irradiation. Fig. 1 shows the adsorption and photocatalytic degradation of the mixture of BF and CIP by means of the nanocomposites. Fig. 1(b) was obtained by plotting the registered absorbance values at the maximum absorption wavelengths of CIP (277 nm) and BF (543 nm). It is important to underline that only BF absorbs light at 543 nm, while the absorbance at 277 nm stems from the contribution of both BF and CIP. The adsorption percentage of BF by the nanocomposites was 57% after 340 min, namely after both the dark adsorption and photocatalytic experiments were performed, and considering the negligible photodegradation ability of the nanocomposites towards BF, as discussed above.In order to study the adsorption kinetics of the nanocomposites towards BF, data were collected at 543 nm from 0 min to 340 min (Fig. 1). Fig. S6† and Table 1 show that the kinetic data were better fitted with a pseudo-second-order model than with a pseudo-first-order one: the correlation coefficient value of the pseudo-second-order model (R2 = 0.9823) resulted higher than that of the pseudo-first-order one (R2 = 0.9706) and the theoretical equilibrium adsorption capacity (qe = 1.43 mg g−1) calculated using the pseudo-second-order model was closer to the experimental equilibrium adsorption capacity value (qe,exp = 1.34 mg g−1). According to the pseudo-second-order model, the adsorption of BF on the nanocomposites is kinetically controlled by the interaction between BF and the nanocomposites.17–19
| Pollutant | q e,exp (mg g−1) | Pseudo-first-order model | Pseudo-second-order model | ||||
|---|---|---|---|---|---|---|---|
| q e (mg g−1) | k 1 (min−1) | R 2 | q e (mg g−1) | k 2 (g mg−1 min−1) | R 2 | ||
| BF | 1.34 | 1.13 | 0.0098 | 0.9706 | 1.43 | 0.0158 | 0.9823 |
Besides, the adsorption rate constant (k2 = 0.0158 g mg−1 min−1) was 21% lower than the one obtained for the adsorption of a solution containing only BF (k2 = 0.0199 g mg−1 min−1, Table S1†). This decrease could be ascribed to the competitive adsorption of BF and CIP molecules onto the active sites of the nanocomposites.
At 277 nm (maximum absorption value for CIP), both BF and CIP absorb light. Therefore, the absorbance of CIP at 277 nm was calculated by subtracting the absorbance of BF at 277 nm from the absorbance of the mixture of BF and CIP at the same wavelength. The obtained absorbance of CIP at 277 nm (Fig. S7†) was used to calculate the photocatalytic degradation rate constant of CIP (7.45 × 10⁻⁴ min−1) in the presence of the nanocomposites. The obtained value resulted 83% lower than the one for CIP in the absence of BF (4.31 × 10⁻³ min−1) and in the presence of the nanocomposites. This decrease is again ascribable to the competition between BF and CIP for the active sites on the nanocomposites.
Mixture 2
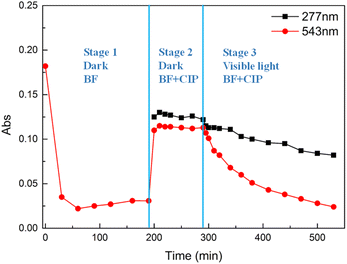
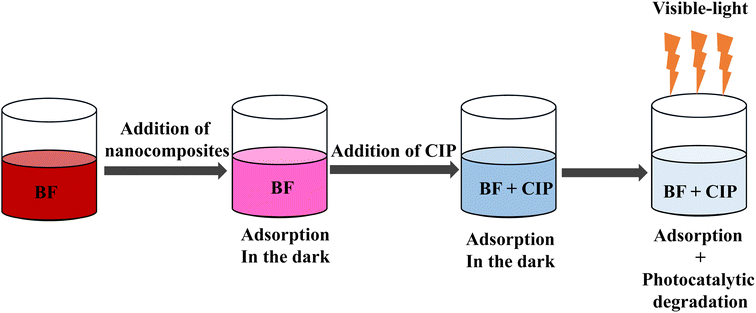
In the second experiment (Mixture 2, Fig. 5), the nanocomposites were firstly added to a BF solution (1 mg L−1, pH = 6) under stirring and dark conditions for 190 min, which is the time when the adsorption–desorption equilibrium was reached. Subsequently, 4.9 mL of CIP solution (10 mg L−1, pH = 3) were added to the mixture under stirring and dark conditions for 100 min. The pH of the resulting mixture was 4.5, with a resulting CIP concentration of 1 mg L−1. After 100 min of dark adsorption, the adsorption–desorption equilibrium was reached. Afterwards, the mixture was irradiated with visible-light for 240 min. Fig. 2 shows the absorbance changes during the whole experiment. Three stages could be identified.Stage 1 is the adsorption of BF by the nanocomposites in dark conditions for 190 min. The adsorption percentage of BF was 83% at the end of this stage. Stage 2 is the adsorption of the mixture of BF and CIP in dark conditions for 100 min. After the addition of CIP, a sudden increase of the absorbance at both 277 nm and 543 nm was observed. This behaviour can be ascribed to the exchange of BF molecules with CIP molecules on the surface of the nanocomposite, which causes an increment in the concentration of BF in the supernatant. Stage 3 started after reaching the adsorption–desorption equilibrium, when the mixture was irradiated by visible-light for 240 min. At this stage, the pH of the mixture was 5.4. As shown in Fig. 2, the absorbance decreased at 277 nm and 543 nm, indicating the concurrent occurrence of BF adsorption and CIP photocatalytic degradation by means of the nanocomposites. Therefore, it is possible to assume that the absorbance changes at 543 nm in stage 3 are mainly caused by the re-adsorption of BF. The adsorption percentage of BF was 83% at the end of stage 3. This BF re-adsorption occurred due to the degradation of CIP under visible-light irradiation, which released free adsorption sites on the nanocomposites, available for the adsorption of BF. The evidence for this conclusion is that BF has the same adsorption percentage (83%) at the end of stage 3 (t = 190 min) and at the end of stage 1 (t = 190 min).
Fig. S8 and S9† show the kinetic fitting of the data in stage 3. The data at 543 nm provided information on the adsorption of BF over the 240 min of stage 3. Fig. S8† and Table 2 show that the kinetic data for BF are better fitted with the pseudo-first-order model than with the pseudo-second-order one. The evidence is the higher correlation coefficient value (R2 = 0.9858) of the pseudo-first-order fitting and the same value obtained for the theoretical equilibrium adsorption capacity (qe = 1.09 mg g−1) and the experimental equilibrium adsorption capacity (qe,exp = 1.09 mg g−1). According to the pseudo-first-order model, the adsorption rate of BF is directly proportional to the difference between the saturation concentration and the amount of adsorptive adsorbed over time, which suggests that the rate-determining step is the diffusion of BF.17,20 It is difficult to compare the adsorption rate constant of BF in this mixture at stage 3 (k1 = 0.0135 min−1) with the adsorption rate constant of pure BF (k2 = 0.0199 g mg−1 min−1, Table S1†), since the adsorption kinetic data of BF when not in the mixture are better fitted with a pseudo-second-order model.
| Pollutant | q e,exp (mg g−1) | Pseudo-first-order model | Pseudo-second-order model | ||||
|---|---|---|---|---|---|---|---|
| q e (mg g−1) | k 1 (min−1) | R 2 | q e (mg g−1) | k 2 (g mg−1 min−1) | R 2 | ||
| BF | 1.09 | 1.09 | 0.0135 | 0.9858 | 1.31 | 0.0124 | 0.9133 |
The absorbance of CIP at 277 nm was obtained by subtracting the absorbance of BF at 277 nm from the absorbance of the mixture of BF and CIP at the same wavelength. The obtained values were used to calculate the degradation rate constant for the photocatalytic degradation of CIP by means of the nanocomposites under visible-light irradiation (Fig. S9†). The obtained degradation rate constant was 4.16 × 10⁻⁴ min−1, which is 90% lower than the one calculated for CIP in the absence of BF (4.31 × 10⁻³ min−1). The lower photocatalytic degradation rate of CIP in the presence of BF can be explained considering the decreased number of active sites available for the interaction with CIP molecules.
Mixture 3
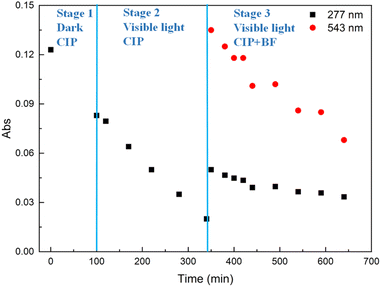
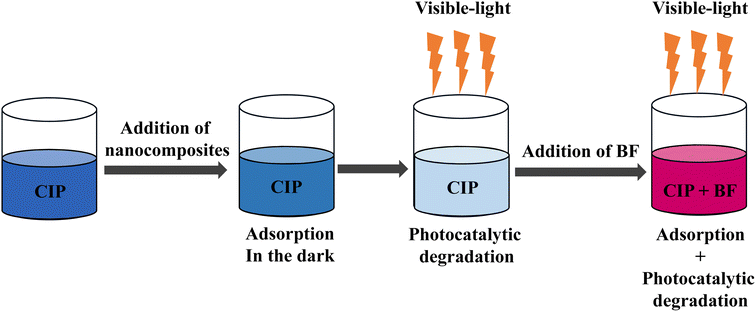
In the third experiment (Mixture 3, Fig. 6), the nanocomposites were firstly added to a CIP solution (1 mg L−1, pH = 4.3) under stirring and dark conditions for 100 min to reach the adsorption–desorption equilibrium (stage 1). Subsequently, the mixture was placed under visible-light irradiation for 240 min (stage 2). Finally, 4.9 mL of BF solution (10 mg L−1, pH = 6) were added into the mixture under visible-light irradiation for 300 min (stage 3). The resulting concentration of BF in the mixture was 1 mg L−1. As shown in Fig. 3, the adsorption percentage of CIP was 32% (stage 1), while the photocatalytic degradation of CIP was 76% (stage 2). The adsorption percentage of BF during stage 3 was 50%. The absorbance of CIP at 277 nm (in stage 3) was obtained, as discussed above, by subtracting the absorbance of BF at 277 nm from the absorbance of the mixture of BF and CIP at the same wavelength. The degradation percentage of CIP in stage 3 was 9%. The smaller degree of degradation of CIP in comparison to the result obtained in stage 2 is ascribable to the low residual concentration of CIP after stage 2.Fig. S10† and Table 3 show that the kinetic data of BF adsorption in Mixture 3 are better fitted with the pseudo-first-order model than with the pseudo-second-order one. The evidence is the higher correlation coefficient value (R2 = 0.9339) of the pseudo-first-order fitting and the strong similarity between the theoretical equilibrium adsorption capacity (qe = 0.89 mg g−1) and the experimental equilibrium adsorption capacity (qe,exp = 0.82 mg g−1). The adsorption rate constant k1 of BF in Mixture 3 was 0.0061 min−1, which resulted 38% lower than the obtained for pure BF (k1 = 0.0099 min−1, Fig. S1†): this decrement can be ascribed to the occupation of the nanocomposites' active sites by CIP molecules.
| Pollutant | q e,exp (mg g−1) | Pseudo-first-order model | Pseudo-second-order model | ||||
|---|---|---|---|---|---|---|---|
| q e (mg g−1) | k 1 (min−1) | R 2 | q e (mg g)−1 | k 2 (g mg−1 min−1) | R 2 | ||
| BF | 0.82 | 0.89 | 0.0061 | 0.9339 | 1.00 | 0.0055 | 0.3037 |
Table 4 summarises all the adsorption and degradation rate constants for the experiments performed in this work. The adsorption kinetic data of pure BF and BF in Mixture 1 were better fitted with a pseudo-second-order model. The adsorption rate constant of BF in Mixture 1 (k2 = 0.0158 g mg−1 min−1) resulted 21% lower than the one of pure BF (k2 = 0.0199 g mg−1 min−1) as a consequence of the adsorption competition between BF and CIP.
| Pure BF | Pure CIP | Mixture 1 (BF and CIP) | Mixture 2 (BF + CIP) | Mixture 3 (CIP + BF) |
|---|---|---|---|---|
| k 2,ads | k 2,ads | k 2,ads (BF) | k 1,ads (BF) | k 1,ads (BF) |
| 0.0199 g mg−1 min−1 | 0.1051 g mg−1 min−1 | 0.0158 g mg−1 min−1 | 0.0135 min−1 | 0.0061 min−1 |
| — | k degr | k degr (CIP) | k degr (CIP) | k degr (CIP) |
| 4.31 × 10⁻³ min−1 | 7.45 × 10⁻⁴ min−1 | 4.16 × 10⁻⁴ min−1 | <LOD |
It was not possible to compare the adsorption kinetic constant for pure BF with the ones obtained for Mixture 2 and Mixture 3, since the latter are obtained via a pseudo-first order fitting.
As for the degradation of CIP, the rate constants in Mixture 1 (7.45 × 10⁻⁴ min−1) and Mixture 2 (4.16 × 10⁻⁴ min−1) were respectively 83% and 90% lower than the rate constant obtained for pure CIP (4.31 × 10⁻³ min−1). Also in this case, the adsorption competition between BF and CIP caused the decrease of the photodegradation efficiency of CIP.
Conclusions
In this work, the multifunctional Fe3O4/P(NIPAM-co-MAA)/Ag–TiO2 nanocomposites, which were previously reported to adsorb BF and degrade CIP by visible-light-driven photocatalysis, were used for the removal of mixtures of BF and CIP in different conditions. This study was performed with the scope of better understanding the mechanisms of competition between different pollutants and how these multifunctional nanocomposites can be used for the removal of complex mixtures of pollutants. The nanocomposites exhibited both good adsorption capacity towards BF and visible-light-driven photocatalytic degradation activity towards CIP also in the mixed pollutants experiments. The experiments demonstrated that the nanocomposites, once put in contact first with BF and then with CIP, could first adsorb BF and then photocatalytically degrade CIP under visible-light irradiation. On the other hand, if the nanocomposites were put first in contact with CIP and then with BF, they could first photocatalytically degrade CIP under visible-light irradiation and then adsorb BF. The analysis of the adsorption and degradation kinetics of the mixed pollutants in the presence of the nanocomposites revealed a decrease compared to the single pollutant experiments, which might need further future improvement. Nevertheless, these results represent a step forward to the application of these nanocomposites for the removal of complex mixtures of pollutants in real wastewater such as industrial and hospital wastewater. In addition, as we reported previously,16 these nanocomposites are endowed with antibacterial and magnetic properties, representing an added value in the treatment of wastewater, especially the one related to hospital waste, and allowing an easier recovery and reuse.Experimental
The chemicals and procedures for the preparation of the nanocomposites, and their characterization were described in our previous publication.16 The organic dye basic fuchsin (BF, 80%) and the antibiotic ciprofloxacin (CIP, 98%) were purchased from Sigma-Aldrich (Germany) and used as pollutant models in this work. Ultrapure water was prepared by using a MembraPure Astacus system (MembraPure GmbH, Hennigsdorf, Germany). For all the photocatalytic experiments, an artificial lamp produced by Ingenieurbüro Mencke & Tegtmeyer GmbH (Hameln, Germany) with Susicontrol software (version 2.9.0) was used as the visible-light source. The irradiance spectrum of the above-mentioned artificial lamp (400–1100 nm) mimics the one of natural solar light, excluding the contribution of ultraviolet light. The mixtures of pollutants and nanocomposites were irradiated from above with a 98 W m−2 irradiance at a 9.4 cm distance between the visible-light source and the mixture surface. Ultraviolet-Visible (UV-Vis) absorption spectra of BF, CIP and their mixture were monitored by a Cary 100 Bio UV-Vis spectrophotometer (Agilent Technologies, Inc., Santa Clara, CA, USA) at room temperature in the wavelength range from 200 to 800 nm.Nanocomposites' adsorption capacity and photocatalytic activity towards a mixture of BF and CIP
Three different experiments were carried out to investigate the adsorption capacity and the photocatalytic activity of the nanocomposites towards a mixture of BF and CIP.The first experiment (Mixture 1, Fig. 4) concerned the adsorption of a mixture of BF and CIP on the nanocomposites followed by visible-light-driven photocatalytic degradation. Firstly, a mixture solution of BF and CIP (CBF = CCIP = 1 mg L−1) was prepared (pH = 4.4). Subsequently, 23 mg of the nanocomposites were added into 50 mL of the aforementioned mixture (concentration of the nanocomposites = 460 mg L−1) under stirring and dark conditions for 100 min in order to reach the adsorption–desorption equilibrium. During the adsorption experiment, samples were withdrawn at adsorption times of 5, 10, 20, 30, 40, 60, 80 and 100 min. Subsequently, the mixture solution was placed under visible-light irradiation and stirred for 240 min. During the visible-light-driven photocatalytic process, samples of 1 mL were taken at 0 min (equivalent to 100 min of the former adsorption process, no irradiation), 5, 10, 20, 30, 50, 70, 90, 120, 150, 180, 210 and 240 min after visible-light irradiation.
The second experiment (Mixture 2, Fig. 5) started with a first adsorption experiment in which only a BF solution (1 mg L−1) was put in contact with the nanocomposites for 190 min. Subsequently, a CIP solution (1 mg L−1 concentration in the mixture) was added to the mixture and kept in dark conditions for 100 min to reach the adsorption–desorption equilibrium. Finally, the resulting mixture was irradiated with visible-light for 240 min. More in detail, 23 mg of the nanocomposites were put into 50 mL of BF solution (1 mg L−1, pH = 6) with stirring under dark conditions. Samples of 1 mL were withdrawn at adsorption times of 30, 60, 90, 120, 160 and 190 min, time point at which the adsorption–desorption equilibrium was reached, as demonstrated with experiments of BF adsorption kinetics performed separately (Fig. S1, S3 and Table S1†). After these samplings, the volume of the solution was 44 mL. Subsequently, 4.9 mL of CIP (10 mg L−1, pH = 3) were added into the mixture (concentration of CIP in the mixture, CCIP,mix = 1 mg L−1) under stirring and dark conditions for 100 min to reach the adsorption–desorption equilibrium. The pH of the resulting mixture was 4.5. Samples of 1 mL were taken at adsorption times of 0 min (equivalent to 190 min in the former adsorption experiment), 5, 10, 20, 40, 60, 80 and 100 min. After 100 min adsorption, the pH of the mixture solution reached 5.4. Afterwards, the mixture was placed under visible-light irradiation for 240 min. Samples of 1 mL were taken at times 0 min (equivalent to 100 min in the former adsorption experiment of the mixture, no irradiation), 5, 10, 20, 30, 50, 70, 90, 120, 150, 180, 210 and 240 min of visible-light irradiation.
The third experiment (Mixture 3, Fig. 6) included a first step in which the nanocomposites firstly adsorbed CIP (CCIP = 1 mg L−1, 100 min) and then degraded it through 240 min visible-light-activated photocatalysis. Subsequently, BF was added to the mixture, which was immediately irradiated for 300 min. More in detail, 23 mg of the nanocomposites were put into 50 mL of CIP solution (1 mg L−1, pH = 4.3) under stirring in dark conditions for 100 min to reach the adsorption–desorption equilibrium. Since the adsorption–desorption equilibrium is reached at 100 min (Fig. S4, ESI†), a sample of 1 mL was withdrawn at this time point. Subsequently, the mixture was placed under visible-light irradiation and stirred for 240 min. During the visible-light degradation process, samples were withdrawn at 0 min (equivalent to 100 min of adsorption process, no irradiation), 20, 70, 120, 180 and 240 min of visible-light irradiation. After these samplings, the volume of the solution was 44 mL. After 240 min of visible-light-irradiation, 4.9 mL of BF (10 mg L−1, pH = 6) were added into the mixture (concentration of BF in the mixture, CBF,mix = 1 mg L−1), which was kept under stirring and visible-light irradiation for 300 min. The pH of the resulting mixture was equal to 5.2. Samples of 1 mL were withdrawn at adsorption times of 0 min (equivalent to 240 min in the former CIP photocatalytic degradation experiment), 10, 20, 50, 100, 150, 250 and 300 min of visible-light irradiation.
All the 1 mL samples withdrawn in these three experiments were centrifuged using an Eppendorf 5417 centrifuge (Hamburg, Germany) for 20 min at 20![[thin space (1/6-em)]](https://www.rsc.org/images/entities/char_2009.gif) 817g and 20 °C to remove the suspended nanocomposites before performing the UV-Vis spectrophotometric measurements. The absorbance changes of BF, CIP and their mixture were monitored from 200 to 800 nm depending on each case as detailed in Results and Discussion by means of a Cary 100 Bio UV-Vis spectrophotometer (Agilent Technologies, Inc., Santa Clara, CA, USA).
817g and 20 °C to remove the suspended nanocomposites before performing the UV-Vis spectrophotometric measurements. The absorbance changes of BF, CIP and their mixture were monitored from 200 to 800 nm depending on each case as detailed in Results and Discussion by means of a Cary 100 Bio UV-Vis spectrophotometer (Agilent Technologies, Inc., Santa Clara, CA, USA).
Adsorption kinetics analysis
The adsorption capacity qt (mg g−1) of the nanocomposites was calculated by using eqn (1):20,21 | (1) |
The pseudo-first-order (eqn (2)) and pseudo-second-order models (eqn (3)) were used to evaluate the adsorption kinetics of the nanocomposites:17
ln(qe − qt) = ln![[thin space (1/6-em)]](https://www.rsc.org/images/entities/char_2009.gif) qe − k1t qe − k1t | (2) |
 | (3) |
In the given formulae, qe and qt are the adsorption capacities (mg g−1) of the nanocomposites at the adsorption equilibrium and at time t (min), respectively. The pseudo-first-order rate constant and pseudo-second-order rate constant are k1 (min−1) and k2 (g mg−1 min−1), respectively.
Photocatalytic kinetics analysis
The obtained photocatalytic degradation data was analyzed by using a pseudo-first-order kinetic model (eqn (4)):22| −ln(Ct/C0) = kt | (4) |
Author contributions
Conceptualization: J. W., N. L., M. S., G. C.; data curation: J. W.; formal analysis: N. L., M. S., J. W.; funding acquisition: G. C.; investigation: J. W.; methodology: N. L., M. S., J. W.; project administration: N. L., M. S., G. C.; resources: G. C.; supervision: N. L., M. S., G. C.; validation: N. L., M. S.; visualization: N. L., M. S., G. C.; writing – original draft: J. W.; writing – review & editing: N. L., M. S., G. C.Conflicts of interest
There are no conflicts to declare.Acknowledgements
The authors gratefully acknowledge financial support by the China Scholarship Council (CSC), by the European Union's Horizon 2020 Research and Innovation Program under the Marie Sklodowska-Curie grant agreement no. 734381 (CARBO-IMmap), by the Natural Science Basic Research Program of Shaanxi, P. R. China (program no. 2023-JC-QN-0570) The Article Processing Charges (APC) were funded by the joint publication funds of the TU Dresden, including Carl Gustav Carus Faculty of Medicine, and the SLUB Dresden as well as the Open Access Publication Funding of the DFG.References
- L. Schweitzer and J. Noblet, in Green Chemistry, Elsevier, 2018, pp. 261–290 Search PubMed.
- F. M. Drumond Chequer, G. A. R. de Oliveira, E. R. Anastacio Ferraz, J. Carvalho, M. V. Boldrin Zanoni and D. P. de Oliveir, Eco-Friendly Text. Dyeing Finish., 2013, 6, 151 Search PubMed.
- C. R. Holkar, A. J. Jadhav, D. V. Pinjari, N. M. Mahamuni and A. B. Pandit, J. Environ. Manage., 2016, 182, 351 CrossRef CAS PubMed.
- J. Wang and S. Wang, J. Environ. Manage., 2016, 182, 620 CrossRef CAS.
- O. M. Rodriguez-Narvaez, J. M. Peralta-Hernandez, A. Goonetilleke and E. R. Bandala, Chem. Eng. J., 2017, 323, 361 CrossRef CAS.
- V. K. Gupta, A. Mittal, V. Gajbe and J. Mittal, J. Colloid Interface Sci., 2008, 319, 30 CrossRef CAS.
- A. K. Ilunga, T. Khoza, E. Tjabadi and R. Meijboom, ChemistrySelect, 2017, 2, 9803 CrossRef CAS.
- J. F. Guo, B. Ma, A. Yin, K. Fan and W. L. Dai, Appl. Catal., B, 2011, 101, 580 CrossRef CAS.
- A. Kaur, W. A. Anderson, S. Tanvir and S. K. Kansal, J. Colloid Interface Sci., 2019, 557, 236 CrossRef CAS PubMed.
- G. Crini, Bioresour. Technol., 2006, 97, 1061 CrossRef CAS.
- C. Santhosh, V. Velmurugan, G. Jacob, S. K. Jeong, A. N. Grace and A. Bhatnagar, Chem. Eng. J., 2016, 306, 1116 CrossRef CAS.
- C. Michelin and N. Hoffmann, ACS Catal., 2018, 8, 12046 CrossRef CAS.
- B. Wang, Z. Xie, Y. Li, Z. Yang and L. Chen, Macromolecules, 2018, 51, 3443 CrossRef CAS.
- L. Yin, D. Wang, X. Li, Y. He, X. Liu, Y. Xu and H. Chen, Sci. Total Environ., 2022, 815, 151962 CrossRef CAS PubMed.
- M. N. Rashed, M. A. Eltaher and A. N. A. Abdou, R. Soc. Open Sci., 2017, 4, 170834 CrossRef PubMed.
- J. Wang, M. Sgarzi, Z. Němečková, J. Henych, N. Licciardello and G. Cuniberti, Global Chall., 2022, 6, 2200076 CrossRef PubMed.
- H. Yan, W. Zhang, X. Kan, L. Dong, Z. Jiang, H. Li, H. Yang and R. Cheng, Colloids Surf., A, 2011, 380, 143 CrossRef CAS.
- M. Iram, C. Guo, Y. Guan, A. Ishfaq and H. Liu, J. Hazard. Mater., 2010, 181, 1039 CrossRef CAS.
- A. N. Módenes, F. B. Scheufele, F. R. Espinoza-Quiñones, P. S. C. de Souza, C. R. B. Cripa, J. dos Santos, V. Steffen and A. Dimitrov Kroumov, Int. J. BIOautom., 2015, 19, 187 Search PubMed.
- T. R. Sahoo and B. Prelot, in Nanomaterials for the Detection and Removal of Wastewater Pollutants, Elsevier, 2020, pp. 161–222 Search PubMed.
- N. Li, Z. Li, L. Zhang, H. Shi, J. Li, J. Zhang, Z. Zhang and F. Dang, J. Hazard. Mater., 2020, 382, 121113 CrossRef CAS.
- J. Wang, L. Svoboda, Z. Němečková, M. Sgarzi, J. Henych, N. Licciardello and G. Cuniberti, RSC Adv., 2021, 11, 13980 RSC.
Footnote |
| † Electronic supplementary information (ESI) available. See DOI: https://doi.org/10.1039/d3na00931a |
| This journal is © The Royal Society of Chemistry 2024 |

