 Open Access Article
Nickel and cobalt-based tungstate nanocomposites as promising electrocatalysts in alkaline direct methanol fuel cells†
Imtenan
Mahmoud
a,
Ahmed A.
Farghali
a,
Waleed M. A.
El-Rouby
 a and
Abdalla
Abdelwahab
 *abc
*abc
aMaterials Science and Nanotechnology Department, Faculty of Postgraduate Studies for Advanced Sciences, Beni-Suef University, 62511 Beni-Suef, Egypt. E-mail: aabdelwahab@psas.bsu.edu.eg
bFaculty of Science, Galala University, Sokhna, 43511, Suez, Egypt
cDepartment of Chemistry, College of Sciences, University of Ha'il, Ha'il, 81451, Saudi Arabia
First published on 11th March 2024
Abstract
In this work, a non-precious group metal (non-PGM) electrocatalyst based on transition metals is introduced as a promising solution for enhancing the efficiency of direct methanol fuel cell (DMFC). Nickel–cobalt mixed tungstate was prepared using a simple co-precipitation method with different molar ratios of Ni, Co and W. The prepared materials were tested and validated using different characterization techniques. It was observed using SEM that the materials are agglomerated amorphous random circular nanocomposite structures. The electrochemical performance of the prepared electrocatalysts revealed that the best nanocomposite was the one with the Ni![[thin space (1/6-em)]](https://www.rsc.org/images/entities/char_2009.gif) :
:![[thin space (1/6-em)]](https://www.rsc.org/images/entities/char_2009.gif) Co
Co![[thin space (1/6-em)]](https://www.rsc.org/images/entities/char_2009.gif) :
:![[thin space (1/6-em)]](https://www.rsc.org/images/entities/char_2009.gif) W ratio of 1
W ratio of 1![[thin space (1/6-em)]](https://www.rsc.org/images/entities/char_2009.gif) :
:![[thin space (1/6-em)]](https://www.rsc.org/images/entities/char_2009.gif) 1
1![[thin space (1/6-em)]](https://www.rsc.org/images/entities/char_2009.gif) :
:![[thin space (1/6-em)]](https://www.rsc.org/images/entities/char_2009.gif) 1.5 (W1.5). This composite showed a higher current density of 229 mA cm−2 towards methanol oxidation at a scan rate of 50 mV s−1 in 1 M methanol at 0.6 V, with the lowest onset potential of 0.33 V. The obtained results present a new strong non-PGM material for direct methanol electro-oxidation reactions and open new doors for economic and earth-abundant electrocatalysts as an alternative to expensive commercially available catalysts.
1.5 (W1.5). This composite showed a higher current density of 229 mA cm−2 towards methanol oxidation at a scan rate of 50 mV s−1 in 1 M methanol at 0.6 V, with the lowest onset potential of 0.33 V. The obtained results present a new strong non-PGM material for direct methanol electro-oxidation reactions and open new doors for economic and earth-abundant electrocatalysts as an alternative to expensive commercially available catalysts.
1. Introduction
With the rapid development of the economy and society, the crisis of traditional energy sources contributing to environmental pollution has become increasingly serious. Therefore, with the rapidly increasing demand for sustainable energy, seeking green renewable energies is a necessity. Green technologies implemented for power generation include the use of air, water, and the sun and yet these technologies are inadequate to meet the existing power demands, which promote the dependency on liquid fuel cells, especially direct methanol fuel cells (DMFCs).1 The main goal of DMFCs is the same as any other fuel cell: to directly convert the chemical energy of a “fuel” (in this case; methanol) into electricity with the least possible number of side reactions. Moreover, DMFCs do not need any recharging processes or combustion. Due to their portable features, simple design, ease of handling and transportation, long life cycle, low-temperature operation and ability to supply constant feed of electricity as long as fuel is supplied, DMFCs have become a promising candidate to meet our growing energy demands, given that methanol is used directly without any pretreatment.2 The core of DMFCs is the methanol oxidation reaction (MOR), where methanol is oxidized over the surface of an electrocatalyst releasing hydrogen at the anode that diffuses through a membrane to the cathode, where oxygen reduction occurs, resulting in an overall reaction, which is given as follows:3 | (1) |
Predominant materials used for the MOR are platinum-based electro-catalysts; however, as they are expensive and undergo poisoning due to CO blockage of active sites, their large-scale commercialization is hampered. Developing new strategies to replace expensive Pt-based materials used in alcohol oxidation is of high priority for achieving portable DMFCs. Designing non-Pt group catalysts seems to be the most applicable approach towards large-scale commercialization of DMFCs. Focusing on fabricating materials on a nanoscale, we hope that size-related properties will help overcome the drawbacks of MORs and offer an added advantage to materials that would be able to compete or even replace Pt in DMFCs.4 In a perfect system, methanol will be oxidized solely at the anode and it will not diffuse through the membrane to the cathode, and the overall reaction will give only water and carbon dioxide. However, there is hardly any perfect system, and obstacles in realizing such a system are as follows: (i) methanol when used in moderate to high concentrations diffuses towards the cathode and gets oxidized there, which is known as methanol crossover, and this phenomenon results in a mixed potential and an overall decrease in the cell performance, implying that it is vital to use high concentrations of methanol as it means higher current densities.5,6 (ii) The overall MOR, unfortunately, produces several byproducts that may block the active sites and cause catalyst poisoning similar to Pt, for which many solutions were proposed.7 (iii) The use of “non-Pt group metals” pushes us to work in alkaline media, as these metals may not be stable in strong acidic media and might even leach out of the structure and collapse the electrode. The use of an alkaline medium has also some limitations: carbonates are formed from CO2via the MOR, which uses the electrolyte and hence decreases the conductivity; therefore, it needs to be replaced, adding to the overall cost of operation.8,9 Yet it was proven that the MOR kinetics is better in an alkaline medium than in an acidic medium,10 and with the advances in alkaline fuel cells, we are only encouraged to keep on fabricating Pt replacements.11,12 (iv) A gap exists between the material's performance towards the MOR and its actual performance in a real DMFC as an electrode, as the stability measurements for a material might not be an accurate indicator for the performance and the material might lose part of the mass and still maintain the same performance. Therefore, working to have an accurate assessment of the materials used is also of great importance, especially for non-platinum group-based materials.13 (v) The comparison between the MOR over Pt and that over non-Pt group materials seems to be adequate; as each set of materials have their own preferred media, and the interpretation of results and the different proposed MOR mechanisms make it difficult to compare non-Pt materials' performance with that of Pt materials. Trying to develop non-platinum catalysts has gone a long way and there are already some strong performers in the MOR based on tungsten (W) and other transition metals; carbides,14–17 chalcogenides, MXenes,18 oxides, mixed oxides, and hydroxides of nickel, cobalt, copper, iron, tungsten and molybdenum were all reported to show promising activity towards the MOR.19,20 Moreover, the use of W together with Pt was found to increase the performance drastically due to its stabilizing effect on Pt particles and also its effect on resisting CO poisoning.21–23 Tungsten compounds are studied for their unique chemical properties, structure stability in both acidic and alkaline media, and even their Pt-like efficiency.24,25 Co and Ni compounds of tungstate have been studied in the past few years due to their promising features in many other applications due to their good structural stability, cost-effectiveness, high conductivity and good surface oxidation traits.5,24 The two metals have the flexibility to form different nanostructures with various elements, and hence, provide a wide range of catalytic performances towards several applications, particularly in electrochemical catalysis, as they are relatively stable in alkaline media, with low electrical resistivity and low activation energy to some extent. Their different divalent nanostructures promote them as great candidates in catalysis.1,4,7 Nickel oxide is known to be a good electrocatalyst in an alkaline medium, and it becomes, even more, better when mixed with other transition metals. NiWO4 and CoWO4 have already been used in electrocatalysis, showing promising features,2,3,6,26 and with mixed-metal oxides we get a composite with a better performance towards the MOR. The potential for tungsten-based mixed-metal oxides is yet to be fully exposed in all aspects. There are even more ways to further improve the kinetics of the reaction over transition metal-based compounds like introducing dopant atoms that help increase the conductivity like S or N,27 thereby exhibiting such good performance with the un-modified mixed-metal oxide, which is a great start.
This work sheds light on the huge potential of tungstate-based compounds in the MOR for DMFCs. Mixed ternary and binary metals of Ni–Co–W catalysts with varying W contents were reported. Moreover, Ni/Co ratios were adjusted to find the optimum metal ratios that would result in the highest MOR activity using the simplest, least energy-demanding method to prepare cost-effective materials that are stable under operating conditions in an alkaline medium. This novel approach harnesses the synergistic effects of multi-metal components to enhance the catalytic performance, offering superior activity and stability compared to traditional catalyst formulations. The development of efficient catalysts for the MOR is critical for advancing direct methanol fuel cells and portable power devices, thereby promoting the transition to sustainable energy sources. Overall, the fabrication of the nickel–cobalt–tungsten nanocomposite underscores the importance of addressing current challenges in catalysis and highlights the potential for significant impact in the field of clean energy research. This work not only addresses the urgent need for efficient catalysts in methanol oxidation but also opens avenues for further exploration and innovation in the design of advanced nanomaterials for various energy applications. Through comprehensive characterization and evaluation, the study provides valuable insights into the structure–function relationships governing the catalytic activity.
2. Materials and methods
2.1. Materials
Sodium tungstate dihydrate (Na2WO4·2H2O), nickel chloride hexahydrate (NiCl2·6H2O), cobalt chloride hexahydrate (CoCl2·6H2O), methanol (99.999%), potassium hydroxide (KOH), Nafion solution (5% wt), sodium hydroxide (NaOH) and isopropyl alcohol were all of analytical grade and used without any treatment. Distilled water was used for preparing all solutions.2.2. Preparation of the nanocomposites
To prepare the nanocomposites, a synthesis route similar to that reported in ref. 28 with slight modifications in the heat treatment was adopted. The preparation process is summarized in Fig. S1.† Briefly, a required amount of sodium tungstate dihydrate (Na2WO4·2H2O) was dissolved in 20 mL distilled water with stirring using a magnetic stirrer to form solution A, and the required amounts of nickel and cobalt salts were dissolved together in approximately 5 mL distilled water under sonication to prepare a very high concentrated liquid named solution B. Then, solution B was added dropwise to solution A under stirring and kept stirring for 5 min. The samples were left to digest in the solution for 48 hours. After that, the samples were centrifuged and washed several times with distilled water. Finally, they were dried at 35 °C until they are completely dry. The samples were obtained and ground in a mortar. They were ready for testing. Ni and Co molar ratios were kept constant at 1/1, while the W ratio should be changed (0.5, 1, 1.5, 2 and 4 mol). The samples are named according to the W ratio, and then the Ni/Co ratios were adjusted to 2/1, 1/2 and 3/1 denoted as WA, WB and WC respectively. For comparison, two binary metal samples were prepared, i.e. CW = between Co and W and NW = between Ni and W with a molar ratio of 1/1; all preparations are summarized in Table 1.| Name | Ni (moles) | Co (moles) | W (moles) | Ratio (Ni![[thin space (1/6-em)]](https://www.rsc.org/images/entities/char_2009.gif) : :![[thin space (1/6-em)]](https://www.rsc.org/images/entities/char_2009.gif) Co Co![[thin space (1/6-em)]](https://www.rsc.org/images/entities/char_2009.gif) : :![[thin space (1/6-em)]](https://www.rsc.org/images/entities/char_2009.gif) W) W) |
Ratio (Ni/Co![[thin space (1/6-em)]](https://www.rsc.org/images/entities/char_2009.gif) : :![[thin space (1/6-em)]](https://www.rsc.org/images/entities/char_2009.gif) W) W) |
|---|---|---|---|---|---|
| W0.5 | 0.0025 | 0.0025 | 0.0013 | 1![[thin space (1/6-em)]](https://www.rsc.org/images/entities/char_2009.gif) : :![[thin space (1/6-em)]](https://www.rsc.org/images/entities/char_2009.gif) 1 1![[thin space (1/6-em)]](https://www.rsc.org/images/entities/char_2009.gif) : :![[thin space (1/6-em)]](https://www.rsc.org/images/entities/char_2009.gif) 0.5 0.5 |
1![[thin space (1/6-em)]](https://www.rsc.org/images/entities/char_2009.gif) : :![[thin space (1/6-em)]](https://www.rsc.org/images/entities/char_2009.gif) 0.25 0.25 |
| W1 | 0.0025 | 0.0025 | 0.0025 | 1![[thin space (1/6-em)]](https://www.rsc.org/images/entities/char_2009.gif) : :![[thin space (1/6-em)]](https://www.rsc.org/images/entities/char_2009.gif) 1 1![[thin space (1/6-em)]](https://www.rsc.org/images/entities/char_2009.gif) : :![[thin space (1/6-em)]](https://www.rsc.org/images/entities/char_2009.gif) 1 1 |
1![[thin space (1/6-em)]](https://www.rsc.org/images/entities/char_2009.gif) : :![[thin space (1/6-em)]](https://www.rsc.org/images/entities/char_2009.gif) 0.5 0.5 |
| W1.5 | 0.0025 | 0.0025 | 0.0038 | 1![[thin space (1/6-em)]](https://www.rsc.org/images/entities/char_2009.gif) : :![[thin space (1/6-em)]](https://www.rsc.org/images/entities/char_2009.gif) 1 1![[thin space (1/6-em)]](https://www.rsc.org/images/entities/char_2009.gif) : :![[thin space (1/6-em)]](https://www.rsc.org/images/entities/char_2009.gif) 1.5 1.5 |
1![[thin space (1/6-em)]](https://www.rsc.org/images/entities/char_2009.gif) : :![[thin space (1/6-em)]](https://www.rsc.org/images/entities/char_2009.gif) 0.75 0.75 |
| W2 | 0.0025 | 0.0025 | 0.0050 | 1![[thin space (1/6-em)]](https://www.rsc.org/images/entities/char_2009.gif) : :![[thin space (1/6-em)]](https://www.rsc.org/images/entities/char_2009.gif) 1 1![[thin space (1/6-em)]](https://www.rsc.org/images/entities/char_2009.gif) : :![[thin space (1/6-em)]](https://www.rsc.org/images/entities/char_2009.gif) 2 2 |
1![[thin space (1/6-em)]](https://www.rsc.org/images/entities/char_2009.gif) : :![[thin space (1/6-em)]](https://www.rsc.org/images/entities/char_2009.gif) 1 1 |
| W4 | 0.0025 | 0.0025 | 0.0100 | 1![[thin space (1/6-em)]](https://www.rsc.org/images/entities/char_2009.gif) : :![[thin space (1/6-em)]](https://www.rsc.org/images/entities/char_2009.gif) 1 1![[thin space (1/6-em)]](https://www.rsc.org/images/entities/char_2009.gif) : :![[thin space (1/6-em)]](https://www.rsc.org/images/entities/char_2009.gif) 4 4 |
1![[thin space (1/6-em)]](https://www.rsc.org/images/entities/char_2009.gif) : :![[thin space (1/6-em)]](https://www.rsc.org/images/entities/char_2009.gif) 2 2 |
| WA | 0.0033 | 0.0017 | 0.0038 | 2![[thin space (1/6-em)]](https://www.rsc.org/images/entities/char_2009.gif) : :![[thin space (1/6-em)]](https://www.rsc.org/images/entities/char_2009.gif) 1 1![[thin space (1/6-em)]](https://www.rsc.org/images/entities/char_2009.gif) : :![[thin space (1/6-em)]](https://www.rsc.org/images/entities/char_2009.gif) 2.25 2.25 |
1![[thin space (1/6-em)]](https://www.rsc.org/images/entities/char_2009.gif) : :![[thin space (1/6-em)]](https://www.rsc.org/images/entities/char_2009.gif) 0.75 0.75 |
| WB | 0.0017 | 0.0033 | 0.0038 | 1![[thin space (1/6-em)]](https://www.rsc.org/images/entities/char_2009.gif) : :![[thin space (1/6-em)]](https://www.rsc.org/images/entities/char_2009.gif) 2 2![[thin space (1/6-em)]](https://www.rsc.org/images/entities/char_2009.gif) : :![[thin space (1/6-em)]](https://www.rsc.org/images/entities/char_2009.gif) 2.25 2.25 |
1![[thin space (1/6-em)]](https://www.rsc.org/images/entities/char_2009.gif) : :![[thin space (1/6-em)]](https://www.rsc.org/images/entities/char_2009.gif) 0.75 0.75 |
| WC | 0.0038 | 0.0013 | 0.0038 | 3![[thin space (1/6-em)]](https://www.rsc.org/images/entities/char_2009.gif) : :![[thin space (1/6-em)]](https://www.rsc.org/images/entities/char_2009.gif) 1 1![[thin space (1/6-em)]](https://www.rsc.org/images/entities/char_2009.gif) : :![[thin space (1/6-em)]](https://www.rsc.org/images/entities/char_2009.gif) 3 3 |
1![[thin space (1/6-em)]](https://www.rsc.org/images/entities/char_2009.gif) : :![[thin space (1/6-em)]](https://www.rsc.org/images/entities/char_2009.gif) 0.75 0.75 |
| CW | 0 | 0.0025 | 0.0025 | 0![[thin space (1/6-em)]](https://www.rsc.org/images/entities/char_2009.gif) : :![[thin space (1/6-em)]](https://www.rsc.org/images/entities/char_2009.gif) 1 1![[thin space (1/6-em)]](https://www.rsc.org/images/entities/char_2009.gif) : :![[thin space (1/6-em)]](https://www.rsc.org/images/entities/char_2009.gif) 1 1 |
1![[thin space (1/6-em)]](https://www.rsc.org/images/entities/char_2009.gif) : :![[thin space (1/6-em)]](https://www.rsc.org/images/entities/char_2009.gif) 1 1 |
| NW | 0.0025 | 0 | 0.0025 | 1![[thin space (1/6-em)]](https://www.rsc.org/images/entities/char_2009.gif) : :![[thin space (1/6-em)]](https://www.rsc.org/images/entities/char_2009.gif) 0 0![[thin space (1/6-em)]](https://www.rsc.org/images/entities/char_2009.gif) : :![[thin space (1/6-em)]](https://www.rsc.org/images/entities/char_2009.gif) 1 1 |
1![[thin space (1/6-em)]](https://www.rsc.org/images/entities/char_2009.gif) : :![[thin space (1/6-em)]](https://www.rsc.org/images/entities/char_2009.gif) 1 1 |
2.3. Characterization of the prepared materials
The nanocomposites' characterization was carried out using an X-ray diffractometer (PANalytical Empyrean) with Cu Kα radiation (wavelength λ = 1.54060 Å) and generator settings of continuous scan: 40 kV, 30 mA, scan range 10–80° and scan step of 0.04°. The microstructure was examined using a high-resolution transmission electron microscope (HRTEM, JEOL, JEM-2100, Japan operated at 200 kV). The surface morphology and elemental mapping were studied using a field emission scanning electron microscope (Zeiss Sigma 500VP Analytical FESEM) equipped with an EDX detector. The operation conditions of SEM are illustrated within every image. The chemical composition determination and the metal oxidation state were characterized by X-ray photoelectron spectroscopy (XPS, K-ALPHA, Thermo Fisher Scientific, USA).2.4. Electrode preparation
First, 5 mg of the prepared powder sample was taken into a small Eppendorf tube. Then 400 μL of isopropyl was added and sonicated for homogeneity, following which 15 μL of Nafion (5%) was added. The suspension was sonicated again for 20 min in order to get a stable and homogeneous suspension. Then 15 μL of the suspension was dropped on the glassy carbon electrode (5 μL × 3 times) and left to dry completely at room temperature.2.5. Electrochemical measurements
The electrochemical measurements were carried out in a three-electrode electrochemical cell configuration using a potentiostat–galvanostat (Autolab PGSTAT302N – Metrohm), with Ag/AgCl as the reference electrode, a graphite electrode as the counter electrode and a glassy carbon electrode with 3 mm-diameter active area as the working electrode. Cyclic voltammetry (CV) measurements were carried out in a potential window from 0 to 0.6 V. The activation of the materials was done to stabilize the materials' response in the electrochemical measurements by cycling the system in 1 M KOH electrolyte for 50 cycles at a scan rate of 100 mV s−1. The stability of samples was measured by chronoamperometry for 3600 s under 0.6 V, and the electrochemical impedance spectroscopy data were also recorded within the frequency range of 0.01–100![[thin space (1/6-em)]](https://www.rsc.org/images/entities/char_2009.gif) 000 Hz.
000 Hz.
3. Results and discussion
3.1 Material characterization and analysis
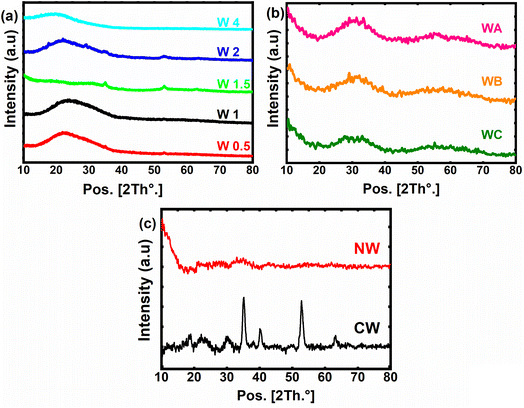
The XRD patterns of the prepared materials are presented in Fig. 1. The XRD analysis confirms the preparation of amorphous structures with clear X-ray amorphous features showing broad hump and faint peaks (Fig. 1). Fig. 1a shows the XRD pattern of W1, W1.5, W2 and W4, where they have shared peaks at around 2θ of 32° and 52.9°, confirming the successful preparation of Ni–Co–W mixed-metal oxides with some crystalline character.29 Furthermore, W0.5 shows a very low hump, indicating the amorphous structure of this sample. Fig. 1b compares the XRD patterns for WA, WB and WC, in which the crystalline character was observed with a shared peak centered at 2θ of 32° and 59°. Moreover, there is a reduction in the peak's intensity at 2θ of 32° from WA to WB and WC, suggesting a lower crystallite size for WC.30 In addition, CW and NW (Fig. 1c) are sharing two peaks at 2θ of 32° and 59°, exhibiting some crystalline structures for cobalt and tungsten composites, which matched with JCPDS card no. 00-015-0867, and for nickel–tungsten oxide nanocomposite with JCPDS card no. 00-015-0755.31 In general, all the nanocomposites have predominant amorphous structures with only a few observed peaks indicating low crystalline features.XPS analysis was conducted on sample W1.5 (Fig. 2) to investigate the surface chemistry and oxidation states of the elements. The survey spectrum (Fig. 2a) confirmed the presence of elements O, Ni, Co, W, and C in the sample, indicating the successful preparation of the nanocomposites. To ensure accurate alignment of the C peak, peak correction was performed to adjust its position from 287.7 eV to 284.8 eV, following the established literature standard. This correction is crucial to properly interpret the subsequent peak positions and energy shifts of the other elements within the correct energy scale. With the corrected peak positions, the observed shifts in the XPS peaks can now be analyzed and compared accurately to understand the bonding and chemical interactions between the elements in the compound.
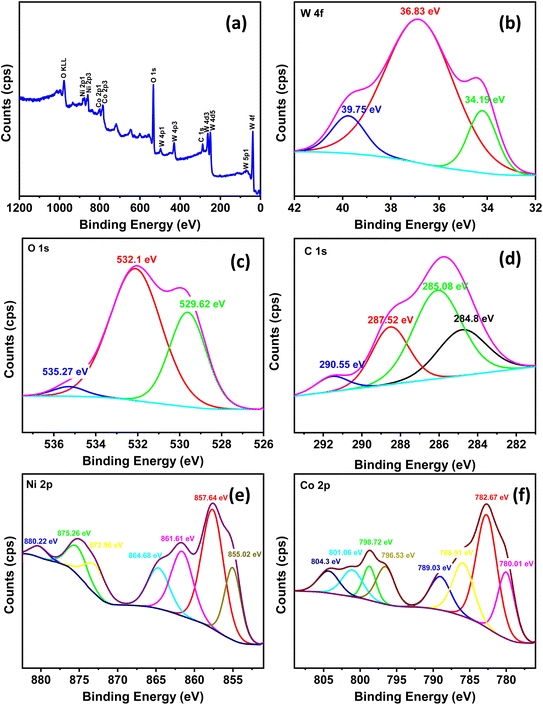 | ||
| Fig. 2 XPS of the W1.5 sample: (a) survey spectra, (b) W 4f, (c) O 1s, (d) C 1s, (e) Ni 2p and (f) Co 2p. | ||
The W 4f peak at 39.75 eV was assigned based on previous studies,32,33 as shown in (Fig. 2b). The O 1s spectrum (Fig. 2c) exhibited characteristic peaks for oxygen–metal bonds at 529.82 eV and 532.1 eV (C![[double bond, length as m-dash]](https://www.rsc.org/images/entities/char_e001.gif) O) and 535.27 eV (H2O).34–37 The carbon peaks in Fig. 2d indicated the presence of adsorbed carbon from the air, with peaks located at 284.8 eV (C–C(sp2)), 285.08 eV (C–C(sp3)), 287.52 eV (C
O) and 535.27 eV (H2O).34–37 The carbon peaks in Fig. 2d indicated the presence of adsorbed carbon from the air, with peaks located at 284.8 eV (C–C(sp2)), 285.08 eV (C–C(sp3)), 287.52 eV (C![[double bond, length as m-dash]](https://www.rsc.org/images/entities/char_e001.gif) O), and 290.55 eV (O–C
O), and 290.55 eV (O–C![[double bond, length as m-dash]](https://www.rsc.org/images/entities/char_e001.gif) O).38,39 The Ni 2p spectrum in Fig. 2e exhibited peaks for Ni 2p1/2 at 872.96 eV and satellite peaks at 880.22 eV and 875.26 eV. For Ni 2p3/2, two peaks were observed at 855.02 eV and 857.64 eV, along with satellite peaks at 864.68 eV and 861.61 eV.37,40,41 Similarly, the Co 2p peaks in Fig. 2f were observed at 798.72 eV and 796.53 eV for 2p1/2, with satellite peaks at 801.06 eV and 804.3 eV. The Co 2p3/2 peaks were located at 780.01 eV and 782.67 eV, with satellite peaks at 789.03 eV and 785.91 eV.37,40,41
O).38,39 The Ni 2p spectrum in Fig. 2e exhibited peaks for Ni 2p1/2 at 872.96 eV and satellite peaks at 880.22 eV and 875.26 eV. For Ni 2p3/2, two peaks were observed at 855.02 eV and 857.64 eV, along with satellite peaks at 864.68 eV and 861.61 eV.37,40,41 Similarly, the Co 2p peaks in Fig. 2f were observed at 798.72 eV and 796.53 eV for 2p1/2, with satellite peaks at 801.06 eV and 804.3 eV. The Co 2p3/2 peaks were located at 780.01 eV and 782.67 eV, with satellite peaks at 789.03 eV and 785.91 eV.37,40,41
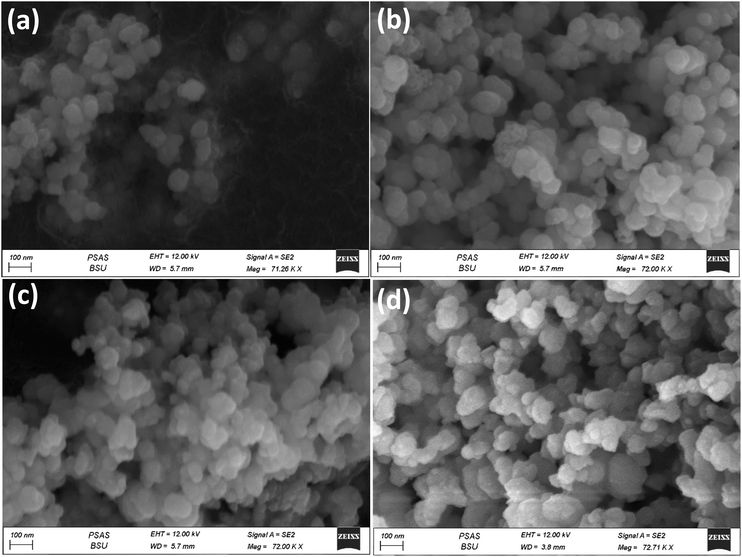
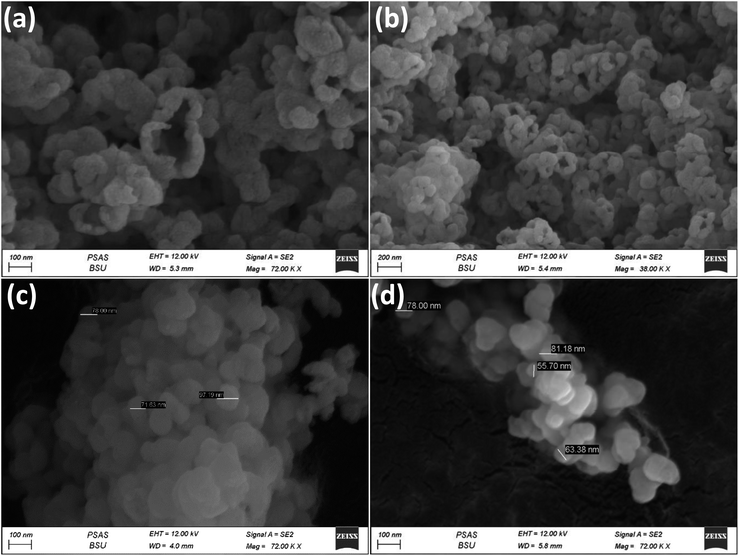
In order to investigate the morphology of the prepared materials, FESEM was used (Fig. 3, 4 and S2†). It can be easily observed that the materials all exist in cluster forms of sphere-like structures. For example, for samples WA, WB, WC and W1.5, Fig. 3a–d show highly similar surface structures without any considerable differences on the same magnification scale. Fig. S2† shows the FESEM images for W0.5, W1, W1.5, W2 and W4, which also exhibit the agglomerated spherical structure with a particle size between about 60 nm to 90 nm as in the case of W1.5 (Fig. S2c†). There can be several factors for this large particle size but mainly with our samples we suggest one of two reasons: (i) during synthesis, nucleation occurs rapidly and/or particle growth processes dominate over nucleation, which can result in the formation of larger nanoparticles. (ii) The agglomeration of nanoparticles leads to larger clusters/particles.
Fig. 4a and b show the unique morphology for W1 with encapsulation feature for the particles on low- and high-magnification scales. However, this morphology was not observed in other samples, implying that it had the highest crystalline character in the TEM diffraction patterns. It can be said that these encapsulations are crystal-oriented formation. Noting that the crystallinity of the material does not add to the performance in the MOR, amorphous W1.5 and W0.5 are the highest performers. It was also reported that amorphous materials can be more efficient than crystalline counters in different electrochemical measurements, as the wide surface structure anomalies would promote more surface exposure towards the desired electrochemical species.42,43 CW and NW also show similar morphological features in SEM like other samples (Fig. 4c and d); CW and NW had particle sizes around 70–100 nm.
EDX analysis was carried out for the samples, and the results of the elemental percentages are shown in Fig. S3;† the elemental percentage of samples' matches well with the prepared ratios. The elemental mapping analysis was carried out for the W1.5 sample (Fig. 5). The selected mapping region together with the elemental distribution percentages are shown in Fig. 5A. Moreover, there are homogeneous distributions of the targeted elements; Ni, Co, W, and O throughout the entire structure (Fig. 5C and D).
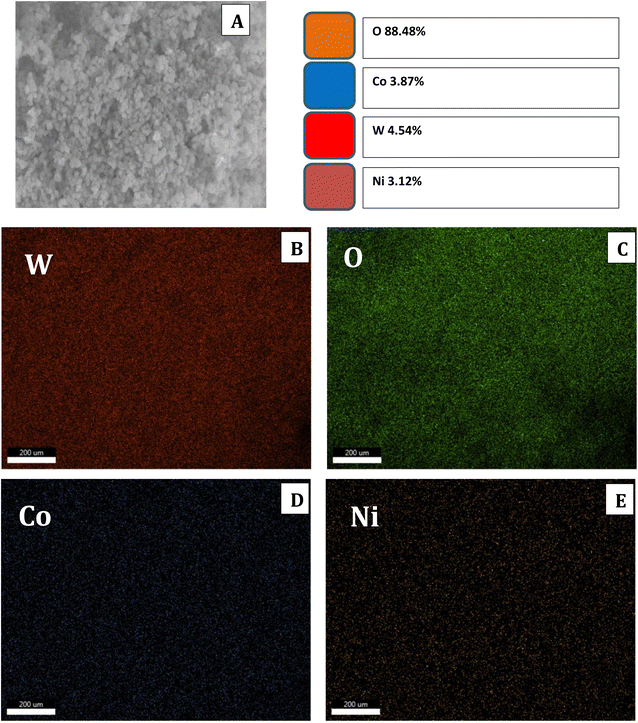 | ||
| Fig. 5 FESEM mapping region of sample W1.5 (A), mapping of elements (B) W, (C) O, (D) Co, and (E) Ni. | ||
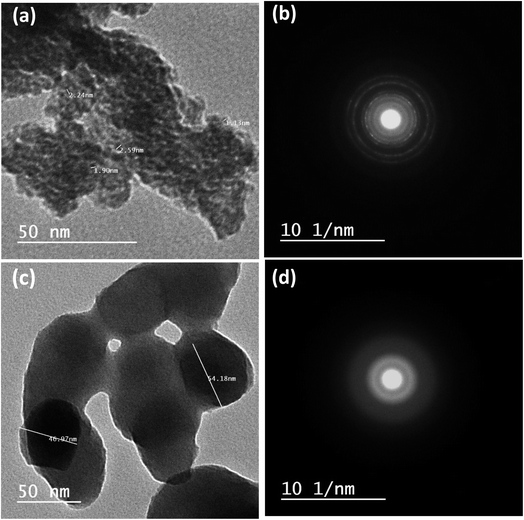
The HRTEM images confirm the synthesis of small particles for samples CW and NW, as shown in Fig. 6. All particles exist in agglomerated clusters. The diffraction patterns indicate a mixture of amorphous and very low crystalline structures, manifesting as diffused auras, as shown for samples W0.5, W1, W1.5, and W2 in Fig. S4.† CW (Fig. 6a) has a completely homogeneous morphology and semicrystalline diffraction pattern as in Fig. 1c and 6b. While NW has a larger particle size and stacked platelet morphology with an amorphous diffraction pattern (Fig. 6c and d). W2 shows the mixture of morphologies (i.e., amorphous round particles and the stacked platelets; Fig. S5a and b†). This heterogeneous structure might lead us to expect a better performance, as they (i) often exhibit a higher surface area with varied surface morphology, which can provide more active sites for the MOR, (ii) heterogeneous structures mostly consist of multiple phases each with distinct properties, and the interaction between these phases could lead to synergistic effects, where the combined properties of the phases increase the overall catalytic reaction, and (iii) diverse structures in heterogeneous catalysts may exhibit increased resistance to catalyst poisoning, as the presence of multiple active sites can counteract the impact of poisoning, allowing for longer active life. Yet it was not the case. W2 ranked 3rd in performance. The heterogeneity here was found to decrease the material's performance than W1.5 and W0.5, suggesting that different morphologies with specific ratios might in fact lower the performance, rather than aiding to one route of the reaction, which could be due to (i) lower mass transport where the highly porous structure can result in inefficient diffusion of particles to the active sites, reducing the catalytic activity; (ii) the complex morphologies may restrict access to active sites, which leads to decreased active surface area; and (iii) the interaction between different morphologies may be weak or sometimes unfavorable. With the platelet morphology having the lowest reactivity (it is the NW morphology, that has the lowest MOR kinetics), the dominant existence of this morphology in W2 (as shown in TEM, Fig. S5†) has led the interaction with other morphologies to lower the overall MOR, as observed in the electrochemical measurements. The dominant morphology of W1.5 (Fig. S6a†) shows amorphous round particles, with low amounts of platelet structure. W0.5 (the second best performer after W1.5) does not seem to have any of the round morphologies (Fig. S6b†).
We can attribute the W0.5 high performance to the low amount of tungsten (0.5) in the sample, which had promoted the platelets to be formed in an irregularly deformed way creating porous microstructures as shown in Fig. S6b,† increasing the possibilities of ionic interaction with the pores, hence increasing the performance. Noting that the low ratio of W could not promote the construction of the small round particle morphology.
The active sites for catalysis in the nanocomposite are likely distributed throughout the nanostructured material and may include metal–metal interfaces, surface defects, and metal–oxide interfaces; we cannot say that there is only one morphology that leads the overall MOR, as each morphology has its unique contribution to the MOR. The NW (platelet morphology, Fig. 6c) had the lowest MOR, but when combined with Co and W in the structure as in W0.5, we observe great performance improvement, even though the morphology is still platelet based. The small size of round particles provides a high surface-to-volume ratio, maximizing the density of active sites and promoting intimate contact between the catalyst and reactants. The platelet-dominant morphology (W0.5) offers a large surface area due to its planar structure. This increased surface area provides large active sites for methanol adsorption and oxidation, enhancing the overall MOR. Additionally, the flat/porous characterizations of the platelets could facilitate the adsorption of methanol molecules in a favorable orientation, promoting higher performance.
Meaning that not just the amorphous structure is responsible for the performance, the morphology of that amorphous structure is a main contributor, as can be seen different performances for each structure. Therefore, the Co contribution to these deformities is highly desirable and plays a major role in the MOR, as CW was found to have very high performance in the MOR, much higher than NW. W1 appears to have semicrystalline structures according to the XRD and TEM image (Fig. S4b–S7a†), and even though the material is in a small size range, it was not enough to increase the performance of the sample. In addition, it has almost identical morphology to CW (Fig. S7a and b†), in which case the addition of Ni has decreased the performance of W1 towards the MOR. When increasing the W molar ratio from W1 to W1.5, a drastic increase in the performance was observed. With concrete consideration to all these observations, it is vital to conduct further studies on how the compounds are formed and what are the main factors guiding the formation of different structures. During the synthesis of the samples, all factors were kept constant at standard temperature/pressure conditions; except for the W mole ratio, no other factors were considered nor studied for this work.
The BET surface area was also calculated for the samples to find out that the highest surface area for W1.5 as in Table 2, with all results to be in good accordance with the electrochemical performance of the samples. The adsorption/desorption isotherms are shown in Fig. 7; we can observe that most isotherms do not show any hysteresis except for W1.5 (Fig. 7C), which shows very small hysteresis. With the results of pore size distribution (Fig. 7G), we found the material to be mesoporous with a pore size ranging between 3 and 4 nm for W1.5, and a similar range for other samples 3–6 nm. Hysteresis loops are characteristic of mesoporous materials; yet in some cases, the mesopores may be well connected and exhibit a narrow distribution, resulting in a more reversible adsorption–desorption behavior without a pronounced hysteresis loop, as shown in the isotherms. This typically indicates that the adsorption and desorption processes occur at similar relative pressures without any significant trapping or hindrance of the adsorbed gas within the pores. This behavior is often observed in materials with well-defined mesopores or slit-shaped pores. W0.5, W1.5 and CW had the highest surface areas of all samples, and it is suggested that W1.5 had the highest surface area along with the smallest range or pore size due to the different morphologies that overlapped in structure as discussed in TEM results. Since all samples show similar mixed morphologies under SEM and TEM, it can be confirmed from the surface area measurements that samples W1, W2 and W4 have higher ratios of “staked platelets” morphology, which reduces the pore accessibility, hence reducing the surface area, and for samples W0.5 and W1.5, they would possess the highest ratio of the round sphere-like morphologies, which have more pore accessibility leading to more surface area. This change in morphology distribution can only be attributed to the W molar ratio added.
| Name | Ratio (Ni![[thin space (1/6-em)]](https://www.rsc.org/images/entities/char_2009.gif) : :![[thin space (1/6-em)]](https://www.rsc.org/images/entities/char_2009.gif) Co Co![[thin space (1/6-em)]](https://www.rsc.org/images/entities/char_2009.gif) : :![[thin space (1/6-em)]](https://www.rsc.org/images/entities/char_2009.gif) W) W) |
BET surface area (m2 g−1) |
|---|---|---|
| W0.5 | 1![[thin space (1/6-em)]](https://www.rsc.org/images/entities/char_2009.gif) : :![[thin space (1/6-em)]](https://www.rsc.org/images/entities/char_2009.gif) 1 1![[thin space (1/6-em)]](https://www.rsc.org/images/entities/char_2009.gif) : :![[thin space (1/6-em)]](https://www.rsc.org/images/entities/char_2009.gif) 0.5 0.5 |
66 |
| W1 | 1![[thin space (1/6-em)]](https://www.rsc.org/images/entities/char_2009.gif) : :![[thin space (1/6-em)]](https://www.rsc.org/images/entities/char_2009.gif) 1 1![[thin space (1/6-em)]](https://www.rsc.org/images/entities/char_2009.gif) : :![[thin space (1/6-em)]](https://www.rsc.org/images/entities/char_2009.gif) 1 1 |
16 |
| W1.5 | 1![[thin space (1/6-em)]](https://www.rsc.org/images/entities/char_2009.gif) : :![[thin space (1/6-em)]](https://www.rsc.org/images/entities/char_2009.gif) 1 1![[thin space (1/6-em)]](https://www.rsc.org/images/entities/char_2009.gif) : :![[thin space (1/6-em)]](https://www.rsc.org/images/entities/char_2009.gif) 1.5 1.5 |
88 |
| W2 | 1![[thin space (1/6-em)]](https://www.rsc.org/images/entities/char_2009.gif) : :![[thin space (1/6-em)]](https://www.rsc.org/images/entities/char_2009.gif) 1 1![[thin space (1/6-em)]](https://www.rsc.org/images/entities/char_2009.gif) : :![[thin space (1/6-em)]](https://www.rsc.org/images/entities/char_2009.gif) 2 2 |
18 |
| W4 | 1![[thin space (1/6-em)]](https://www.rsc.org/images/entities/char_2009.gif) : :![[thin space (1/6-em)]](https://www.rsc.org/images/entities/char_2009.gif) 1 1![[thin space (1/6-em)]](https://www.rsc.org/images/entities/char_2009.gif) : :![[thin space (1/6-em)]](https://www.rsc.org/images/entities/char_2009.gif) 4 4 |
22 |
| CW | 0![[thin space (1/6-em)]](https://www.rsc.org/images/entities/char_2009.gif) : :![[thin space (1/6-em)]](https://www.rsc.org/images/entities/char_2009.gif) 1 1![[thin space (1/6-em)]](https://www.rsc.org/images/entities/char_2009.gif) : :![[thin space (1/6-em)]](https://www.rsc.org/images/entities/char_2009.gif) 1 1 |
61 |
| NW | 1![[thin space (1/6-em)]](https://www.rsc.org/images/entities/char_2009.gif) : :![[thin space (1/6-em)]](https://www.rsc.org/images/entities/char_2009.gif) 0 0![[thin space (1/6-em)]](https://www.rsc.org/images/entities/char_2009.gif) : :![[thin space (1/6-em)]](https://www.rsc.org/images/entities/char_2009.gif) 1 1 |
12 |
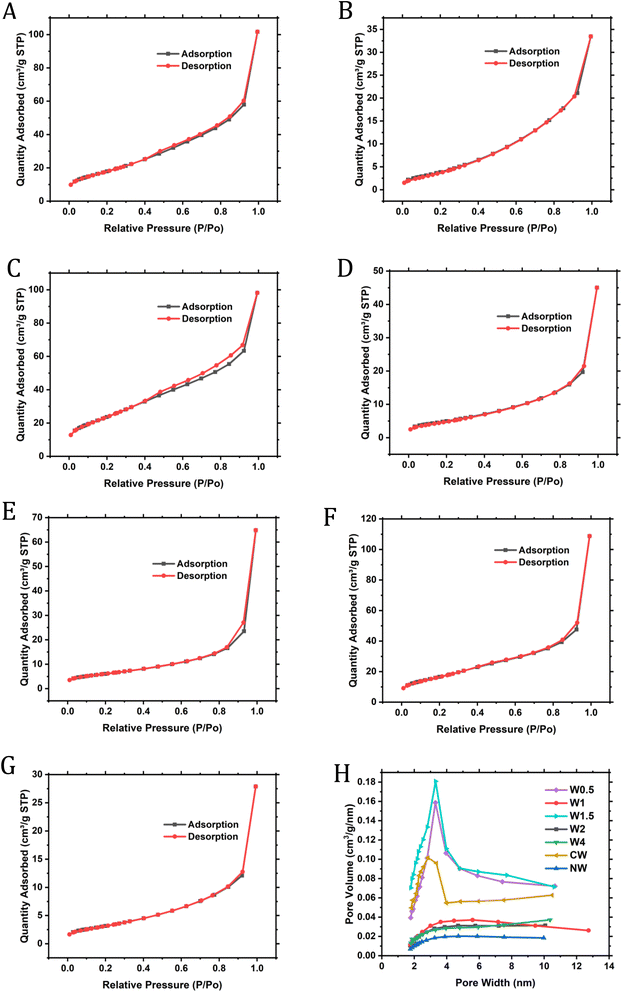 | ||
| Fig. 7 BET isotherms for W0.5 (A), W1 (B), W1.5 (C), W2 (D), W4 (E), CW (F), NW (G) and pore size distribution for samples (H). | ||
3.2 Electrochemical measurements
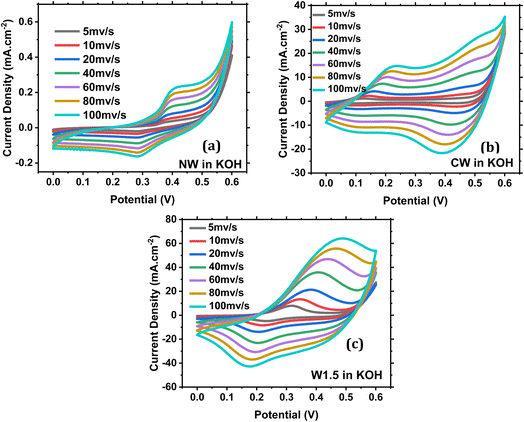
The different W ratios used in each sample were found to influence the overall performance in the MOR, and it is known that W does not add up to the redox reaction, but it only enhances the conductivity of the material, so it can be said that W works on boosting the effect of Co and Ni towards the MOR.44,45 NW (Fig. 8a) has only one single redox peak at Epa = 0.397 V and Epc = 0.283 V corresponding to Ni3+/Ni2+. While CW (Fig. 8b) has two redox peaks with Epa = 0.197 V and 0.480 V and Epc = 0.1 V and 0.410 V corresponding to Co4+/Co3+ and Co3+/Co2+ respectively. All other samples had one redox couple such as W1.5 (Fig. 8c).Fig. S8† shows the response of NW, CW and W1.5 electrodes in the presence of 1 M methanol. A sharp methanol oxidation peak is noticed for the three catalysts. The obtained current densities for NW, CW and W1.5 catalysts are 1.36, 70 and 229 mA cm−2 respectively. These results show promising activity towards methanol electro-oxidation for the W1.5 catalyst.
The onset potentials (Vonset) in 1 M KOH + 1 M methanol at 50 mV s−1 along with the anodic (Epa) and cathodic (Epc) peak potentials are shown in Table 3 and Fig. S9.†Vonset was recorded to be the first observed increase in the current density. The lowest onset potential was obtained for W1.5, which is equal to 0.33 V.
| Sample | V onset (at 50 mV s−1 in KOH + MeOH) (V) | E pa (at 50 mV s−1 in 1 M KOH) (V) | E pc (at 50 mV s−1 in 1 M KOH) (V) |
|---|---|---|---|
| CW | 0.38 | 0.20 | 0.10 |
| 0.48 | 0.41 | ||
| NW | 0.36 | 0.40 | 0.28 |
| W1.5 | 0.33 | 0.39 | 0.22 |
| WA | 0.41 | 0.40 | 0.16 |
| WB | 0.38 | 0.38 | 0.22 |
| WC | 0.39 | 0.36 | 0.19 |
The activity of W0.5 in 1 M KOH and 1 M KOH + 1 M MeOH is shown in Fig. S10.† As it can be seen in Fig. S10a,† W0.5 shows excellent electrochemical activity in 1 M KOH, with one redox peak at about 0.2 V and 0.4 V, which is attributed to the transition between Co4+ and Co3+. An excellent activity for methanol oxidation is also observed for W0.5 with the increase in the current density to 130 mA cm−2, as shown in Fig. S10b.† A comparison between W0.5 activities in KOH and KOH + MeOH electrolytes is shown in Fig. S10c.† In addition, the electrochemical response for W0.5 in the presence of different concentrations of methanol, 0.5 M, 0.75 M and 1 M, is shown in Fig. S10d.†
Fig. 9 compares the activity of all the prepared samples in both KOH and KOH + MeOH electrolytes. It must be said that W1 (Fig. 9a and S11†) should have an even higher activity due to its clear open-hole structures observed using a SEM (Fig. 4a and b), but its lower performance in methanol oxidation is likely attributed to the increased crystallinity as shown in the TEM images (Fig. S7a†). It can be suggested that these holes would act as traps that would hold the molecules or any byproducts of methanol electro-oxidation and stop any further oxidation for other molecules, or even reduce the active surface area. These molecules could be any chemical species within the system.
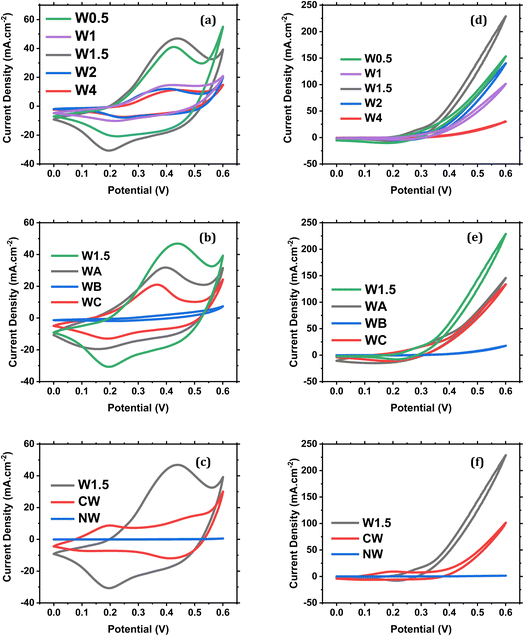 | ||
| Fig. 9 Comparison between sample performance in 1 M KOH at 50 mV s−1 (a–c) and in 1 M KOH + 1 M methanol (d–f). | ||
When changing the Ni/Co ratio, it was found that the performance decreased dramatically at higher Co ratios than Ni (Fig. 9b–e). Moreover, when further increasing the Ni![[thin space (1/6-em)]](https://www.rsc.org/images/entities/char_2009.gif) :
:![[thin space (1/6-em)]](https://www.rsc.org/images/entities/char_2009.gif) Co proportion from 2
Co proportion from 2![[thin space (1/6-em)]](https://www.rsc.org/images/entities/char_2009.gif) :
:![[thin space (1/6-em)]](https://www.rsc.org/images/entities/char_2009.gif) 1 (WA) to 3
1 (WA) to 3![[thin space (1/6-em)]](https://www.rsc.org/images/entities/char_2009.gif) :
:![[thin space (1/6-em)]](https://www.rsc.org/images/entities/char_2009.gif) 1 (WC), a very close response in the MOR was noticed, indicating the formation of a stable compound; yet the highest performance still goes to 1/1 Ni/Co ratio (W1.5). Fig. 9f compares the current densities for methanol oxidation of W1.5, CW and NW electrodes. The anodic peak potential of W1.5 for methanol oxidation is not subjected to big change with changing the methanol concentration (Fig. S12†), indicating that increasing the methanol concentration does not change the electron transfer kinetics, and hence a stable surface response.46 Fig. S13 and S14† display the effect of different scan rates on the activity of NW and CW in KOH and KOH + MeOH electrolytes. A limited current density is noticed in case of NW whether in the KOH electrolyte or in the KOH + MeOH electrolyte (0.54 mA cm−2 and 1.36 mA cm−2 respectively). An increase in the current density is obtained in case of CW that reaches about 110 mA cm−2.
1 (WC), a very close response in the MOR was noticed, indicating the formation of a stable compound; yet the highest performance still goes to 1/1 Ni/Co ratio (W1.5). Fig. 9f compares the current densities for methanol oxidation of W1.5, CW and NW electrodes. The anodic peak potential of W1.5 for methanol oxidation is not subjected to big change with changing the methanol concentration (Fig. S12†), indicating that increasing the methanol concentration does not change the electron transfer kinetics, and hence a stable surface response.46 Fig. S13 and S14† display the effect of different scan rates on the activity of NW and CW in KOH and KOH + MeOH electrolytes. A limited current density is noticed in case of NW whether in the KOH electrolyte or in the KOH + MeOH electrolyte (0.54 mA cm−2 and 1.36 mA cm−2 respectively). An increase in the current density is obtained in case of CW that reaches about 110 mA cm−2.
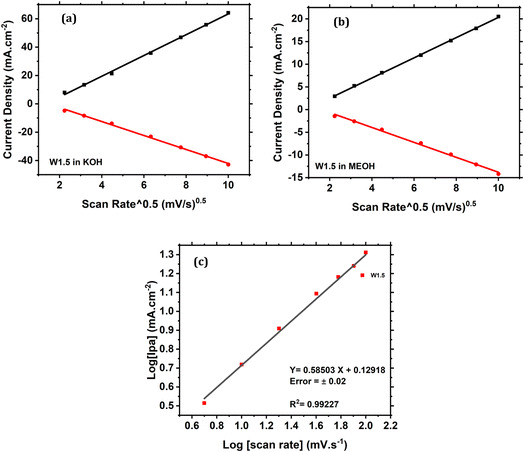
The peak current density of W1.5 is directly proportional to the square root of the scan rate (Fig. 10a and b), indicating that the reaction is controlled by the methanol diffusion. Moreover, the calculated slope of the line in Fig. 10c is 0.58, which is close to 0.5, indicating a diffusion-controlled current.47
In order to confirm the analytical significance of the data, each sample was prepared and tested two times and the data points were chosen to be the resulting current density at an applied potential of 6 V and a scan rate 50 mV s−1 in 1 M KOH + 1 M MEOH (Table S1†). The relative standard deviation (RSD) for each sample was calculated using eqn (2):48
| RSD% = (standard deviation/mean) × 100% | (2) |
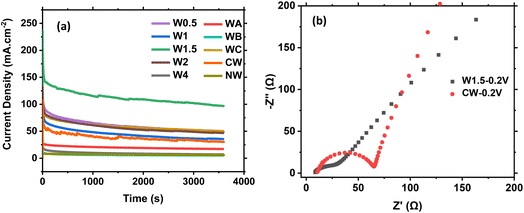
Sample stability is a very important parameter to be considered. Fig. 11a and S15† show the chronoamperometric response for the prepared materials at 0.6 V for 3600 s. The W1.5 electrode exhibits the highest current density output with minor fluctuations.
The electrochemical impedance spectroscopy (EIS) is also an important test that evaluates the conductivity of the material in terms of electrode resistance and equivalent series resistance of the cell. The EIS measurements were carried out to study the electrode/electrolyte interaction at a frequency range between 0.01 and 100![[thin space (1/6-em)]](https://www.rsc.org/images/entities/char_2009.gif) 000 Hz and at an applied voltage of 0.2 V. The Nyquist plot and EIS semicircle fitting curves for the most efficient composites for the MOR, CW and W1.5 are shown in Fig. 11b and S16.† In the EIS plots, a semicircle appears at high frequencies, which gives information about the charge transfer resistance between the electrode and electrolyte (Rct), electrolyte resistance (Rs) and the electrodes' equivalent series resistance (ESR), while a straight line appears at low frequencies, indicating the capacitive behavior and the MOR kinetics. The presence of one semicircle at a specific frequency and two semicircles at higher frequencies in an electrochemical impedance spectroscopy (EIS) measurement as in CW (Fig. S16c and d†), indicating the existence of multiple capacitive or inductive elements within the studied system. Each semicircle represents a different component contributing to the overall impedance response. The occurrence of one semicircle at low frequency suggests the presence of a larger capacitive or inductive element associated with a longer time constant. This can be related to phenomena such as double-layer capacitance at the electrode–electrolyte interface or diffusion-limited processes, while the appearance of two semicircles at higher frequencies indicates the presence of additional capacitive or inductive elements with shorter time constants. These elements may be attributed to interfacial capacitance, charge transfer processes, or other kinetic limitations within the system. CW at 0.2 V (Fig. 11b) shows a semicircle and straight line for ion diffusion with a low Rct of 56.2 Ω, as shown in the fitting curve (Fig. S16c†). W1.5 has a small incomplete semicircle and with semicircle fitting, and we obtained a straight line with no features of the semicircle, indicating that the system exhibits primarily resistive behavior without significant capacitive or inductive contributions. What that means is that when a system demonstrates resistive behavior without significant capacitive or inductive contributions, it implies that the system primarily opposes the flow of electric current without storing energy or causing phase shifts. It is known that the system's impedance is primarily determined by its resistance. This impedance remains relatively constant across a wide range of frequencies. Implying these information on electrochemical impedance spectroscopy (EIS), observing a straight line without a semicircle suggests that the electrochemical system being studied is primarily characterized by charge transfer processes or high conductivity, as shown in Fig. 11b and S16e,† indicating the lowest resistance and the highest charge transfer towards methanol oxidation due to higher conductivity and low ion diffusion resistance.
000 Hz and at an applied voltage of 0.2 V. The Nyquist plot and EIS semicircle fitting curves for the most efficient composites for the MOR, CW and W1.5 are shown in Fig. 11b and S16.† In the EIS plots, a semicircle appears at high frequencies, which gives information about the charge transfer resistance between the electrode and electrolyte (Rct), electrolyte resistance (Rs) and the electrodes' equivalent series resistance (ESR), while a straight line appears at low frequencies, indicating the capacitive behavior and the MOR kinetics. The presence of one semicircle at a specific frequency and two semicircles at higher frequencies in an electrochemical impedance spectroscopy (EIS) measurement as in CW (Fig. S16c and d†), indicating the existence of multiple capacitive or inductive elements within the studied system. Each semicircle represents a different component contributing to the overall impedance response. The occurrence of one semicircle at low frequency suggests the presence of a larger capacitive or inductive element associated with a longer time constant. This can be related to phenomena such as double-layer capacitance at the electrode–electrolyte interface or diffusion-limited processes, while the appearance of two semicircles at higher frequencies indicates the presence of additional capacitive or inductive elements with shorter time constants. These elements may be attributed to interfacial capacitance, charge transfer processes, or other kinetic limitations within the system. CW at 0.2 V (Fig. 11b) shows a semicircle and straight line for ion diffusion with a low Rct of 56.2 Ω, as shown in the fitting curve (Fig. S16c†). W1.5 has a small incomplete semicircle and with semicircle fitting, and we obtained a straight line with no features of the semicircle, indicating that the system exhibits primarily resistive behavior without significant capacitive or inductive contributions. What that means is that when a system demonstrates resistive behavior without significant capacitive or inductive contributions, it implies that the system primarily opposes the flow of electric current without storing energy or causing phase shifts. It is known that the system's impedance is primarily determined by its resistance. This impedance remains relatively constant across a wide range of frequencies. Implying these information on electrochemical impedance spectroscopy (EIS), observing a straight line without a semicircle suggests that the electrochemical system being studied is primarily characterized by charge transfer processes or high conductivity, as shown in Fig. 11b and S16e,† indicating the lowest resistance and the highest charge transfer towards methanol oxidation due to higher conductivity and low ion diffusion resistance.
For the least efficient composite, NW (Fig. S16a†) shows a semicircle at 0.2 V with high charge transfer resistance, which explains the low performance of this composite for the MOR. On studying the EIS at high potentials of 0.4 V, 0.5 V and 0.6 V, the NW experienced a shift for the semicircle towards higher frequencies, as shown in Fig. S16b,† meaning that on increasing the voltage there is a decrease in the charge transfer resistance. For CW, under high potentials showed the same shift as NW (Fig. S16c and d†), yet it also has another feature which is having two semicircles, and no straight line is observed. The second semicircle indicates charge transfer resistance that also decreases with the increase in voltage promoting another reaction's kinetics or another diffusion-based current. When studying the effect of different applied potentials on W1.5 (Fig. S16e and f†), two full semicircles were observed with a line. The second semicircle also indicates a charge transfer reaction kinetics that may have occurred only at the outer surface layer of the electrode.
On calcination of W1.5 to 500 °C for 3 hours, the activity dropped, which promotes the high activity of the amorphous phase rather than the crystalline phase (data not shown). It was noted that the materials change color after the electrochemical tests (Fig. S17†). A change in color was observed in some of the prepared samples, and this change in colors did not seem to have any effect on MOR efficiency. The optical properties of the samples were not studied for this paper.
Comparing our electro-catalysts with the already published similar catalysts, a higher electro-catalytic current density was obtained, suggesting the potential use of these composites as electro-catalysts for the methanol oxidation reaction (Table 4).
| Material | Electrolyte | Methanol concentration (M) | Scan rate (mV s−1) | Current density (mA cm−2) | Reference |
|---|---|---|---|---|---|
| Ni–Co–W composite | 1 M KOH | 1 | 50 | 229 | This work |
| NiCo2O4/CX | 1 M KOH | 0.5 | 50 | 98 | 49 |
| NiCO/NC | 1 M KOH | 0.5 | 10 | 134 | 50 |
| NiCo2O4 | 1 M KOH | 0.5 | 10 | 98 | 51 |
| N–Co3O4@C | 0.5 M NaOH | 1.5 | 50 | 122 | 52 |
| N–Co3O4@C–X–NS | 1 M NaOH | 1.5 | 50 | 105 | |
| NiO NS@NW/NF | 1 M KOH | 0.5 | 10 | 89 | 53 |
| Zn1−0.4Mn0.4Co2O4/rGO | 1 M KOH | 0.5 | 50 | 142 | 54 |
| Ni-NPs/RCQD/GCE | 0.5 M KOH | 0.5 | 50 | 32 | 55 |
| Co/N (4%)–CNFs | 1 M KOH | 3 | 50 | 100 | 56 |
4. Conclusions
This work reports the synthesis of a stable nanocomposite of Ni–Co–W mixed-metal oxide using a simple co-precipitation method without the need for any annealing or energy-demanding processes. Different W ratios were used and five samples were prepared, and the material that exhibited the highest MOR has ratios of Ni![[thin space (1/6-em)]](https://www.rsc.org/images/entities/char_2009.gif) :
:![[thin space (1/6-em)]](https://www.rsc.org/images/entities/char_2009.gif) Co
Co![[thin space (1/6-em)]](https://www.rsc.org/images/entities/char_2009.gif) :
:![[thin space (1/6-em)]](https://www.rsc.org/images/entities/char_2009.gif) W = 1
W = 1![[thin space (1/6-em)]](https://www.rsc.org/images/entities/char_2009.gif) :
:![[thin space (1/6-em)]](https://www.rsc.org/images/entities/char_2009.gif) 1
1![[thin space (1/6-em)]](https://www.rsc.org/images/entities/char_2009.gif) :
:![[thin space (1/6-em)]](https://www.rsc.org/images/entities/char_2009.gif) 1.5 with a current density of 229 mA cm−2. When varying the Ni-to-Co ratio to 2
1.5 with a current density of 229 mA cm−2. When varying the Ni-to-Co ratio to 2![[thin space (1/6-em)]](https://www.rsc.org/images/entities/char_2009.gif) :
:![[thin space (1/6-em)]](https://www.rsc.org/images/entities/char_2009.gif) 1 and vice versa, the performance did not increase. NiWO4 and CoWO4 were also prepared using the same method, and the lowest performance among the prepared material was observed for NiWO4. CoWO4 showed a very good performance with a current density of 110 mA cm−2 at 0.6 V. Therefore, it is shown that when incorporating W within the structure, drastic enhancement in MOR activity is observed, which promotes the role of W in the MOR. The material was tested in an alkaline medium 1 M KOH, and its activity was studied in 1 M methanol. It was confirmed that the MOR is controlled by diffusion and is irreversible. The small size of the material in the nanoscale has attributed to the increased performance, as it has provided an increased surface area for the oxidation process to take place. Therefore, this work promotes the simple process of synthesizing nanocomposites of Ni–Co–W mixed-metal oxide and their expected use as anode materials for DMFCs.
1 and vice versa, the performance did not increase. NiWO4 and CoWO4 were also prepared using the same method, and the lowest performance among the prepared material was observed for NiWO4. CoWO4 showed a very good performance with a current density of 110 mA cm−2 at 0.6 V. Therefore, it is shown that when incorporating W within the structure, drastic enhancement in MOR activity is observed, which promotes the role of W in the MOR. The material was tested in an alkaline medium 1 M KOH, and its activity was studied in 1 M methanol. It was confirmed that the MOR is controlled by diffusion and is irreversible. The small size of the material in the nanoscale has attributed to the increased performance, as it has provided an increased surface area for the oxidation process to take place. Therefore, this work promotes the simple process of synthesizing nanocomposites of Ni–Co–W mixed-metal oxide and their expected use as anode materials for DMFCs.
Conflicts of interest
There are no conflicts to declare.Acknowledgements
This paper is based on the work supported by the Science, Technology & Innovation Funding Authority (STDF) under grant number 45257.References
- B. C. Ong, S. K. Kamarudin and S. Basri, Direct liquid fuel cells: a review, Int. J. Hydrogen Energy, 2017, 42(15), 10142–10157 CrossRef CAS.
- S. K. Kamarudin, F. Achmad and W. R. W. Daud, Overview on the application of direct methanol fuel cell (DMFC) for portable electronic devices, Int. J. Hydrogen Energy, 2009, 34(16), 6902–6916 CrossRef CAS.
- M. A. Abdelkareem, et al., Environmental aspects of fuel cells: a review, Sci. Total Environ., 2021, 752, 141803 CrossRef CAS PubMed.
- X. Ren, et al., Current progress of Pt and Pt-based electrocatalysts used for fuel cells, Sustain. Energy Fuels, 2020, 4(1), 15–30 RSC.
- X. Li and A. Faghri, Review and advances of direct methanol fuel cells (DMFCs) part I: design, fabrication, and testing with high concentration methanol solutions, J. Power Sources, 2013, 226, 223–240 CrossRef CAS.
- A. B. Stambouli and E. Traversa, Fuel cells, an alternative to standard sources of energy, Renew. Sustain. Energy Rev., 2002, 6(3), 295–304 CrossRef.
- M. K. Jeon, et al., Quaternary Pt2Ru1Fe1M1/C (M=Ni, Mo, or W) catalysts for methanol electro-oxidation reaction, Korean J. Chem. Eng., 2015, 32(2), 206–215 CrossRef CAS.
- V. S. Bagotsky, Fuel Cells: Problems and Solutions, John Wiley & Sons, 2012, vol. 56 Search PubMed.
- C. Lamy, J.-M. Léger and S. Srinivasan, Direct Methanol Fuel Cells: From a Twentieth Century Electrochemist's Dream to a Twenty-first Century Emerging Technology, in Modern Aspects of Electrochemistry, ed. J. O. M. Bockris, B. E. Conway and R. E. White, Springer US, Boston, MA, 2002, pp. 53–118 Search PubMed.
- A. V. Tripković, et al., Methanol electrooxidation on supported Pt and PtRu catalysts in acid and alkaline solutions, Electrochim. Acta, 2002, 47(22), 3707–3714 CrossRef.
- M. K. Nazal, et al., Precious metal free Ni/Cu/Mo trimetallic nanocomposite supported on multi-walled carbon nanotubes as highly efficient and durable anode-catalyst for alkaline direct methanol fuel cells, J. Electroanal. Chem., 2018, 823, 98–105 CrossRef CAS.
- G. F. McLean, et al., An assessment of alkaline fuel cell technology, Int. J. Hydrogen Energy, 2002, 27(5), 507–526 CrossRef CAS.
- Z. Xia, et al., Recent advances in multi-scale design and construction of materials for direct methanol fuel cells, Nano Energy, 2019, 65, 104048 CrossRef CAS.
- Y. Jiang, et al., Nanostructure Architectures of Tungsten Carbide for Methanol Electrooxidation Catalyst, Chin. J. Chem., 2016, 34(6), 624–630 CrossRef CAS.
- Y. Oh, et al., Improved performance using tungsten carbide/carbon nanofiber based anode catalysts for alkaline direct ethanol fuel cells, Int. J. Hydrogen Energy, 2014, 39(28), 15907–15912 CrossRef CAS.
- H. Zheng, et al., Synthesis of ordered mesoporous carbon/tungsten carbides as a replacement of platinum-based electrocatalyst for methanol oxidation, Electrochim. Acta, 2013, 108, 486–490 CrossRef CAS.
- A. Serov and C. Kwak, Review of non-platinum anode catalysts for DMFC and PEMFC application, Appl. Catal., B, 2009, 90(3), 313–320 CrossRef CAS.
- M. Chandran, et al., Nickel-decorated MoS2/MXene nanosheets composites for electrocatalytic oxidation of methanol, Ceram. Int., 2021, 47(19), 26847–26855 CrossRef CAS.
- G. S. Theres, et al., Promotional effect of Ni–Co/ordered mesoporous carbon as non-noble hybrid electrocatalyst for methanol electro-oxidation, J. Appl. Electrochem., 2020, 50(6), 639–653 CrossRef CAS.
- N. Kumari, et al., Investigation of mixed molybdates of cobalt and nickel for use as electrode materials in alkaline solution, Int. J. Hydrogen Energy, 2020, 45(19), 11040–11051 CrossRef CAS.
- X. Zhang, et al., A novel Pt/WCx/C electrocatalyst synthesized by a one-pot method for methanol electrooxidation in acid medic, Int. J. Electrochem. Sci., 2019, 14, 10931–10942 CrossRef CAS.
- W. Liu, et al., Preparation of PtRu/WO3–C by intermittent microwave method with enhanced catalytic activity of methanol oxidation, J. Appl. Electrochem., 2016, 46(8), 887–893 CrossRef CAS.
- M. Yaldagard, M. Jahanshahi and N. Seghatoleslami, Pt catalysts on PANI coated WC/C nanocomposites for methanol electro-oxidation and oxygen electro-reduction in DMFC, Appl. Surf. Sci., 2014, 317, 496–504 CrossRef CAS.
- H. Eranjaneya, et al., Nickel tungstate nanoparticles: synthesis, characterization and electrochemical sensing of mercury(II) ions, J. Mater. Sci.: Mater. Electron., 2019, 30(4), 3574–3584 CrossRef CAS.
- B. R. Bhat, J.-S. Choi and T.-H. Kim, Synthesis and characterization of nanocrystalline Mo–V–W–Fe–O mixed oxide catalyst and its performance in selective methanol oxidation, Catal. Lett., 2007, 117(3), 136–139 CrossRef CAS.
- M. S. Javed, et al., Electrochemical investigations of cobalt-free perovskite cathode material for intermediate temperature solid oxide fuel cell, Int. J. Hydrogen Energy, 2017, 42(15), 10416–10422 CrossRef CAS.
- C. H. Choi, S. H. Park and S. I. Woo, Binary and Ternary Doping of Nitrogen, Boron, and Phosphorus into Carbon for Enhancing Electrochemical Oxygen Reduction Activity, ACS Nano, 2012, 6(8), 7084–7091 CrossRef CAS PubMed.
- U. M. García-Pérez, A. Martínez-de la Cruz and J. Peral, Transition metal tungstates synthesized by co-precipitation method: Basic photocatalytic properties, Electrochim. Acta, 2012, 81, 227–232 CrossRef.
- S. L. Amaya, et al., Synthesis and characterization of metal oxides complexes with potential application in HDS reactions, Mater. Lett., 2021, 291, 129562 CrossRef CAS.
- J. Castelo-Quibén, et al., Carbon - iron electro-catalysts for CO2 reduction. The role of the iron particle size, J. CO2 Util., 2018, 24, 240–249 CrossRef.
- J. L. Rico, et al., Synthesis and ammonolysis of nickel and cobalt tungstates and their characterisation, J. Saudi Chem. Soc., 2016, 20(4), 405–410 CrossRef CAS.
- P. M. A. Sherwood, The use and misuse of curve fitting in the analysis of core X-ray photoelectron spectroscopic data, Surf. Interface Anal., 2019, 51(6), 589–610 CrossRef CAS.
- M. E. Pam, et al., Effects of precursor pre-treatment on the vapor deposition of WS2 monolayers, Nanoscale Adv., 2019, 1(3), 953–960 RSC.
- C.-W. Kao, et al., Magnetic Nanoparticles Conjugated with Peptides Derived from Monocyte Chemoattractant Protein-1 as a Tool for Targeting Atherosclerosis, Pharmaceutics, 2018, 10(2), 62 CrossRef PubMed.
- A. Gharbi, et al., Surface functionalization by covalent immobilization of an innovative carvacrol derivative to avoid fungal biofilm formation, AMB Express, 2015, 5(1), 9 CrossRef PubMed.
- M. Vasilopoulou, et al., Hydrogenated under-stoichiometric tungsten oxide anode interlayers for efficient and stable organic photovoltaics, J. Mater. Chem. A, 2014, 2(6), 1738–1749 RSC.
- S. Rahimnejad, et al., Enhancement of the photocatalytic efficiency of WO3 nanoparticles via hydrogen plasma treatment, Mater. Res. Express, 2014, 1(4), 045044 CrossRef.
- P. Wang, et al., Well-dispersed NiO nanoparticles supported on nitrogen-doped carbon nanotube for methanol electrocatalytic oxidation in alkaline media, Appl. Surf. Sci., 2017, 392, 562–571 CrossRef CAS.
- V. Davydov, et al., Solid state synthesis of carbon-encapsulated iron carbide nanoparticles and their interaction with living cells, J. Mater. Chem. B, 2014, 2(27), 4250–4261 RSC.
- D. Sivkov, et al., Studies of Buried Layers and Interfaces of Tungsten Carbide Coatings on the MWCNT Surface by XPS and NEXAFS Spectroscopy, Appl. Sci., 2020, 10(14), 4736 CrossRef CAS.
- X.-X. Wang, et al., Fabrication and electrochemical investigation of MWO4 (M = Co, Ni) nanoparticles as high-performance anode materials for lithium-ion batteries, Ionics, 2018, 24(2), 363–372 CrossRef CAS.
- L.-S. Yuan, et al., Nanoporous nickel-copper-phosphorus amorphous alloy film for methanol electro-oxidation in alkaline medium, Electrochim. Acta, 2015, 154, 54–62 CrossRef CAS.
- X. Xing, et al., CoWO4 nanoparticles prepared by two methods displaying different structures and supercapacitive performances, Electrochim. Acta, 2015, 157, 15–22 CrossRef CAS.
- X. Xu, et al., Fabrication of CoWO4@NiWO4 nanocomposites with good supercapacitive performances, Electrochim. Acta, 2015, 174, 837–845 CrossRef CAS.
- L. Niu, et al., Simple Synthesis of Amorphous NiWO4 Nanostructure and Its Application as a Novel Cathode Material for Asymmetric Supercapacitors, ACS Appl. Mater. Interfaces, 2013, 5(16), 8044–8052 CrossRef CAS PubMed.
- F. Asadi, S. N. Azizi and S. Ghasemi, A novel non-precious catalyst containing transition metal in nanoporous cobalt based metal-organic framework (ZIF-67) for electrooxidation of methanol, J. Electroanal. Chem., 2019, 847, 113181 CrossRef.
- A. Velázquez-Palenzuela, et al., Kinetic analysis of carbon monoxide and methanol oxidation on high performance carbon-supported Pt–Ru electrocatalyst for direct methanol fuel cells, J. Power Sources, 2011, 196(7), 3503–3512 CrossRef.
- H. M. Parsons, D. R. Ekman, T. W. Collette and M. R. Viant, Analyst, 2009, 134(3), 478–485, 10.1039/B808986H.
- M. M. El-Deeb, et al., Effect of pore geometry on the electrocatalytic performance of nickel cobaltite/carbon xerogel nanocomposite for methanol oxidation, Electrochim. Acta, 2018, 259, 77–85 CrossRef CAS.
- W. Wang, et al., Nickel foam supported mesoporous NiCo2O4 arrays with excellent methanol electro-oxidation performance, New J. Chem., 2015, 39(8), 6491–6497 RSC.
- R. Ding, et al., Porous NiCo2O4 nanostructures as bi-functional electrocatalysts for CH3OH oxidation reaction and H2O2 reduction reaction, Electrochim. Acta, 2013, 113, 290–301 CrossRef CAS.
- M. A. Shenashen, et al., Axially oriented tubercle vein and X-crossed sheet of N-Co3O4@C hierarchical mesoarchitectures as potential heterogeneous catalysts for methanol oxidation reaction, Chem. Eng. J., 2017, 313, 83–98 CrossRef CAS.
- Q. Luo, et al., Hierarchical nickel oxide nanosheet@nanowire arrays on nickel foam: an efficient 3D electrode for methanol electro-oxidation, Catal. Sci. Technol., 2016, 6(4), 1157–1161 RSC.
- A. Rebekah, et al., Zn-substituted MnCo2O4 nanostructure anchored over rGO for boosting the electrocatalytic performance towards methanol oxidation and oxygen evolution reaction (OER), Int. J. Hydrogen Energy, 2020, 45(29), 14713–14727 CrossRef CAS.
- H. Javan, et al., Nickel nanoparticles decorated on carbon quantum dots as a novel non-platinum catalyst for methanol oxidation; a green, low-cost, electrochemically-synthesized electrocatalyst, Chem. Eng. Sci., 2020, 217, 115534 CrossRef CAS.
- T.-H. Ko, et al., Facile Synthesis of Core/Shell-like NiCo2O4-Decorated MWCNTs and its Excellent Electrocatalytic Activity for Methanol Oxidation, Sci. Rep., 2016, 6(1), 20313 CrossRef CAS PubMed.
Footnote |
| † Electronic supplementary information (ESI) available. See DOI: https://doi.org/10.1039/d3na01118f |
| This journal is © The Royal Society of Chemistry 2024 |

