 Open Access Article
Multiscale modeling of surface enhanced fluorescence†
Pablo
Grobas Illobre
 ,
Piero
Lafiosca
 ,
Teresa
Guidone
,
Francesco
Mazza
,
Tommaso
Giovannini
,
Teresa
Guidone
,
Francesco
Mazza
,
Tommaso
Giovannini
 * and
Chiara
Cappelli
 *
*
Scuola Normale Superiore, Piazza dei Cavalieri 7, 56126 Pisa, Italy. E-mail: tommaso.giovannini@sns.it; chiara.cappelli@sns.it
First published on 21st May 2024
Abstract
The fluorescence response of a chromophore in the proximity of a plasmonic nanostructure can be enhanced by several orders of magnitude, yielding the so-called surface-enhanced fluorescence (SEF). An in-depth understanding of SEF mechanisms benefits from fully atomistic theoretical models because SEF signals can be non-trivially affected by the atomistic profile of the nanostructure's surface. This work presents the first fully atomistic multiscale approach to SEF, capable of describing realistic structures. The method is based on coupling density functional theory (DFT) with state-of-the-art atomistic electromagnetic approaches, allowing for reliable physically-based modeling of molecule–nanostructure interactions. Computed results remarkably demonstrate the key role of the NP morphology and atomistic features in quenching/enhancing the fluorescence signal.
1 Introduction
Under the action of an external electric field, metal nanoparticles (NPs) can exhibit localized surface plasmons (LSPs), which are collective excitations of conductive electrons. LSPs are associated with a significant enhancement of the induced electric field, up to several orders of magnitude. When a molecular system is posed in the NP proximity, its photo-physical and spectral properties can be substantially affected, yielding the so-called surface-enhanced spectroscopies.1–15 Among them, Surface-Enhanced Fluorescence (SEF) exploits the enhancement of the fluorescence signal, which can be useful to study biological matrices interacting with plasmonic nanostructures for biosensing applications.16–20 Remarkably, precise control of the NP structure and the resulting plasmonic response has enabled the mapping of single molecules, achieving submolecular resolution, within the so-called Tip-Enhanced Photoluminescence (TEPL) experiments.21–24 The interplay of the complex physical phenomena underlying SEF and related techniques, such as the optical response of plasmonic substrates and their interaction with the electronic structure of the chromophore, are still not fully understood, thus challenging the rationalization of the measured results. In this context, reliable computational approaches capable of accurately describing how the NP structure affects SEF signals are needed, especially those models featuring a fully atomistic, realistic description of the nanosystem.18,22,25–30In this work, the first fully atomistic multiscale approach to SEF is developed. The model can be used to describe realistic nanostructures with atomistic details, substantially overcoming common issues related to the huge computational cost of full QM treatments of the system, which only allows the description of systems (molecule + nanostructure) composed of a few atoms.28,31,32 Our approach is based on the coupling of quantum mechanics (QM), defined at the density functional theory (DFT) level to determine the molecular electronic structure, with a novel fully atomistic electrodynamical approach to describe the plasmonic response of complex-shaped nanostructures, namely the frequency-dependent fluctuating charges and fluctuating dipoles (ωFQFμ) method.33,34 ωFQFμ is physically grounded on the Drude conduction model, electrostatics, and interband transitions and includes corrections to describe quantum tunneling effects, which can be crucial to reliably model nanoaggregates. In ωFQFμ, each metal atom is endowed with a fluctuating charge, accounting for intraband transitions (Drude regime), and a fluctuating dipole, describing interband transitions. The method can remarkably capture plasmonic properties of systems featuring subnanometer junctions35–37 and defects.38–40 Recent extensions have also permitted the calculation of the plasmonic response of bimetallic systems.41 Notably, ωFQFμ reproduces ab initio results, questioning the common notion that an explicit QM treatment is needed for describing plasmonic response upon shrinking the nanostructure size.33 Furthermore, the coupling of ωFQFμ to a QM formalism (QM/ωFQFμ) to evaluate surface-enhanced Raman scattering (SERS) signals of molecules in the vicinity of complex-shaped nanostructures, has recently been proposed.34
In this paper, QM/ωFQFμ is extended to the calculation of SEF signals. The modeling of fluorescence processes presents significant challenges compared to SERS. Specifically, the electronic structure of both the molecular Ground State (GS) and the emitting Excited State (ES) needs to be accurately described. This is achieved in terms of a Time-Dependent Density Functional Theory (TD-DFT)/ωFQFμ formalism, which is specified by reformulating at the fully atomistic level the methodology proposed for implicit, non-atomistic, descriptions of the nanostructure.27–29,42–45 The latter describe the nanostructure as a continuum dielectric whose response is determined by the permittivity functions. Due to their implicit nature, atomistic features and their effect on the molecular response are neglected.
The manuscript is organized as follows. In Section 2, the theoretical foundations of ωFQFμ are recalled, and its coupling to a TDDFT formalism to study the SEF response is presented. After highlighting the computational details, in Section 4, TDDFT/ωFQFμ is challenged to simulate SEF of a well-studied chromophore (N,N′-dimethylperylene 3,4,9,10-dicarboximide – PDI) near metal NPs of increasing complexity. Conclusions and future perspectives end the manuscript.
2 Theory
2.1 ωFQFμ
ωFQFμ is a fully atomistic model specifically developed for studying plasmonic responses of metal NPs.33,35 It combines the Drude model for intraband transitions with an effective polarizability, which mimics core electrons and interband transitions.46–49 To physically consistently model both mechanisms, each atom is endowed with a charge (ωFQ) and a dipole (ωFμ). Under the action of a monochromatic external electric field, the atoms exchange charge via the Drude conduction mechanism, which is further assisted by quantum tunneling, thus limiting charge transfer among the nearest neighboring atoms and making the interaction decrease with the typical exponential decay. In particular, ωFQ charge equation of motion in the frequency domain (ω) reads:33,35,37 | (1) |
 denotes the effective area connecting atoms i and j. The Fermi damping function f(rij) describes quantum tunneling effects35 in terms of the interatomic distance rij = |ri − rj| (ri is the position of atom i). ϕeli accounts for the electrochemical potential of the i-th atom, and takes into account charge–charge and charge–dipole interactions, and the external electric field.
To introduce interband effects, each atom is assigned an additional source of polarization, i.e., atomic polarizability, to which an induced dipole moment is associated. The induced dipole moments μi are obtained by solving the following linear equation:33
| μi = αωi(Eexti + Eμi + Eqi) | (2) |
To effectively couple charges and dipoles, eqn (1) and (2) are simultaneously solved using the following set of linear equations:33
 | (3) |
2.2 QM/classical coupling (QM/ωFQFμ) and fluorescence descriptors
To evaluate the fluorescence response of a chromophore when it is influenced by the plasmonic response of a nearby metallic NP, ωFQFμ is coupled with a QM treatment of the molecule, in a multiscale fashion. Through the developed method, the effect of NP atomistic features on the fluorescence response of the nearby molecular system is evaluated, thus overcoming the limitations of QM/continuum methodologies previously proposed.27–29,42,43,45Molecular fluorescence response originates from the following subsequent processes: (a) initially, the molecule absorbs a photon from the incident electric field, being promoted to an ES; (b) the molecule undergoes internal relaxation, reaching the minimum of the emitting ES; (c) the chromophore decays to the GS, either radiatively, emitting a photon, or non-radiatively.27–29,43,45
We exploit the time-dependent formulation of density functional theory (TD-DFT)42,44,51 and we modify it to take into account the effects of the plasmonic NP. Within a QM/ωFQFμ formalism, Casida's equations read:34
 | (4) |
| Aai,bj(ω) = (εa − εi)δabδij + K0ai,bj + Kpolai,bj(ω) | (5a) |
| Bai,bj(ω) = K0ai,jb+Kpolai,jb(ω) | (5b) |
 | (6) |
 and
and  represent the frequency-dependent charges and dipoles at the atomic position rν, induced by the
  distribution. They interact with the potential
  and field
  generated by the
  distribution, respectively.
From the mathematical point of view, q and μ are complex quantities, making Kpol complex. By following ref. 42, the modified TD-DFT problem is solved by treating the imaginary parts as a perturbation to the first order. In particular, excitation energies and transition densities are computed from the real part of the poles (eqn (4)) as follows (′ indicates real quantities):42
 | (7) |
The imaginary excitation frequency can be computed by exploiting the perturbative treatment as: (′′ marks imaginary parts):42
 | (8) |
The response imaginary component is associated with the molecular non-radiative lifetime (τnr) through the inverse of the non-radiative decay rate (Γnr). The latter is given by:44
 | (9) |
The molecular radiative energy dissipation instead generates the fluorescence signal from the emitting ES to GS. This is generally characterized by the radiative lifetime (τr), which can be expressed as the inverse of the radiative decay rate (Γr). Furthermore, the emission probability is defined by the absorption coefficient (A), which is related to the population of the emitting ES. Within QM/ωFQFμ, A and Γr are calculated (in a. u.) as follows:
 | (10) |
 | (11) |
| dK0tot = dK0mol + dK0plas | (12) |
 | (13) |
 | (14) |
3 Computational details
The method is applied to studying the fluorescence response of N,N′-dimethylperylene 3,4,9,10-dicarboximide (PDI) chromophore as interacting with metal nanostructures of different shapes and dimensions. Both a longitudinal (L) and transversal (T) orientation of PDI relative to the NPs are considered. The fluorescence response is then investigated as a function of the PDI-NP distance (from 3 to 200 Å compared to the closest PDI hydrogen atom). In all calculations, PDI is treated at the QM level, while the metal nanostructure is classically described by using ωFQFμ. The latter is compared to the implicit description of the plasmonic systems to validate the novel approach, as provided by the BEM method. Following ref. 27, the NP response is computed at the experimental absorption (515 nm) and emission (525 nm) frequencies of PDI dissolved in n-heptane. The absorption coefficient (eqn (10)) is computed from the GS optimized geometry of PDI, while the non radiative decay and radiative decay rates (eqn (9) and (11)) are evaluated using the first ES optimized geometry.Atomistic NPs are built with the Atomic Simulation Environment (ASE) Python module v. 3.17.52 A face-centered cubic (FCC) arrangement and a lattice parameter of 4.08 Å are exploited, for both Ag and Au NPs. The geometrical relaxation of NPs is not considered because it slightly affects their optical response, as reported in ref. 33.53–59 Four morphologies are analyzed: spherical, cuboctahedral (cTO), icosahedral (Ih), and cylindrical rods. The optical response of such NPs is simulated employing ωFQFμ, using the parameters reported in ref. 33 (see also Table S3 in the ESI†). ωFQFμ charges and dipoles are calculated by solving eqn (3) by direct matrix inversion for the single rods and spherical, Ih, and cTO structures with radius ≤30 Å. For all other studied systems (Tables S1 and S2 of the ESI†), the Generalized Minimal RESidual method (GMRES) is used (RMSD threshold = 1.0 × 10⁻¹¹).37
Spherical continuum structures are created using GMSH code,60 with 5890 tesserae for each NP. Their optical properties are studied at the BEM level, using the Dielectric Polarizable Continuum Model (DPCM) formalism (see Sec. S1.1 of the ESI† for more details).61–63 For both Ag and Au NPs, the frequency-dependent permittivity function of Etchegoin et al.64 as fitted by Johnson and Christy65,66 is used. The permittivity function is corrected to account for the dependence of the mean free path of the electrons on the sphere radius, as described in ref. 27. BEM equations are solved by matrix inversion (see eqn (1) of the ESI†). More details about the geometries and the associated Plasmon Resonance Frequencies (PRFs) are given in Tables S1 and S2 in the ESI.†
In all calculations, the PDI is described at the (TD-) DFT level by using the B3LYP functional combined with a double-ζ-polarized DZP basis set.27 All QM/ωFQFμ and QM/BEM calculations are performed by using a locally modified version of the Amsterdam Modelling Suite (AMS).67
4 Results and discussion
In this section, ωFQFμ is applied to compute the fluorescence response of PDI placed near noble metal NPs. First, QM/ωFQFμ and QM/BEM implementations are validated on spherical NPs. Then, QM/ωFQFμ is used to investigate the effect of different geometrical arrangements/parameters on the PDI fluorescence response.4.1 Atomistic vs. continuum descriptions of spherical NPs
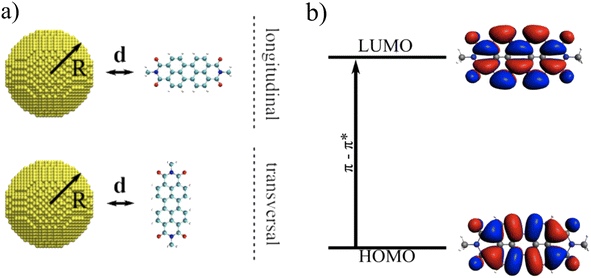
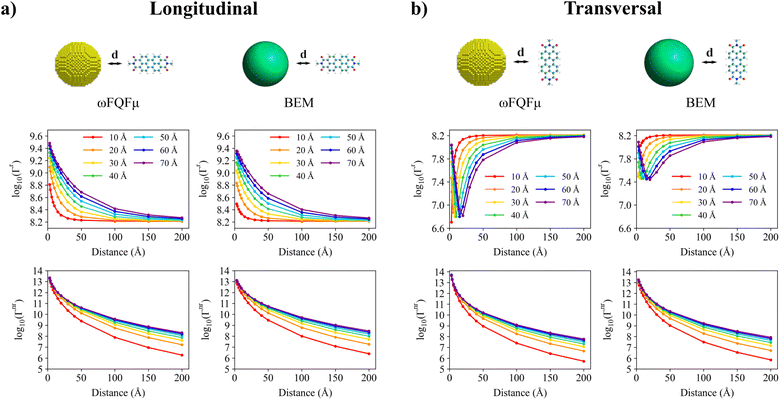
The fluorescence response of PDI as adsorbed in L or T orientation on a spherical NP (see Fig. 1a) is studied. In particular, the attention is focused on the first bright excitation (HOMO–LUMO), which is associated with a π → π* transition with the transition dipole moment aligned with the principal axis of the chromophore (see Fig. 1b).In Fig. 2, calculated QM/ωFQFμ and QM/BEM Γr and Γnr are reported (in logarithmic scale) as a function of the PDI-Au NP distance and Au NP radius for both L and T orientations (panels a and b, respectively). The results for Ag NPs are similar and are reported in Fig. S1 and S2 of the ESI.†
Let us first focus on Γr. For the L orientation (see Fig. 2a, both QM/ωFQFμ and QM/BEM Γr decrease as the PDI-NP distance increases, converging at large distances to the gas-phase Γr value. This is because, in such a configuration, the PDI transition dipole moment and the plasmon dipole moment are parallel. As a result, the plasmon-induced Γr is larger than its gas-phase counterpart and decreases as a function of the PDI-NP distance because the interaction between the two parts vanishes at large separations (![[d with combining tilde]](https://www.rsc.org/images/entities/char_0064_0303.gif) KOplas → 0). For the same reasons, by enlarging the NP size, Γr increases because the associated
KOplas → 0). For the same reasons, by enlarging the NP size, Γr increases because the associated ![[d with combining tilde]](https://www.rsc.org/images/entities/char_0064_0303.gif) KOplas increases. It is worth remarking that QM/ωFQFμ and QM/BEM results are in almost perfect agreement, also from the quantitative point of view.
KOplas increases. It is worth remarking that QM/ωFQFμ and QM/BEM results are in almost perfect agreement, also from the quantitative point of view.
In contrast, for the T configuration (Fig. 2b), different trends are observed depending on the NP size. In fact, for small NPs (radius ≤ 10 Å), QM/ωFQFμ and QM/BEM Γr increase as the PDI-NP distance increases. For larger NPs (radius > 10 Å), QM/ωFQFμ and QM/BEM Γr decrease at small distances (<25 Å) and then increase at larger distances, displaying a minimum. In particular, by increasing the NP radius, the minimum shifts towards larger distances. In all cases, at large distances, the gas-phase Γr is recovered. These findings can be explained by considering that in T configuration the NP plasmon dipole moment and PDI transition dipole moment are anti-parallel. As a consequence, when |dKOplas| > |dKOmol| Γr decreases (small distances), while when |dKOplas| < |dKOmol| Γr increases (large distances). Γr minimum is displayed when |dKOplas| ≃ |dKOmol|. By increasing the NP radius, a larger induced NP dipole is obtained, shifting the Γr minimum to larger distances. In this case, QM/ωFQFμ and QM/BEM agreement is only qualitative. This can be related to the different plasmonic properties provided by the two approaches, i.e. different PRFs and different absorption profiles (see Fig. S3 of the ESI†). To investigate how the atomistic features of the NP surface affect the computed QM/ωFQFμ Γr, in Fig. S4 of the ESI† we report a scan over the NP-PDI angle (from 0 to 180°, with a step of 20°) for T disposition. Specifically, for NPs with a radius of 20 Å and 70 Å, PDI is positioned at the distance corresponding to the minimum of Γr (6 and 20 Å, respectively). Our findings reveal small and periodic fluctuations of Γr as a function of the angle, which are reduced as the NP size increases, highlighting the weaker impact of atomistic details as the structure approximates that of a perfect sphere. Thus, the numerical discrepancies between QM/ωFQFμ and QM/BEM reported in Fig. 2b mostly arise from the diverse modeling of the optical response of the NPs, rather than the atomistic features of the NP surface.
Remarkably, computed results are in agreement with experimental findings,18,68–70 and are consistent with similar analysis performed at the semi-empirical ZINDO/BEM level,27 thus demonstrating the reliability of ωFQFμ.
QM/ωFQFμ and QM/BEM Γnr display a similar behavior for both L and T configurations (see Fig. 2a and b). In particular, Γnr decreases as the PDI-NP distance increases for all considered NPs and approaches zero. Indeed, PDI non-radiative decay channels are neglected; thus, Γnr vanishes in the gas phase limit. At small distances, Γnr assumes almost the same value for all NP radii because the NP can be approximated as an infinite plane surface. At larger distances, Γnr increases for large NP sizes because a large dipole moment is induced on the NP (see eqn (6)). Remarkably, at large distances, and for all NP size, Γnr follows a distance−6 trend, following the Förster limit. These findings are again in agreement with previous computational investigations.27
To conclude this section, the relative brightness ΦRB is evaluated. In Fig. 3, ΦRB of PDI adsorbed in L configuration on Au (a) and Ag (b) spherical NPs are reported, as calculated at the QM/ωFQFμ (left) and QM/BEM (right) levels. In particular, ΦRB dependence on the NP radius and PDI-NP distance is studied and graphically depicted as a 3D plot. It can be noticed that, for Au NPs, ΦRB decreases by increasing the radius for a specific PDI-NP distance. For a fixed radius, ΦRB shows the opposite trend, i.e., it increases by increasing the PDI-NP separation. Thus, for Au NPs, a general quenching effect is obtained at both QM/ωFQFμ and QM/BEM levels. For Ag NPs, an increment in ΦRB is observed by enlarging the PDI-NP distance, similarly to Au NPs. In contrast, ΦRB behavior as a function of the NP radius is more complex and displays a minimum, which is shifted at larger radii as the PDI-NP distance increases. The different Ag–Au trends can be ascribed to the diverse plasmonic properties of the two materials. In fact, the absorption/emission PDI frequencies are close to Au PRF and fall in the pre-resonant region for Ag NPs. Consequently, the non-radiative decay channels are facilitated by Au NPs, thus yielding larger Γnr than Γr and A (see eqn (14)), finally resulting in ΦRB reduction.27,28 A similar investigation for the T orientation is reported in Fig. S5 of the ESI,† for which a less pronounced quenching effect is observed, in agreement with experimental findings.18,68–70
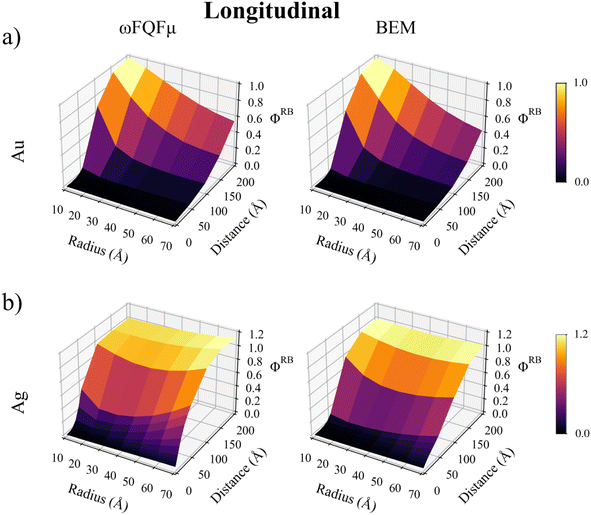 | ||
| Fig. 3 QM/ωFQFμ (left) and QM/BEM (right) ΦRB as a function of PDI-NP distance and NP radius for PDI in L orientation interacting with a spherical Au (a) and Ag (b) NP. | ||
4.2 QM/ωFQFμ for complex-shaped nanostructures
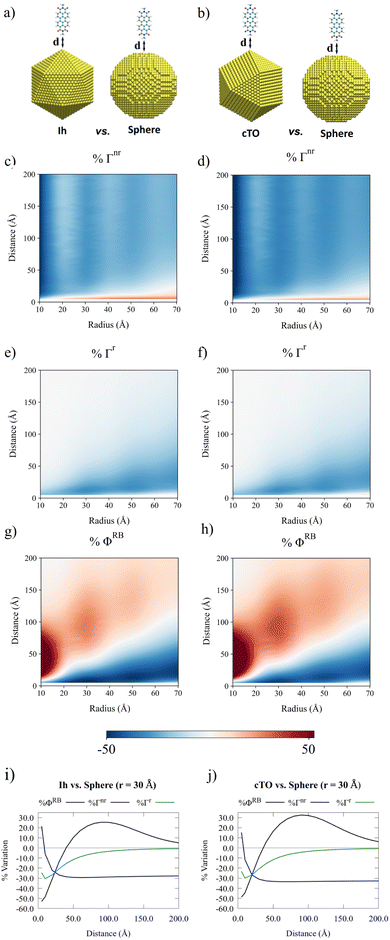
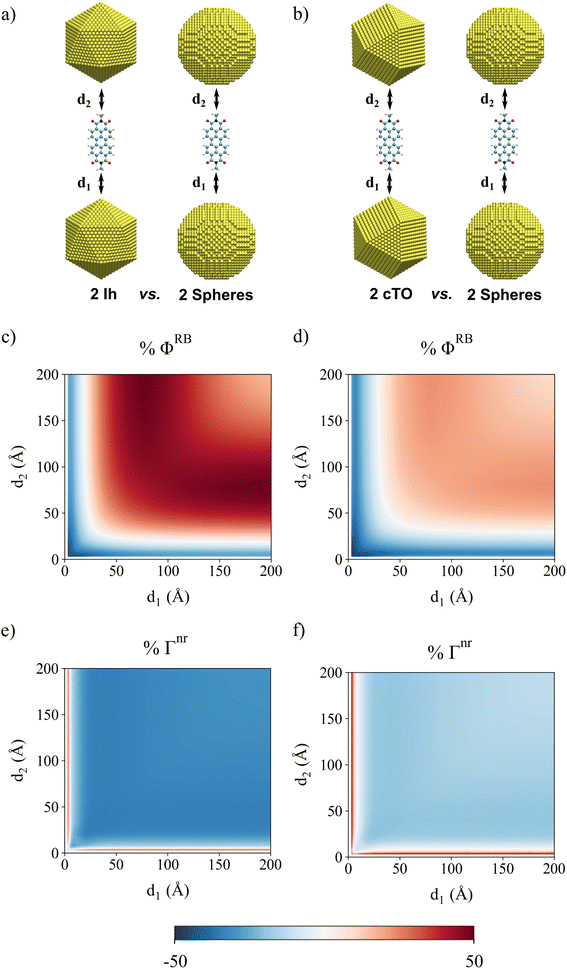
In Fig. 4(i and j), QM/ωFQFμ Γr, Γnr, and ΦRB values are reported as a function of the PDI-NP distance. A values are not given, because their trend is similar to Γr. PDI lays in the L orientation in the vicinity of spherical, Ih and cTO NPs with a radius of 30 Å. To highlight how different morphologies affect the fluorescence parameters, the differences between Γr, Γnr, and ΦRB values for the various morphologies and the data for the spherical case are computed as follows:
 | (15) |
%Γnr maximum value occurs when PDI is close to Ih/cTO NPs and rapidly decreases until it reaches a plateau. In fact, for large distances, both ΓnrIh/cTO and Γnrsph values follow a Förster-like behavior (∝distance−6), and thus %Γnr converges to a finite value (see eqn (15)). %ΓrIh/cTO instead presents lower values than the spherical reference, smoothly converging towards zero as the PDI-NP distance increases. The combination of Γr and Γnr variation profiles as a function of the distance determines the %ΦRB function, which exhibits a maximum in the distance region between 50 and 100 Å. Indeed, %ΦRB profile is related to the intersection point of %Γr and %Γnr curves. Furthermore, Fig. 4(i and j) shows a substantial %ΦRB reduction at short distances (<30 Å) for both Ih and cTO morphologies. In this region, %Γr displays its lowest values while %Γnr reaches its maximum, overall favoring the quenching of the fluorescence signal. This behavior is due to the significant enhancement of the electric field near the sharp tips of cTO and Ih NPs.33,35 Although these results show the same general behavior for Ih and cTO NPs, some subtle differences are worth discussing. Specifically, %Γnr is smaller for cTO than for Ih, and consequently, cTO %ΦRB is slightly larger.
To deepen the analysis, how a variation in the NP size affects the fluorescence response is investigated. To this end, Ih, cTO and spherical NPs with radii ranging from 10 to 70 Å are studied (see Fig. 4(c–h), and S6 and S7 in the ESI†). First, the NP size highly affects both %Γnr and %Γr. In fact, for short PDI-NP distances, %Γnr increases, while the opposite holds for %Γr. This results in a substantial decrease in %ΦRB in this distance region. At larger distances (50–100 Å), both morphologies display fluorescence responses that largely exceed that obtained for the reference spherical NPs, reaching a maximum that shifts toward larger distances and decreases in intensity by increasing NP size. Fig. 4(g and h) clearly shows that the discrepancies between the cTO and Ih become more pronounced for small NP radii. In fact, within this size range, the atomistic differences in Ih/cTO morphologies are more significant. The radius dependence of the %ΦRB maxima originates from a slight mismatch in the effective sphere-cTO/Ih size due to the atomistically defined structures (see Tables S1 and S2 of the ESI †for the effective size of the studied structures). To avoid the maxima fluctuations reported in Fig. 4(g and h), we have performed the same study by relying on a linear interpolation of the ΦRB values on the effective radius of the spherical NPs corresponding to the effective radius of cTO NPs (see Fig. S8 in the ESI†).
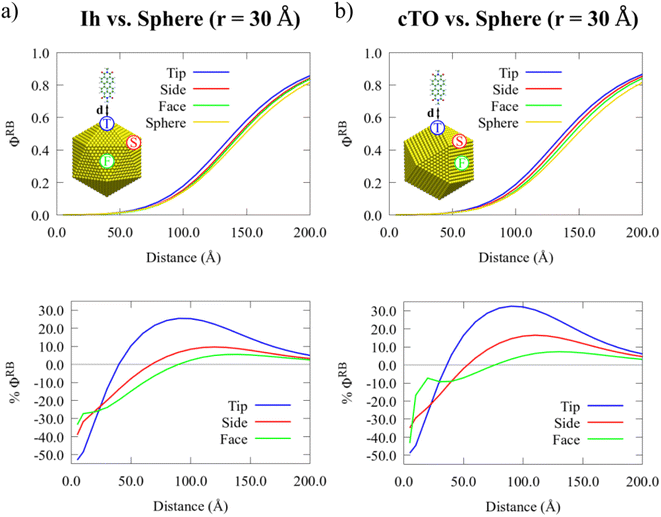
In Fig. 5, ΦRB and %ΦRB as a function of PDI-NP distance and the PDI-NP configuration are graphically depicted. In particular, the PDI moiety is adsorbed in L orientation on the tip (T), side (S), and face (F) of both Ih (a) and cTO (b) NPs of 30 Å radius. As a comparison, the PDI adsorbed on a spherical NP of equal size (30 Å radius) is also reported. QM/ωFQFμ results show that, for both Ih and cTO, the highest deviation in the fluorescence response compared to the spherical reference is obtained for the T configuration. This is not unexpected, and it is due to the largely inhomogeneous electric field near the sharp interfaces of the metal structures.34 The fully atomistic nature of the model can also capture the smaller differences, that are instead reported for S and F configurations. In particular, such differences become more pronounced when moving from Ih to cTO NPs (see %ΦRB in Fig. 5, bottom). This is due to the alternating triangular and squared faces in the cTO structure, which accentuates the inhomogeneity of the near-field.
To investigate this aspect, the fluorescence response of PDI in the proximity of silver nanorods (SNRs) is studied. Indeed nanorods have been amply exploited experimentally to enhance fluorescence signals. In fact, their PRF can be easily tuned by varying their aspect ratio.73–76 Notably, ωFQFμ can accurately reproduce nanorod's PRF values.33
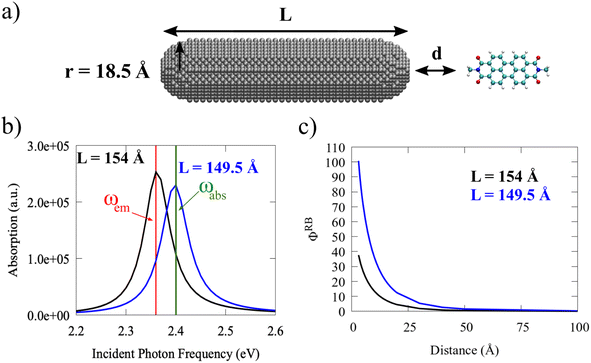
In Fig. 6(b), absorption cross-section are reported for two SNRs with fixed radius (r = 18.5 Å) and two lengths (L = 149.5 Å and L = 154 Å; see Fig. 6(a)). The absorption spectrum is dominated by a main plasmonic peak, associated with the dipolar plasmon. As expected, by increasing the SNR length, the PRF redshifts of about 0.04 eV. The plasmonic response sensitivity as a function of the SNR length can be exploited to match absorption (ωabs) or emission (ωem) PDI frequencies.
PDI ΦRB values as a function of the SNR-PDI distance are also given in Fig. 6(c)) for both nanorods. As expected, the highest fluorescence enhancement is reported when the PRF coincides with ωabs. However, a large fluorescence enhancement is also obtained when PRF aligns with ωem. Although ΦFQY values computed in the two cases are almost identical (see eqn (14)), the energy similarity of ωabs and ωem and the large SNR dipole moment lead to enhanced A values.
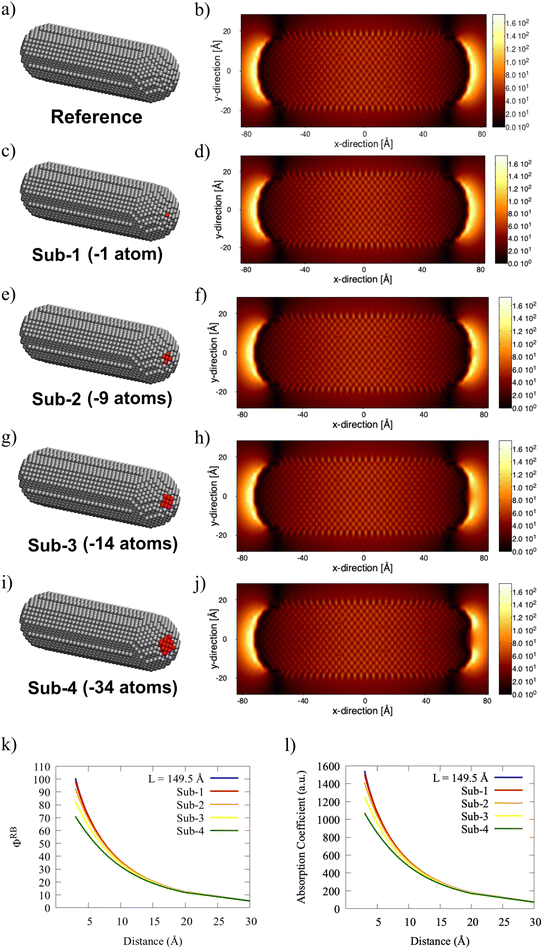
Let's focus on how SNR atomistic structure close to PDI affects the molecular ΦRB. Fig. 7 provides a graphical representation of such structure modifications, which are obtained by digging the SNR end close to PDI with a concentric (with nanorod axis) sphere with increasing radius. This results in the removal of SNR atoms within the volumes spanned by the selected spheres. In particular, the number of the removed atoms for the four studied geometrical modifications (Sub-1–Sub-4) are given in Fig. 7(c, e, g and i), where they are also highlighted in red. The electric field enhancement color maps associated with each SNR are also reported. Following ref. 33, the latter are calculated as the ratio between the magnitude of the induced and the incident electric fields. The external field is polarized along the SNR principal axis and oscillates at the dipolar PRF of each structure (ω = 2.40 eV). Color maps clearly show that the maximum field enhancement is obtained at the two SNR ends. By digging the SNR right end, a substantial reduction of the electric field enhancement in the deletion region is reported.
Fig. 7(k) shows the impact of these atomistic modifications on ΦRB as a function of the PDI-SNR distance as compared to the reference SNR (L = 149.5 Å). Clearly, the largest discrepancies emerge at small PDI-SNR distances. In particular, the structures characterized by the highest atomistic deletions (Sub-3 and Sub-4) feature a substantial reduction in ΦRB values. This is expected and is related to the modifications in the local field enhancement (see Fig. 7(h and j)). Indeed, Γr and Γnr variations as a function of PDI-SNR distance have small effect on ΦFQY. Thus, the reported differences primarily originate from the changes in A as a function of the PDI-NP distance (see eqn (14) and Fig. 7(l)).
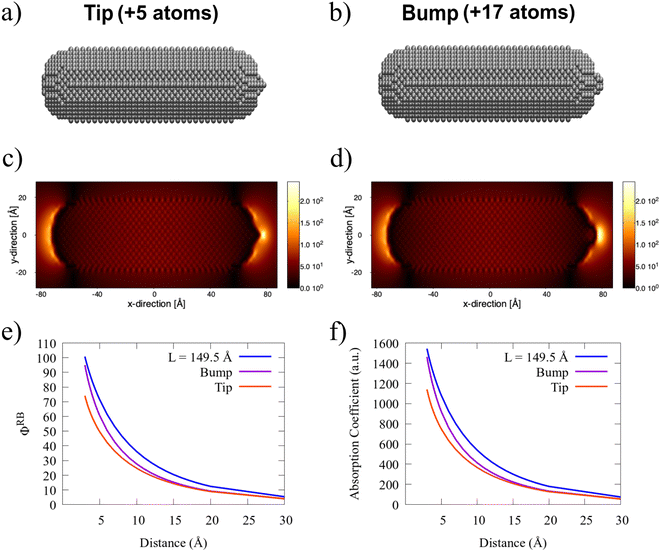
An opposite structural modification is also possible, i.e., the increasing of the SNR end close to the PDI with a small sharp tip – +5 atoms – or a spherical bump – +17 atoms (see Fig. 8(a and b)). Both systems feature a larger and more localized enhanced field than the pristine SNR (see Fig. 8(c and d) and 7(b)). In particular, the most localized enhanced field is obtained for the tip-SNR due to its sharp profile. Fig. 8(e) shows ΦRB values of PDI placed at the proximity of both systems as a function of the PDI-SNR distance, taking the full SNR (L = 149.5 Å) as a reference. Tip-SNR and bump-SNR are both associated with a significant ΦRB reduction, especially for small PDI-SNR distances. In particular, the largest discrepancy with the reference is given by Tip-SNR, for which the computed fluorescence response is comparable with the Sub-4 system (see Fig. 7(k)). For both geometrical modifications, the overall quenching of the fluorescence signal is due to the smaller SNR dipole compared to the reference, which results in a lower absorption coefficient A (see eqn (14) and Fig. 8(f)). It is worth mentioning that the structural modifications of the SNR only modify their electrical properties but not their absorption profile compared to the pristine structure (see Fig. S9 in the ESI†).
To underscore the importance of a fully atomistic modeling of the substrate, in Fig. S10 in the ESI† we replicate the simulations reported in Fig. 7 and 8 by exploiting the continuum QM/BEM approach. Specifically, we study the longitudinal absorption, ΦRB, and ΦFQY of pristine SNR (r = 18.5 Å; L = 149.5 Å), as well as those featuring a tip, bump, and the Sub-4 cavity. Additionally, we evaluate three different discretizations of the surfaces (∼10![[thin space (1/6-em)]](https://www.rsc.org/images/entities/char_2009.gif) 000,∼5000, ∼1000 tesserae) for each system. Our findings reveal a strong dependence on the number of tesserae used to describe the BEM surface. In particular, while the longitudinal PRFs tend to converge after 5000 tesserae, computed ΦRB and ΦFQY with 5000 and 10
000,∼5000, ∼1000 tesserae) for each system. Our findings reveal a strong dependence on the number of tesserae used to describe the BEM surface. In particular, while the longitudinal PRFs tend to converge after 5000 tesserae, computed ΦRB and ΦFQY with 5000 and 10![[thin space (1/6-em)]](https://www.rsc.org/images/entities/char_2009.gif) 000 tesserae show a mismatch as a function of the SNR-PDI distance. Focusing on the structure presenting the Sub-4 cavity, results suggest strong numerical instabilities when increasing the number of tesserae. This is evidenced by the lower-energy band emerging in the longitudinal absorption plots, along with the ΦFQY trend which presents an anomalous peak instead of the expected gradual decrease with increasing the SNR-PDI separation.
000 tesserae show a mismatch as a function of the SNR-PDI distance. Focusing on the structure presenting the Sub-4 cavity, results suggest strong numerical instabilities when increasing the number of tesserae. This is evidenced by the lower-energy band emerging in the longitudinal absorption plots, along with the ΦFQY trend which presents an anomalous peak instead of the expected gradual decrease with increasing the SNR-PDI separation.
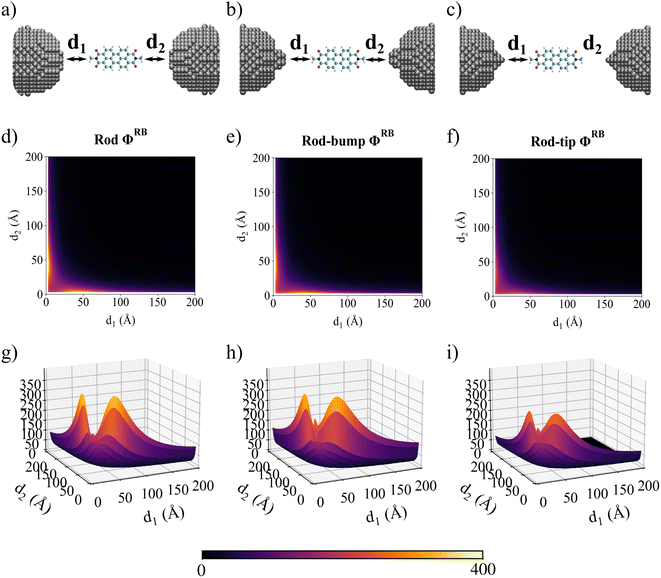
A similar study can be performed by considering PDI interacting with SNR dimers, composed of two reference cylindrical pristine SNRs (r = 18.5 Å; L = 149.5 Å), two tip-SNRs, and two bump-SNRs (see Fig. 10(a–c)). PDI ΦRB as a function of the distances compared to the two SNRs is studied (see Fig. 10(d–i)). For all shapes, the maximum ΦRB values are obtained when d1 and d2 differ (anti-symmetrical displacement). Significant discrepancies compared to the pristine SNR emerge when the bump and the tip are introduced. Specifically, for the bump-SNR, the maximum ΦRB values are similar to the pristine SNR, while a large ΦRB increase is obtained at d1 = d2 = 3 Å. This is also observed for the tip-SNR dimer. However, consistently smaller ΦRB values compared to the reference structure are reported in this case. Remarkably, these findings are in agreement with the results already discussed for single SNR NPs.
To conclude this section, it is worth highlighting that the ΦRB observed profiles for Au and Ag dimers are related to the different physicochemical mechanisms governing the fluorescence process. In the Au dimer setup, the fluorescence response is primarily driven by the relative variation of decay rates ΦFQY, whose trend perfectly matches ΦRB behavior (see Fig. S12 in the ESI†). In fact, the maximum fluorescence signal is obtained when a symmetrical arrangement (d1 = d2) is considered. A fluorescence enhancement can potentially be achieved at small distances by increasing the size of the NP, until reaching the critical point where Γr dominates over Γnr.27 On the contrary, the influence of SNRs on ΦRB is primarily determined by the variations of A as a function d1 and d2 (see Fig. S13 of the ESI†), which provide a one-to-one correspondence with ΦRB trends reported in Fig. 10(d–i). Thus, in this case, SNR anti-symmetrical arrangements (d1 ≠ d2) are crucial in enhancing the fluorescence signal.
5 Conclusions
In the present work, the QM/ωFQFμ formalism has been extended for the first time to study the fluorescence signal of molecular systems close to plasmonic substrates. The approach fully retains the atomistic structure of both the chromophore and the nanostructure, thus allowing the description of how NP atomistic features affect the molecular response.To demonstrate the reliability of the novel methodology, the fluorescence response of a well-studied fluorophore, PDI, in the presence of plasmonic Ag and Au NPs, is investigated. In particular, diverse NP morphologies are considered, ranging from spherical NPs to complex-shaped NPs, such as Ih and cTO NPs, atomistically defected nanorods and NP dimers. The reported findings show that sharp edges, associated with highly localized induced electric fields, play a crucial role in determining the molecular fluorescence response. Remarkably, this can be accurately described by only exploiting a fully atomistic approach as the one proposed in the present work. As a result, QM/ωFQFμ is here presented as an effective methodology to rationalize the fluorescence signals in atomistic-defined setups, such as for TEPL or picocavity-controlled SEF,22,77,78 pending the development of a reliable computational protocol for the simulation of realistic nanostructures.
Finally, it is worth highlighting how significant fluorescence signal enhancement can be obtained by matching the PRF with the molecular absorption energy achieved by structural deformations on the NP. The findings of the present study underscore the fundamental role of a fully atomistic description for an in-depth understanding of the fluorescence response in the vicinity of complex-shaped nanostructures. Indeed, this work paves the way for the rational design and optimization of plasmonic devices to enhance the fluorescence response of target chromophores.
Conflicts of interest
There are no conflicts to declare.Acknowledgements
The authors acknowledge Prof. Stefano Corni (Università di Padova) for useful discussion. The authors gratefully acknowledge the Center for High-Performance Computing (CHPC) at SNS for providing the computational infrastructure. CC acknowledges funding from MUR-FARE Ricerca in Italia: Framework per l'attrazione ed il rafforzamento delle eccellenze per la Ricerca in Italia - III edizione. Prot. R20YTA2BKZ, and from PNRR MUR project PE0000023-NQSTI.References
- M. Li, S. K. Cushing and N. Wu, Plasmon-enhanced optical sensors: a review, Analyst, 2015, 140, 386–406 RSC.
- M. Sharifi, F. Attar, A. A. Saboury, K. Akhtari, N. Hooshmand, A. Hasan, M. A. El-Sayed and M. Falahati, Plasmonic gold nanoparticles: Optical manipulation, imaging, drug delivery and therapy, J. Controlled Release, 2019, 311–312, 170–189 CrossRef CAS PubMed.
- M. T. Yaraki and Y. N. Tan, Metal nanoparticles-enhanced biosensors: synthesis, design and applications in fluorescence enhancement and surface-enhanced Raman scattering, Chem.–Asian J., 2020, 15, 3180–3208 CrossRef CAS PubMed.
- M. G. Albrecht and J. A. Creighton, Anomalously intense Raman spectra of pyridine at a silver electrode, J. Am. Chem. Soc., 1977, 99, 5215–5217 CrossRef CAS.
- D. L. Jeanmaire and R. P. Van Duyne, Surface Raman spectroelectrochemistry: Part I. Heterocyclic, aromatic, and aliphatic amines adsorbed on the anodized silver electrode, J. Electroanal. Chem. Interfacial Electrochem., 1977, 84, 1–20 CrossRef CAS.
- A. Campion and P. Kambhampati, Surface-enhanced Raman scattering, Chem. Soc. Rev., 1998, 27, 241–250 RSC.
- K. A. Willets and R. P. Van Duyne, Localized surface plasmon resonance spectroscopy and sensing, Annu. Rev. Phys. Chem., 2007, 58, 267–297 CrossRef CAS PubMed.
- R. Alvarez-Puebla, L. M. Liz-Marzán and F. J. García de Abajo, Light concentration at the nanometer scale, J. Phys. Chem. Lett., 2010, 1, 2428–2434 CrossRef CAS.
- E. Le Ru and P. Etchegoin, Principles of Surface-Enhanced Raman Spectroscopy: and Related Plasmonic Effects, Elsevier, 2008 Search PubMed.
- S. A. Maier, Plasmonics: Fundamentals and Applications, Springer Science & Business Media, 2007 Search PubMed.
- J. Langer, D. Jimenez de Aberasturi, J. Aizpurua, R. A. Alvarez-Puebla, B. Auguié, J. J. Baumberg, G. C. Bazan, S. E. J. Bell, A. Boisen, A. G. Brolo, J. Choo, D. Cialla-May, V. Deckert, L. Fabris, K. Faulds, E. C. García de Abajo, R. Goodacre, D. Graham, A. J. Haes, C. L. Haynes, C. Huck, T. Itoh, M. Käll, J. Kneipp, N. A. Kotov, H. Kuang, Le Ru, H. K. Lee, J.-F. Li, X. Y. Ling, S. A. Maier, T. Mayerhöfer, M. Moskovits, K. Murakoshi, J.-M. Nam, S. Nie, Y. Ozaki, I. Pastoriza-Santos, J. Perez-Juste, J. Popp, A. Pucci, S. Reich, B. Ren, G. C. Schatz, T. Shegai, S. Schlücker, L.-L. Tay, K. G. Thomas, Z.-Q. Tian, R. P. Van Duyne, T. Vo-Dinh, Y. Wang, K. A. Willets, C. Xu, H. Xu, Y. Xu, Y. S. Yamamoto, B. Zhao and L. M. Liz-Marzán, Present and future of surface-enhanced Raman scattering, ACS Nano, 2019, 14, 28–117 CrossRef PubMed.
- J. L. Payton, S. M. Morton, J. E. Moore and L. Jensen, A discrete interaction model/quantum mechanical method for simulating surface-enhanced Raman spectroscopy, J. Chem. Phys., 2012, 136, 214103 CrossRef PubMed.
- J. L. Payton, S. M. Morton, J. E. Moore and L. Jensen, A hybrid atomistic electrodynamics–quantum mechanical approach for simulating surface-enhanced Raman scattering, Acc. Chem. Res., 2014, 47, 88–99 CrossRef CAS PubMed.
- Z. Hu, D. V. Chulhai and L. Jensen, Simulating surface-enhanced hyper-Raman scattering using atomistic electrodynamics-quantum mechanical models, J. Chem. Theory Comput., 2016, 12, 5968–5978 CrossRef CAS PubMed.
- D. V. Chulhai, X. Chen and L. Jensen, Simulating ensemble-averaged surface-enhanced Raman scattering, J. Phys. Chem. C, 2016, 120, 20833–20842 CrossRef CAS.
- R. R. Chance, A. Prock and R. Silbey, Advances in Chemical Physics, John Wiley & Sons, Ltd, 1978, pp. 1–65 Search PubMed.
- S. Garoff, D. A. Weitz, M. S. Alvarez and J. I. Gersten, Electrodynamics at rough metal surfaces: Photochemistry and luminescence of adsorbates near metal-island films, J. Chem. Phys., 1984, 81, 5189–5200 CrossRef CAS.
- B. Fu, J. D. Flynn, B. P. Isaacoff, D. J. Rowland and J. S. Biteen, Super-Resolving the Distance-Dependent Plasmon-Enhanced Fluorescence of Single Dye and Fluorescent Protein Molecules, J. Phys. Chem. C, 2015, 119, 19350–19358 CrossRef CAS.
- J. Zheng, X. Cheng, H. Zhang, X. Bai, R. Ai, L. Shao and J. Wang, Gold Nanorods: The Most Versatile Plasmonic Nanoparticles, Chem. Rev., 2021, 121, 13342–13453 CrossRef CAS PubMed.
- Y. Jung, J. Kim, N. H. Kim and H. G. Kim, Ag–ZnO Nanocomposites as a 3D Metal-Enhanced Fluorescence Substrate for the Fluorescence Detection of DNA, ACS Appl. Nano Mater., 2023, 6, 976–985 CrossRef CAS.
- K.-Q. Lin, J. Yi, J.-H. Zhong, S. Hu, B.-J. Liu, J.-Y. Liu, C. Zong, Z.-C. Lei, X. Wang, J. Aizpurua, R. Esteban and B. Ren, Plasmonic photoluminescence for recovering native chemical information from surface-enhanced Raman scattering, Nat. Commun., 2017, 8, 14891 Search PubMed.
- B. Yang, G. Chen, A. Ghafoor, Y. Zhang, Y. Zhang, Y. Zhang, Y. Luo, J. Yang, V. Sandoghdar, J. Aizpurua, Z. Dong and J. G. Hou, Sub-nanometre resolution in single-molecule photoluminescence imaging, Nat. Photonics, 2020, 14, 693–699 CrossRef CAS.
- H. Lee, D. Y. Lee, M. G. Kang, Y. Koo, T. Kim and K.-D. Park, Tip-enhanced photoluminescence nano-spectroscopy and nano-imaging, Nanophotonics, 2020, 9, 3089–3110 Search PubMed.
- W. Peeters, S. Toyouchi, Y. Fujita, M. Wolf, B. Fortuni, E. Fron, T. Inose, J. Hofkens, T. Endo, Y. Miyata and H. Uji-i, Remote Excitation of Tip-Enhanced Photoluminescence with a Parallel AgNW Coupler, ACS Omega, 2023, 8, 38386–38393 CrossRef CAS PubMed.
- S. Khatua, P. M. R. Paulo, H. Yuan, A. Gupta, P. Zijlstra and M. Orrit, Resonant Plasmonic Enhancement of Single-Molecule Fluorescence by Individual Gold Nanorods, ACS Nano, 2014, 8, 4440–4449 CrossRef CAS PubMed.
- A. Rose, T. B. Hoang, F. McGuire, J. J. Mock, C. Cirací, D. R. Smith and M. H. Mikkelsen, Control of Radiative Processes Using Tunable Plasmonic Nanopatch Antennas, Nano Lett., 2014, 14, 4797–4802 CrossRef CAS PubMed.
- S. Vukovic, S. Corni and B. Mennucci, Fluorescence enhancement of chromophores close to metal nanoparticles. Optimal setup revealed by the polarizable continuum model, J. Phys. Chem. C, 2009, 113, 121–133 CrossRef CAS.
- A. Sanchez-Gonzalez, S. Corni and B. Mennucci, Surface-Enhanced Fluorescence within a Metal Nanoparticle Array: The Role of Solvent and Plasmon Couplings, J. Phys. Chem. C, 2011, 115, 5450–5460 CrossRef CAS.
- M. Romanelli, G. Dall'Osto and S. Corni, Role of metal-nanostructure features on tip-enhanced photoluminescence of single molecules, J. Chem. Phys., 2021, 155, 214304 CrossRef CAS PubMed.
- S. D. Catingan and A. Moores, Recent Progress in Surface-Enhanced Fluorescence Using Gold Nanorods, ACS Appl. Nano Mater., 2024 DOI:10.1021/acsanm.3c04756.
- L. L. Jensen and L. Jensen, Electrostatic Interaction Model for the Calculation of the Polarizability of Large Noble Metal Nanoclusters, J. Phys. Chem. C, 2008, 112, 15697–15703 CrossRef CAS.
- N. Asadi-Aghbolaghi, R. Rüger, Z. Jamshidi and L. Visscher, TD-DFT+TB: An Efficient and Fast Approach for Quantum Plasmonic Excitations, J. Phys. Chem. C, 2020, 124, 7946–7955 CrossRef CAS.
- T. Giovannini, L. Bonatti, P. Lafiosca, L. Nicoli, M. Castagnola, P. G. Illobre, S. Corni and C. Cappelli, Do We Really Need Quantum Mechanics to Describe Plasmonic Properties of Metal Nanostructures?, ACS Photonics, 2022, 9, 3025–3034 CrossRef CAS PubMed.
- P. Lafiosca, L. Nicoli, L. Bonatti, T. Giovannini, S. Corni and C. Cappelli, QM/Classical Modeling of Surface Enhanced Raman Scattering Based on Atomistic Electromagnetic Models, J. Chem. Theory Comput., 2023, 19, 3616–3633 CrossRef CAS PubMed.
- T. Giovannini, M. Rosa, S. Corni and C. Cappelli, A classical picture of subnanometer junctions: an atomistic Drude approach to nanoplasmonics, Nanoscale, 2019, 11, 6004–6015 RSC.
- L. Bonatti, G. Gil, T. Giovannini, S. Corni and C. Cappelli, Plasmonic resonances of metal nanoparticles: atomistic vs. Continuum approaches, Front. Chem., 2020, 8, 340 Search PubMed.
- P. Lafiosca, T. Giovannini, M. Benzi and C. Cappelli, Going Beyond the Limits of Classical Atomistic Modeling of Plasmonic Nanostructures, J. Phys. Chem. C, 2021, 125, 23848–23863 CrossRef CAS PubMed.
- T. Giovannini, L. Bonatti, M. Polini and C. Cappelli, Graphene plasmonics: Fully atomistic approach for realistic structures, J. Phys. Chem. Lett., 2020, 11, 7595–7602 CrossRef CAS PubMed.
- L. Bonatti, L. Nicoli, T. Giovannini and C. Cappelli, In silico design of graphene plasmonic hot-spots, Nanoscale Adv., 2022, 4, 2294–2302 RSC.
- S. Zanotto, L. Bonatti, M. F. Pantano, V. Mišeikis, G. Speranza, T. Giovannini, C. Coletti, C. Cappelli, A. Tredicucci and A. Toncelli, Strain-Induced Plasmon Confinement in Polycrystalline Graphene, ACS Photonics, 2023, 10, 394–400 CrossRef CAS PubMed.
- L. Nicoli, P. Lafiosca, P. Grobas Illobre, L. Bonatti, T. Giovannini and C. Cappelli, Fully atomistic modeling of plasmonic bimetallic nanoparticles: nanoalloys and core-shell systems, Front. Photon., 2023, 4, 2673–6853 Search PubMed.
- S. Corni and J. Tomasi, Excitation energies of a molecule close to a metal surface, J. Chem. Phys., 2002, 117, 7266–7278 CrossRef CAS.
- S. Corni and J. Tomasi, Lifetimes of electronic excited states of a molecule close to a metal surface, J. Chem. Phys., 2003, 118, 6481–6494 CrossRef CAS.
- O. Andreussi, S. Corni, B. Mennucci and J. Tomasi, Radiative and nonradiative decay rates of a molecule close to a metal particle of complex shape, J. Chem. Phys., 2004, 121, 10190–10202 CrossRef CAS PubMed.
- M. Caricato, O. Andreussi and S. Corni, Semiempirical (ZINDO-PCM) Approach to Predict the Radiative and Nonradiative Decay Rates of a Molecule Close to Metal Particles, J. Phys. Chem. B, 2006, 110, 16652–16659 CrossRef CAS PubMed.
- A. Pinchuk, G. Von Plessen and U. Kreibig, Influence of interband electronic transitions on the optical absorption in metallic nanoparticles, J. Phys. D: Appl. Phys., 2004, 37, 3133 CrossRef CAS.
- A. Pinchuk, U. Kreibig and A. Hilger, Optical properties of metallic nanoparticles: influence of interface effects and interband transitions, Surf. Sci., 2004, 557, 269–280 CrossRef CAS.
- B. Balamurugan and T. Maruyama, Evidence of an enhanced interband absorption in Au nanoparticles: size-dependent electronic structure and optical properties, Appl. Phys. Lett., 2005, 87, 143105 CrossRef.
- A. Liebsch, Surface-plasmon dispersion and size dependence of Mie resonance: silver versus simple metals, Phys. Rev. B, 1993, 48, 11317 CrossRef CAS PubMed.
- T. Giovannini, A. Puglisi, M. Ambrosetti and C. Cappelli, Polarizable QM/MM approach with fluctuating charges and fluctuating dipoles: the QM/FQFμ model, J. Chem. Theory Comput., 2019, 15, 2233–2245 CrossRef CAS PubMed.
- A. Dreuw and M. Head-Gordon, Single-Reference ab Initio Methods for the Calculation of Excited States of Large Molecules, Chem. Rev., 2005, 105, 4009–4037 CrossRef CAS PubMed.
- A. H. Larsen, et al., The atomic simulation environment—a Python library for working with atoms, J. Phys.: Condens.Matter, 2017, 29, 273002 CrossRef PubMed.
- M. Barbry, P. Koval, F. Marchesin, R. Esteban, A. Borisov, J. Aizpurua and D. Sánchez-Portal, Atomistic near-field nanoplasmonics: reaching atomic-scale resolution in nanooptics, Nano Lett., 2015, 15, 3410–3419 CrossRef CAS PubMed.
- X. Chen and L. Jensen, Morphology dependent near-field response in atomistic plasmonic nanocavities, Nanoscale, 2018, 10, 11410–11417 RSC.
- U. Kreibig and M. Vollmer, Optical properties of metal clusters, Springer Science & Business Media, 2013, vol. 25 Search PubMed.
- C. Novo, D. Gomez, J. Perez-Juste, Z. Zhang, H. Petrova, M. Reismann, P. Mulvaney and G. V. Hartland, Contributions from radiation damping and surface scattering to the linewidth of the longitudinal plasmon band of gold nanorods: a single particle study, Phys. Chem. Chem. Phys., 2006, 8, 3540–3546 RSC.
- V. Juvé, M. F. Cardinal, A. Lombardi, A. Crut, P. Maioli, J. Pérez-Juste, L. M. Liz-Marzán, N. Del Fatti and F. Vallée, Size-dependent surface plasmon resonance broadening in nonspherical nanoparticles: single gold nanorods, Nano Lett., 2013, 13, 2234–2240 CrossRef PubMed.
- B. Foerster, A. Joplin, K. Kaefer, S. Celiksoy, S. Link and C. Sönnichsen, Chemical interface damping depends on electrons reaching the surface, ACS Nano, 2017, 11, 2886–2893 CrossRef CAS PubMed.
- O. A. Douglas-Gallardo, G. J. Soldano, M. M. Mariscal and C. G. Sánchez, Effects of oxidation on the plasmonic properties of aluminum nanoclusters, Nanoscale, 2017, 9, 17471–17480 RSC.
- C. Geuzaine and J.-F. G. Remacle, A 3-D finite element mesh generator with built-in pre- and post-processing facilities, Int. J. Numer. Methods Eng., 2009, 79, 1309–1331 CrossRef.
- S. Corni and J. Tomasi, Surface enhanced Raman scattering from a single molecule adsorbed on a metal particle aggregate: A theoretical study, J. Chem. Phys., 2002, 116, 1156–1164 CrossRef CAS.
- R. Cammi and J. Tomasi, Remarks on the use of the apparent surface charges (ASC) methods in solvation problems: Iterative versus matrix-inversion procedures and the renormalization of the apparent charges, J. Comput. Chem., 1995, 16, 1449–1458 CrossRef CAS.
- J. Tomasi, B. Mennucci and R. Cammi, Quantum Mechanical Continuum Solvation Models, Chem. Rev., 2005, 105, 2999–3094 CrossRef CAS PubMed.
- P. G. Etchegoin, E. Le Ru and M. Meyer, An analytic model for the optical properties of gold, J. Chem. Phys., 2006, 125, 164705 Search PubMed.
- M. G. Blaber, A.-I. Henry, J. M. Bingham, G. C. Schatz and R. P. Van Duyne, LSPR Imaging of Silver Triangular Nanoprisms: Correlating Scattering with Structure Using Electrodynamics for Plasmon Lifetime Analysis, J. Phys. Chem. C, 2012, 116, 393–403 CrossRef CAS.
- P. B. Johnson and R.-W. Christy, Optical constants of the noble metals, Phys. Rev. B, 1972, 6, 4370 CrossRef CAS.
- E. Baerends, et al., ADF (Version 2020.X); Theoretical Chemistry, Vrije Universiteit, Amsterdam, The Netherlands, 2020, http://www.scm.com Search PubMed.
- E. Dulkeith, M. Ringler, T. A. Klar, J. Feldmann, A. Muñoz Javier and W. J. Parak, Gold Nanoparticles Quench Fluorescence by Phase Induced Radiative Rate Suppression, Nano Lett., 2005, 5, 585–589 CrossRef CAS PubMed.
- P. Reineck, D. Gómez, S. H. Ng, M. Karg, T. Bell, P. Mulvaney and U. Bach, Distance and Wavelength Dependent Quenching of Molecular Fluorescence by Au@SiO2 Core–Shell Nanoparticles, ACS Nano, 2013, 7, 6636–6648 CrossRef CAS PubMed.
- J. D. Pajović, R. J. Dojčilović, S. Kaščáková, M. Réfrégiers, D. K. Božanić and V. Djoković, Enhanced resonance energy transfer in gold nanoparticles bifunctionalized by tryptophan and riboflavin and its application in fluorescence bioimaging, Colloids Surf., B, 2023, 227, 113340 CrossRef PubMed.
- A. Trügler, Optical Properties of Metallic Nanoparticles, Springer International Publishing, 2016 Search PubMed.
- P. Anger, P. Bharadwaj and L. Novotny, Enhancement and Quenching of Single-Molecule Fluorescence, Phys. Rev. Lett., 2006, 96, 113002 CrossRef PubMed.
- H. Yuan, S. Khatua, P. Zijlstra, M. Yorulmaz and M. Orrit, Thousand-fold Enhancement of Single-Molecule Fluorescence Near a Single Gold Nanorod, Angew. Chem., Int. Ed., 2013, 52, 1217–1221 CrossRef CAS PubMed.
- E. Wientjes, J. Renger, A. G. Curto, R. Cogdell and N. F. van Hulst, Strong antenna-enhanced fluorescence of a single light-harvesting complex shows photon antibunching, Nat. Commun., 2014, 5, 4236 CrossRef CAS PubMed.
- Z. Mei and L. Tang, Surface-Plasmon-Coupled Fluorescence Enhancement Based on Ordered Gold Nanorod Array Biochip for Ultrasensitive DNA Analysis, Anal. Chem., 2017, 89, 633–639 Search PubMed.
- J.-F. Li, C.-Y. Li and R. F. Aroca, Plasmon-enhanced fluorescence spectroscopy, Chem. Soc. Rev., 2017, 46, 3962–3979 RSC.
- A. Rosławska, T. c. v. Neuman, B. Doppagne, A. G. Borisov, M. Romeo, F. Scheurer, J. Aizpurua and G. Schull, Mapping Lamb, Stark, and Purcell Effects at a Chromophore-Picocavity Junction with Hyper-Resolved Fluorescence Microscopy, Phys. Rev. X, 2022, 12, 011012 Search PubMed.
- J. Doležal, A. Sagwal, R. C. de Campos Ferreira and M. Švec, Single-Molecule Time-Resolved Spectroscopy in a Tunable STM Nanocavity, Nano Lett., 2024, 24, 1629–1634 CrossRef PubMed.
Footnote |
| † Electronic supplementary information (ESI) available: Details on the BEM model. Geometrical parameters and computed plasmon resonance frequencies. Atomistic vs. Continuum for Ag structures. Fluorescence Dependence on NP size and morphology. PDI interacting with Ag Nanorods. PDI interacting with NP dimers. See DOI: https://doi.org/10.1039/d4na00080c |
| This journal is © The Royal Society of Chemistry 2024 |

