 Open Access Article
Improved electrochemical performance of defect-induced supercapacitor electrodes based on MnS-incorporated MnO2 nanorods†
Mizanur
Rahaman
a,
Md. Roxy
Islam
b and
Muhammad Rakibul
Islam
 *a
*a
aDepartment of Physics, Bangladesh University of Engineering and Technology, Dhaka, Bangladesh. E-mail: rakibul@phy.buet.ac.bd
bDepartment of Materials and Metallurgical Engineering, Bangladesh University of Engineering and Technology, Dhaka, Bangladesh
First published on 12th June 2024
Abstract
In this paper, we report the effect of MnS nanoparticles on the electrochemical performance of 1D-MnO2 stable nanorods for supercapacitor electrodes. The MnS-incorporated 1D-MnO2 (MnO2/MnS) nanorods were produced using a facile two-step hydrothermal method. Morphological investigation reveals that the incorporation of MnS nanoparticles distorts the lattice fringes and extends the interlayer spacing of the MnO2 nanorods. The structural study showed that MnS modified the structural parameters of the nanocomposite. XPS analysis revealed defects in the nanocomposite due to the generation of oxygen vacancies. The MnO2/MnS nanocomposite improves capacitive performance and has the highest specific capacitance of 305 F g−1, at a current density of 1 A g−1 with an energy density of 5.7 W h kg−1 and a power density of 449 W kg−1. The MnO2/MnS nanocomposite electrodes exhibit exceptional cyclic stability after 5000 charging and discharging cycles. With enhanced specific capacitance and excellent cyclic stability, the MnO2/MnS nanocomposite paves a new way to produce supercapacitor electrodes.
1. Introduction
The excessive use of fossil fuels for energy production and their harmful environmental consequences have led to an extensive search for sustainable energy sources and advanced energy storage devices. Among the wide range of energy storage devices, supercapacitors are a promising candidate due to their rapid rechargeability, ultrahigh power density, and superior long-term cycling stability.1,2 Supercapacitors are usually categorized into two types based on their charge storage mechanisms: pseudocapacitors and electrical double-layer capacitors (EDLCs).3 Various transition metal oxides have been used as electrodes for supercapacitors. Among them, MnO2 is considered a potential candidate for supercapacitor applications due to its high theoretical capacitance (1370 F g−1), narrow band gap and environmentally benign nature.4 However, the electrochemical performance of MnO2 decreased due to its low electrical conductivity and poor electrolyte wettability, which also reduces cyclic retention.5 The limited active sites and low surface-level reactions reduce the electrochemical performance of MnO2.6 Therefore, the electrochemical performance of MnO2 can be improved by enhancing its electrical conductivity, surface area, and interlayer spacing.The incorporation of nanomaterials is an effective strategy for enhancing the capacitive performance of the oxide-base materials. This approach may increase surface area, improve conductivity, expand interlayer distance, and create electrochemical active sites, all of which contribute to improved electrochemical performance. Various nanomaterials have been incorporated to improve the capacitive performance of MnO2. Among these options, MnS nanoparticles have garnered significant research interest due to their high theoretical capacitance, strong redox reactions, charge transfer kinetics, and higher electronic conductivity (3.2 × 10³ S cm−1) compared to their oxide counterparts.7 Moreover, the diverse crystal structures and complex phases of MnS play a crucial role in enhancing the electrochemical performance of MnO2.8 Nanostructured MnS demonstrates high ionic penetration and intercalation–deintercalation properties, contributing to the electrochemical stability of supercapacitors. Moreover, when integrated with other materials, MnS demonstrates a synergistic effect that enhances electrochemical energy storage performance.9 Nanostructured MnS is therefore employed in various applications such as batteries, supercapacitors, and fuel cells.
More recently, a research study explored nanostructured MnO2 and MnS binary composites for electrochemical electrodes. Rajagopal et al. fabricated a MnS-deposited MnO2 composite for supercapacitor applications.7 The deposition of MnS changes the morphology of MnO2, influenced by the sulfur source. At the highest concentration, the MnS-deposited MnO2 nanocomposite shows a specific capacitance of 384.25 F g−1 at a current density of 1 A g−1. This nanocomposite is combined with activated carbon, resulting in a specific capacitance of 84.56 F g−1 at a current density of 0.5 A g−1 and a cycle stability of 87% after 1000 charge–discharge cycles. However, the performance of this nanocomposite may vary due to its changeable morphology. Moreover, these charging–discharging cycles may not be sufficient to fully represent the stability of an electrochemical energy storage device.
In this paper, MnS nanoparticles are incorporated into MnO2stable nanorods using a two-step hydrothermal method. The morphological, structural, chemical and electrochemical properties were studied. The structural parameters, interlayer distance, and valence state change due to the introduction of MnS nanoparticles. These variations enhance the electrochemical performance. The specific capacitance of the nanocomposite increased, achieving a maximum specific capacitance of 305 F g−1 at a current density of 1 A g−1 along with excellent energy and power density. The nanocomposite also exhibits 110% cyclic stability after 5000 charge–discharge cycles.
2. Experimental section
2.1. Materials
All chemicals were collected without any further refinement. The precursors for MnO2 nanorods and MnS nanoparticles are potassium permanganate (KMnO4), manganese sulfate monohydrate (MnSO4·H2O), manganese(II) chloride tetra-hydrate (MnCl2·4H2O), hydrazine hydrate (N2H4·H2O), dimethyl sulfoxide (C2H6OS), polyvinyl alcohol (C2H4O), and sodium sulfate (Na2SO4). These were all purchased from the Research Lab in Mumbai, India.2.2. Synthesis of MnO2 nanorod, MnS nanoparticles and MoS2/MnS nanocomposites
To prepare MnO2, specific amounts of KMnO4 and MnSO4·H2O were dissolved in 140 ml of deionized (DI) water and stirred for half an hour to obtain a homogenous solution. The solution was then transferred into a 200 ml Teflon-lined autoclave and kept at 140 °C for 12 h. Then, the brown precipitate was washed several times with ethanol and DI water. Finally, the resultant yield was dried at 70 °C to obtain MnO2 nanorod.Firstly, a specific amount of MnCl2·4H2O and C2H5NS will be mixed together in 120 ml of DI water and stirred for one hour. After that, hydrazine hydrate (N2H4·H2O) will be added to the solution and again stirred for an additional 2 h to get a homogenous solution. The homogeneous solution will then be poured into a Teflon-coated stainless steel autoclave and heated to 180 °C for 24 h. To clean the green precipitate, ethanol and deionized water were used and finally the precipitate was dried for several hours at 60 °C.
To prepare MnS decorated MnO2 nanorod (MnO2/MnS), a certain amount of MnS nanoparticles (1, 2 and 4 wt%), was poured into 50 ml of DI water and sonicated for 1 h. Secondly, a 70 ml solution of KMnO4 and MnSO4·H2O was mixed and stirred for 30 minutes vigorously. Finally, the sonicated MnS and MnO2 solution were mixed and kept in the autoclave at 140 °C for 12 h. The resulting MnO2/MnS nanocomposite was cleaned with DI water and then dried at 70 °C.
2.3 Characterizations
The surface morphology of all samples was investigated by field-emission scanning electron microscopy (JSM 7600, JEOL) and transmission electron microscopy (JEM 2100 F, JEOL). An X-ray diffractometer (Smartlab SE, Rigaku, Japan) was used to study the structural properties of the nanocomposites using CuKα radiation (λ = 1.5406 Å). The chemical state and elemental compositions were analyzed using Shimadzu ESCA 3400 X-ray photoelectron spectroscopy. The electrochemical properties including CV, GCD and EIS of the samples were studied using a three-electrode setup with a CS310 (Cortest, China) workstation. To prepare the working electrodes for MnO2 and MnO2/MnS, the active material was mixed with polyvinyl alcohol (C2H4O) in a specific ratio, and the solvent dimethyl sulfoxide (C2H6OS) was used.3. Results and discussions
Fig. 1(a–d) show the FE-SEM images of pure MnO2 nanorods and the MnO2/MnS nanocomposite. The inset of Fig. 1(a) demonstrates the morphology of MnS nanoparticles. The MnO2 nanorods form uniformly without a common center, with an average diameter of 60–80 nm. However, the MnO2 nanorods tend to agglomerate due to high surface tension and surface energy, which reduces the specific surface area.10 When MnS nanoparticles are incorporated into MnO2, they are uniformly distributed on the surface of the MnO2 nanorod. The MnS nanoparticles reduce the average diameter of MnO2 nanorods, which indicates enhancement of the specific surface area that improves the capacitive performance. Moreover, MnS nanoparticles are found between the gaps of MnO2 nanorods. The strong interfacial interaction occurs between MnS and MnO2 as the concentration of MnS increases, which accelerates charge transportation and enhances overall charge storage performance.11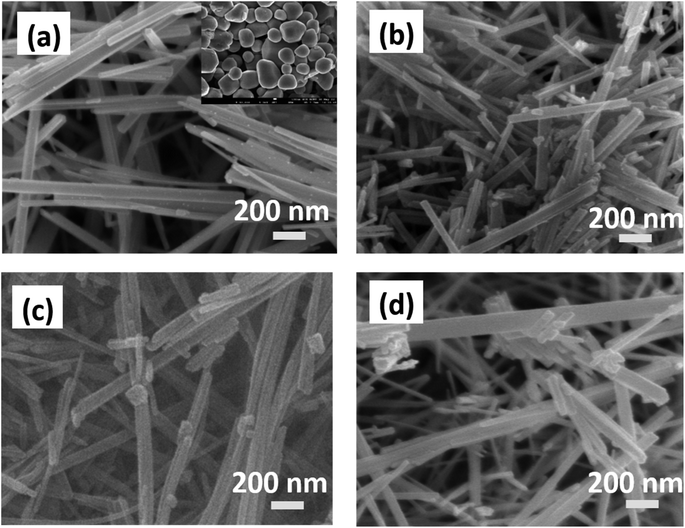 | ||
| Fig. 1 FE-SEM images of (a) MnO2 nanorod, (b) MnO2/MnS (1 wt%), (c) MnO2/MnS (2 wt%), and (d) MnO2/MnS (4 wt%) nanocomposites. | ||
Fig. 2(a–d) show the HRTEM images of MnO2 and MnO2/MnS nanocomposites, with discernible lattice fringes. The interlayer spacing of the MnO2 nanorod was estimated to be 0.239 nm, which is consistent to the previous experimental work.12 Upon the addition of MnS nanoparticles, the interlayer spacing of the nanocomposites increased. The measured interlayer distances for the nanocomposites with 1, 2, and 4 wt% MnS were 0.245, 0.240, and 0.263 nm. Fig. 2(b–d) illustrate the existence of MnS nanoparticles in the HRTEM images, indicating their attachment to the surface of MnO2 nanorods. The interlayer distance of the nanocomposite found to be increased due to the incorporation of MnS, which may be attributed to the presence of surface defects.13 The expanded interlayer distance inhibits the collapsing of the material layers during the fast charge carrier's transportation system.14 The board interlayer spacing and increased specific surface area of the MnO2/MnS nanocomposites may result in enhanced capacitance.15
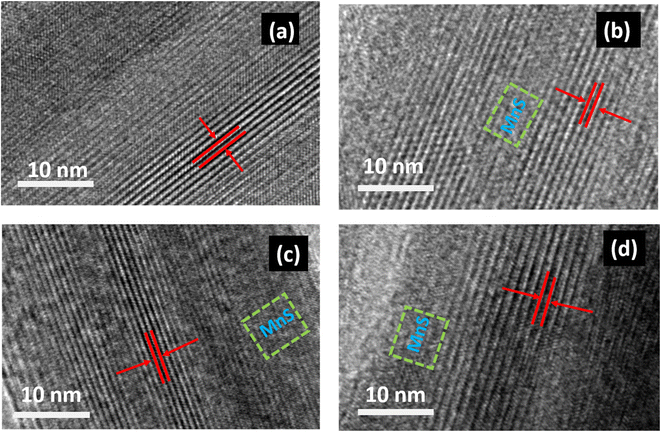 | ||
| Fig. 2 HR-TEM images of (a) MnO2 nanorod, (b) MnO2/MnS (1 wt%), (c) MnO2/MnS (2 wt%), and (d) MnO2/MnS (4 wt%) nanocomposites. | ||
The crystalline shape and structural properties of MnO2 and MnO2/MnS nanocomposites were analyzed by X-ray diffraction. Fig. 3(a) shows the XRD patterns of the synthesized samples. The diffraction peaks confirm the formation of MnO2, and the broader peaks around 18° and 50° indicate the formation of the tetragonal phase of the crystal structure. The space group of MnO2 nanorod is 14/m, which agrees with the JCPDS card number 44-0140. The diffraction peaks of MnS match the JCPDS card number 06-0518, which is shown in the supplementary Fig. ST 1.† It is observed that the diffraction peaks of the nanocomposite slightly broadened after the introduction of MnS nanoparticles. The existence of microstrain in the nanocomposite is responsible for the broadening of the diffraction lines. Generally, microstrain occurs owing to crystal imperfections, vacancies, and dislocations. In addition, the wide diffraction peaks indicate increased interlayer spacing and the presence of structural defects. The microstrain (ε) and dislocation density (δ) of all samples were calculated using the following equations.16
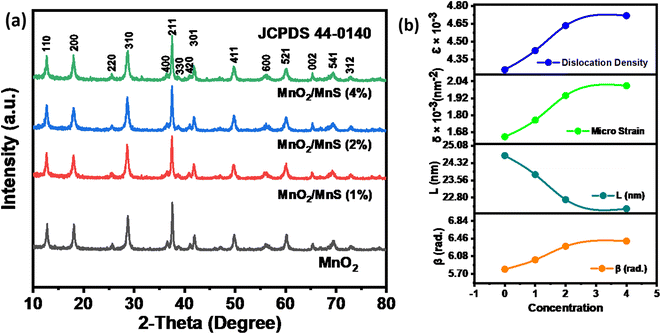 | ||
| Fig. 3 XRD diffraction patterns of (a) MnO2 nanorod, and MnO2/MnS nanocomposites (b) structural parameters of MnO2/MnS nanocomposites. | ||
Fig. 3(b) shows the variation of the microstrain and dislocation density with the concentration of MnS nanoparticles, as represented in Table 1. This lattice distortion results in an expansion of interlayer distance, which could facilitate fast electron transport from the surface to the electrode.17 Moreover, the dislocation density reduces the electrochemical impedance of the materials, which improves the capacitive performance. Based on this analysis, it may be predicted that MnO2/MnS (4 wt%) would exhibit the best electrochemical performance.
| Samples | β × 103 (radian) | Crystallinity (%) | Micro strain ε × 10−3 | Dislocation density δ × 10−3 |
|---|---|---|---|---|
| MnO2 | 5.80 | 71.83 | 4.26 | 1.65 |
| MnO2/MnS (1%) | 6.01 | 67.59 | 4.42 | 1.76 |
| MnO2/MnS (2%) | 6.29 | 66.44 | 4.63 | 1.94 |
| MnO2/MnS (4%) | 6.41 | 64.06 | 4.72 | 2.01 |
The surface chemical states of the prepared MnO2/MnS were examined using XPS analysis. Fig. 4(a) shows the survey spectra, which illustrate the existence of Mn, O, and S elements. Fig. 4(b) shows the high-resolution spectra of Mn 2p that were analyzed to understand the oxidation state of Mn. The two identical peaks observed at binding energies at 641.97 and 653.56 eV correspond to Mn 2p3/2 and Mn 2p1/2, respectively. The splitting energy difference between these two peaks is 11.7 eV, which indicates a mixed valence state. Furthermore, the mixed valence states demonstrate the presence of oxygen vacancy in the nanocomposite.18 Moreover, the peaks of MnO2/MnS are slightly shifting as compared to the supplementary Fig. ST 2† of pristine MnO2 nanorods Mn 2p spectra. This shifting of the binding energy indicates electron transfer from MnO2 to MnS.19–21 For the Mn 3s spectrum, two doublets at the binding energy 83.83 and 89.04 eV with a separation of 5.21 eV, which is shown in Fig. 5(c) and suggests the oxidation state of Mn4+ in the composite. The high-resolution core level O 1s spectra exhibit two primary peaks at 529.76 and 531.52 eV, both of which are attributed to the metal–oxygen bond (Mn–O–Mn) and metal hydroxide bond (Mn–OH).
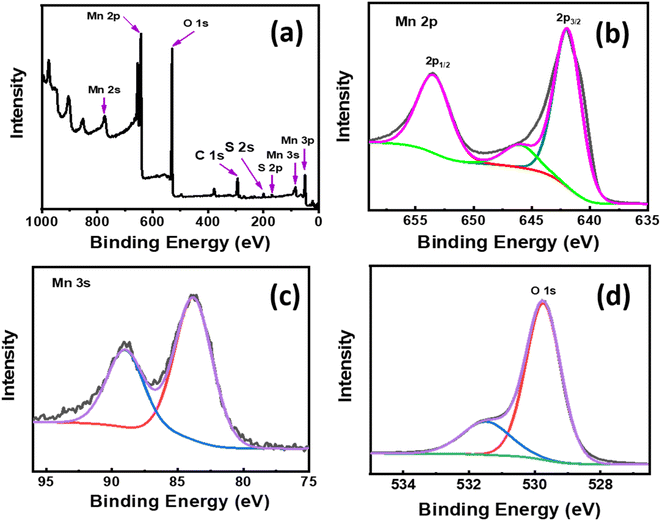 | ||
| Fig. 4 XPS survey spectra of (a) MnO2/MnS (4 wt%) nanocomposite. High resolution spectra of (b) Mn 2p, (c) Mn 3 s, and (d) O 1 s for MnO2/MnS (4 wt%) nanocomposite. | ||
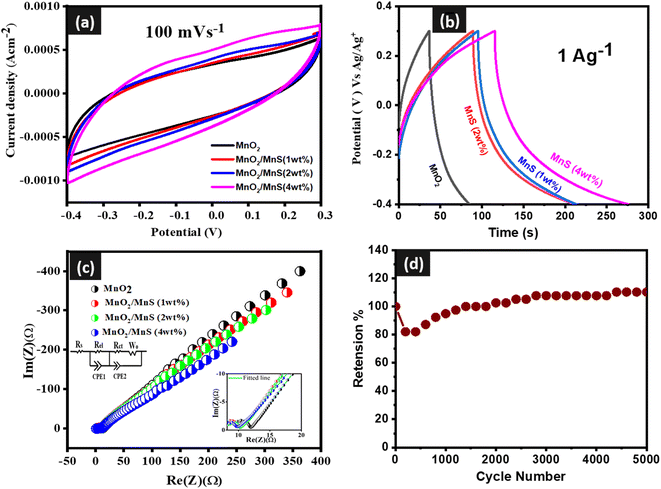 | ||
| Fig. 5 CV curve of (a) MnO2/MnS, (b) GCD curve of MnO2/MnS, (c) EIS spectra of MnO2/MnS and (d) capacitive retention of MnO2/MnS (4 wt%) nanocomposite. | ||
Fig. 5(a) shows the CV curve of synthesized MnO2 nanorods and MnO2/MnS nanocomposites at a constant scan rate within the potential window of −0.5 to 0.4 V. Redox peaks were observed at higher concentrations of MnS. The presence of a surface reversible redox-reaction mechanism between Mn2+–Mn3+–Mn4+ causes the redox behavior in the CV curves, which can be represented by the following redox reaction.22–26
| MnO2 + Na+ + e− ↔ MnO – ONa |
| MnS + OH− ↔ MnSOH + e− |
| MnSOH + OH− ↔ MnSO + H2O + e− |
The CV area of the nanocomposite depends on the concentration of MnS nanoparticles. At higher concentrations, the CV is larger than other samples, which indicates high specific capacitance.
Fig. 5(b) illustrates the GCD curves of MnO2 and MnO2/MnS at a constant current density 1 A g−1. The non-linear GCD curves of the prepared samples signify pseudo-capacitive behavior, which is consistent with the reported CV data.27,28 From GCD curves, the specific capacitance (Cs) could be determined by using the following equation:29
| Samples | Specific capacitance (F g−1) |
|---|---|
| MnO2 | 90 |
| MnO2/MnS (1 wt%) | 233 |
| MnO2/MnS (2 wt%) | 225 |
| MnO2/MnS (4 wt%) | 305 |
Fig. 5(c) shows the electrochemical impedance spectra (EIS) of MnO2 nanorods and MnO2/MnS nanocomposites. In the inset of Fig. 5(c), an equivalent circuit is illustrated, and the value of the circuit components is determined using Z-view software. The impedance (Rel) at the interface of electrode/electrolyte and charge transfer resistance (Rct) during the faradaic process is represented by the diameter of the semi-circle.31 The constant phase element (CPE) is attributed to the non-ideal capacitive behavior of the electrochemical system. The Warburg impedance is related to the electrolyte ion diffusion length and diffusivity inside the active electrode material.32,33 The value of all circuit components is presented in Table 3. After the decoration of MnS nanoparticles, the charge transfer resistance of the nanocomposite is reduced due to fast charge transportation and ionic conductivity. Among four samples, the MnO2/MnS (4 wt%) demonstrates the lowest charge transfer resistance, which signifies better capacitive behavior. Moreover, MnO2/MnS (4 wt%) shows higher CPE–T, lower ohmic resistance (W–R), and lower diffusion time constant (W–T) than other samples, indicating better diffusion rate and better capacitive performance.30,31 Furthermore, MnO2/MnS (4 wt%) shows lower ohmic resistance than that of the other three samples indicating a better diffusion rate of electrolyte ions.34 Moreover, the interfacial charge transfer phenomena are frequency dependent, which is denoted by (ωo), and reciprocal to the time constant τo.35,36 By analyzing the high-frequency semi-circle, the time constant decreases with the increase of MnS nanoparticles. The MnO2/MnS exhibits the shortest time constant, which indicates fast charge transportation and thereby improves capacitive performance. Fig. 5(d) shows the capacitive retention of the best capacitive electrode for 5000 charging–discharging cycles. After completing 5000 cycles, the retention value reached 110%.
| Samples | R el | R ct | CPE-T | W–R | W–T | τ o × 10−7 (s−1) |
|---|---|---|---|---|---|---|
| MnO2 | 2.2 | 7 | 0.0028 | 120 | 0.37 | 8.08 |
| MnO2/MnS (1 wt%) | 3.5 | 2.6 | 0.0029 | 130 | 0.70 | 6.92 |
| MnO2/MnS (2 wt%) | 2.4 | 2.5 | 0.0028 | 120 | 0.37 | 5.77 |
| MnO2/MnS (4 wt%) | 2.4 | 0.78 | 0.0028 | 100 | 0.35 | 3.46 |
This exceptional retention value indicates the electrode material, which is typically binary metal sulfide base nanocomposite, exhibits higher specific capacitance as the number of cycles increases. In addition, the enhancement of this phenomenon is probably caused by the electrochemical activation commonly encountered in electrochemistry.36
Several factors contribute to the improved electrochemical performance of MnO2/MnS nanocomposites: (1) incorporation of MnS creates defects in MnO2 creating additional electrochemical reaction sites and enhancing capacitive performance. (2) The large interlayer distance prevents the materials from collapsing during the reaction and facilitates the ion transportation of the interface of MnO2 and MnS. (3) From the EIS spectra, the nanocomposites exhibit low charge transfer resistance, and the increased conductivity.
To summarize, when employing the same electrolytes, α-MnO2 and MnS have the same working potential and are compatible under the same test circumstances.
Conclusion
In conclusion, MnS is decorated on 1D-MnO2 nanorods by a two-step hydrothermal process. This method is easy, cost-effective, and useful for large-scale production. For MnO2/MnS nanocomposite, MnS changes the structural parameters and boarded interlayer distance and produces oxygen vacancy compared to its MnO2 counterpart. These unique features enable efficient charge storage through the rapid transportation of ions between their interfaces. The MnO2/MnS nanocomposite delivers the highest specific capacitance, 305 F g−1 at 1 A g−1, with excellent capacitive retention. The power density of the nanocomposite is 449 W kg−1 with an energy density of 5.7 W h kg−1. This simple technique and the unique features of MnO2/MnS provide a promising way to produce high-performance energy storage electrode materials to design energy storage devices.Conflicts of interest
There are no conflicts to declare.Acknowledgements
The authors gratefully acknowledge the financial support from the Ministry of Science and Technology, Government of Bangladesh, under grant 39.00.0000.009.99.023.23-363 (Project ID# SRG-236627).References
- P. Simon and Y. Gogotsi, Materials for electrochemical capacitors, Nat. Mater., 2008, 7(11), 845–854 CrossRef CAS PubMed.
- D. Pech, M. Brunet, H. Durou, P. Huang, V. Mochalin, Y. Gogotsi, P. L. Taberna and P. Simon, Ultrahigh-power micrometre-sized supercapacitors based on onion-like carbon, Nat. Nanotechnol., 2010, 5(9), 651–654 CrossRef CAS PubMed.
- Z. Li, J. Wang, S. Liu, X. Liu and S. Yang, Synthesis of hydrothermally reduced graphene/MnO2 composites and their electrochemical properties as supercapacitors, J. Power Sources, 2011, 196(19), 8160–8165 CrossRef CAS.
- A. Kumar, A. Sanger, A. Kumar, Y. Kumar and R. Chandra, Sputtered synthesis of MnO2 nanorods as binder free electrode for high performance symmetric supercapacitors, Electrochim. Acta, 2016, 222, 1761–1769 CrossRef CAS.
- Z. Guo, J. Mu, H. Che, G. Wang, A. Liu, X. Zhang and Z. Zhang, Facile preparation of MnO2@ C composite nanorods for high-performance supercapacitors, J. Mater. Sci.: Mater. Electron., 2016, 27, 13314–13322 CrossRef CAS.
- X. Zheng, S. Mofarah, A. Cen, C. Cazorla, E. Haque, E. Y. Chen, A. J. Atanacio, M. Manohar, C. Vutukuri, J. L. Abraham and P. Koshy, Role of oxygen vacancy ordering and channel formation in tuning intercalation pseudocapacitance in Mo single-ion-implanted CeO2–x nanoflakes, ACS Appl. Mater. Interfaces, 2021, 13(50), 59820–59833 CrossRef CAS PubMed.
- R. Rajagopal and K. S. Ryu, Synthesis of MnO2 nanostructures with MnS-deposits for high performance supercapacitor electrodes, New J. Chem., 2019, 43(33), 12987–13000 RSC.
- Q. Zhou, W. Li, H. Xu, M. Gao, X. Dong and J. Lin, Fabrication of hierarchical integrated 3D hollow MnS@MoS2 microcubes via a template-controlled synthesis for asymmetric supercapacitors, J. Mater. Chem. A, 2022, 10(17), 9370–9379 RSC.
- Y. Jia, Y. Lin, Y. Ma and W. Shi, Hierarchical MnS2-MoS2 nanotubes with efficient electrochemical performance for energy storage, Mater. Des., 2018, 160, 1071–1079 CrossRef CAS.
- H. Zhang, J. Gu, J. Tong, Y. Hu, B. Guan, B. Hu, J. Zhao and C. Wang, Hierarchical porous MnO2/CeO2 with high performance for supercapacitor electrodes, Chem. Eng. J., 2016, 286, 139–149 CrossRef CAS.
- S. Venkateshalu, G. M. Tomboc, S. P. Nagalingam, J. Kim, T. Sawaira, K. Sehar, B. G. Pollet, J. Y. Kim, A. N. Grace and K. Lee, Synergistic MXene/LDH heterostructures with extensive interfacing as emerging energy conversion and storage materials, J. Mater. Chem. A, 2023, 11(27), 14469–14488 RSC.
- S. Liu, M. Li, Y. Xiong and Y. Zhu, Effects of the Morphology of MnO2 Nanostructures on the Catalytic Oxidation of Toluene, ACS Appl. Nano Mater., 2023, 6(16), 14721–14732 CrossRef CAS.
- L. Zhong, H. Chen, W. Xie, W. Jia, Y. Xiao, B. Cheng, L. Lin and S. Lei, Intercalation and defect engineering of layered MnPS3 for greatly enhanced capacity and stability in sodium-ion batteries, Chem. Eng. J., 2024, 481, 148370 CrossRef CAS.
- L. Wang, X. Tan, Q. Zhu, Z. Dong, X. Wu, K. Huang and J. Xu, The universality applications of MoS2@MnS heterojunction hollow microspheres for univalence organic or multivalence aqueous electrolyte energy storage device, J. Power Sources, 2022, 518, 230747 CrossRef CAS.
- X. Mao, Y. Zou, F. Xu, L. Sun, H. Chu, H. Zhang, J. Zhang and C. Xiang, Three-dimensional self-supporting Ti3C2 with MoS2 and Cu2O nanocrystals for high-performance flexible supercapacitors, ACS Appl. Mater. Interfaces, 2021, 13(19), 22664–22675 CrossRef CAS PubMed.
- Jr W. S. Hummers and R. E. Offeman, Preparation of graphitic oxide, J. Am. Chem. Soc., 1958, 80(6), 1339 CrossRef.
- L. Ma, L. Xu, X. Xu, X. Zhou, J. Luo and L. Zhang, Cobalt-doped edge-rich MoS2/nitrogenated graphene composite as an electrocatalyst for hydrogen evolution reaction, Mater. Sci. Eng. B, 2016, 212, 30–38 CrossRef CAS.
- B. P. Mishra, L. Acharya, S. Subudhi and K. Parida, Oxygen vacancy rich α-MnO2@ B/Og-C3N4 photocatalyst: A thriving 1D-2D surface interaction effective towards photocatalytic O2 and H2 evolution through Z-scheme charge dynamics, Int. J. Hydrogen Energy, 2022, 47(75), 32107–32120 CrossRef CAS.
- H. Wang, Y. Yang, Q. Li, W. Lu, J. Ning, Y. Zhong, Z. Zhang and Y. Hu, Molecule-assisted modulation of the high-valence Co3+ in 3D honeycomb-like CoxSy networks for high-performance solid-state asymmetric supercapacitors, Sci. China Mater., 2021, 64(4), 840–851 CrossRef CAS.
- W. Lu, Y. Yang, T. Zhang, L. Ma, X. Luo, C. Huang, J. Ning, Y. Zhong and Y. Hu, Synergistic effects of Fe and Mn dual-doping in Co3S4 ultrathin nanosheets for high-performance hybrid supercapacitors, J. Colloid Interface Sci., 2021, 590, 226–237 CrossRef CAS PubMed.
- Q. Li, W. Lu, Z. Li, J. Ning, Y. Zhong and Y. Hu, Hierarchical MoS2/NiCo2S4@C urchin-like hollow microspheres for asymmetric supercapacitors, Chem. Eng. J., 2020, 380, 122544 CrossRef CAS.
- M. S. Javed, X. Han, C. Hu, M. Zhou, Z. Huang, X. Tang and X. Gu, Tracking pseudocapacitive contribution to superior energy storage of MnS nanoparticles grown on carbon textile, ACS Appl. Mater. Interfaces, 2016, 8(37), 24621–24628 CrossRef CAS PubMed.
- H. Quan, B. Cheng, D. Chen, X. Su, Y. Xiao and S. Lei, One-pot synthesis of α-MnS/nitrogen-doped reduced graphene oxide hybrid for high-performance asymmetric supercapacitors, Electrochim. Acta, 2016, 210, 557–566 CrossRef CAS.
- L. Khandare and S. Terdale, Gold nanoparticles decorated MnO2 nanowires for high performance supercapacitor, Appl. Surf. Sci., 2017, 418, 22–29 CrossRef CAS.
- J. Bhagwan, A. Sahoo, K. L. Yadav and Y. Sharma, Porous, one dimensional and high aspect ratio Mn3O4 nanofibers: fabrication and optimization for enhanced supercapacitive properties, Electrochim. Acta, 2015, 174, 992–1001 CrossRef CAS.
- N. S. Arul, L. S. Cavalcante and J. In Han, Facile synthesis of ZnS/MnS nanocomposites for supercapacitor applications, J. Solid State Electrochem., 2018, 22, 303–313 CrossRef CAS.
- K. T. Kubra, R. Sharif, B. Patil, A. Javaid, S. Shahzadi, A. Salman, S. Siddique and G. Ali, Hydrothermal synthesis of neodymium oxide nanoparticles and its nanocomposites with manganese oxide as electrode materials for supercapacitor application, J. Alloys Compd., 2020, 815, 152104 CrossRef CAS.
- N. Kanaujiya, N. Kumar, A. K. Srivastava, Y. Sharma and G. D. Varma, One-step synthesized mesoporous MnO2@MoS2 nanocomposite for high performance energy storage devices, J. Electroanal. Chem., 2018, 824, 226–237 CrossRef CAS.
- H. B. Li, M. H. Yu, F. X. Wang, P. Liu, Y. Liang, J. Xiao, C. X. Wang, Y. X. Tong and G. W. Yang, Amorphous nickel hydroxide nanospheres with ultrahigh capacitance and energy density as electrochemical pseudocapacitor materials, Nat. Commun., 2013, 4(1), 1894 CrossRef CAS PubMed.
- S. K. Meher and G. R. Rao, Enhanced activity of microwave synthesized hierarchical MnO2 for high performance supercapacitor applications, J. Power Sources, 2012, 215, 317–328 CrossRef CAS.
- A. Eftekhari, The mechanism of ultrafast supercapacitors, J. Mater. Chem. A, 2018, 6(7), 2866–2876 RSC.
- M. Jana, S. Saha, P. Khanra, P. Samanta, H. Koo, N. C. Murmu and T. Kuila, Non-covalent functionalization of reduced graphene oxide using sulfanilic acid azocromotrop and its application as a supercapacitor electrode material, J. Mater. Chem. A, 2015, 3(14), 7323–7331 RSC.
- M. Zhong, Y. Song, Y. Li, C. Ma, X. Zhai, J. Shi, Q. Guo and L. Liu, Effect of reduced graphene oxide on the properties of an activated carbon cloth/polyaniline flexible electrode for supercapacitor application, J. Power Sources, 2012, 217, 6–12 CrossRef CAS.
- E. Katz and I. Willner, Probing biomolecular interactions at conductive and semiconductive surfaces by impedance spectroscopy: routes to impedimetric immunosensors, DNA-sensors, and enzyme biosensors, Electroanalysis, 2003, 15(11), 913–947 CrossRef CAS.
- G. Rajeshkhanna, E. Umeshbabu and G. R. Rao, In situ grown nano-architectures of Co3O4 on Ni-foam for charge storage application, J. Chem. Sci., 2017, 129, 157–166 CrossRef CAS.
- S. K. Balasingam, A. Thirumurugan, J. S. Lee and Y. Jun, Amorphous MoS x thin-film-coated carbon fiber paper as a 3D electrode for long cycle life symmetric supercapacitors, Nanoscale, 2016, 8(23), 11787–11791 RSC.
Footnote |
| † Electronic supplementary information (ESI) available. See DOI: https://doi.org/10.1039/d4na00085d |
| This journal is © The Royal Society of Chemistry 2024 |


