 Open Access Article
Adjusting the charging behavior of TiO2 with basic surfactants in an apolar medium for electrophoretic displays†
Yanfang
Yu
ab,
Hongli
Liu
 ab,
Yinzhao
Zhen
 ab,
Ye
Liu
ab,
Bonan
Gao
ab,
Xianggao
Li
ab,
Ye
Liu
ab,
Bonan
Gao
ab,
Xianggao
Li
 ab and
Shirong
Wang
 *ab
*ab
aSchool of Chemical Engineering and Technology, Tianjin University, Tianjin, 300072, China. E-mail: wangshirong@tju.edu.cn
bCollaborative Innovation Center of Chemical Science and Engineering, Tianjin, 300072, China
First published on 14th May 2024
Abstract
Electrophoretic displays (EPDs) are attracting attention as potential candidates for information display due to their eye-friendly nature, environmental friendliness and bistability. However, their response speed, which is closely related to the charging behavior of electrophoretic particles, is still inadequate for practical applications. Herein, five basic surfactants were employed to adjust the particle charge of titanium dioxide (TiO2) in the apolar medium Isopar L. Particle charge is strongly related to the effective surfactant coverage on surface sites, dominated by the interaction between anchoring groups and solvation chains. As a result, the electrophoretic mobility of TiO2 could be tuned between −8.09 × 10⁻¹⁰ and +2.26 × 10⁻¹⁰ m2 V−1 s−1. Due to the increased particle charge, TiO2 particles could be well dispersed in Isopar L with the assistance of S17000, T151 and T154. A black-white dual particle electrophoretic system with 2.0% (w/v) S17000 was constructed to obtain EPD devices. The EPD device gained a maximum white-and-black-state reflectivity of 41.79%/0.56% and a peak contrast ratio of 74.15. Its response time could be reduced to as low as 166.7 ms, which outperforms the majority of other black-white EPD devices.
Introduction
Owing to their high refractive index and reflectivity,1,2 desirable stability3 and eco-friendly characteristics,3 titanium dioxide (TiO2) particles are among the most universally utilized inorganic particles in various fields, including humidity sensor devices,4 printing inks,5,6 coatings7,8 and electrophoretic displays (EPDs).9,10 With respect to other inorganic white pigments, zinc oxide (ZnO) is sensitive to ambient light, humidity and chemicals and its refractive index is relatively low. Barium sulfate (BaSO4) with its relatively high density is difficult to disperse. Therefore, TiO2 is one of the most optimal white particles. In addition, TiO2 needs to be appropriately charged in apolar media in many applications, especially EPDs. EPD technology, which is widely used in e-readers, bus stop boards and so on, uses an applied electric field to control the trajectory of charged particles in an apolar medium to display images.11 In contrast to luminescence displays, this reflective display technology can be realized without an external electric field, which is defined as bistability. In addition, other important parameters of EPD, including the response speed, reflectance and contrast ratio, are all closely related to the particle charge. So, in order to improve the display effect of EPD, it is necessary to adjust the particle surface charge.Unfortunately, there is still a lack of a clear theoretical explanation for the charge-generation-and-retention mechanism in apolar media.12 The main reason is there is a larger Bjerrum length (λB) in apolar media compared with that in polar media.12–14λB refers to the distance between particles when the electrostatic interaction energy and thermal energy are balanced, i.e., the minimum distance at which particles can be independent and its expression is as follows:
 | (1) |
To address this issue, amphiphilic surfactants are often used as charge control agents to afford nanoparticles with an enhanced particle charge in apolar solvent.20,21 Such surfactants contain anchoring groups and solvation chains. Anchoring groups can firmly adsorb themselves to particles and increase the local εr of solvents. Therefore, they can induce particles to be highly charged,22 enhance electrostatic shielding between particles23,24 and shorten λB.25 Additionally, solvation chains can provide steric hindrance and improve the dispersion stability of particles,26 which can produce a charged system akin to an aqueous system.27 Several researchers have focused on this area. Ponto et al.28 used Span 80 and OLOA 11000 to control the charge of TiO2, and the electrophoretic mobility could be tuned in the range of −2 × 10⁻¹⁰ to 0.5 × 10⁻¹⁰ m2 V−1 s−1 in Isopar L. Yin et al.29 treated TiO2 with Span 85, and the electrophoretic mobility was −4.00 × 10⁻¹⁰ m2 V−1 s−1 in C2HCl3, and the response time of the EPD device was 3000 ms. Noël et al.30 modified TiO2 with Span 80, the electrophoretic mobility of which could reach +3.5 × 10⁻¹⁰ m2 V−1 s−1 in Isopar G, and the response time of resultant EPD device was 500 ms. Lee et al.21 treated TiO2 with OLOA 1200, and the electrophoretic mobility could reach −5.24 × 10⁻¹⁰ m2 V−1 s−1 in C2Cl4, and the response time of the EPD device could reach 240 ms. Although previous research has been able to reduce the response time to some extent by improving the particle charge, there is still room to further advance the response speed for EPD applications.
In this work, a highly charged and stable dispersion system of TiO2 in an apolar medium (Isopar L) was established with the assistance of five basic surfactants possessing different polar groups and solvation chains. Surfactants can not only be adsorbed on the surface of particles to adjust the charge but also form reverse micelles (RMs) in apolar media. The charging behavior of TiO2 was studied systematically, and the dispersion stability was also evaluated. Based on the acid–base charging mechanism and adsorption–desorption of RMs, the electrophoretic mobility of TiO2 in isododecane/Isopar L could be adjusted within the range of −8.09 × 10⁻¹⁰ and +2.26 × 10⁻¹⁰ m2 V−1 s−1. The dispersions were also highly stable with almost constant transmitting and backscattering data. As a result, the TiO2 dispersion was applied to the EPD preparation to evaluate its optical and electrical properties. The target EPD device was able to obtain a maximum white-and-black-state reflectivity of 41.79%/0.56% and an optimal contrast ratio of 74.15. Particularly, its response time was significantly reduced to 166.7 ms, which is at the forefront of the currently reported EPD devices.
Experimental section
Material
Isopar L was obtained from Shanghai Huishuo Chemical Co. Ltd (China), and the purity was 99.9%. TiO2 was purchased from Shanghai Kemu Chemical Co. Ltd (China). Manganese ferrite (FeMn) black particles were obtained from Hunan Kelai New Materials Co. Ltd. High molecular weight polyisobutylene succinimide (T161), polyisobutene succinimide (T151) and polyisobutylene-bis-succinimide (T154) were all supplied by Jinzhou Petrochemical Co. Ltd (China), and the purity was 99%. Solsperse 17![[thin space (1/6-em)]](https://www.rsc.org/images/entities/char_2009.gif) 000 and Solsperse 24
000 and Solsperse 24![[thin space (1/6-em)]](https://www.rsc.org/images/entities/char_2009.gif) 000 were from Lubrizol Specialty Chemical Manufacturing Co. Ltd (Germany), and the purity was 99%. All the chemicals were used without further purification.
000 were from Lubrizol Specialty Chemical Manufacturing Co. Ltd (Germany), and the purity was 99%. All the chemicals were used without further purification.
Preparation of the EPD medium and EPD device
EPD medium: 16 wt% TiO2 was dispersed in Isopar L with different concentrations (1.0 wt%, 1.5 wt%, 2.0 wt%, 2.5 wt%, 3.0 wt%, 4.0 wt% and 5.0 wt%) of surfactants by milling for 3 hours to obtain white ink. Similarly, 11 wt% FeMn black particles were dispersed similarly to obtain black ink.EPD device: the EPD device was made of two pieces of transparent ITO glass and a 50 μm thick polyurethane film with a 20 mm2 cavity. The cavity is the display area. Black-and-white electric ink and additional additives were evenly dispersed by ultrasound and added into the cavity of the EPD device. Driven by an electric field of 0.3 V μm−1, the reflectivity of the EPD device was measured by a spectrophotometer, and the response time of EPD device was measured by an electronic ink tester.
Characterization method
The critical micelle concentration (CMC) of surfactants was determined by measuring the surface tension at different concentrations with an optical contact angle meter & interface tensiometer (SL 250, Kino Scientific Instruments Inc., U.S.). The electrophoretic mobility of nanoparticles was measured by a microelectrophoresis apparatus (JS94J, Shanghai Zhongchen Digital Technology Co. Ltd, China). The intensity of transmitting (T) and backscattering (BS) light of a near-infrared light source (880 nm) was recorded by using a universal stability analyzer (Turbiscan Tower, FormuLaction Co. Ltd, France) to measure the dispersion stability of different EPD dispersions and the turbiscan stability index (TSI), which is a parameter for systematic evaluation of dispersion stability, was fitted comprehensively by T and BS light. A high-performance specific surface area and micropore analyzer (BSD-600M, Beishide Instrument Technology Co. Ltd, China) was used to test the particle specific surface area. The transient current of the electrophoretic dispersions was recorded by a source meter instrument (Keithley 2400, Tektronix Co. Ltd, China) under an external electric field of 0.3 V μm−1.Results and discussion
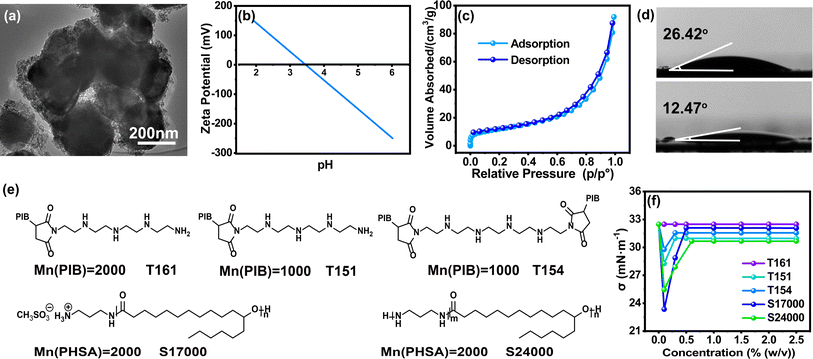
In this study, the applied TiO2 is commercially available with a particle size range of 200–400 nm (Fig. 1(a) and S1†), which belongs to the half-wavelength region of visible light for EPD applications. Fig. 1(b) revealed that the point of zero charge (PZC) for the TiO2 particles determined in water was about 3.75. In addition, its water/oil contact angle was evaluated to be 12.47°/26.42° (Fig. 1(d)), respectively, which is indicative of amphiphilic properties. The specific surface area of the TiO2 particles was measured to be 42.83 m2 g−1. Hence, this high surface area together with the many hydroxyl groups on the TiO2 surface permits sufficient absorption of surfactants.Here, five basic surfactants, namely T161, T151, T154, S17000 and S24000 (Fig. 1(e)), were employed to adjust the charging behavior of the TiO2 particles. The anchoring groups of all these surfactants contained similar amino groups with different numbers and valence states, and their solvation groups were equal or multiple in length, making them valuable for discussion. Owing to their different chemical structures and properties, a comprehensive understanding of the influence of alkaline surfactants on TiO2 could be obtained, especially the electrical performance. To obtain the critical micelle concentration (CMC), surface tension characterization was carried out. Fig. 1(f) illustrates that the surface tension of the surfactants in Isopar L changes with their concentration. Notably, the surface tension of T161 remained constant over the whole test range. Conversely, the surface tension became stable at 0.3% (w/v), 0.3% (w/v), 0.5% (w/v) and 0.6% (w/v) for T151, T154, S17000 and S24000, respectively. It can be inferred that all the surfactants possess CMCs except T161. Hence, RMs can be formed in Isopar L for T151, T154, S17000 and S24000, which can also be proved by the Tyndall effect in Fig. S2.†
Characterization of TiO2 after modification with surfactants
Fig. 2(a) displayed the XRD pattern of TiO2 before and after treatment with surfactants. In all the lines, the diffraction peaks at 2θ = 27.48°, 36.13°, 39.24°, 41.30°, 44.10°, 54.37° and 56.69° match with the (110), (101), (200), (111), (210), (211) and (220) lattice planes of rutile TiO2 nanoparticles, respectively. Hence, the modification of TiO2 did not change the crystal form of TiO2. In addition, the crystal structure of rutile TiO2 has tetragonal and lattice parameters a = b = 4.584 Å and c = 2.953 Å and it belongs to the space group D4h14 = P42/mnm and has four Raman active vibration modes (A1g + B1g + B2g + Eg). As shown in Fig. 2(b), the Raman spectra of TiO2 had active modes at 166 cm−1 (B1g), 243 cm−1 (multiphonon resonance scattering), 447 cm−1 (Eg) and 609 cm−1 (A1g), all of which corresponded to the rutile crystal structure of TiO2. Fig. S1† showed the TEM image of raw and treated TiO2. There were no obvious differences between their coating thickness. This was mainly owing to the monomolecular adsorption layer of surfactants on the particles, which was too thin to be observed.As shown in Fig. 2(c)–(g), the oil/water contact angles of TiO2 modified with T161, T151, T154, S17000 and S24000 were 17.32°/65.45°, 12.26°/83.42°, 12.79°/86.91°, 8.22°/85.35°, 9.25°/89.61°, respectively. Therefore, the surface of TiO2 changed from amphiphilic into hydrophobic and oleophilic, which was mainly caused by the alkane chains on surfactants. Specifically speaking, the surface of raw TiO2 was mainly covered by hydroxyl groups, which could show great affinity for water and oil. After being covered by surfactants, groups covered on the surface of TiO2 changed into long alkyl chains and showed hydrophobicity and lipophilicity.
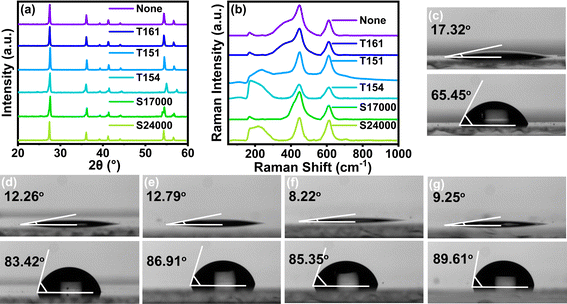 | ||
| Fig. 2 (a) XRD pattern and (b) Raman spectra of TiO2. Contact angle diagram of TiO2 modified with (c) T161, (d) T151, (e) T154, (f) S17000 and (g) S24000. | ||
Influence of surfactants on the charging behavior of TiO2
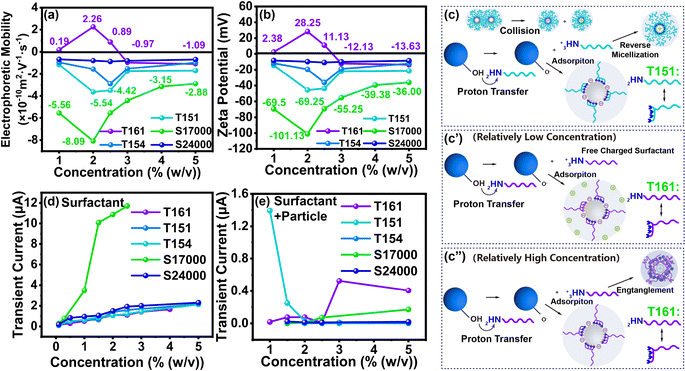
As revealed in Fig. 3(a), TiO2 treated with T151, T154, S17000 and S24000 exhibited a negative charge. This can be explained by the mechanism of the acid–base interaction between the surfactant and particle surface, in which the sign of the particle charge depends on the relative acidity of the particle to the surfactant. TiO2 possesses an acidic hydroxyl surface and the anchoring groups of the surfactants all contain basic amino groups. Thus, the particle surface groups and anchoring groups can be regarded as proton donors and acceptors, respectively (see in Fig. 2(c)).Taking TiO2 treated with T151 as an example, the surface of TiO2 is partially coated with adsorbed surfactants. Most of the remaining surfactants tend to form RMs surrounding TiO2. Subsequently, acid–base charge transfer occurs between –OH on the particle surface and the –NH2 of surfactants. This charge transfer leads to the formation of –NH3+, which prefers to enter the polar cores of the RMs. Consequently, a small number of surfactants detach from the TiO2 surface, achieving ion pair separation and leaving the surface of the TiO2 negatively charged with –O−.
The magnitude of electrophoretic mobility (η) of the TiO2 particles with the four surfactants was evaluated and their zeta potential (ζ) was calculated using eqn (2):31,32
 | (2) |
As presented in Fig. 3(a) and (b), the correlation between the particle electrical properties and surfactant concentration was similar, i.e., the electrophoretic mobility and zeta potential of TiO2 all first climbed to a peak and later dropped. As the concentration of T151, T154, S24000 and S17000 were lower than 2.00% (w/v), 2.50% (w/v), 2.00% (w/v) and 2.50% (w/v), respectively, the particle charge increased with the surfactant. Within this concentration range, the surfactant left in the medium reached the CMC and partly formed charged RMs by collisions based on the reverse micelle disproportionation theory.14 Specifically, neutral micelles exchange charge upon colliding and transform into oppositely charged micelles. To confirm this, the charging properties of these four surfactants in Isopar L were characterized by an applied 0.3 V μm−1 electric field. As plotted in Fig. S3(b)–(e),† the current induced by the surfactants all underwent a sharp increase initially and later decreased to a plateau. Fig. 3(d) reveals that the peak current of surfactant dispersions under 0.3 V μm−1 increased with surfactant concentration. Different from other surfactants, the peak current of S17000 increased dramatically. As the only ionic surfactant among these surfactants, this increase was mainly due to the relatively high ionization of its anchoring groups compared to other surfactants. Therefore, a greater number of ion pairs were produced in the medium, which led to a higher peak current. On the contrary, the plateau current of particle dispersions decreased with higher surfactant concentrations (in Fig. 3(e)), which indicates that an increasing number of charges were bound to the particle surfaces instead of being free in media leading to a higher particle charge. Hence, with the increase of S24000, T154, T151 and S17000, the particle charge can reach −10.88 mV, −36.13 mV, −45.50 mV and −101.13 mV, respectively.
However, when the additive concentrations of T151, T154, S24000 and S17000 were higher than 2.00% (w/v), 2.50% (w/v), 2.00% (w/v) and 2.50% (w/v), respectively, the particle charge of TiO2 dropped slightly. As shown in Fig. 3(d), (e) and S3,† the peak curve of surfactant dispersions and plateau current of particle dispersion with different concentrations increased, which indicates the increasing number of free ions in the solvents. This may be ascribed to the reason that the number of RMs on the particle surface reached saturation, and then, the particles would be shielded by charged RMs, leading to a decreased particle charge.
Among these four dispersants, TiO2 treated with S17000 attained the highest electrophoretic mobility and zeta potential of −8.09 × 10⁻¹⁰ m2 V−1 s−1 and −101.13 mV, respectively. Different from the other three nonionic surfactants with multi-anchoring groups, S17000 is an ionic surfactant with mono-anchoring groups composed of a methyl sulfate-quaternary ammonium salt. As displayed in Fig. S3(d),† the plateau current of particle-free S17000 dispersion differed a lot with varied concentrations, which indicates that more charged RMs could be formed by S17000 to provide the opportunity for TiO2 to obtain the charges. In addition, the plateau current of the particle-containing S17000 dispersion was nearly the same (Fig. S3(i)†). This means more charges preferred to exist on the TiO2 surface and most of the rest of the charge in the core of RMs could be shielded by the insulated alkyl chains. Consequently, TiO2 treated by S17000 could be highly charged.
Notably, the particle charge of TiO2 showed a tendency to change from positive to negative after being modified with T161, which is partially contrary to the relative acid–base theory. When the concentration of T161 was lower than 2.00% (w/v) (in Fig. 3(c′)), the particle charge increased with the surfactant and climbed to a positive peak. As shown in Fig. 3(e), the plateau current of particle dispersion showed an abnormally slightly increasing trend with the T161 concentration increasing to 2% (w/v). This indicates the increasing number of free ions in the media. The surface tension characterization in Fig. 1(f) announces that T161 has difficulties forming RMs. Hence, when the concentration of T161 was lower than 2.00% (w/v) (in Fig. 3(c′)), RMs could not be formed by T161, leading to the exposure of its polar group, and a highly polar atmosphere could be created. TiO2 itself carries negative charges and can closely attract positive charges in the medium through static electricity, which results in a positive charge in the diffusion layer of TiO2. In addition, with the increase of T161 concentration, more positive charges could be attracted by TiO2 leading to a positive peak charge of +2.26 × 10⁻¹⁰ m2 V−1 s−1 at 2.00% (w/v). When the concentration of T161 was higher than 2.00% (w/v) (in Fig. 3(c′′)), the charge of TiO2 changed from positive to negative. This was mainly caused by T161 entangling with charges through a long solvation chain, which could generate reverse-micelle-like structures. In this situation, the increasing number of free ions was shielded by T161 and could not attach to TiO2. Therefore, TiO2 could gradually expose its own electrical properties. This could be further proved by the decrease in the plateau current of the particle-containing dispersion (in Fig. 3(e)), which was caused by the decreasing number of positive free ions with the increase of the entanglement layer by T161.
Influence of surfactants on the dispersion stability of TiO2 in the medium
It can be seen from Fig. S4(a)–(e)† that the addition of surfactants favors the stability of every dispersion system. TSI is the fitting of backscattering and transmitting light data. The higher the TSI, the worse the sample stability. For the same surfactant, TSI was higher at low surfactant concentration than at high concentration. One main reason is that λB of the medium can be reduced by the surfactant and εr of the solvent around particles can also be locally increased. This was beneficial to the generation of particle charge and contributed to the dispersion stability of TiO2 by electrostatic repulsion. The other reason is the surfactants' long solvation chains, which could provide steric hindrance to stabilize the particles. However, when the concentrations of T161, T151, T154, S17000 and S24000 were higher than 2.5% (w/v), 2.5% (w/v), 3% (w/v), 2.5% (w/v) and 2% (w/v), respectively, TSI did not decrease, but slightly increased with the increase of surfactant, which was consistent with the slight decrease of the zeta potential after reaching the peak value in the same situation. In this situation, the positive effect of steric hindrance on dispersion stability is less than the negative effect of electrostatic repulsion reduction caused by electrostatic shielding, and thus the particle stability decreased.To compare the ability of surfactants to stabilize particles, the best dispersion stability brought by five surfactants was compared (see in Fig. 4 and S5†). The stability of TiO2 dispersion treated with the surfactants was ordered as S24000 < T161 < T154 < T151 < S17000. This order was completely consistent with the maximum particle zeta potential induced by each surfactant, indicating that zeta potential is one of the most critical factors in determining the particle stability in this system.
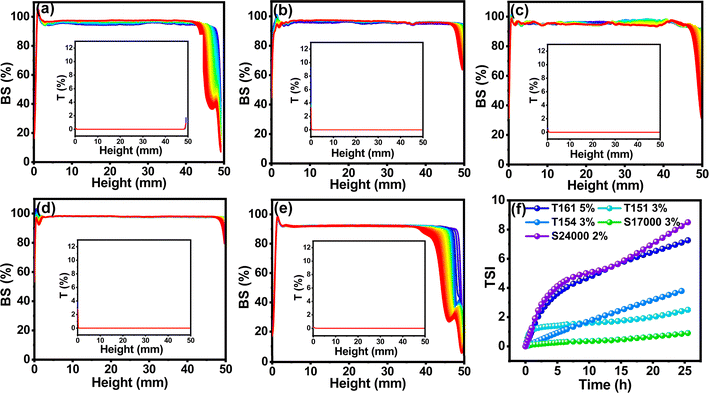 | ||
| Fig. 4 Values of the BS and T light of TiO2 modified with (a) T161, (b) T151, (c) T154, (d) S17000 and (e) S24000. (f) Change of TSI with the highest zeta potential. | ||
Influence of surfactant structure on the electrophoretic mobility and dispersion stability of TiO2 in the medium
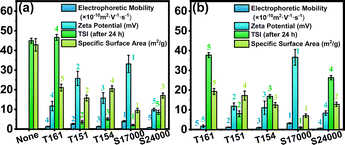
As mentioned previously, the zeta potential holds a crucial position in determining the stability of particles in this system. Therefore, the influence of surfactant structure on the zeta potential of TiO2 is discussed comprehensively in the following part to clarify the impact of surfactant structure on the particle stability.It can be seen from Fig. 5(a) that the specific surface area of the particles was in a decreasing order after modification with the same concentration of T161, T154, S24000, T151 and S17000, i.e., the adsorption amount of surfactants increased in turn. The absolute value of electrophoretic mobility, dispersion stability and zeta potential diagram at this concentration are diagramed in Fig. 5(a). The solvation chains' molecular weights of T161, T154, S17000 and S24000 are all 2000 Da. The same concentration of surfactants in the media means that the solvation chain concentrations of surfactants in the dispersion are the same, and the difference in the induced particle zeta potential is mainly determined by the anchoring groups.
While the anchoring group of surfactant interacts with the surface group of particles, the solvation chain will extend to form a solvation layer. Because of the high compatibility between the solvation chain and solvent, this solvation layer will weaken the force between the surfactant molecules and particles, causing the desorption of surfactant. Providing that the weakening effect of solvation chain on a single anchoring group is simplified as the average distribution of the polymerization degree to every group, the theoretical zeta potential order should be S17000 > T161 ≈ T154 > S24000. The actual one was exactly consistent with this order (see in Fig. 3(b)). Specifically speaking, the particle surface can have the closest electrostatic interaction with S17000 owing to its ionic anchoring group and the single-point group. This has little influence on the average solvation chain weakening, and therefore, the particle zeta potential ranked the highest after modification with S17000. In addition, S24000 with a multi-point active group benefits from the high coverage data of the specific surface area (see in Fig. 5(a)) and has the poorest average weakening effect of the solvation chain. However, compared with the solvation chain, there are too many anchoring groups on S24000. Hence, though the coverage ratio of particle surface sites by S24000 is high, the actual solvation effect still remains low, which leads to the low effective coverage of particle surface sites. Therefore, the expected high particle charge cannot be induced by S24000. Additionally, since T161 and T154 have similar average weakening effects of solvation chains and four-point active groups, they possess a comparable ability to induce particle zeta potential and stabilize the particles (in Fig. S6†).
When the amino concentration of surfactants in the dispersion is the same, the concentration of anchoring groups in the dispersion is similar, and the difference in induced particle zeta potential is mainly caused by the solvation chain. T151, T161 and T154 belong to the T series and S17000 and S24000 belong to the S series. The solvation chains of the T series and S series surfactants are alkane polyisobutylene and ester polydihydroxystearic acid, respectively, both of which are highly lipophilic segments. Therefore, similar solvent compatibility could be brought about by them, so all surfactants can be discussed in the same category. As far as the solvation chain length is concerned, the chain lengths of T161, S17000 and S24000 are around 50, 70 and 70 Å, respectively. The chain length of T151 is about 25 Å, and T154 has bimolecular chains with a chain length of 25 Å. For a single surfactant, when the total concentration of anchoring groups in the dispersion was the same, the increasing number of anchoring groups on a single surfactant would lead to smaller particle zeta potential (in Fig. 5(b)), which was caused by the lower average solvent compatibility provided by solvation chains. Specifically speaking, the specific surface area of S24000 was relatively low among five surfactants, while its zeta potential was also low, which was caused by the multiple anchoring groups and short effective solvation chain. In contrast, S17000 had the lowest specific surface area and highest zeta potential among them. This could be attributed to its single point anchoring group, which could possess the longest effective solvation chain in this situation. For T161 and T154, two surfactants have the same MWs of the average total solvation chain for a single anchoring group, but the number of their solvation chains was different. Specifically, a higher steric hindrance could be brought about by the double-segment molecular chains on T154, which is the reason for the slightly higher zeta potential of the corresponding TiO2 compared to T161 (in Fig. S7†).
In brief, the zeta potential of the particles is closely related to the effective surfactant coverage of their surface sites. The coverage rate of the surfactant on the particle surface is the result of the joint action of the surfactant anchoring group and solvation chain, which represents its adsorption ability and also determines its ability to induce particles to be charged and dispersed stably.
Application in EPD
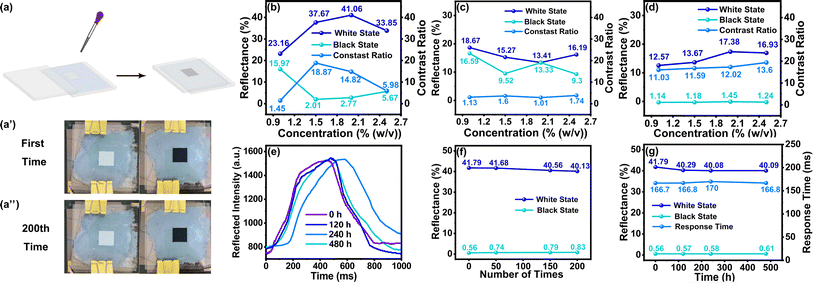
Based on the optimal particle charge and dispersion stability achieved among five surfactants, S17000, T151 and T154 emerged as the top three and were subsequently used to fabricate EPD devices. EPD devices with 20 mm2 display areas (see in Fig. 6(a)) were prepared using TiO2 dispersion treated with the three surfactants, respectively. The black particles, FeMn, were also treated with these three surfactants. As depicted in Fig. 6(b)–(d), the EPD device with 2% (w/v) S17000 driven by an electric field of 0.3 V μm−1 achieved white-state and black-state reflectivity of 41.79% and 0.56%, respectively. However, the EPD devices with the other two surfactants did not exhibit ideal performances, owing to the fact that they induced similar white and black-particle negative charges. Hence, other characterizations were only carried out on the EPD device with 2% (w/v) S17000. Remarkably, the response time, defined as the switching time between 90% black-and-white state, reached 166.7 ms (in Fig. 6(e)). Table S1† summarizes the two-particle EPDs and their corresponding response speeds reported at present. The response speed achieved in this work is state-of-the-art, showing superiority to most other EPD devices. After being driven 200 times, the EPD was still able to retain excellent display performance without obvious particle agglomeration (Fig. 6(a′) and (a′′)), exhibiting constant reflectivity (in Fig. 6(f)). In addition, the stability of the electrophoretic dispersion was explored by subjecting them to ultrasound treatment and further driving them with the same waveform repeatedly for 20 days. Fig. 6(g) reveals that there was no obvious attenuation in display quality, indicating that the particle dispersion system was stable and could meet the requirements of long-term storage of the EPD device.Conclusions
Herein, a highly charged and stable TiO2 dispersion system in the apolar medium of Isopar L was obtained with the assistance of five basic surfactants. Surfactants possessing different polar groups and solvation chains can not only be adsorbed on the surface of the TiO2 particles but also form RMs in apolar media. Based on the acid–base charging mechanism, the electrophoretic mobility of TiO2 in Isopar L could be adjusted within the range of −8.09 × 10⁻¹⁰ to +2.26 × 10⁻¹⁰ m2 V−1 s−1. Typically, the ionic surfactant S17000 which could form more charged RMs enabled TiO2 particles to gain the highest particle charge of −8.09 × 10⁻¹⁰ m2 V−1 s−1. Moreover, the dispersions were highly stable with almost constant transmitting and backscattering data. The target EPD device achieved a maximal white-and-black-state reflectivity of 41.79%/0.56% and peak contrast ratio of 74.15. In particular, its response time was remarkably reduced to 166.7 ms, making it superior to other black-white EPD devices.Conflicts of interest
There are no conflicts to declare.Acknowledgements
This work was supported by the National Key Research and Development Program of China (2022YFB3603701).References
- Y. Liang, B. Qiao, T.-J. Wang, H. Gao and K. Yu, Appl. Surf. Sci., 2016, 387, 581–587 CrossRef CAS.
- N. S. Allen, R. McIntyre, J. M. Kerrod, C. Hill and M. Edge, J. Polym. Environ., 2018, 26, 4243–4257 CrossRef CAS.
- M. Zeljko, V. O. Bulatović, R. Blažic and S. L. Blagojević, J. Appl. Polym. Sci., 2022, 139, e52393 CrossRef CAS.
- P. V. Shinde, S. Gagare, C. S. Rout and D. J. Late, RSC Adv., 2020, 10, 29378–29384 RSC.
- O. J. Danella, R. C. Santana, S. Manrich and S. Manrich, J. Appl. Polym. Sci., 2003, 88, 2346–2355 CrossRef CAS.
- M. Prasad, F. Strubbe, F. Beunis and K. Neyts, Langmuir, 2016, 32, 5796–5801 CrossRef CAS PubMed.
- J. Jacob, S. Grelier, M. Grau and B. Chorein, Coatings, 2022, 12, 1722 CrossRef CAS.
- M. Sinhababu, A. Roy, N. Kumar, M. Dutta, S. Sundaram, S. Karazhanov and G. Udayabhanu, Nanomaterials, 2021, 11, 2299 CrossRef CAS PubMed.
- Z. Zhang, Y. Wang, Q. Chen, Q. Gao, L. Liu, J. Yang, X. Pan, Y. Miao and F. Chi, Micromachines, 2022, 13, 1235 CrossRef PubMed.
- S. Lee, J. Lee and J. T. Ault, Colloids Surf., A, 2023, 659, 130775 CrossRef CAS.
- Q. Fu, W. Yu, G. Bao and J. Ge, Nat. Commun., 2022, 13, 7007 CrossRef CAS PubMed.
- G. N. Smith, Phys. Chem. Chem. Phys., 2018, 20, 18919–18923 RSC.
- F. Strubbe and K. Neyts, J. Phys.: Condens. Matter, 2017, 29, 453003 CrossRef PubMed.
- M. Khademi, S. S. Y. Cheng and D. P. J. Barz, Langmuir, 2020, 36, 5156–5164 CrossRef CAS PubMed.
- M. Ma, J. Li, Z. Zhang, D. Ning, Z. Liu, W. Li, G. Zhong, X. Yang, D. Lam and Z. Xing, Appl. Surf. Sci., 2023, 609, 155241 CrossRef CAS.
- H. Liu, S. Wang, Z. Sun, Y. Xiao and X. Li, J. Mater. Chem. C, 2016, 4, 323–330 RSC.
- G. N. Smith, S. Ahualli, Á. V. Delgado, D. A. J. Gillespie, R. Kemp, J. Peach, J. C. Pegg, S. E. Rogers, O. Shebanova, N. Smith and J. Eastoe, Langmuir, 2017, 33, 13543–13553 CrossRef CAS PubMed.
- G. S. Roberts, R. Sanchez, R. Kemp, T. Wood and P. Bartlett, Langmuir, 2008, 24, 6530–6541 CrossRef CAS PubMed.
- P. Popovetskiy, A. Kasyanov, E. Maximovskiy and P. Plyusnin, J. Mol. Liq., 2023, 374, 121273 CrossRef CAS.
- X. Ma, M. Li, X. Xu and C. Sun, Appl. Surf. Sci., 2023, 608, 155232 CrossRef CAS.
- K. U. Lee, M. J. Kim, K. J. Park, M. Kim and J. J. Kim, Dyes Pigm., 2015, 121, 276–281 CrossRef CAS.
- M. Gacek, D. Bergsman, E. Michor and J. C. Berg, Langmuir, 2012, 28, 11633–11638 CrossRef CAS PubMed.
- H. Liu, S. Wang, Y. Xiao, Q. Yang and X. Li, J. Mater. Chem. C, 2015, 3, 3980–3988 RSC.
- G. Kokot, M. I. Bespalova and M. Krishnan, J. Chem. Phys., 2016, 145, 194701 CrossRef CAS PubMed.
- M. E. Parent, J. Yang, Y. Jeon, M. F. Toney, Z.-L. Zhou and D. Henze, Langmuir, 2011, 27, 11845–11851 CrossRef CAS PubMed.
- S. K. Sainis, J. W. Merrill and E. R. Dufresne, Langmuir, 2008, 24, 13334–13337 CrossRef CAS PubMed.
- I. D. Morrison, Colloids Surf., A, 1993, 71, 1–37 CrossRef CAS.
- B. S. Ponto and J. C. Berg, Colloids Surf., A, 2020, 586, 124275 CrossRef CAS.
- P. Yin, G. Wu, W. Qin, X. Chen, M. Wang and H. Chen, J. Mater. Chem. C, 2013, 1, 843–849 RSC.
- A. Noël, D. Mirbel, A. Charbonnier, E. Cloutet, G. Hadziioannou and C. Brochon, J. Polym. Sci., Part A: Polym. Chem., 2017, 55, 338–348 CrossRef.
- M. M. Gacek and J. C. Berg, Adv. Colloid Interface Sci., 2015, 220, 108–123 CrossRef CAS PubMed.
- Z. Chen, Y. Lu, M. Nazemi Ashani, R. Manica, L. Feng and Q. Liu, J. Phys. Chem. C, 2021, 125, 19525–19536 CrossRef CAS.
Footnote |
| † Electronic supplementary information (ESI) available. See DOI: https://doi.org/10.1039/d4na00301b |
| This journal is © The Royal Society of Chemistry 2024 |

