 Open Access Article
Effect of precipitant on pro-oxidative and antibacterial properties of CeO2 nanoparticles – an experimental study†
Shilpa
Maddheshiya
 ,
Priyanka
Rajwani
and
Seema
Nara
 *
*
Department of Biotechnology, Motilal Nehru National Institute of Technology, Allahabad 211004, UP, India. E-mail: seemanara@mnnit.ac.in; seemanara@gmail.com; Tel: +91-532-2271238
First published on 29th July 2024
Abstract
In this study, the synthesis of pro-oxidative cerium-oxide nanozymes (CeO2 NZs) is reliably performed via the co-precipitation method using ceric ammonium nitrate as a precursor and ammonium carbonate as a precipitating agent. Different samples of CeO2 NZs were prepared by varying the amount of the precipitant. The synthesized NZs were characterized by ultraviolet-visible (UV-vis) spectroscopy, particle size analysis, X-ray diffraction (XRD), X-ray photoelectron spectroscopy (XPS), and high-resolution transmission electron microscopy (HRTEM) and then checked for their pro-oxidative (peroxidase and oxidase) activity. Furthermore, we studied the NZ kinetics and antibacterial properties of synthesized samples.
1. Introduction
Bacterial infections claim millions of lives annually and are a growing concern worldwide, more so due to increasing antibiotic resistance.1,2 Alternative materials are being explored as inexpensive, safe, and effective antimicrobials.3 Nanotechnologies have sparked enormous interest in synthesizing efficient nanomaterials to combat bacterial infections.4 Metallic nanoparticles such as Ag NPs have shown promise for antimicrobial potential; nevertheless, their action and usefulness are limited due to NP aggregation and ensuing toxicity from Ag+ release.5,6 Such issues have been addressed by utilizing the intrinsic catalytic properties of nanomaterials, which led to the generation of reactive oxygen species (ROS) and mediated bacterial killing. In this context, it has been reported that inorganic, metallic, metal oxide, and composite nanoparticles have enzyme mimetic properties, particularly peroxidase, oxidase, etc., and can generate reactive oxygen species such as ˙OH, 1O2, and H2O2.7 The term “pro-oxidative” activity refers to the inherent enzymatic ability of such materials to produce ROS.8 These pro-oxidative NZs are proven to be robust and more stable than natural enzymes. They could have equivalent catalytic efficiency, as ROS can inactivate bacteria by irreversibly damaging proteins, DNA, and polysaccharides.8 Hence, the ROS-generating efficiency and the bactericidal effects of NZs have caught the attention of scientists globally; however, they are still in their infancy.Because cerium oxide nanoparticles (NPs) may flip between the reversible oxidation states Ce(III) and Ce(IV), they function as superior NZs.9 Their improved catalytic action results from the oxygen vacancies that are created in their structure during the auto-generative conversion between the two redox states. CeO2 NPs exhibit multi-enzymatic properties, and their ROS scavenging (SOD and catalase) or ROS generating ability (peroxidase mimic) is regulated using the ratio of Ce(III)/Ce(IV).10,11 Their size, morphology, surface charge, and external factors, such as pH, media, etc. affect their anti-oxidative and peroxidative behaviour. Consequently, it becomes crucial to carefully engineer cerium oxide nanostructures to exhibit strong pro-oxidative and antibacterial activities.12 The critical factors influencing the physicochemical characteristics of CeO2 NPs, which have an immediate impact on their pro-oxidative activity, include the synthesis method, the choice and concentration of the precipitant and precursor, and the effect of pH and temperature during synthesis. For instance, Fudala et al. 2021 used differing concentrations (0.2, 0.5, and 1 M) of the precursor to synthesize CeO2 NPs through the sol–gel process. It was determined that increasing the precursor concentration raised the concentration of cerium ions and nucleation sites but decreased the size of the CeO2 NPs. More nucleation sites created smaller sized nanoparticles.13 Another study showed that controlling the pH of the solution during synthesis can affect the surface charge and agglomeration behaviour of the nanoparticles, which in turn can affect how cerium oxide NPs form, develop, and remain stable throughout the synthesis process. Ramachandran et al. 2019 synthesized different cerium oxide NPs by varying the pH of the solution (9, 10, 11, and 12). It was observed that a decrease in crystallite size occurred with an increase in pH which could be attributed to the involvement of OH− in the aggregation that impacts the degree of supersaturation of the initial precipitate. Consequently, during the synthesis, particle size decreased with increasing pH.14 Despite the growing demand for fine-tuning the properties of CeO2 NZs, studies on the relationship between the concentration of the precipitating agent used in the synthesis process and the physicochemical properties of CeO2 NZs, and consequently its ROS-mediated anti-bacterial properties, are still lacking but highly desirable. Therefore, the goal of the present work is to gain important insights into the optimization of precipitants during CeO2 NZ synthesis for improved pro-oxidative and antibacterial activities through methodical experimentation and analysis.
2. Experimental section
2.1. Chemicals and reagents
Cerium ammonium nitrate, ammonium carbonate and 9,10-anthracenediyl-bis(methylene)dimalonic (ABDA) acid were purchased from Sigma-Aldrich, India. 3,3′,5,5′-Tetramethylbenzidine (TMB), O-phenylenediamine (OPD) and terephthalic acid (TA; C8H6O4 purity 98%) were purchased from Sisco Research Laboratory (SRL). Hydrogen peroxide (H2O2, 30% w/v) was purchased from Molychem, Mumbai. Bacterial strains (S. aureus MTCC 740; E. coli MTCC 443) were purchased from MTCC Chandigarh (India). 0.2 M of sodium acetate buffer, Tris buffer & phosphate buffered saline (PBS) were prepared in the lab. Luria–Bertani (LB) medium was purchased from SRL. The chemical reagents used were of analytical quality and used without further purification.2.2. Synthesis and characterization of CeO2 NZs
CeO2 NZs were synthesized by the co-precipitation method as described elsewhere.15 Briefly, ceric ammonium nitrate (2 g) dissolved in water (6 mL) was added dropwise to a saturated aqueous solution (14 mL) of ammonium carbonate (2.5 g) [precipitant] under stirring. A pale-yellow precipitate appeared, and after 30 min of stirring, the orange-yellowish solution formed. After 30 min of stirring, an equal volume of MQ (20 mL) was added, and then again stirred for 16 hours. The resulting precipitates were centrifuged, washed, and annealed at 90 °C for 48 hours. The product was named B1. CeO2 NZs were also prepared using different amounts of ammonium carbonate precipitant, i.e., 3.5 g and 4.5 g, and named B2 and B3, respectively.The absorption spectra, crystallite size, particle size, elemental composition, and oxidation state of CeO2 NZs were studied by UV-vis-spectroscopy, X-ray diffraction (XRD), high-resolution transmission electron microscopy (HRTEM), energy dispersive X-ray (EDX) and X-ray photoelectron spectroscopy (XPS), respectively. Ultraviolet-visible (UV-vis) spectroscopy (model UV-3600 Plus, wavelength range: 200–800 nm) was used for preliminary confirmation of the formation of CeO2 NZs. The hydrodynamic diameter of the synthesized NZs was determined using a Nanotrac–Microtrac Wave-II dynamic light scattering (DLS) instrument or particle size analyzer (PSA). For the PSA measurement, cerium oxide nanopowder was dissolved at a concentration of 1 mg mL−1 in Milli-Q water and sonicated for 30 minutes. Prior to analysis, the sonicated suspension was diluted threefold. The samples were analyzed at an ambient temperature of 37 °C. The XRD spectra of CeO2 NZs were recorded through a powder X-ray diffractometer operating at 60 kV and 50 mA using Cu Kα (λ = 1.54 Å) radiation with a diffraction angle between 10° and 90°. The crystallite size and lattice strain of all the batches were determined using the formula discussed in Section 3.2. The nanozyme's size was estimated using HRTEM on a Thermo Fisher Model Tecnai 20G2. To prepare the sample, a drop of pre-sonicated and well-dispersed CeO2 NZ solution in ethanol was placed on a grid of copper and air-dried completely. Additionally, XPS analysis was carried out using an X-ray photoelectron spectrometer (Axis Supra instrument) equipped with a dual Al Kα/Mg Kα achromatic X-ray source. The monochromatic Al Kα X-ray source was operated at 1486.6 eV (20 mA) under high vacuum (<1 × 10⁻⁹ mbar). Samples were made for the XPS testing by dispersing the powder in Milli-Q water (1 mg mL−1). Following sonication, the suspension was triple-diluted. A small amount of the diluted suspension was drop-cast onto a clean silicon wafer, and it was then allowed to dry under ambient conditions. This produced a thin layer of suspension. The obtained spectra were analysed using CASAXPS software version 2.3.26PR1.0. Peaks were fitted and the binding energy scale was adjusted based on the C 1s peak at 284.8 eV to account for any charging effects. Peaks were correlated with the chemical states of the relevant material components using previously reported literature.
2.3. Pro-oxidative catalytic activity and kinetic study
The peroxidase mimic activity of NZs was examined through the catalysis of the colorimetric substrate TMB in the presence of H2O2. It led to the formation of a blue-coloured oxidized TMB (oxTMB) product, which was measured by noting absorbance at 652 nm using UV-vis spectroscopy.16,17 Initially, the peroxidase activity of the NZs was analyzed by adding 100 μL of CeO2 NZs (1 mg mL−1) to an acetate buffer solution (0.2 M, pH 3.6) with TMB (0.8 mM) and H2O2 (12.5 mM). The total reaction volume was 200 μL, and the reaction time was 15 min, after which the scanning was performed (350–700 nm). The oxidase-like activity was also measured using the same procedure, but without H2O2. After incubation, absorbance scan was performed in the range of 350–700 nm. Furthermore, the comparative reaction time curve of peroxidase and oxidase activity for all the batches of NZs was investigated. The peroxidase activity of the best batch (B2) was also investigated at varying concentrations of NZs, H2O2, and TMB. The effect of pH was also studied on B2 NZs, and the buffers used at different pHs were sodium acetate buffer (0.2 M) pH (3.6, 4.6, and 5.6), phosphate buffered saline (0.2 M) pH (6.6 and 7.6), and Tris base buffer (0.2 M) pH (8.6 and 9.6). Subsequently, different assays were performed for the confirmation of pro-oxidative activity (with B2) through the detection of produced hydroxyl radicals and singlet oxygen species. The detection of ˙OH confirms the peroxidase activity, which was detected through a fluorescence assay using OPD and TA.18 In the OPD assay, the reaction solution contained (1) B2 + H2O2 + OPD, (2) B2 + OPD, (3) H2O2 + OPD, and (4) OPD. The experimental conditions were as follows: after a 4-hour reaction with 0.3 mM OPD, 12.5 mM H2O2, and 100 μL CeO2 NZs (1 mg mL−1), a fluorescence spectrophotometer was utilized to examine the fluorescence spectra of the product 2,3-diaminophenazine (λexcitation/emission = 325 nm/450–560 nm). For TA, the reaction solution contained (1) B2 + H2O2 + TA, (2) B2 + TA, (3) H2O2 + TA, and (4) TA. The experimental conditions were as follows: after 4 hours of incubation in solution with 0.3 mM OPD, 12.5 mM H2O2, and 100 μL CeO2 (1 mg mL−1), a fluorescence spectrophotometer was utilized to examine the fluorescence spectra of the product 2,3-diaminophenazine (λexcitation/emission = 350 nm/350–600 nm). Detection of singlet oxygen confirms the oxidase activity that was detected with the ABDA assay.19 100 μL (1 mg mL−1) of B2 was added to the ABDA solution in PBS (40 μM) and then subjected to fluorescence emission spectrum recording (λexcitation/emission = 350 nm/330–600 nm) with a fluorescence spectrophotometer. The control sample is ABDA-treated with the same buffer but without B2 NZs. A comparison has also been performed for these assays with all the batches. The steady-state catalytic kinetics of CeO2 NZs at different concentrations of TMB were studied. The calculation was performed based on the prior report.202.4. Antibacterial activity of synthesized nanozymes (NZs)
Monoclonal cultures of E. coli (MTCC 443) and S. aureus (MTCC 740) were added to liquid Luria–Bertani (LB) medium and allowed to grow for 12 hours at 37 °C and 200 rpm. The bacterial solutions were diluted with PBS to a concentration of 107 CFU mL−1 after the logarithmic phase was attained.Briefly, OD600 = 0.1 bacteria were further diluted to a final concentration of 1 × 10⁵ CFU per mL in 96-well plates containing PBS buffer (0.2 mM, pH 3.6). Bacteria (E. coli or S. aureus) were placed into six groups: (I) bacteria + buffer, (II) bacteria + H2O2, (III) bacteria + CeO2 NZs, and (IV) bacteria + CeO2 NZs + H2O2. The final concentrations of CeO2 NZs and H2O2 were 100 μg mL−1 and 12.5 mM, respectively. The mixtures of all treatment groups were allowed to react for 2 hours. The mixture was further diluted after two hours, and 30 μL from each group was then cultivated on solid LB-agar plates. The plates were then incubated at 37 °C until all viable colonies appeared, at which point they were counted.
The percent reduction rate in bacterial count was calculated using the formula below:
| Percent reduction rate = (CFU control − CFU treated)/CFU control × 100 |
A live/dead bacterial cell staining assay was carried out using propidium iodide (PI) to evaluate the killing of bacterial cells by NZs.21 Following various treatments, bacterial cells were incubated for 30 minutes in the dark with PI (30 μM). The bacterial cells were then resuspended in phosphate buffered saline (PBS) after two rounds of washing with PBS. The fluorescence spectra were recorded immediately at λexcitation at 535 nm and λemission 500–800 nm.
3. Results and discussion
3.1. HRTEM and EDX studies
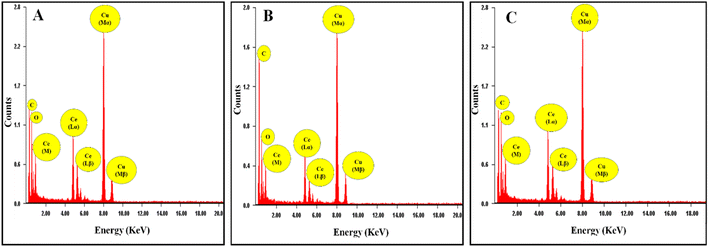
The formation of the cerium oxide NZs and their nanostructure nature were investigated through HRTEM. Fig. 1A–C show the HRTEM images of the as-synthesized cerium oxide NZs (B1, B2, and B3, respectively). The NZs had a rather aggregative, spherical form, as shown in Fig. 1A–C. The histogram of particle size is presented in Fig. 1D–F, which shows that the average particle sizes of B1, B2, and B3 are 1.9, 2.24, and 2.46 nm, respectively. The crystallinity of B1, B2, and B3 is verified by Selected Area Electron Diffraction (SAED) (Fig. 1G–I). The selected area electron diffraction (SAED) analysis of the cerium oxide nanopowder exhibited distinct diffraction rings. HRTEM images revealed the presence of 3.124, 2.73, 1.91, 1.62, 1.35, and 1.23 Å interplanar spacing (d) for the B2 batch which corresponds to the distance of the crystallographic cubic planes (111), (200), (220), (311), (400), and (331), suggesting the formation of high-quality cubic CeO2 NPs [JCPDS card no. 75-0390 (Fm3m) space group].22 A similar pattern was observed for the other two batches, B1 and B3. The lattice spacing of B1, B2, and B3 was calculated using the HRTEM images of all batches and found to be 0.24, 0.25, and 0.23 nm, respectively (ESI Fig. S1†). The Energy Dispersive X-ray Spectroscopy (EDX) spectra of CeO2 NZs (B1, B2, and B3), presented in Fig. 2A–C, indicate that the particles consist solely of cerium and oxygen, with no contaminants or impurities present in the sample. Characteristic peaks in the EDX data correspond to both oxygen and cerium. The intense peaks of carbon and copper elements were also observed, which is due to the carbon coated copper grid used for image analysis.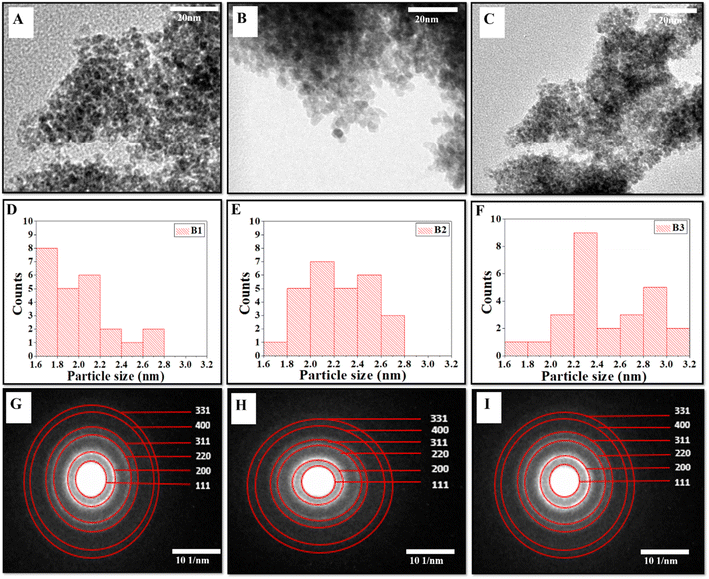 | ||
| Fig. 1 (A–C) HRTEM micrographs, (D–F) particle size distribution histogram, and (G–I) SAED images with indexing of CeO2 (NZs) (B1, B2, and B3 respectively). | ||
3.2. Surface morphological and chemical compositional analysis
CeO2 NZs were synthesized by co-precipitation of ceric ammonium nitrate with different amounts of ammonium carbonate. To confirm the synthesis of CeO2 NZ formation, all synthesized batches (B1, B2, and B3) were analysed using UV-visible spectroscopy. Fig. 3A depicts the presence of a characteristic absorbance peak below 400 nm in all synthesized batches that corresponds to CeO2 NZs. This peak is a result of charge-transfer transitions from oxygen 2p to cerium 4f, which interfere with the Ce 4f state's typical f–f spin–orbit splitting, indicating special electronic characteristics in ceria nanoparticles.23 Shifting of the absorption band toward a higher wavelength, known as red shift as observed in B2 (Fig. 3A), can be attributed to the conversion of Ce4+ to Ce3+ and oxygen vacancies, which leads to the formation of localized electronic states within the CeO2 band gap.24 These changes in the electronic band structure of B2 NZs resulted in lower energy electronic transitions and absorbance at longer wavelengths as compared to B1 and B3. The absence of any other peak in the UV-vis spectra indicates the formation of pure CeO2 NZs without any impurities. The hydrodynamic diameter of nanoparticles was studied using the dynamic light scattering method. The distribution of particle size for B1, B2, and B3 was observed in the range of 100–1000 nm as depicted in Fig. 3B–D.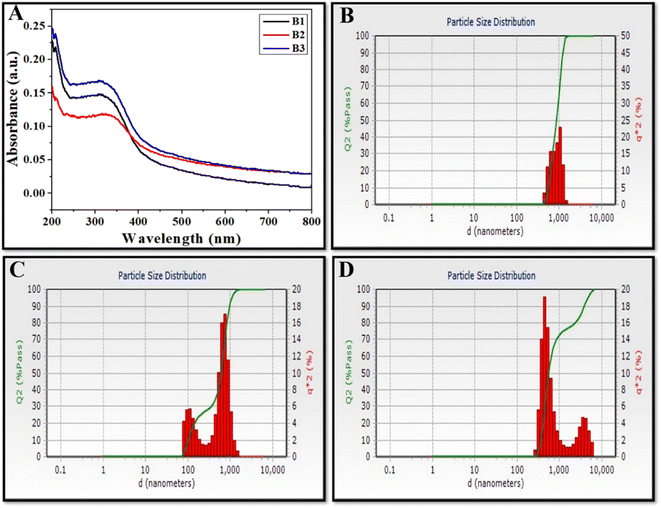 | ||
| Fig. 3 (A) UV-visible spectra and, (B–D) particle size distribution using dynamic light scattering (DLS) as a measurement of CeO2 NZs (B1, B2, and B3 respectively). | ||
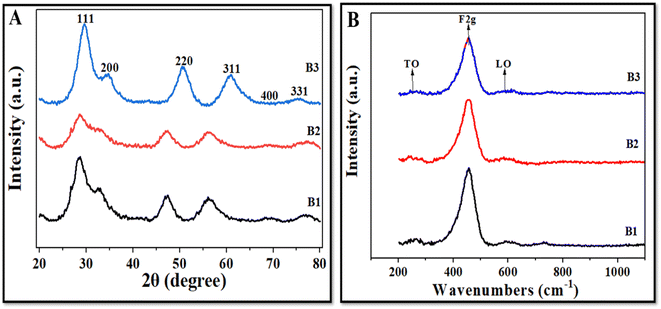
Fig. 4A illustrates the XRD patterns of all three NZ batches (B1, B2, and B3). Powder XRD of all synthesized batches showed similar patterns with a sharp, intense peak at 28.5° indexed to the (111) crystal plane; however, the intensity of this prominent peak decreased in B2, where the amount of the precursor used was 3.5 g. The high intensity and sharpness of the (111) peak indicate that the CeO2 NZs have a high phase purity, implying that they are mostly fluorite. The other minor diffraction peaks at 32.7°, 47.3°, 56.4°, 69.3°, and 77.1° were indexed to (200), (220), (311), (400), and (331) crystal planes with cubic fluorite crystal structure [JCPDS card no. 75-0390 (Fm3m) space group]. The data were in accordance with the previously reported literature [JCPDS card no. 34-0394].22 Furthermore, the absence of any new phase-corresponding peaks suggests that the produced samples were highly pure. In CeO2 NZs, peak broadening and peak intensity are also correlated with O vacancies, defects, and imperfections in the structure, crystallite size, and lattice strain. B2 has broader and less intense peaks as compared to B1 and B3. This also indicates that the crystallite size of B2 is small as compared to B1 and B3, which showed narrower and more intense peaks. A strong and prominent peak suggests that the cerium oxide nanoparticles are highly crystalline due to their well-defined arrangements at the atomic level. Moreover, the self-induced strain formed in the crystallites during growth could be responsible for XRD peak broadening.25 Therefore, the crystallite size, lattice parameter, and lattice strain of all the batches were determined. The Scherrer formula, D = kλ/β![[thin space (1/6-em)]](https://www.rsc.org/images/entities/char_2009.gif) cos
cos![[thin space (1/6-em)]](https://www.rsc.org/images/entities/char_2009.gif) θ, was utilized to determine the average crystallite size for each sample. The formula takes into account the following factors: D is the crystallite size (nm), k is a constant (0.90), λ is the X-ray wavelength (0.1541 nm), β is the angular line full width at half maximum (FWHM) of the peak (in radians), and θ shows the Bragg's angle (in radians).26 Furthermore, the lattice strain (ε) was determined using the formula ε = β/4
θ, was utilized to determine the average crystallite size for each sample. The formula takes into account the following factors: D is the crystallite size (nm), k is a constant (0.90), λ is the X-ray wavelength (0.1541 nm), β is the angular line full width at half maximum (FWHM) of the peak (in radians), and θ shows the Bragg's angle (in radians).26 Furthermore, the lattice strain (ε) was determined using the formula ε = β/4![[thin space (1/6-em)]](https://www.rsc.org/images/entities/char_2009.gif) tan
tan![[thin space (1/6-em)]](https://www.rsc.org/images/entities/char_2009.gif) θ, where β is the FWHM (in radians) of the diffraction peak and θ is the Bragg angle.27
θ, where β is the FWHM (in radians) of the diffraction peak and θ is the Bragg angle.27
The data in Table 1 show that the crystallite size and lattice parameter of synthesized batches increase in the order B2 < B1 < B3, and lattice strain decreases in the order B2 > B1 > B3. According to Andrade et al. 2017 decreasing particle sizes lead to an increase in the surface-to-volume ratio (which causes the surface tension effect), which in turn causes lattice contraction and, ultimately, the induction of microstrain in the crystalline lattice.28 Choudhury et al. 2015 reported that as the crystallite size of the CeO2 NPs increases, the lattice constant and strain decrease. According to these reports, the grain boundaries of smaller crystallites exhibit non-stoichiometric oxygen defects and an excess volume of Ce3+, which together provide a short-range stress field that causes atomic displacements and the creation of strain in the lattice.29 The high concentration of defects on the surface and the grain boundaries produces a stress field in these locales and hinders the growth of the nanocrystallite. Thus, the XRD data indicate that the B2 batch has the smallest crystallite size with the maximum lattice strain. Furthermore, shifts in the XRD peaks toward lower angles at (220) and (311) were observed in B1 and B2, which can be attributed to their smaller crystallite sizes. It is well-documented that smaller crystallite sizes can result in broader peaks and shifts to lower angles in XRD patterns because smaller crystallites have a higher surface-to-volume ratio, which increases surface energy and causes a shift in the diffraction peaks to lower angles.30
| Samples | Lattice constant a (Å) | Crystallite size D (nm) | Lattice strain ε (10−3) |
|---|---|---|---|
| B1 | 3.4653 | 26.070 | 33.87 |
| B2 | 3.4664 | 24.300 | 38.62 |
| B3 | 3.4641 | 31.22 | 33.55 |
To further investigate the chemical states of the CeO2 NZs and determine the relationship with their catalytic activities, XPS analyses of CeO2 3d were performed. Wide spectra of XPS (for B1, B2, and B3) are presented in the ESI (see Fig. S2A–C)† and provide comprehensive information on the elemental composition of the sample. According to the XPS data, the indexed peaks for CeO2 NZs are C 1s (Fig. 5A, D and G for B1, B2, and B3 respectively), O 1s (Fig. 5B, E and H for B1, B2, and B3 respectively), and Ce 3d (Fig. 5C, F and I for B1, B2, and B3 respectively), and the C 1s signals are probably caused by organic traces that are contaminated during handling, absorbed from the air, or due to carbon supports used in sample processing. The complexity of the Ce 3d spectra is well explained.31,32 The Ce 3d XPS spectra were deconvoluted for all batches. It was possible to accurately identify the chemical states of cerium in the sample by fitting several peaks to the measured spectra during the deconvolution process. The Ce 3d core-level spectra were fitted, and multiple peaks corresponding to the 3d3/2 and 3d5/2 spin–orbit components were obtained (discussed ahead). The Ce4+ and Ce3+ states were identified as these peaks, indicating the mixed oxidation states found in the cerium oxide sample. Generally, ten distinct peaks are obtained in the XPS spectra of the CeO2 nanostructure, which are further categorized into five spin–orbit split, 3d5/2 and 3d3/2, core-hole pairings. All spin-up (j = 5/2) final states are denoted as v, and all spin-down (j = 3/2) as u. The pairs, v/u, v′′/u′′, and v′′′/u′′′, are designated to the different Ce(IV) final states (Ce 3d94f2 O 2p4, Ce 3d94f1 O 2p5, and Ce 3d94f0 O 2p6, respectively), while vo/uo and v′/u′ are associated with Ce(III) final states, Ce 3d94f2 O 2p5 and Ce 3d94f1 O 2p6.33Fig. 5C, F and I depict the presence of v, v′, v′′′, vo, uo, u′, and u′′′ peaks that are centered at around 882, 885, 896, 880, 898, 905, and 915 eV, respectively. The amount of Ce3+ and Ce4+ ions found in samples can be determined by conducting a semi-quantitative analysis of the combined peak area using the equation given below, where A denotes the area of the individual peaks.34,35
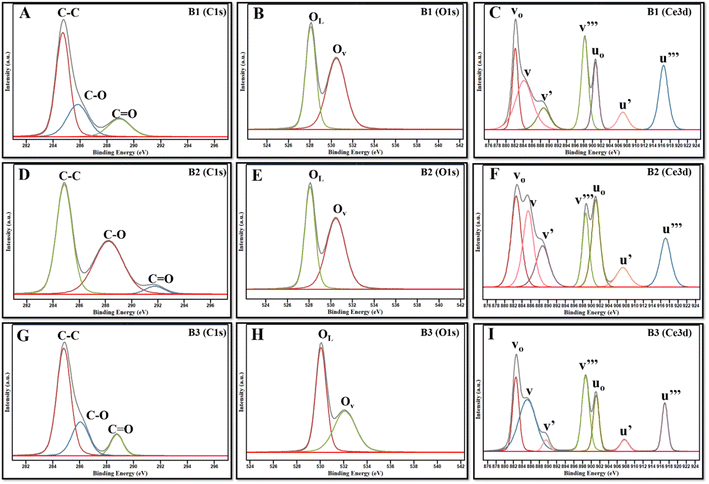 | ||
| Fig. 5 (A, D and G) XPS spectra of C 1s, (B, E and H) Ce 3d, and (C, F, and I) O 1s, of B1, B2, and B3. | ||
Since the concentrations of Ce3+ and Ce4+ ions and oxygen at the surface are indicators of the active sites that are created on the cerium oxide catalyst, it is crucial to ascertain these values. The peak positions, area, and ceria oxidation states (Ce3+ and Ce4+) determined for all synthesized batches are tabulated in ESI Table S1.† The percentages of Ce3+ and Ce4+ determined using the above equation are listed in Table 2. The data depict a high percentage of Ce3+ in all batches as compared to Ce4+. It is further observed that B2 contains the maximum Ce3+ as compared to B1 and B3, which is in accordance with XRD data.
| Samples | Ce3+% | Ce4+% | A OL | A OAds or AOV | Oxygen vacancies AOAds/AOL | Oxygen vacancies OV (%) |
|---|---|---|---|---|---|---|
| B1 | 60.06 | 39.90 | 5765.90 | 13![[thin space (1/6-em)]](https://www.rsc.org/images/entities/char_2009.gif) 309.39 309.39 |
2.3082 | 3.2 |
| B2 | 63.36 | 36.63 | 4281.31 | 20![[thin space (1/6-em)]](https://www.rsc.org/images/entities/char_2009.gif) 443.73 443.73 |
4.7752 | 5.6 |
| B3 | 56.56 | 43.43 | 3205.12 | 4730.96 | 1.476 | 2.8 |
The spectra of O 1s are indicated by two peaks, OLattice (OL) and OAdsorb (OAds or OV), as illustrated in Fig. 5B, E and H. The O 1s spectra were also fitted that corresponded to surface-adsorbed species and lattice oxygen. Lattice oxygen ions contribute to the peak at lower binding energy, called OL, whereas oxygen vacancies (adsorb oxygen) on the surface contribute towards the peak at higher binding energy, called OV.36,37 In the present work, OL and OV are centered at around 528–530 eV and 531–532 eV, respectively. The ratio of the area under OV mode (AOAds or OV) to the area under OL (AOL) is used to determine the oxygen vacancies.38 It was observed that B2 has a higher concentration of oxygen vacancies, followed by B1 and B3, which corroborates with the outcomes of XRD. High OAds are directly related to high Ce3+, as it indicates that oxygen vacancies are created by the presence of surface-level Ce3+ ions on the nanoparticle surface. Our data demonstrate that the B2 batch of NZs contains a higher fraction of OAds and Ce3+ as compared to B1 and B3, which could probably contribute to the more catalytically active surface of B2.
3.3. Raman studies
Raman spectroscopy is an excellent technique for determining the degree of defects in different phases of nanoparticles.39Fig. 4B depicts that CeO2 NZs display a very strong Raman mode from 451 to 455 cm−1 and two small peaks between 590 and 600 cm−1, of which only the highly intense peak (F2g) is Raman active while the other two are classified as forbidden modes. The peak at 451.6 cm−1 represents an F2g triply produced mode, indicating symmetrically stretched oxygen ions surrounding cerium ions in a cubic fluorite CeO2 lattice.40 Since it is well known that Raman spectra are particularly sensitive to any form of structural defect, the peaks at 255–260 cm−1 (referred to as transverse optical mode or TO mode) and 595–600 cm−1 (referred to as longitudinal optical mode or LO mode) indicate a lattice defect. When Ce4+ is reduced to Ce3+, nearby vacancies are represented by LO mode.41 The ratio of the area under LO mode (ALO) to the area under F2g mode (AF2g) is used to determine the oxygen vacancies.42 The peak position for F2g mode was found to be around 451 cm−1 and for LO mode, 598–600 cm−1 (ESI Table S2†). B2 has higher oxygen vacancies (5.6%) than B1 (3.2%) and B3 (2.8%), as indicated in Table 2. This is because of the charge imbalance brought on by the replacement of Ce4+ ions. This result agrees with the XPS and XRD data.3.4. Pro-oxidative activity (POD and OXD) of the CeO2 NPs
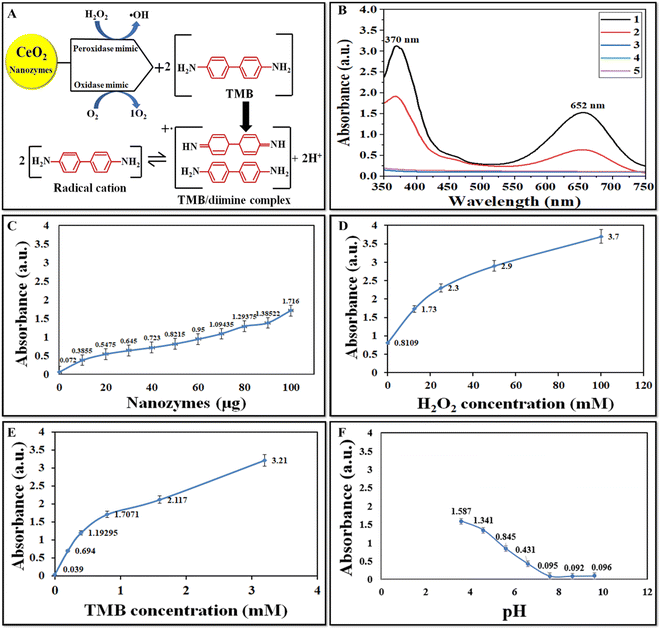
The peroxidase-like activity of CeO2 NZs was investigated via the catalytic oxidation of TMB/H2O2. CeO2 NZs of the B2 batch were first studied for their catalytic activity. NZs catalyze TMB in the presence of H2O2 to produce a deep blue product, indicating high peroxidase-like activity. As indicated in the scheme in Fig. 6A, the colorless TMB can undergo two successive one-electron reduction–oxidation processes. The first step yields an intermediate product, a TMB-free radical, which forms a colored charge-transfer complex with another TMB radical (λ = 370, 652 nm).43 The oxidation product of TMB catalyzed by CeO2 NZs was scanned using a UV-vis spectrometer. The higher absorbance intensity at 370 and 652 nm is indicative of the strong peroxidase ability (Fig. 6B) of NZs in comparison to control experiments without NZs. The oxidase mimic activity was also assessed, and the results are shown in Fig. 6B (red spectra). When TMB was catalyzed by CeO2 NPs in the absence of H2O2, its color turned light blue, indicating a lower oxidase-like catalytic activity. The reaction time curve of OXD and POD mimic activity for all batches (B1, B2, and B3) shows that B2 exhibits higher peroxidase activity than B1 and B3 (ESI Fig. S3†). However, a comparison of the OXD activity of all batches displayed a minor difference in this activity. As the B2 batch of CeO2 NZs displayed high POD-like activity, the effect of different concentrations of the catalyst and substrate and varying pH was then investigated on the peroxidase mimic activity of B2 NZs. The activity at different concentrations of CeO2 NZs, H2O2, and TMB appears to increase consistently with their increasing concentrations (Fig. 6C–E). We selected the working concentrations of NZs (100 μg mL−1), H2O2 (12.5 mM), and TMB (0.8 mM) as the minimum amounts that generated significant absorbance without reaching. Fig. 6F depicts that the peroxidase-like activity was higher at an acidic pH (3.6), which gradually decreased with increasing pH and almost became negligible at a neutral-alkaline pH. These results revealed that the CeO2 (B2) NZs showed tunable catalytic performance at different pHs.3.5. Reactive oxygen species detection
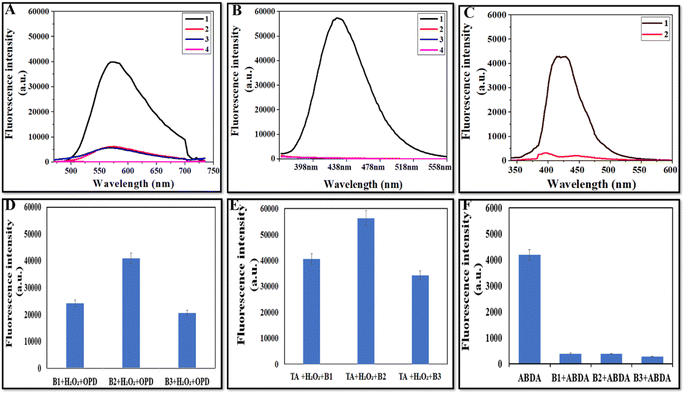
The potential mechanism of CeO2s' peroxidase-like activity might come from their capacity to catalyze the breakdown of H2O2 to produce hydroxyl radicals (˙OH). To determine the presence of ˙OH during the process, fluorescence studies were conducted using o-phenylenediamine as well as terephthalic acid (TA). Hydroxyl radicals convert the non-fluorescent compound o-phenylenediamine to its highly fluorescent product, i.e., 2,3-diaminophenazine (λemission = 572 nm).44Fig. 7A depicts that the fluorescence intensity of B2 + H2O2 + OPD was higher than that of H2O2 + OPD, B2 + OPD, and OPD (control). Fig. 7D depicts the comparative fluorescence intensity of OPD for all three batches indicating the production of the hydroxyl radical by all three batches, but the highest fluorescence intensity in B2 showed the maximum production of the hydroxyl radical by the NZs. Terephthalic acid (TA) absorbs the hydroxyl radical (˙OH) and produces 2-hydroxy terephthalic acid (TAOH), which displays distinct fluorescence at 435 nm, where higher fluorescence intensity means more ˙OH production.45Fig. 7B depicts that TA alone, TA + H2O2 and TA + B2 showed negligible fluorescence at 435 nm. However, in the presence of B2 + H2O2 + TA, the strongest fluorescence intensity was observed, which confirms the generation of high ˙OH radicals by NZs. Fig. 7E depicts the comparison of the fluorescence intensity of TA for all batches, and B2 was observed to exhibit the highest fluorescence.For singlet oxygen detection, ABDA was used as a probe as its fluorescence is quenched after interaction with singlet oxygen and it becomes non-fluorescent.46Fig. 7C depicts the spectra of ABDA alone (control) and ABDA with B2, in which the control has high fluorescence and the NZs show very low fluorescence. Fig. 7F depicts the comparison of the fluorescence intensity of ABDA and ABDA with all NZs, and it was observed that all the batches had more or less similar OXD activity.
3.6. Calculation of the Michaelis–Menten constant (Km) and maximum velocity (Vmax)
Based on the results obtained through peroxidase mimic activity, steady-state kinetics was performed to calculate Km and Vmax using the Michaelis–Menten equation.47,48 Reaction rate were obtained through eqn (1) (where ΔA is the change in absorbance, Δt is the change in time, ε is the molar absorptivity, and l is the path length of the cuvette), which were then plotted against the corresponding substrate concentration (TMB) and fitted with Michaelis–Menten curves (ESI Fig. S4A–C†) (eqn (2)). Furthermore, to determine the Km and Vmax, a linear double-reciprocal plot (Lineweaver–Burk plot, eqn (3)) was obtained as given in ESI Fig. S4D–F.†Table 3 presents the Km and Vmax values of B1, B2, and B3, where the Km of B2 was found to be low as compared to B1 and B3, which showed that B2 has a high affinity for the substrate, followed by B1 and B3.| Reaction rate = ΔA/ε × l × Δt | (1) |
| v0 = Vmax × [S]Km + [S]. | (2) |
| 1/v0 = KmVmax × 1/[S] + 1/Vmax. | (3) |
| Samples | K m (mM) | V max (1 × 10⁻⁷ M s−1) |
|---|---|---|
| B1 | 2 | 1.2 |
| B2 | 0.3 | 0.2 |
| B3 | 6 | 0.25 |
3.7. In vitro antibacterial performance
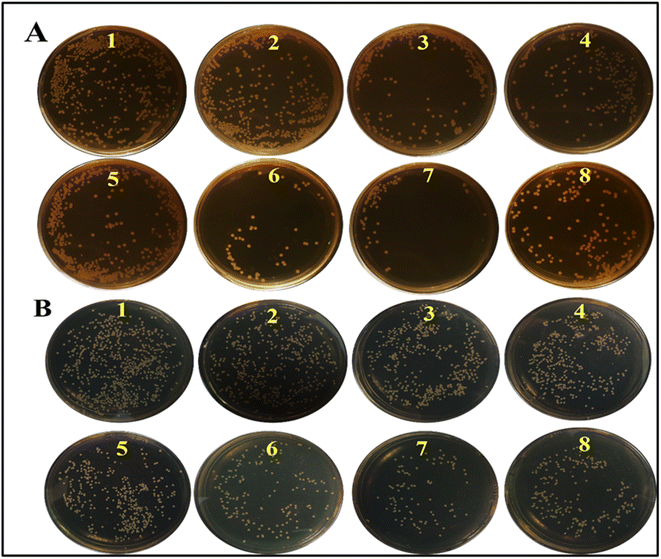
The antibacterial activity of all samples of CeO2 NZs was investigated. As shown in Fig. 8A and B, CeO2 NZs (400 μg) significantly reduced the growth of E. coli and S. aureus when H2O2 (12.5 mM) was present. Lower nanoparticle doses (100 μg, 200 μg, and 300 μg) were also tested under the same conditions but not reported as there was no difference in bacterial growth in comparison to non-treated control groups. H2O2 might itself inhibit bacterial viability at higher doses, but such a dose proves to be hazardous for healthy tissues. Therefore, the intrinsic POD-like activity of NZs could augment the antibacterial activity at relatively lower concentrations of H2O2. In this study, the antibacterial activity was tested at 12.5 mM H2O2. Fig. 8A and B (1) show positive controls of E. coli and S. aureus, respectively. Fig. 8A and B (2) depict that the chosen H2O2 concentration does not have a significant antibacterial effect by itself. Fig. 8A and B (3, 4, and 5) depict that antibacterial activity is exhibited by the NZs themselves, which could be attributed to their oxidase-like activity; however, maximum killing (antibacterial killing) was observed when NZs were supplemented with H2O2, as shown in Fig. 8A and B (6, 7, and 8). The percent reduction in the bacterial count by all NZ batches is determined and presented in Table 4. This shows that the NZs were able to kill bacteria through their oxidase as well as peroxidase activity, but the peroxidase-mediated killing was higher than the former. Furthermore, B2 showed the highest antibacterial activity through its POD, or OXD-like activity, as compared to B1 and B3.| Samples | % reduction in bacterial count | |
|---|---|---|
| E. coli | S. aureus | |
| H2O2 | 5.32 | 4.12 |
| B1 + bacteria | 41.13 | 32.68 |
| B2 + bacteria | 43.21 | 35.34 |
| B3 + bacteria | 39.89 | 29.99 |
| B1 + bacteria + H2O2 | 88.96 | 79.44 |
| B2 + bacteria + H2O2 | 91.27 | 83.26 |
| B3 + bacteria + H2O2 | 83.97 | 69.79 |
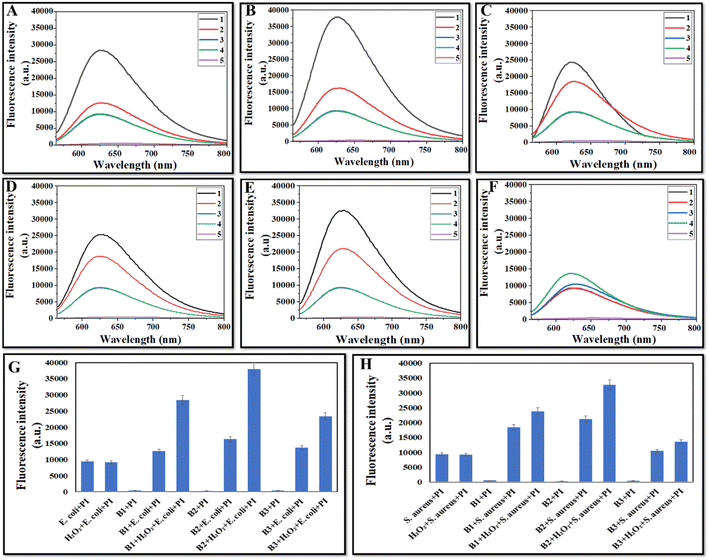
Propidium iodide (PI) is regarded as an indication of membrane integrity, as it can only pass through bacterial membranes that have been damaged.49 Dead cells or those with irreversibly damaged membranes will have their DNA and RNA stained by it. So, this assay is performed for confirmation of bacterial killing in the presence of ROS generated by CeO2 NZs with their peroxidase and oxidase-like activity.
Fig. 9 A–C (E. coli) and Fig. 9D–F (S. aureus) show the fluorescence spectra with different samples, which indicate that in the control (only bacteria) and H2O2 (H2O2 + bacteria) groups, low fluorescence (640 nm) was observed (more bacteria alive). The fluorescence intensity of bacteria treated with CeO2 NZs alone (B1, B2, or B3) was higher than that of the control and H2O2 groups which indicates that some antibacterial activity of NZs is through their oxidase mimic activity. However, the highest fluorescence intensity was observed in the bacteria treated with CeO2 NZs (B1, B2, or B3) and the H2O2 group, indicating that the ˙OH radical generated through the NZ-catalyzed reaction significantly enhanced the antibacterial activity. A comparative assay of all batches indicated more or less similar fluorescence intensity when bacteria were treated with nanoparticles alone in Fig. 9G (E. coli) and Fig. 9H (S. aureus). However, when bacteria were treated with both H2O2 and CeO2, variations in fluorescence intensity were observed, with B2 exhibiting the highest fluorescence, followed by B1 and B3 (Fig. 9G and H). These findings are consistent with the results from the spread plate assays.
3.8. Discussion
This study examined the effect of different precipitant concentrations on the catalytic and antibacterial activities of CeO2 NZs synthesized using the co-precipitation method. Three batches of CeO2 NZs (B1, B2, and B3) were synthesized and then characterized with different techniques such as UV-visible spectroscopy, DLS, XRD, XPS, HRTEM, and EDX. It was observed that changing the precipitant (ammonium carbonate) concentration had a significant impact on the physicochemical properties of CeO2 NZs. The study showed that B2 (3.5 g) NZs had the smallest crystallite size, maximum lattice strain, highest Ce3+ concentration, and oxygen vacancies followed by B1 (2.5) and B3 (4.5 g) batches. The peroxidase analysis and the antibacterial studies also depict that B2 NZs exhibit the highest POD-like activity and antibacterial activity. Previous studies have demonstrated that crystallite size, Ce3+ concentration, and oxygen vacancies modulate the intrinsic pro-oxidative activity of cerium oxide NZs. For instance, Shlapa et al. 2023 observed that there is a 1.2-fold drop in cerium dioxide's oxidase-like activity with every unit increase in the particle size of CeO2 NZs (from 7 to 15 nm).50 Using DFT calculations, Wang et al. 2021 investigated the underlying mechanism of the POD and OXD-like activity of CeO2 NZs, with a focus on OV during the catalytic reaction. It was reported that in the absence of oxygen vacancies, CeO2 NZs showed low activity due to their weak affinity for H2O2 and O2.51 Song et al. 2017 conducted a study to examine the adsorption behaviour of H2O2 on both ideal and oxygen-defective Fe2O3 surfaces using density functional theory (DFT) calculations. Their findings showed that the presence of oxygen vacancies enhanced H2O2 adsorption and accelerated H2O2 breakdown on the catalytic surface.52 In crystalline structures, atoms are placed symmetrically, and imperfections or defects occur when one atom migrates from its lattice position, disturbing the crystal structure's symmetry. The surface of CeO2 NZs undergoes redox reactions with its environment during synthesis, which leads to defects or imperfections.The present study further demonstrates that these characteristic features of the NZs also depend upon the amount of the precipitant employed for the synthesis. Any amount below (2.5 g) or above (4.5 g) the optimum (3.5 g) precipitant concentration negatively impacts the crystallite size, Ce3+ concentration, and oxygen vacancies. It leads to decreased POD-like activity and the subsequent antibacterial potential of NZs.
4. Conclusion
In summary, this work investigates the effect of varying amounts of the precipitant used for the synthesis of CeO2 NZs by the co-precipitation method and observes that an optimum amount (concentration) of the precipitant must be necessarily employed to synthesize NZs with desired physicochemical characteristics such as crystallite size, lattice constant, lattice strain, and oxygen vacancies. Here, B2 NZs with 3.5 g of ammonium carbonate precipitant possessed the highest oxygen vacancies and POD-like activity. High peroxidase-like activities of B2 generate more ROS (hydroxyl radical and singlet oxygen) and showed significant antibacterial activity against both E. coli and S. aureus as compared to other batches (B1 and B3). Thus, modulating the amount of the precipitant could be one of the feasible strategies to engineer CeO2 NZs with high antibacterial activity.Data availability
The data presented in this manuscript have neither been previously published nor are under the consideration for publication elsewhere and will be made available on request.Conflicts of interest
The authors have no conflicts to declare.Acknowledgements
We sincerely acknowledge the Ministry of Human Resource and Development (MHRD), India, and MNNIT Allahabad, Prayagraj, India, for their valuable support and lab facility. We also acknowledge the characterization facilities of CIR MNNIT Allahabad, Central Discovery Centre (CDC) BHU, Banaras Hindu University, Varanasi, India for RAMAN spectroscopy, Central Instrumentation Laboratory (CIL) and Central Research Facility (CRF) IIT Delhi, India, for XPS, and the Department of Physics Banaras Hindu University, Varanasi, India, for HR HRTEM and EDAX. We would also like to acknowledge the Department of Science and Technology (DST), India, for their support.References
- D. C. Nwobod, M. C. Ugwu, C. O. Anie, M. T. Al-Ouqaili, J. C. Ikem, C. Victor and M. Saki, J. Clin. Lab. Anal., 2022, 36, 24655 CrossRef PubMed.
- J. W. Costerton, P. S. Stewart and E. P. Greenberg, Science, 1999, 284, 1318–1322 CrossRef CAS PubMed.
- N. Beyth, Y. H. Haddad, A. Domb, W. Khan and R. Hazan, Evid. base Compl. Alternative Med., 2015, 1, 246012 Search PubMed.
- M. Rai, A. P. Ingle, S. Gaikwad, I. Gupta, A. Gade and S. S. da Silva, J. Appl. Microbiol., 2016, 20, 527–542 CrossRef PubMed.
- A. Hamad, K. S. Khashan and A. Hadi, J. Inorg. Organomet. Polym. Mater., 2020, 30, 4811–4828 CrossRef CAS.
- P. Nisar, N. Ali, L. Rahman, M. Ali and Z. K. Shinwari, J. Biol. Inorg. Chem., 2019, 24, 929–941 CrossRef CAS PubMed.
- N. Singh, G. R. Sherin and G. Mugesh, Angew. Chem., Int. Ed., 2023, 33, 202301232 Search PubMed.
- S. Maddheshiya and S. Nara, Front. Bioeng. Biotechnol., 2022, 10, 880214 CrossRef PubMed.
- S. Das, J. M. Dowding, K. E. Klump, J. F. McGinnis, W. Self and S. Seal, Nanomedicine, 2013, 8, 1483–1508 CrossRef CAS PubMed.
- L. Su, S. Qin, Z. Xie, L. Wang, K. Khan, A. K. Tareen, D. Li and H. Zhang, J. Coord. Chem., 2022, 473, 214784 CrossRef CAS.
- M. Zhang, C. Zhang, X. Zhai, F. Luo, Y. Du and C. Yan, Sci. China Mater., 2019, 62, 1727–1739 CrossRef CAS.
- B. H. Chen and B. I. Stephen, Crit. Rev. Biotechnol., 2018, 38, 1003–1024 CrossRef CAS PubMed.
- A. S. Fudala, W. M. Salih and F. F. Alkazaz, Mater. Today: Proc., 2022, 49, 2786–2792 CAS.
- M. Ramachandran, R. Subadevi and M. Sivakumar, Vacuum, 2019, 161, 220–224 CrossRef CAS.
- A. S. Thill, F. O. Lobato, M. O. Vaz, W. P. Fernandes, V. E. Carvalho, E. A. Soares, F. Poletto, S. R. Teixeira and F. Bernardi, Appl. Surf. Sci., 2020, 528, 146860 CrossRef CAS.
- L. J. Peng, H. Y. Zhou, C. Y. Zhang and F. Q. Yang, Colloids Surf., A, 2022, 647, 129031 CrossRef CAS.
- W. Cao, P. Ju, Z. Wang, Y. Zhang, X. Zhai, F. Jiang and C. Sun, Spectrochim. Acta, Part A, 2020, 239, 118499 CrossRef CAS PubMed.
- J. Qin, Y. Feng, D. Cheng, B. Liu, Z. Wang, Y. Zhao and J. Wei, ACS Appl. Mater. Interfaces, 2021, 13, 40302–40314 CrossRef CAS PubMed.
- F. Gao, T. Shao, Y. Yu, Y. Xiong and L. Yang, Nat. Commun., 2021, 12, 745 CrossRef CAS PubMed.
- B. Jiang, D. Duan, L. Gao, M. Zhou, K. Fan, Y. Tang, J. Xi, Y. Bi, Z. Tong, G. F. Gao and N. Xie, Nat. Protoc., 2018, 13, 1506–1520 CrossRef CAS PubMed.
- X. Wang, L. Fan, L. Cheng, Y. Sun, X. Wang, X. Zhong, Q. Shi, F. Gong, Y. Yang, Y. Ma and Z. Miao, iScience, 2020, 23, 101281 CrossRef CAS PubMed.
- P. P. Tumkur, N. K. Gunasekaran, B. R. Lamani, N. N. Bayon, K. Prabhakaran, J. C. Hall and G. T. Ramesh, Nanomanufacturing, 2021, 1(3), 176–189 CrossRef.
- M. Abushad, W. Khan, M. Arshad, S. Husain, A. Ansari and V. K. Chakradhary, J. Mater. Sci.: Mater. Electron., 2023, 34, 710 CrossRef CAS.
- K. Ansari, S. Kumar, A. Sato, R. Hattori, K. Matsuishi, K. Marumoto and N. Chouhan, J. Mol. Liq., 2023, 383, 122103 CrossRef CAS.
- N. Fifere, A. Airinei, M. Dobromir, L. Sacarescu and S. I. Dunca, Nanomaterials, 2021, 11, 2596 CrossRef CAS PubMed.
- M. Sumadiyasa and I. B. S. Manuaba, Bul. Fis., 2018, 19, 28–35 CrossRef.
- P. Bindu and S. Thomas, J. Theor. Appl. Phys., 2014, 8, 123–134 CrossRef.
- A. B. Andrade, N. S. Ferreira and M. E. Valerio, RSC Adv., 2017, 7, 26839–26848 RSC.
- R. Verma, S. K. Samdarshi, S. Bojja, S. Paul and B. Choudhury, Sol. Energy Mater. Sol. Cells, 2015, 141, 414–422 CrossRef CAS.
- E. Bêche, P. Charvin, D. Perarnau, S. Abanades and G. Flamant, Surf. Interface Anal., 2008, 40, 264–267 CrossRef.
- J. P. Holgado, G. Munuera, J. P. Espinós and A. R. González-Elipe, Appl. Surf. Sci., 2000, 158, 164–171 CrossRef CAS.
- Y. A. Teterin, A. Y. Teterin, A. M. Lebedev and I. O. Utkin, J. Electron. Spectrosc. Relat. Phenom., 1998, 88, 275–279 CrossRef.
- S. Soni, V. S. Vats, S. Kumar, B. Dalela, M. Mishra, R. S. Meena, G. Gupta, P. A. Alvi and S. Dalela, J. Mater. Sci.: Mater. Electron., 2018, 29, 10141–10153 CrossRef CAS.
- F. Zhang, P. Wang, J. Koberstein, S. Khalid and S. W. Chan, Surf. Sci., 2004, 563, 74–82 CrossRef CAS.
- M. Romeo, K. Bak, J. El Fallah, F. L. Normand and L. Hilaire, Surf. Interface Anal., 1993, 20, 508–512 CrossRef CAS.
- G. Zhuang, Y. Chen, Z. Zhuang, Y. Yu and J. Yu, Sci. China Mater., 2020, 63, 2089–2118 CrossRef CAS.
- N. S. Leel, M. Kiran, M. K. Kumawat, P. A. Alvi, V. S. Vats, D. Patidar, B. Dalela, S. Kumar and S. Dalela, J. Lumin., 2023, 263, 119981 CrossRef CAS.
- T. Mizokawa, A. Fujimori, T. Arima, Y. Tokura, N. Mōri and J. Akimitsu, Phys. Rev. B: Condens. Matter Mater. Phys., 1995, 52, 13865 CrossRef CAS PubMed.
- M. S. Dresselhaus, A. Jorio, A. G. S. Filho and R. Saito, Philos. Trans. R. Soc., A, 2010, 368, 5355–5377 CrossRef CAS PubMed.
- L. G. Cançado, A. Jorio, E. M. Ferreira, F. Stavale, C. A. Achete, R. B. Capaz, M. D. O Moutinho, A. Lombardo, T. S. Kulmala and A. C. Ferrari, Nano Lett., 2011, 11, 3190–3196 CrossRef PubMed.
- S. Loridant, Catal. Today, 2021, 373, 98–111 CrossRef CAS.
- S. Chahal, S. Singh, A. Kumar and P. Kumar, Vacuum, 2020, 177, 109395 CrossRef CAS.
- S. Frasca, C. Richter, T. von Graberg, B. M. Smarsly and U. Wollenberger, Eng. Life Sci., 2011, 11, 554–558 CrossRef CAS.
- Q. Ye, S. Ren, H. Huang, G. Duan, K. Liu and J. B. Liu, ACS Omega, 2020, 20698–20706 CrossRef CAS PubMed.
- D. H. Gonzalez, X. M. Kuang, J. A. Scott, G. O. Rocha and S. E. Paulson, Anal. Lett., 2018, 51, 2488–2497 CrossRef CAS.
- A. Nsubuga, G. A. Mandl and J. A. Capobianco, Nanoscale Adv., 2021, 3, 1375–1381 RSC.
- S. Ali, S. Sikdar, S. Basak, B. Rajbanshi, M. Mondal, D. Roy, A. Dutta, A. Kumar, V. K. Dakua, R. Chakrabarty and A. Roy, ACS Omega, 2022, 7(5), 4457–4470 CrossRef CAS PubMed.
- J. Yang, X. Ren, X. Zhang, X. Wang, R. Zhang, P. Bai, B. Du, V. Li, S. Zhao, Y. Qin and R. Zhang, Arab. J. Chem., 2022, 15(11), 104238 CrossRef CAS.
- M. Rosenberg, N. F. Azevedo and A. Ivask, Sci. Rep., 2019, 9(1), 6483 CrossRef PubMed.
- S. Yuliia, S. Solopan, V. Sarnatskaya, K. Siposova, I. Garcarova, K. Veltruská, I. Timashkov, O. Lykhova, D. Kolesnik, A. Musatov, V. Nikolaev and A. Belous, Colloids Surf., B, 2022, 220, 112960 CrossRef PubMed.
- Z. Wang, X. Shen and X. Gao, J. Phys. Chem. C, 2021, 125, 23098–23104 CrossRef CAS.
- Z. Song, B. Wang, J. Yu, C. Ma, C. Zhou, T. Chen, Q. Yan, K. Wang and L. Sun, Appl. Surf. Sci., 2017, 413, 292–301 CrossRef CAS.
Footnote |
| † Electronic supplementary information (ESI) available. See DOI: https://doi.org/10.1039/d4na00234b |
| This journal is © The Royal Society of Chemistry 2024 |

