DOI:
10.1039/D4NA00362D
(Paper)
Nanoscale Adv., 2024,
6, 4944-4955
Experimental investigation of a biomass-derived nanofluid with enhanced thermal conductivity as a green, sustainable heat-transfer medium and qualitative comparison via mathematical modelling†
Received
2nd May 2024
, Accepted 26th July 2024
First published on 27th July 2024
Abstract
In this study, bio-based carbon nanospheres (CNSs) were synthesized from lignocellulosic-rich groundnut skin (Arachis hypogaea) and tested for their practical application in nanofluids (NFs) for enhanced heat transfer. The CNSs were characterized using various techniques, including FESEM, EDS, XRD, Raman spectroscopy, zeta potential analysis, and FTIR. Thermal conductivity (TC) and viscosity measurements were conducted using transient plane source (TPS) technique with a Hot Disk thermal analyser and discovery hybrid rheometer, respectively. The nanoparticles (NPs) were dispersed in two base fluids: ethylene glycol (EG) and a 60![[thin space (1/6-em)]](https://www.rsc.org/images/entities/char_2009.gif) :
:![[thin space (1/6-em)]](https://www.rsc.org/images/entities/char_2009.gif) 40 mixture of deionized water (DI) and EG. Optimization studies were performed by varying the stirring and measurement times to improve TC values. The results showed that when a power source of 40 mW was applied at a high concentration of nanoparticles (i.e., 0.1 wt%), there was a 91.9% increment in thermal conductivity (TC) compared to the base fluid EG. DI-EG-based nanofluids (NFs) exhibited enhancements of up to 45% compared to the base fluid DI-EG (60
40 mixture of deionized water (DI) and EG. Optimization studies were performed by varying the stirring and measurement times to improve TC values. The results showed that when a power source of 40 mW was applied at a high concentration of nanoparticles (i.e., 0.1 wt%), there was a 91.9% increment in thermal conductivity (TC) compared to the base fluid EG. DI-EG-based nanofluids (NFs) exhibited enhancements of up to 45% compared to the base fluid DI-EG (60![[thin space (1/6-em)]](https://www.rsc.org/images/entities/char_2009.gif) :
:![[thin space (1/6-em)]](https://www.rsc.org/images/entities/char_2009.gif) 40), with a heating power of 80 mW and concentration of 0.1 wt%. These results demonstrated significant TC improvements with NP incorporation. Further experiments were performed by varying the temperature in the range of 30–80 °C with readings taken for every 10 °C increase, which showed a direct relation with the TC values. At 80 °C, EG-based NFs showed increments of 77%, 111.49%, 139.67% and 175% at 0.01, 0.02, 0.05 and 0.1 wt% concentrations of NPs, respectively. It was also found that with the increase in the concentration of NPs, viscosity increased, whereas an increase in the temperature led to a decrease in viscosity. The CNS nanofluid exhibited a Newtonian behaviour with the nanoparticle concentration and temperature, resulting in an approximately 114% enhancement compared to the base fluid when the concentration of CNSs was 0.1 wt% at 30 °C but decreased by up to 18% when the temperature was increased to 90 °C. Using appropriate mathematical models for assessing thermophysical quantities, it was discovered that the model values and experimental values correspond reasonably well. Our method thus validates our experimental results and deepens the understanding of the mechanisms behind enhancing thermal conductivity in biomass-derived nanofluids. In summary, our work advances sustainable nanomaterial synthesis, providing a new solution for boosting thermal conductivity while maintaining environmental integrity, thereby inspiring further research and innovation in this field.
40), with a heating power of 80 mW and concentration of 0.1 wt%. These results demonstrated significant TC improvements with NP incorporation. Further experiments were performed by varying the temperature in the range of 30–80 °C with readings taken for every 10 °C increase, which showed a direct relation with the TC values. At 80 °C, EG-based NFs showed increments of 77%, 111.49%, 139.67% and 175% at 0.01, 0.02, 0.05 and 0.1 wt% concentrations of NPs, respectively. It was also found that with the increase in the concentration of NPs, viscosity increased, whereas an increase in the temperature led to a decrease in viscosity. The CNS nanofluid exhibited a Newtonian behaviour with the nanoparticle concentration and temperature, resulting in an approximately 114% enhancement compared to the base fluid when the concentration of CNSs was 0.1 wt% at 30 °C but decreased by up to 18% when the temperature was increased to 90 °C. Using appropriate mathematical models for assessing thermophysical quantities, it was discovered that the model values and experimental values correspond reasonably well. Our method thus validates our experimental results and deepens the understanding of the mechanisms behind enhancing thermal conductivity in biomass-derived nanofluids. In summary, our work advances sustainable nanomaterial synthesis, providing a new solution for boosting thermal conductivity while maintaining environmental integrity, thereby inspiring further research and innovation in this field.
1. Introduction
Cooling, which impacts many different operations, including microelectronics, transportation, and manufacturing, is one of the most critical scientific factors to consider in the industrial sector. Technology advancements, including faster microelectronic devices, more potent engines, and brighter optical devices, are causing increasing thermal loads that call for improvements in cooling. The conventional approach to boosting heat dissipation involves using a better heat-conductive fluid and expanding the surface accessible for heat exchange.1 Nanoparticles (NPs) must have at least a dimension between 1 and 100 nm, with a larger surface area.2 Colloidal suspensions of NPs in BFs are known as nanofluids. The most commonly used BFs are based on their thermophysical properties, including performance, compatibility, and maintenance factors. Such BFs include deionised (DI) water,3 ethylene glycol (EG),4 propylene glycol (PG),5 ionic liquids,6 and oils such as kerosene.7 Most studies use water and EG as base fluids because of their excellent physical properties, such as their freezing and boiling points.8 Data on the thermal conductivity of biomass-derived carbon nanospheres are currently lacking. In this study, EG and DI-EG were used as BFs because the boiling point of deionised water can be raised by combining it with anti-freezing substances, such as EG for automobile applications. Owing to this reason, the current study concentrated on the heat-transfer properties of nanofluids with EG and deionised water. Recently, many researchers have used metal (Au, Ni, Cu, Ag), metal oxides (TiO2, ZnO, MgO, Fe2O3), metal carbides (TiC), carbon (diamond, carbon nanotubes, graphene, graphene oxide, graphite, carbon dots),9 and metalloids (SiO2, SiC)10 in the fabrication of NFs for achieving a thermal conductivity enhancement. Apart from metal or metal oxide NPs, carbon nanostructures are among the nanoparticles with the highest thermal conductivity because they have a higher inherent thermal conductivity and a lower density compared to metals or metal oxides.11 Using synthetic nanoparticles poses environmental hazards and can contribute to various health issues. In light of these concerns, there is growing scientific interest in carbon nanomaterials derived from biowaste as a potential alternative. This attention stems from synthetic nanoparticles' adverse effects on the environment and human health.12
Due to their distinct physical and chemical features, carbon-based nanomaterials are considered particularly beneficial. There are many different kinds of carbon nanomaterials, such as graphene, fullerenes, carbon nanowalls, and carbon dots. Also, as they can be easily functionalised with bioactive molecules and have excellent stability, strong conductivity, high biocompatibility, and low toxicity, nanocarbon (NC) have attracted much attention.13 Researchers have prepared highly efficient NFs, but safety and health issues have been raised because chemically synthesised NPs are often more reactive in solvents. Rusting of equipment and the production of non-biodegradable by-products are two additional adverse effects that strong chemicals can generate.14 Because of these problems, the development of inexpensive, ecologically friendly NFs is now urgently desired and is a rapidly growing research area.15,16 Spherical-shaped NPs are particularly desired as these have numerous open edges and reactive dangling bonds that can be created at the surface, which give the material considerable chemical activity, and making them good candidates for use in various applications.17 Also, spherical NPs disperse more efficiently in various solvents or matrices compared to non-spherical particles.18 Spherical nanoparticles also facilitate efficient heat transfer due to their compact shape and uniformity. This property is essential in applications like thermal management.19 These unique properties of carbon nanostructures and their spherical shape have attracted much attention for the use of carbon nanospheres (CNSs). Because of their unique characteristics, CNSs have emerged as potential candidates in diverse applications, including as lubricants, catalytic supports, drug delivery, cancer treatment, and energy storage. Researchers have started synthesising CNSs from biowaste20,21 to overcome toxicity issues. These biomass-derived CNSs possess a high surface area, porosity, and spherical shape, which facilitate efficient heat transfer within a fluid and thus improve the thermal heat-transfer properties of materials.22 Studies have also reported the enhancement of the thermal conductivity (TC) using biomass-derived CNSs. Nevertheless, further investigation is required within this domain. The most crucial issue for the NFs is their stability, which can affect their thermal properties and commercialisation. In this case, biomass-derived CNSs are the best candidates regarding the stability of the NFs because they have good zeta potential values (nearly or more than ±30 mV).23 Many researchers have used different carbon nanomaterials to enhance the TC of NFs. Fig. 1 illustrates some previous studies that reported an enhancement of the TC, together with the percentages achieved, representing the enhancement in the TC of NFs compared to the base fluid.24–29
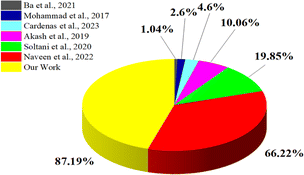 |
| | Fig. 1 Comparison of the TC enhancements of carbon-based nanofluids.24–29 | |
2. Experimental
2.1. Materials
The groundnut (Arachis hypogaea) skin samples were collected from southern India. The base fluid ethylene glycol (analytical grade) was procured from Fine Chem industries. Millipore distilled water was used for the water-based experiments. A quartz tube furnace from NoPo Technologies was used to synthesise the CNSs.
2.2. Synthesis of carbon material from biomass
The obtained samples were washed and dried overnight at 60 °C in an oven to remove the moisture content. Subsequently, the desiccated groundnut skin was pulverized into a finely textured powder and sifted using a laboratory sieve with a 60 μm dimension, yielding a consistently sized precursor powder.
The powder was accurately weighed as 5.0 g and put into a crucible made of silica. It was then heated in a tube furnace for about 1 h at 800 °C at a ramp rate of 10 °C every min in an N2 environment with a 150 cm3 min−1 flow rate. The obtained synthesised nanoparticles are henceforth called GN800 in this paper. Subsequently, the carbonised material was suspended in an ethanol solution after being thoroughly cleaned three times with distilled water. After that, the settled material was filtered, washed with distilled water, and dried overnight at 50 °C. The resultant substance was a fine black powder. Fig. 2 shows a schematic for the synthesis of the CNSs. The obtained powder was subjected to further characterisation, including XRD, FESEM-EDS, FTIR, Raman spectroscopy, and zeta potential measurements.
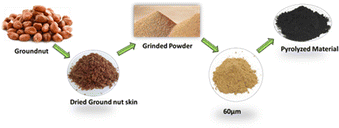 |
| | Fig. 2 Schematic representation of the synthesis of CNSs using a groundnut skin bio-precursor. | |
2.3. Characterization techniques
The nanoparticles' morphology was examined by FESEM. Furthermore, the elemental composition of the nanoparticles was investigated by EDS analysis, while FTIR spectroscopy, carried out using a Shimadzu IR Spirit-L instrument (Shimadzu, Germany), was used to determine the functionalities of the precursor and the NPs. The crystallographic nature of the NPs was determined using a Rigaku MiniFlex 600 system (Matsubara-cho, Tokyo). Raman spectroscopy was carried out using Raman spectrophotometer (Renishaw, United Kingdom) to determine the crystallinity and disorderness of the NPs. The thermal conductivity of the NFs was determined with a Hot Disk TPS 2500S instrument (Sweden). The zeta potential of the NPs was measured by dynamic light scattering using a Zen 3600 instrument (Malvern Instruments, UK) to determine the surface charge of the NPs. The rheological study was carried out using a TA Instruments HR-3 Discovery hybrid rheometer. Here, a 25 mm parallel plate geometry was equipped to measure the viscosity change with temperature in the 30–90 °C range at a heating rate of 5 °C min−1 with a constant shear rate of 170 s−1. Again, a 40 mm 1.011° cone plate (Peltier plate steel) was equipped with this rheometer to measure the viscosity change with the shear rate in the range of 20–140 S−1 at room temperature (25 °C).
2.4. Preparation of the nanofluid
In this study, nanofluids were prepared using a two-step method. The synthesised nanoparticles were suspended in ethylene glycol (EG) with different concentrations: 0.01, 0.02, 0.05, and 0.1 wt%. As depicted in Fig. 3, to prepare the water-based nanofluid, deionised (DI) water and ethylene glycol (EG) were mixed in a ratio of 60![[thin space (1/6-em)]](https://www.rsc.org/images/entities/char_2009.gif) :
:![[thin space (1/6-em)]](https://www.rsc.org/images/entities/char_2009.gif) 40, respectively. The resulting solution was stirred magnetically and subjected to sonication at a frequency of 20 kHz (bath sonicator). The temperature was maintained at 25 °C for a better dispersion of the nanoparticles. Eqn (1) was utilised to prepare the nanofluids at different weight fractions.
40, respectively. The resulting solution was stirred magnetically and subjected to sonication at a frequency of 20 kHz (bath sonicator). The temperature was maintained at 25 °C for a better dispersion of the nanoparticles. Eqn (1) was utilised to prepare the nanofluids at different weight fractions.| |  | (1) |
where Φ is the concentration of nanoparticles in wt%, Wnp is the weight of nanoparticles in mg, Vbf is the volume of the base fluid in ml, and ρbf is the density of the base fluid in mg m−3.
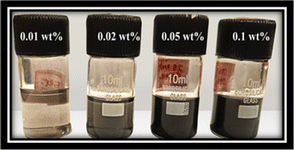 |
| | Fig. 3 Nanofluids (CNS + EG) bottles with different concentrations. | |
2.5. Measurement of the thermal conductivity of the NFs
The TC measurements of the nanofluids were performed using a thermal constant analyser (Hot Disk 2500 S, Sweden), which employs a transient plane source approach with an uncertainty precision of ±5. The Hot Disk model TPS 2500 S set-up is shown in Fig. 4a. The sensor, depicted in Fig. 4b, is the main component of the apparatus. It is made of a double spiral of thin Kapton submerged in the nanofluid and placed in a sample holder horizontally. The hot-disk sensor is positioned between the plane surfaces of two sample pieces in the transient plane source configuration. The suspensions are then probed with a Kapton-insulated probe. To determine the increase in temperature ΔT(τ) from the change in sensor resistance over time R(t), a constant electric current is applied to the sensor.| |  | (2) |
where R0 is the hot-disk resistance at the start of recording (starting resistance), α is the nickel foil's temperature coefficient of resistance, and| |  | (3) |
where t is the measurement time, θ is the characteristic time that depends on the sensor's parameters, a is the sensor radius, and λ is the sample's thermal diffusivity (m2 s−1).
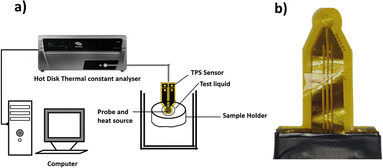 |
| | Fig. 4 (a) Experimental set-up of the Hot Disk thermal constants analyser. (b) TPS 7577 × 101 sensor. | |
Given that the conductive pattern is situated within the Y–Z plane of a coordinate system, the formula for the temperature increases at a specific point (y,z) at time t, resulting from an output of power per unit area Q, can be expressed as follows.
| |  | (4) |
where
c is the sample's specific heat (J kg
−1 K
−1), and
ρ is the material density (kg m
−3). The previous expression can be simplified by taking
λ(
t −
t′) =
σ2a2.
| |  | (5) |
where
λ =
κ/
ρc and
κ is the thermal conductivity in W m
−1 K
−1. An accurate solution of
eqn (5) is possible in the case of a disk shape consisting of
m concentric ring sources. The temperature rise is then:
| | | ΔT(τ) = P0(π3/2aκ)−1D(τ) | (6) |
where
P0 is the total output power and
D(
τ) is a geometric function given by the following expression:
| |  | (7) |
where
I0 represents the modified Bessel function and
m is the number of concentric ring sources. The thermal conductivity can be obtained by fitting the experimental data to the straight line provided by
eqn (5) and calculating the slope of the fitting line with
P0(
3/2aκ).
30
The average temperature difference between the bulk fluid around the sensor is shown in Fig. 5. This temperature difference can be utilised to calculate the fluid's thermal and diffusivity conductivity using eqn (5) and (7).
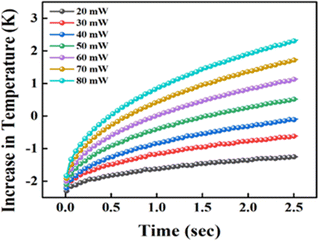 |
| | Fig. 5 Temperature vs. time for the TPS sensor 7577 × 101 immersed in NFs at different heating powers. | |
3. Empirical correlations/theory and equations
3.1. Thermal conductivity model for a spherical shape
Based on Maxwell's31 studies of conduction across heterogeneous media, previous researchers constructed their models of thermal conductivity. Maxwell's calculation of the effective thermal conductivity of a two-phase mixture with continuous and discontinuous phases gave the following equation:| |  | (8) |
where the thermal conductivities of the compelling medium, base fluid, and solid NPs are denoted by κeff, κbf, and κs, respectively.
The two hypotheses Maxwell used to create his model are listed below. The thermal conductivity in BFs and spherical NPs is influenced by the nanoparticles concentration, thereby impacting the overall thermal conductive properties. Following that, the discontinuous phase has a spherical shape. Since the particles are small (mesoporous), an organised nanolayer greatly influences the thermal conductivity of NFs. When the effective volume percentage of the interfacial layer is high, thermal conductivity can be raised. Yu and Choi32 adjusted the Maxwell model to account for the influence of nanolayers in calculating κeff, and they assumed a solid-like layer of thickness (h) that surrounds a spherical nanoparticle with a radius (r), resulting in a bigger particle with a radius (r + h). As a result, the alteration of eqn (8) leads to the following model for effective thermal conductivity:
| |  | (9) |
where
η =
h/
r is the ratio of the nanolayer thickness to the original particle radius and
κp is the thermal conductivity of the dispersed particle. The thermal conductivity ratio of NFs can be determined by the thermal conductivity of the base fluid, nanoparticles, and nanolayers, according to
eqn (9) above. In addition, the concentration, thickness, and form of the nanoparticles are also considered.
Eqn (9) offers a new direction for the development of next-generation coolants.
4. Results and discussion
4.1. Characterization studies for GN800
4.1.1 XRD.
As per the XRD studies, highly organised CNSs were found at a pyrolysis temperature of 800 °C, as depicted in Fig. 6a. A prominent carbon peak occurred at 23.2°, corresponding to the (002) plane for graphite (ICDD 10713739) with an interlayer d spacing of plane (002), i.e. d002 = 3.434 Å. The low-curvature graphite face seen in graphite could cause this peak. However, this peak indicates a graphitic structure and highly ordered CNSs. Another broad peak was observed at 43°, attributed to the (101) plane phase of diamond (ICDD 10750410) and demonstrated the existence of the graphite (111) phase.33
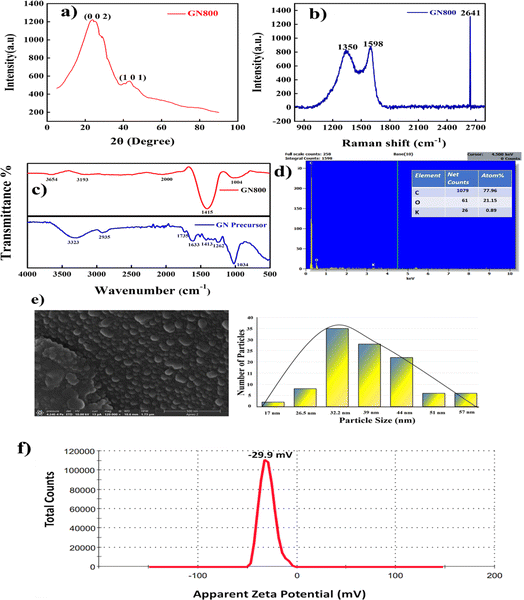 |
| | Fig. 6 Characterization of GN800. (a) XRD, (b) Raman spectra, (c) FTIR of the raw precursor and GN800, (d) EDS with elemental composition, (e) FESEM image and corresponding histogram, and (f) zeta potential. | |
4.1.2. Raman spectroscopy.
Two firm peaks in the greater frequency range (1000–3000 cm−1) of the Raman spectrum indicated the presence of carbon nanomaterials. Amorphous carbon, also known as disordered carbon, exhibits two peaks. These two peaks reveal the material's disordered structure. One of these is called the D peak and is located at 1356 cm−1, demonstrating the disordered nature of graphite that corresponds to the A1g mode (disordered induced peak), while the other peak seen at 1598 cm−1 is related to E2g phonon, which shows the formation of sp2 hybridised C![[double bond, length as m-dash]](https://www.rsc.org/images/entities/char_e001.gif) C bonds and demonstrates the graphitic nature of the resulting highly disordered carbon nanospheres, as shown in Fig. 6b. This peak is known as the graphite peak or G peak (sp2 bonding). Here, the broad D (sp3 bonding) band attributed to the vibrations of the carbon atoms with dangling bonds in the termination plane of disordered graphite indicated the hollow CNSs amorphous structure. The presence of the second-order signal at 2641 cm−1 was attributed to double resonance Raman scattering, which also verified the formation of C
C bonds and demonstrates the graphitic nature of the resulting highly disordered carbon nanospheres, as shown in Fig. 6b. This peak is known as the graphite peak or G peak (sp2 bonding). Here, the broad D (sp3 bonding) band attributed to the vibrations of the carbon atoms with dangling bonds in the termination plane of disordered graphite indicated the hollow CNSs amorphous structure. The presence of the second-order signal at 2641 cm−1 was attributed to double resonance Raman scattering, which also verified the formation of C![[double bond, length as m-dash]](https://www.rsc.org/images/entities/char_e001.gif) C bonds. Carbon's degree of disorder can be calculated as the integral of the intensities of the D-band peak to the G-band peak (ID/IG). The GN800 intensity ratio was found to be 0.84, which demonstrates the disorganised nature of the synthesised carbon nanospheres.34
C bonds. Carbon's degree of disorder can be calculated as the integral of the intensities of the D-band peak to the G-band peak (ID/IG). The GN800 intensity ratio was found to be 0.84, which demonstrates the disorganised nature of the synthesised carbon nanospheres.34
4.1.3. FTIR.
FTIR analysis was carried out on the raw precursor and pyrolysed GN800 CNS, as depicted in Fig. 6c. The peaks for the raw precursor were observed at 1034, 1262, and 1413 cm−1, which, as shown by the examination of the raw sample, could be attributed to the C–O–C glycosidic linkages of the hemicellulose and cellulose moieties. Striking vibrations occurred at 1633 cm−1 for lignin's conjugated carbonyl and 1735 cm−1 for hemicellulose's C![[double bond, length as m-dash]](https://www.rsc.org/images/entities/char_e001.gif) O stretching. The lignocellulosic components' alkaline and aromatic C–H bond vibrations could also be observed by the absorption peak at 2935 cm−1. The hydroxyl group (–OH stretching) of cellulose was represented by the broad peak at 3323 cm−1.35 Based on the FTIR analysis, the precursor was mostly composed of cellulose, hemicellulose, and lignocellulose, which shows it can be used as a carbon precursor to synthesise highly ordered carbon nanospheres. After the pyrolysis, the obtained CNSs showed different functional groups present in the CNSs. A small broad peak appeared around 3654 cm−1 corresponding to O–H stretching frequency, while the peak around 3193 cm−1 indicated C–H stretching, and the small broad peak at 2000 cm−1 corresponded to C
O stretching. The lignocellulosic components' alkaline and aromatic C–H bond vibrations could also be observed by the absorption peak at 2935 cm−1. The hydroxyl group (–OH stretching) of cellulose was represented by the broad peak at 3323 cm−1.35 Based on the FTIR analysis, the precursor was mostly composed of cellulose, hemicellulose, and lignocellulose, which shows it can be used as a carbon precursor to synthesise highly ordered carbon nanospheres. After the pyrolysis, the obtained CNSs showed different functional groups present in the CNSs. A small broad peak appeared around 3654 cm−1 corresponding to O–H stretching frequency, while the peak around 3193 cm−1 indicated C–H stretching, and the small broad peak at 2000 cm−1 corresponded to C![[double bond, length as m-dash]](https://www.rsc.org/images/entities/char_e001.gif) C
C![[double bond, length as m-dash]](https://www.rsc.org/images/entities/char_e001.gif) C stretching. Furthermore, there was a prominent peak around 1415 cm−1, which corresponded to O–H bending vibrations. Additionally, an identifiable peak was observed at 1004 cm−1 which corresponded to C
C stretching. Furthermore, there was a prominent peak around 1415 cm−1, which corresponded to O–H bending vibrations. Additionally, an identifiable peak was observed at 1004 cm−1 which corresponded to C![[double bond, length as m-dash]](https://www.rsc.org/images/entities/char_e001.gif) C bending.36 Other than the O–H moiety, no functional groups were apparent based on the data collected. This was due to the pyrolysis at high temperatures, which eliminated the majority of the volatile components.
C bending.36 Other than the O–H moiety, no functional groups were apparent based on the data collected. This was due to the pyrolysis at high temperatures, which eliminated the majority of the volatile components.
4.1.4. FESEM and EDS.
Fig. 6e shows the CNS had a well-defined spherical structure with a size range of 32 to 45 nm, confirming that the synthesised material exhibited a spherical morphology and was of nano-scale dimensions. Some of these smaller particles agglomerated and formed clusters larger than 57 nm. The particle shape often affects the packing structures that are critical to the transport properties, such as heat conductivity associated with particle connection and permeability linked to the pore connections. From the sizes of the NPs, we conclude that they were mesoporous in nature. Hamilton showed that κ rises when the particle sphericity decreases.37 From this, we can conclude that the spherical shape and size are essential characteristics of the increment of the TC. The EDS results revealed the presence of a high carbon content in the precursor, i.e. 77.96%, as depicted in Fig. 4d.
4.1.5. Zeta potential.
One of the critical factors in the electrostatic stabilisation of nanoparticles in a fluid is the surface charge on the particles' surfaces. In addition, the pH and surface charge of NFs greatly impact their thermal characteristics. The highly stable suspension of well-separated nanoparticles in the presence of significant surface charges increases the thermal conductivity. Conversely, in the presence of low surface charges, the development of aggregates and the settling of particles in the fluid reduces the thermal conductivity. For a stable nanosystem, a zeta potential of 30 mV is regarded as ideal regardless of the charge.38 The CNSs' zeta potential was found to be −29.9 mV, as depicted in Fig. 6f. The obtained results were close to −30 mV, so the zeta studies confirmed that the obtained NPs had a great dispersion and good stability.39
4.2. Effect of changing the heating power on the enhancement of the thermal conductivity
Understanding that a material's thermal conductivity directly impacts the extent of power required for achieving an appropriate overall temperature rise is crucial. When taking a measurement, the plane Hot Disk sensor was positioned between two sample pieces, with the plane surfaces of each piece facing the sensor. By providing an electrical current strong enough to raise the sensor's temperature and concurrently detect the resistance (temperature increase) as a function of time, as seen in Fig. 5, the Hot Disk sensor serves as both a heat source and a dynamic temperature sensor. Through the thermal cycling mode (pulses of current), the thermal deterioration of the CNSs could be reduced, resulting in a good repeatability of resistance. This could be attributed to the fact that an increase in the heating power leads to an increase in the total temperature, which increases the TC. The TC of the NFs was less at lower heating power due to the presence of thermal boundary resistance between the CNSs and due to the semi-ballistic transport in the CNSs.40
The thermal conductivities between 30 °C and 80 °C for pure ethylene glycol were obtained experimentally. A comparison between our data and those from the literature41,42 is displayed graphically in Fig. 7. As can be seen from the figure, both our experiments and the literature values41,42 are well matched. The slight differences between our values and the reported ones may be due to the variants of ethylene glycol obtained from the market. We typically use less expensive ethylene glycol for our studies and enhance its thermal conductivity by incorporating carbon nanospheres obtained from biomass. This approach makes the system more environmentally friendly, less toxic, cost-effective, and aligns with the Sustainable Development Goals.
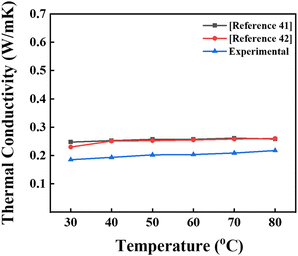 |
| | Fig. 7 Comparison of the thermal conductivity of ethylene glycol obtained in the present study and with values reported in the literature.41,42 | |
4.3. Optimization of the measurement and sonication time
To optimise the measurement time, the nanofluid's thermal conductivity (TC) was analysed at various time intervals, namely 2.5, 5, and 10 s, as shown in Fig. 8. The error bars in Fig. 10 represent thermal conductivity values within ±0.05% of the sample average for all the nanofluid samples, indicating the precision of the measurements. The results reveal that the TC values for 2.5 s were higher than those for 5 s and 10 s at 0.1 wt%. The experimental results indicate a consistent pattern of shorter measurement durations correlating with higher TC values. This trend was attributed to suppressing natural convection within the NFs and mitigating NP agglomeration. However, the abbreviated measurement periods may hinder the complete equilibration of the material boundaries, leading to notable influences from the boundary effects on the TC measurement.43 As the experimental results demonstrated optimal TC values at 2.5 s, this time was kept as a constant parameter for the subsequent studies (Table 1).
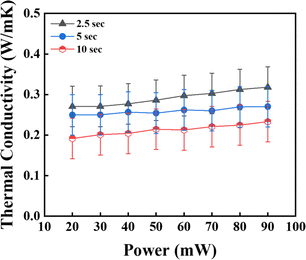 |
| | Fig. 8 Measurement time given to the sensor TPS 7577 × 101 for the measurement of TC at (a) 2.5 s, (b) 5 s, and (c) 10 s (error ± 0.05%). | |
Table 1 Comparative change in TC of various carbon-based NFs
| Carbon nanostructure |
Base fluid |
Temperature range |
Increment (%) of TC |
Reference |
| MWCNT |
DI water/EG |
25 °C to 50 °C |
4.4% |
29
|
| Graphene |
DI water/EG |
— |
19.6% |
40
|
| CNS |
EG |
20 °C to 60 °C |
4.6% |
44
|
| MWCNT |
DI water/EG |
20 °C to 50 °C |
7.7% |
45
|
| Carbon dot |
DI water/EG |
20 °C to 80 °C |
21% |
46
|
| CNT |
DI water |
25 °C to 80 °C |
36% |
47
|
| GN800 |
DI water and EG (60![[thin space (1/6-em)]](https://www.rsc.org/images/entities/char_2009.gif) : :![[thin space (1/6-em)]](https://www.rsc.org/images/entities/char_2009.gif) 40) 40) |
30 °C to 80 °C |
46%
|
This work
|
| GN800 |
EG |
30 °C to 80 °C |
175%
|
This work
|
This study investigated the effect of sonication for a better dispersion of NPs in the base fluid. The NFs were prepared for this experiment by dispersing 0.1 wt% of CNSs under sonication for 10, 20, 30, 90, and 180 min, respectively, for good dispersion without adding surfactants. With a frequency of 20k Hz (bath sonicator), the temperature was maintained at 25 °C. The TC value for the sample that had undergone 180 min of sonication was higher than that for the samples subjected to 10, 20, 30, and 90 min sonication, as shown in Fig. 9. The experimental results showed that a better colloidal dispersion of nanofluid resulted from a longer sonication period. This was attributed to the extended sonication duration, which enhances the dispersion by effectively disrupting the van der Waals forces among the CNSs using high-frequency wavelengths. Thus, a more mean-free path could be generated by this improved dispersion, which promotes effective heat transmission. Additionally, a higher TC was associated with this increased dispersion.48 Based on the conclusions drawn from the experimental findings, sonication for 180 min resulted in the most beneficial TC properties of the NFs. As a result, the 180 min sonication time was used as the standard operating practice during further investigations.
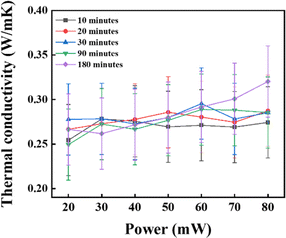 |
| | Fig. 9 Impact of the sonication duration on thermal conductivity enhancement. | |
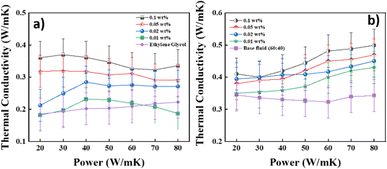 |
| | Fig. 10 Thermal conductivity of the BFs. (a) EG and (b) DI![[thin space (1/6-em)]](https://www.rsc.org/images/entities/char_2009.gif) : :![[thin space (1/6-em)]](https://www.rsc.org/images/entities/char_2009.gif) EG (60 EG (60![[thin space (1/6-em)]](https://www.rsc.org/images/entities/char_2009.gif) : :![[thin space (1/6-em)]](https://www.rsc.org/images/entities/char_2009.gif) 40), at different concentrations (the error bars represent the standard deviation of thermal conductivity measurements, with an error margin of ±0.05%). 40), at different concentrations (the error bars represent the standard deviation of thermal conductivity measurements, with an error margin of ±0.05%). | |
4.4. Effect of changes in the concentration of NPs on the thermal conductivity
According to Maxwell31 and Bruggeman's49 model predictions, the thermal conductivity of a nanofluid increases with increasing the particle concentration. The experiments were performed at room temperature with a heating power ranging from 20 mW to 80 mW with a measurement time of 2.5 s. Initially, the examinations were carried out using pure water as a reference fluid to establish a basis for contrasting the attributes of the base fluid and nanofluid. This step also served to validate the precision of the instrumentation. The error precision was ±0.05%. The thermal conductivity enhancement of the nanofluids with EG as the base fluid and DI–EG in a 60![[thin space (1/6-em)]](https://www.rsc.org/images/entities/char_2009.gif) :
:![[thin space (1/6-em)]](https://www.rsc.org/images/entities/char_2009.gif) 40 ratio as a base fluid, with the nanoparticles, is shown in Fig. 10a and b, respectively. For EG as the base fluid, the experimental results showed that the highest value of the TC with a heating power 40 mW at a concentration of 0.01 wt% was 0.23 W m−1 K−1; for 0.02 wt%, the highest TC value was 0.28 W m−1 K−1; for 0.05 wt%, the highest TC value was 0.31 W m−1 K−1; and for 0.1 wt%, the TC value was 0.37 W m−1 K−1. Additionally, experiments were conducted using DI–EG in a 60
40 ratio as a base fluid, with the nanoparticles, is shown in Fig. 10a and b, respectively. For EG as the base fluid, the experimental results showed that the highest value of the TC with a heating power 40 mW at a concentration of 0.01 wt% was 0.23 W m−1 K−1; for 0.02 wt%, the highest TC value was 0.28 W m−1 K−1; for 0.05 wt%, the highest TC value was 0.31 W m−1 K−1; and for 0.1 wt%, the TC value was 0.37 W m−1 K−1. Additionally, experiments were conducted using DI–EG in a 60![[thin space (1/6-em)]](https://www.rsc.org/images/entities/char_2009.gif) :
:![[thin space (1/6-em)]](https://www.rsc.org/images/entities/char_2009.gif) 40 ratio. Water was chosen due to its high thermal conductivity, as elevated temperatures enhance the ion mobility, consequently increasing thermal conduction. These DI–EG mixtures in 60
40 ratio. Water was chosen due to its high thermal conductivity, as elevated temperatures enhance the ion mobility, consequently increasing thermal conduction. These DI–EG mixtures in 60![[thin space (1/6-em)]](https://www.rsc.org/images/entities/char_2009.gif) :
:![[thin space (1/6-em)]](https://www.rsc.org/images/entities/char_2009.gif) 40 NFs showed good stability. The results in Fig. 9b indicate that the nanofluid concentration of 0.1 wt% exhibited a TC value of 0.50 W m−1 K−1 at a power of 80 mW. In contrast, the 0.05, 0.02, and 0.01 wt% concentrations showed values of 0.46, 0.45, and 0.43 W m−1 K−1, respectively. Due to the Brownian motion of NPs, the TC values increased as the NP concentration increased. The increased nanoparticle concentration in a particular volume of the base fluid may be the cause for this increase. Due to the high interaction between the atoms of the fluid and the wall, the thermal conductivity of the nanofluid typically rises when the volume fraction is raised. As the concentration increases, an interfacial layer forms, consisting of liquid molecules arranged in an orderly manner around the surface of nanoparticles due to strong contact between the fluid and particles. This layer is commonly referred to as a nanolayer.50 One potential heat-transfer method for the thermal conductivity of NFs is heat transfer through the interfacial layer at the particle-fluid interface. The augmentation mechanism might be due to the material-to-material interface, nanoparticle clusters, and higher concentrations of the nanoparticles exhibiting Brownian motion. Brownian motion raises the thermal conductivity by causing microconvection in the nearby liquid molecules. Also, it was confirmed by Raman that the synthesised CNSs had sp3 bonding attributed to diamond-like carbon (DLC), which is a metastable form of α-C containing a significant fraction of sp3 bonds.51 The enhancement in the TC values was calculated using eqn (10).
40 NFs showed good stability. The results in Fig. 9b indicate that the nanofluid concentration of 0.1 wt% exhibited a TC value of 0.50 W m−1 K−1 at a power of 80 mW. In contrast, the 0.05, 0.02, and 0.01 wt% concentrations showed values of 0.46, 0.45, and 0.43 W m−1 K−1, respectively. Due to the Brownian motion of NPs, the TC values increased as the NP concentration increased. The increased nanoparticle concentration in a particular volume of the base fluid may be the cause for this increase. Due to the high interaction between the atoms of the fluid and the wall, the thermal conductivity of the nanofluid typically rises when the volume fraction is raised. As the concentration increases, an interfacial layer forms, consisting of liquid molecules arranged in an orderly manner around the surface of nanoparticles due to strong contact between the fluid and particles. This layer is commonly referred to as a nanolayer.50 One potential heat-transfer method for the thermal conductivity of NFs is heat transfer through the interfacial layer at the particle-fluid interface. The augmentation mechanism might be due to the material-to-material interface, nanoparticle clusters, and higher concentrations of the nanoparticles exhibiting Brownian motion. Brownian motion raises the thermal conductivity by causing microconvection in the nearby liquid molecules. Also, it was confirmed by Raman that the synthesised CNSs had sp3 bonding attributed to diamond-like carbon (DLC), which is a metastable form of α-C containing a significant fraction of sp3 bonds.51 The enhancement in the TC values was calculated using eqn (10).| |  | (10) |
where κnf and κbf stand for the TCs of the nanofluid and base fluid, respectively.
4.5. Effect of temperature on the thermal conductivity
This study measured the thermal conductivity of the base fluid and CNSs nanofluid at various concentrations using a Hot Disk technique via the operating principle of the transient hot-wire method. The thermal conductivity ratio of the EG-CNSs nanofluid versus temperature is shown in Fig. 11, with different concentrations. This figure shows the enhancement of the thermal conductivity of the biomass-derived CNSs-based NFs with temperature. The experiment was performed at a temperature between 30 °C and 80 °C. The thermal conductivity values within ±0.05% of the sample average for all nanofluids samples are shown via error bars in Fig. 11. It can be seen that for the 0.01 wt% concentration, the thermal conductivity value increased from 0.22 to 0.38 W m−1 K−1 as the temperature rose from 30 °C to 80 °C, signifying an increase of 77%. For the 0.02 wt% concentration, the thermal conductivity value increased from 0.22 to 0.46 W m−1 K−1 as the temperature rose from 30 °C to 80 °C, signifying an increase of 111.49%. For the 0.05 wt% concentration, the thermal conductivity value increased from 0.22 to 0.52 W m−1 K−1 as the temperature rose from 30 °C to 80 °C, signifying an increase of 139.67%. For the 0.1 wt% concentration, the thermal conductivity ratio increased from 0.23 to 0.60 W m−1 K−1 as the temperature rose from 30 °C to 80 °C, signifying an increase of 175%. Interestingly, the enhancement significantly increased from 30 °C to 80 °C for all concentrations used in the experiment. Fig. 12 shows the increment percentage of the TC for the concentrations 0.01, 0.02, 0.05, and 0.1 wt% with the temperature ranging from 30 °C to 80 °C with a comparison between the base fluid EG and a commercially available coolant with a biomass-derived nanofluid. The calculation was done using the formula shown in eqn (11).| |  | (11) |
where ϕ is the increment in the TC value of the nanofluid at the calculated temperature and κcnf is the TC value for the commercially available coolant values at the calculated temperature. With an elevation in temperature and concentration of CNSs, there was a concurrent increase in thermal conductivity. Fig. 12a shows that the highest TC value was achieved for the 0.1 wt% concentration at 80 °C, where the TC increment was up to 200.05%. Hence, it could be concluded that the augmentation of the thermal conductivity was contingent upon the nanoparticle concentration, and notably, this enhancement rate became more pronounced as the temperature rises. An increase in microconvection was the reason for this. Brownian motion theory can be used to analyse the pattern of the thermal conductivity enhancement. Here, the improvement in thermal conductivity was supported by the rise in Brownian diffusion brought on by the increased particle collisions at higher temperatures. Another important factor is the small mobility of suspended nanoparticles caused by the electrostatic, van der Waals, and Brownian forces. Furthermore, at higher temperatures, more particles are scattered in the base fluid, and the agglomeration of nanoparticles could be broken down more efficiently. Fig. 12b shows a similar concurrent increment for the commercially available coolant.
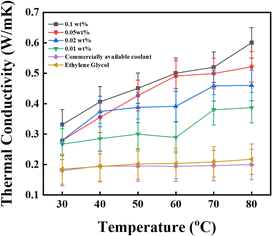 |
| | Fig. 11 Effect of temperature on the nanofluid at different concentrations (error ± 0.05%). | |
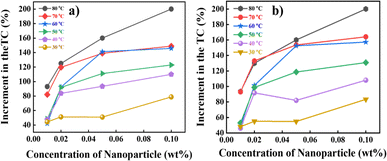 |
| | Fig. 12 Effective increment in the values of the TC with respect to (a) ethylene glycol and (b) a commercially available coolant. | |
4.6. Effect of the temperature and concentration of the NPs on the viscosity
The viscosity of the prepared CNS-EG nanofluids at concentrations of 0.01, 0.02, 0.05, and 0.1 wt% was measured at various temperatures ranging from 30 °C to 90 °C. Throughout the experiment, the shear rate remained constant.
One significant transit characteristic that affects the pressure drop is the viscosity. It is evident from Fig. 13 that the viscosities of the CNS-EG nanofluids were higher than that of the base fluid as the concentration of nanoparticles (NPs) increased, reaching up to 114% for higher concentrations at 30 °C, and decreased to 18% as the temperature increased to 90 °C, as shown in Fig. 13. This is because rising temperatures weaken the adhesion forces between molecules and particles, as well as the reduction in average intermolecular forces.52 As a result, the viscosity reduces with temperature. From Fig. 13, it can be seen that the viscosity of the nanofluid increased with the increase in CNS concentration. The nanofluid with 0.1 wt% showed a higher viscosity, 0.01569 Pa s−1, than the 0.01 wt% concentration, which showed 0.00699 Pa s−1. This might result from the increase in the concentration of NPs leading to the increase in liquid flow resistance and also because of the large surface area of CNS.53 The data presented in Fig. 13 indicates that the rise in viscosity due to the elevated concentration of nanoparticles was comparatively lower at higher temperatures. This phenomenon may be attributed to the increased separation between the molecules of the base fluid at elevated temperatures.54,55
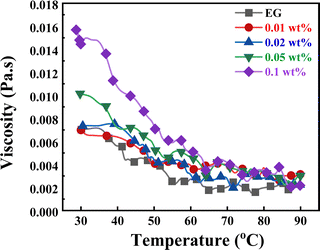 |
| | Fig. 13 Effect of temperature on CNS nanofluid viscosity at different NP concentrations with a constant share rate of 170 S−1). | |
4.7. Effect of shear rate on the viscosity
This section discusses the impact of changing the shear rate on the viscosity of nanofluids. Fig. 14 shows the rheological behaviour of the CNS-EG nanofluids samples at room temperature with a volume fraction of 0.001 wt% to 0.1 wt%. The error precision was ±0.05%. As observed, there was a non-linear relation between the shear stress and shear rate, indicating a non-Newtonian behaviour in the produced nanofluids, most evident for the concentration of 0.1 wt%. In addition, these nanofluids behaved as a shear-thinning fluid in comparison to the base fluid (EG).
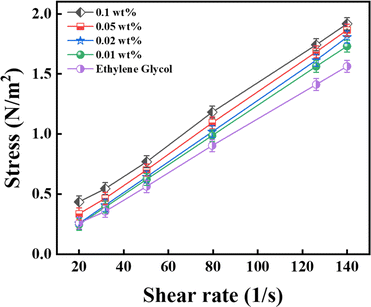 |
| | Fig. 14 Non-Newtonian behaviour of the nanofluid at a constant temperature of 26 °C (error ± 0.05%). | |
5. Qualitative comparison of the experimental values of the thermophysical quantities with those obtained by mixing theory and the phenomenological relations
Comparison studies were carried out by Pradeep et al. to reconcile the experimental and thermophysical quantities of nanofluids using mixing theory and phenomenological relations in their work.56
The thermophysical quantities of the nanofluid could be obtained from those of ethylene glycol and GN800, as shown in Tables 2 and 3.
Table 2 Thermophysical properties of GN800 nanoparticles
| NP |
Density (ρGN800) kg m−3 |
Thermal conductivity (κGN800) W m−1 K−1 |
Thermal expansion coefficient (βGN800 × 10−5) K−1 |
Specific heat (cGN800) (J kg−1 K−1) |
Thermal diffusivity (λGN800) m2 s−1 |
| GN800 |
500 |
1.87 |
0.84 |
222.6 |
0.84 × 10⁻⁵ |
Table 3 Thermal properties of the base fluid EG56
| Base fluid |
Viscosity (μEG) Pa s−1 |
Density (ρGN800) kg m−3 |
Thermal conductivity (κGN800) W m−1 K−1 |
Thermal expansion coefficient (βGN800 × 10−5) K−1 |
Specific heat (cGN800) (J kg−1 K−1) |
| Ethylene glycol |
0.01570 |
1114.4 |
0.2520 |
65.00 |
2415 |
5.1. Mixing theory
The mixing theory of nanofluids explains the behaviour of nanofluids, which are colloidal suspensions of nanoparticles dispersed in a base fluid and usually smaller than 100 nm in size. According to this hypothesis, the nanofluid is a two-phase system comprising the dispersed phase (the nanoparticles) and the continuous phase (the base fluid), and can be expressed by the following relation:| |  | (12) |
where ρnf, ρEG, and ρnp are the densities of the nanofluid, ethylene glycol, and nanoparticles, respectively.| |  | (13) |
5.2. Phenomenological relations
The phenomenological relations are depicted in the following equation:| |  | (14) |
where μnf and μEG are the viscosities of the nanofluid and ethylene glycol.| |  | (15) |
In the above expression, subscripts EG and GN800 pertain to ethylene glycol, GN800. Next, the thermophysical values were calculated using eqn (16).
| |  | (16) |
On considering appropriate values from Tables 2 and 3 and using them in the above expression, thermotical estimates of the thermophysical values were calculated and are documented in S1 (ESI†) along with the values measured experimentally. The data presented shows both the theoretical and experimental values for a range of thermophysical parameters at varying wt% concentrations of a nanofluid, including the viscosity, density, thermal conductivity, and thermal diffusivity. Analysis reveals that, for all concentration levels, there was an impressive alignment between the theoretical and experimental results. According to Fig. 15, this congruence shows that the observed results from the experimental measurements and the predictions made from the theoretical models were highly consistent, with errors of ±0.02%, ±5%, ±0.3%, and ±0.02% for the thermal conductivity, density, thermal diffusivity, and viscosity, respectively. This pattern holds true at different concentrations, supporting the validity of the theoretical model used to calculate these thermophysical characteristics. Such agreement between the experimental and theoretical data highlights the theoretical framework's practical value in understanding and interpreting the behaviour of the substance under study and strengthening trust in its forecasting capacities.
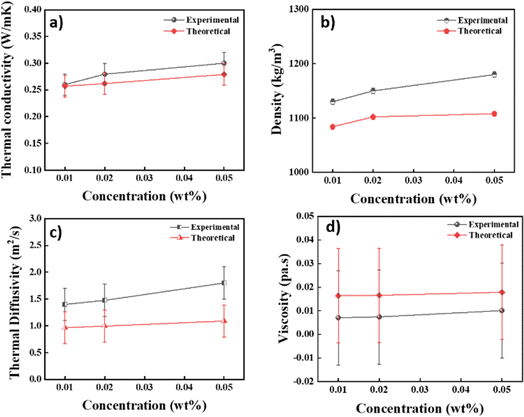 |
| | Fig. 15 Qualitative comparison of the theoretical and experimental data. (a) Thermal conductivity (error ± 0.02%), (b) density (error ± 5%), (c) thermal diffusivity (error ± 0.3%) and (d) viscosity (error ± 0.02%). | |
6. Conclusion
The present investigation dealt with the synthesis, characterisation, and thermal conductivity analysis of biomass-derived CNSs from groundnut skin (Arachis hypogaea) and EG-based (CNS-EG) and DI water-based (DI-EG) NFs. The primary objective of this research was to produce NFs with remarkable stability, satisfactory heat-transmission properties, cost-effectiveness, and environmental compatibility with changes in temperature and concentrations. The nanofluid was prepared via a two-step method. The synthesised CNSs were characterised by XRD, FTIR, FESEM-EDS, and Raman spectroscopy, together with elemental composition and zeta potential analyses. Optimization tests were carried out for the measurement and setting of the appropriate time and sonication. Further, the thermal conductivities of the nanoparticles with concentrations of 0.01, 0.02, 0.05, and 0.1 wt% were measured at heating powers between 20 mW and 80 mW and temperatures between 30 °C and 80 °C. The TC values were found to be improved for the CNS-based NFs compared to the base fluid (EG). With the increase in concentration and temperature, an enhancement in TC values was observed. The CNS-EG-based NFs showed they may be useful in medium-temperature applications because of the increased thermal conductivity with temperature. Furthermore, the viscosity was increased by 114% at 30 °C compared to the base fluid, and then decreased to 18% as the temperature was increased to 80 °C, also compared to the base fluid. The experimental findings demonstrated a notable qualitative alignment with the theoretical predictions. However, this is the first study using biomass-derived CNSs. This work promotes a sustainability-driven approach, emphasising the potential of converting waste materials like groundnut skin into valuable resources, thereby contributing to the principles of waste to wealth and environmental stewardship. However, further research needs to be carried out on the effects of changes in the size, shape, and surface area of the NPs and other parameters.
Data availability
The data supporting this article have been included as part of the ESI.†
Conflicts of interest
There are no conflicts to declare.
Acknowledgements
One of the authors, Kiran Bijapur, would like to thank the government of Karnataka for providing PhD scholarship with application number 2022PHD1516518. One of the author GH would like to thank Centre for Research projects, CHRIST (Deemed to be University) for providing Seed money with the file number SMSS-2214.
References
- N. A. C. Sidik, H. A. Mohammed, O. A. Alawi and S. Samion, Int. Commun. Heat Mass Transfer, 2014, 54, 115–125 CrossRef CAS.
- A. Hemmati-Sarapardeh, A. Varamesh, M. N. Amar, M. M. Husein and M. Dong, Int. Commun. Heat Mass Transfer, 2020, 118, 104825 CrossRef CAS.
- A. N. Omrani, E. Esmaeilzadeh, M. Jafari and A. Behzadmehr, Diamond Relat. Mater., 2019, 93, 96–104 CrossRef CAS.
- M. Jamei, R. Pourrajab, I. Ahmadianfar and A. Noghrehabadi, Int. Commun. Heat Mass Transfer, 2020, 116, 104624 CrossRef CAS.
- X. Zhao, X. Han, Y. Yao and J. Huang, Energy, 2022, 238, 122040 CrossRef CAS.
- B. Bakthavatchalam, K. Habib, C. D. Wilfred, R. Saidur and B. B. Saha, J. Therm. Anal. Calorim., 2022, 147, 393–408 CrossRef CAS.
- W. Fan and F. Zhong, Thermochim. Acta, 2022, 712, 179229 CrossRef CAS.
- M. Hemmat Esfe, S. Alidoust and D. Toghraie, Mater. Today Commun., 2023, 34, 105411 CrossRef CAS.
- A. M. Mirsaeidi and F. Yousefi, J. Therm. Anal. Calorim., 2021, 143, 351–361 CrossRef CAS.
- D. Dhinesh Kumar and A. Valan Arasu, Renewable Sustainable Energy Rev., 2018, 81, 1669–1689 CrossRef.
- A. Hilo, A. R. A. Talib, S. R. Nfawa, M. T. H. Sultan, M. F. A. Hamid and M. I. Nadiir Bheekhun, J. Adv. Res. Fluid Mech. Therm. Sci., 2019, 55, 74–87 Search PubMed.
-
V. Molahalli, A. Shetty, A. Sharma, K. Bijapur, G. Soman and G. Hegde, in Nanoparticles and Plant–Microbe Interactions, ed. S. Seena, A. Rai and S. Kumar, Academic Press, 2023, pp. 35–68 Search PubMed.
- M. Pavía, K. Alajami, P. Estellé, A. Desforges and B. Vigolo, Adv. Colloid Interface Sci., 2021, 294, 102452 CrossRef PubMed.
- K. Bijapur, V. Molahalli, A. Shetty, A. Toghan, P. De Padova and G. Hegde, NATO Adv. Sci. Inst. Ser., Ser. E, 2023, 13, 10107 CAS.
- S. A. Afolalu, O. M. Ikumapayi, T. S. Ogedengbe, M. E. Emetere, T.-C. Jen and E. T. Akinlabi, Adv. Technol. Mater. Mater. Process. J., 2023, 1–15 Search PubMed.
-
Y. Singh, V. Strezov and P. Negi, Biowaste and Biomass in Biofuel Applications, CRC Press, 2023 Search PubMed.
- S. Yallappa, D. R. Deepthi, S. Yashaswini, R. Hamsanandini, M. Chandraprasad, S. Ashok Kumar and G. Hegde, Nano-Struct. Nano-Objects, 2017, 12, 84–90 CrossRef CAS.
- Q. Wang, S. Liu, H. Wang, J. Zhu and Y. Yang, Colloids Surf., A, 2015, 482, 371–377 CrossRef CAS.
- D.-H. Yu and Z.-Z. He, Appl. Energy, 2019, 247, 503–516 CrossRef CAS.
- M. Mehmandoust, G. Li and N. Erk, Ind. Eng. Chem. Res., 2023, 62, 4628–4635 CrossRef CAS.
- Y. Wang, M. Zhang, X. Shen, H. Wang, H. Wang, K. Xia, Z. Yin and Y. Zhang, Small, 2021, 17, e2008079 CrossRef PubMed.
- K. Yu, J. Wang, X. Wang, J. Liang and C. Liang, Mater. Chem. Phys., 2020, 243, 122644 CrossRef CAS.
-
S. Hegde, A. Kumar and G. Hegde, in ACS Symposium Series, American Chemical Society, Washington, DC, 2020, pp. 393–420 Search PubMed.
- T. L. Ba, M. Bohus, I. E. Lukács, S. Wongwises, G. Gróf, K. Hernadi and I. M. Szilágyi, Nanomaterials, 2021, 11(3), 608 CrossRef PubMed.
- F. Soltani, D. Toghraie and A. Karimipour, Powder Technol., 2020, 371, 37–44 CrossRef CAS.
- A. R. Akash, A. Pattamatta and S. K. Das, J. Enhanced Heat Transfer, 2016, 26(4), 345–363 CrossRef.
- N. S. Naveen and P. S. Kishore, J. Dispersion Sci. Technol., 2022, 43, 1–13 CrossRef CAS.
- M. Hemmat Esfe, S. Esfandeh, S. Saedodin and H. Rostamian, Appl. Therm. Eng., 2017, 125, 673–685 CrossRef CAS.
- E. M. Cardenas Contreras and E. P. Bandarra Filho, Appl. Therm. Eng., 2022, 207, 118149 CrossRef CAS.
- X. F. Li, D. S. Zhu, X. J. Wang, N. Wang, J. W. Gao and H. Li, Thermochim. Acta, 2008, 469, 98–103 CrossRef CAS.
-
J. C. Maxwell, A Treatise on Electricity and Magnetism Unabridged, Dover, 1954 Search PubMed.
- W. Yu and S. U. S. Choi, J. Nanopart. Res., 2003, 5, 167–171 CrossRef CAS.
- M. Panchal, G. Raghavendra, S. Ojha, M. Omprakash and S. K. Acharya, Mater. Res. Express, 2019, 6, 115613 CrossRef.
- S. Supriya, A. Divyashree, S. Yallappa and G. Hegde, Mater. Today, 2018, 5, 2907–2911 CAS.
- S. Supriya, G. Sriram, Z. Ngaini, C. Kavitha, M. Kurkuri, I. P. De Padova and G. Hegde, Waste Biomass Valorization, 2020, 11, 3821–3831 CrossRef CAS.
- R. L. Hamilton and O. K. Crosser, Ind. Eng. Chem. Fundam., 1962, 1, 187–191 CrossRef CAS.
- D. Song, D. Jing, W. Ma and X. Zhang, J. Appl. Phys., 2019, 125, 015103 CrossRef.
- J. Lück and A. Latz, Phys. Chem. Chem. Phys., 2018, 20, 27804–27821 RSC.
- J. Park, M. F. P. Bifano and V. Prakash, J. Appl. Phys., 2013, 113, 034312 CrossRef.
- M. Bohus, T. L. Ba, K. Hernadi, G. Gróf, Z. Kónya, Z. Erdélyi, B. Parditka, T. Igricz and I. M. Szilágyi, Nanomaterials, 2022, 12(13), 2226 CrossRef CAS PubMed.
- J. R. V. Peñas, J. M. Ortiz de Zárate and M. Khayet, J. Appl. Phys., 2008, 104, 044314 CrossRef.
- M. Afrand, Appl. Therm. Eng., 2017, 110, 1111–1119 CrossRef CAS.
- R. J. Warzoha and A. S. Fleischer, Int. J. Heat Mass Transfer, 2014, 71, 790–807 CrossRef.
- G. A. Oliveira, E. M. Cardenas Contreras and E. P. Bandarra Filho, J. Braz. Soc. Mech. Sci. Eng., 2021, 43, 140 CrossRef CAS.
- S. Nawaz, H. Babar, H. M. Ali, M. U. Sajid, M. M. Janjua, Z. Said, A. K. Tiwari, L. Syam Sundar and C. Li, Appl. Therm. Eng., 2022, 206, 118085 CrossRef CAS.
- S. Askari, E. Ettefaghi, A. Rashidi, A. Seif, J. A. Rudd, J. A. Alonso and S. Khodabakhshi, Energy Rep., 2021, 7, 4222–4234 CrossRef.
- H. Zhang, S. Yan, H. Gao, X. Yuan, T. Ming, M. H. Ahmadi and X. Zhao, Int. Commun. Heat Mass Transfer, 2021, 127, 105526 CrossRef CAS.
- Z. Li, R. Kalbasi, Q. Nguyen and M. Afrand, Powder Technol., 2020, 367, 464–473 CrossRef.
- D. A. G. Bruggeman, Ann. Phys., 1935, 416, 636–664 CrossRef.
- S. Rostami, R. Kalbasi, M. Talebkeikhah and A. S. Goldanlou, J. Therm. Anal. Calorim., 2021, 143, 1701–1712 CrossRef CAS.
- J. Robertson, Mater. Sci. Eng., R, 2002, 37, 129–281 CrossRef.
- M. Kole and T. K. Dey, Int. J. Therm. Sci., 2011, 50, 1741–1747 CrossRef CAS.
- T. Yiamsawas, A. S. Dalkilic, O. Mahian and S. Wongwises, J. Dispersion Sci. Technol., 2013, 34, 1697–1703 CrossRef CAS.
- S. Ansari, T. Hussain, S. M. Yahya, P. Chaturvedi and N. Sardar, J. Nanofluids, 2018, 7, 1075–1080 CrossRef.
- L. Wang, H. Chen and S. Witharana, Recent Pat. Nanotechnol., 2013, 7, 232–246 CrossRef CAS PubMed.
- P. G. Siddheshwar, C. Kanchana, Y. Kakimoto and A. Nakayama, J. Heat Transfer, 2016, 139, 012402 CrossRef.
|
| This journal is © The Royal Society of Chemistry 2024 |
Click here to see how this site uses Cookies. View our privacy policy here.  Open Access Article
 ab,
Samir
Mandal
c,
P. G.
Siddheshwar
 d,
Suryasarathi
Bose
 c and
Gurumurthy
Hegde
 *ab
*ab
![[thin space (1/6-em)]](https://www.rsc.org/images/entities/char_2009.gif) :
:![[thin space (1/6-em)]](https://www.rsc.org/images/entities/char_2009.gif) 40 mixture of deionized water (DI) and EG. Optimization studies were performed by varying the stirring and measurement times to improve TC values. The results showed that when a power source of 40 mW was applied at a high concentration of nanoparticles (i.e., 0.1 wt%), there was a 91.9% increment in thermal conductivity (TC) compared to the base fluid EG. DI-EG-based nanofluids (NFs) exhibited enhancements of up to 45% compared to the base fluid DI-EG (60
40 mixture of deionized water (DI) and EG. Optimization studies were performed by varying the stirring and measurement times to improve TC values. The results showed that when a power source of 40 mW was applied at a high concentration of nanoparticles (i.e., 0.1 wt%), there was a 91.9% increment in thermal conductivity (TC) compared to the base fluid EG. DI-EG-based nanofluids (NFs) exhibited enhancements of up to 45% compared to the base fluid DI-EG (60![[thin space (1/6-em)]](https://www.rsc.org/images/entities/char_2009.gif) :
:![[thin space (1/6-em)]](https://www.rsc.org/images/entities/char_2009.gif) 40), with a heating power of 80 mW and concentration of 0.1 wt%. These results demonstrated significant TC improvements with NP incorporation. Further experiments were performed by varying the temperature in the range of 30–80 °C with readings taken for every 10 °C increase, which showed a direct relation with the TC values. At 80 °C, EG-based NFs showed increments of 77%, 111.49%, 139.67% and 175% at 0.01, 0.02, 0.05 and 0.1 wt% concentrations of NPs, respectively. It was also found that with the increase in the concentration of NPs, viscosity increased, whereas an increase in the temperature led to a decrease in viscosity. The CNS nanofluid exhibited a Newtonian behaviour with the nanoparticle concentration and temperature, resulting in an approximately 114% enhancement compared to the base fluid when the concentration of CNSs was 0.1 wt% at 30 °C but decreased by up to 18% when the temperature was increased to 90 °C. Using appropriate mathematical models for assessing thermophysical quantities, it was discovered that the model values and experimental values correspond reasonably well. Our method thus validates our experimental results and deepens the understanding of the mechanisms behind enhancing thermal conductivity in biomass-derived nanofluids. In summary, our work advances sustainable nanomaterial synthesis, providing a new solution for boosting thermal conductivity while maintaining environmental integrity, thereby inspiring further research and innovation in this field.
40), with a heating power of 80 mW and concentration of 0.1 wt%. These results demonstrated significant TC improvements with NP incorporation. Further experiments were performed by varying the temperature in the range of 30–80 °C with readings taken for every 10 °C increase, which showed a direct relation with the TC values. At 80 °C, EG-based NFs showed increments of 77%, 111.49%, 139.67% and 175% at 0.01, 0.02, 0.05 and 0.1 wt% concentrations of NPs, respectively. It was also found that with the increase in the concentration of NPs, viscosity increased, whereas an increase in the temperature led to a decrease in viscosity. The CNS nanofluid exhibited a Newtonian behaviour with the nanoparticle concentration and temperature, resulting in an approximately 114% enhancement compared to the base fluid when the concentration of CNSs was 0.1 wt% at 30 °C but decreased by up to 18% when the temperature was increased to 90 °C. Using appropriate mathematical models for assessing thermophysical quantities, it was discovered that the model values and experimental values correspond reasonably well. Our method thus validates our experimental results and deepens the understanding of the mechanisms behind enhancing thermal conductivity in biomass-derived nanofluids. In summary, our work advances sustainable nanomaterial synthesis, providing a new solution for boosting thermal conductivity while maintaining environmental integrity, thereby inspiring further research and innovation in this field.
![[thin space (1/6-em)]](https://www.rsc.org/images/entities/char_2009.gif) :
:![[thin space (1/6-em)]](https://www.rsc.org/images/entities/char_2009.gif) 40, respectively. The resulting solution was stirred magnetically and subjected to sonication at a frequency of 20 kHz (bath sonicator). The temperature was maintained at 25 °C for a better dispersion of the nanoparticles. Eqn (1) was utilised to prepare the nanofluids at different weight fractions.
40, respectively. The resulting solution was stirred magnetically and subjected to sonication at a frequency of 20 kHz (bath sonicator). The temperature was maintained at 25 °C for a better dispersion of the nanoparticles. Eqn (1) was utilised to prepare the nanofluids at different weight fractions.


![[double bond, length as m-dash]](https://www.rsc.org/images/entities/char_e001.gif) C bonds and demonstrates the graphitic nature of the resulting highly disordered carbon nanospheres, as shown in Fig. 6b. This peak is known as the graphite peak or G peak (sp2 bonding). Here, the broad D (sp3 bonding) band attributed to the vibrations of the carbon atoms with dangling bonds in the termination plane of disordered graphite indicated the hollow CNSs amorphous structure. The presence of the second-order signal at 2641 cm−1 was attributed to double resonance Raman scattering, which also verified the formation of C
C bonds and demonstrates the graphitic nature of the resulting highly disordered carbon nanospheres, as shown in Fig. 6b. This peak is known as the graphite peak or G peak (sp2 bonding). Here, the broad D (sp3 bonding) band attributed to the vibrations of the carbon atoms with dangling bonds in the termination plane of disordered graphite indicated the hollow CNSs amorphous structure. The presence of the second-order signal at 2641 cm−1 was attributed to double resonance Raman scattering, which also verified the formation of C![[double bond, length as m-dash]](https://www.rsc.org/images/entities/char_e001.gif) C bonds. Carbon's degree of disorder can be calculated as the integral of the intensities of the D-band peak to the G-band peak (ID/IG). The GN800 intensity ratio was found to be 0.84, which demonstrates the disorganised nature of the synthesised carbon nanospheres.34
C bonds. Carbon's degree of disorder can be calculated as the integral of the intensities of the D-band peak to the G-band peak (ID/IG). The GN800 intensity ratio was found to be 0.84, which demonstrates the disorganised nature of the synthesised carbon nanospheres.34
![[double bond, length as m-dash]](https://www.rsc.org/images/entities/char_e001.gif) O stretching. The lignocellulosic components' alkaline and aromatic C–H bond vibrations could also be observed by the absorption peak at 2935 cm−1. The hydroxyl group (–OH stretching) of cellulose was represented by the broad peak at 3323 cm−1.35 Based on the FTIR analysis, the precursor was mostly composed of cellulose, hemicellulose, and lignocellulose, which shows it can be used as a carbon precursor to synthesise highly ordered carbon nanospheres. After the pyrolysis, the obtained CNSs showed different functional groups present in the CNSs. A small broad peak appeared around 3654 cm−1 corresponding to O–H stretching frequency, while the peak around 3193 cm−1 indicated C–H stretching, and the small broad peak at 2000 cm−1 corresponded to C
O stretching. The lignocellulosic components' alkaline and aromatic C–H bond vibrations could also be observed by the absorption peak at 2935 cm−1. The hydroxyl group (–OH stretching) of cellulose was represented by the broad peak at 3323 cm−1.35 Based on the FTIR analysis, the precursor was mostly composed of cellulose, hemicellulose, and lignocellulose, which shows it can be used as a carbon precursor to synthesise highly ordered carbon nanospheres. After the pyrolysis, the obtained CNSs showed different functional groups present in the CNSs. A small broad peak appeared around 3654 cm−1 corresponding to O–H stretching frequency, while the peak around 3193 cm−1 indicated C–H stretching, and the small broad peak at 2000 cm−1 corresponded to C![[double bond, length as m-dash]](https://www.rsc.org/images/entities/char_e001.gif) C
C![[double bond, length as m-dash]](https://www.rsc.org/images/entities/char_e001.gif) C stretching. Furthermore, there was a prominent peak around 1415 cm−1, which corresponded to O–H bending vibrations. Additionally, an identifiable peak was observed at 1004 cm−1 which corresponded to C
C stretching. Furthermore, there was a prominent peak around 1415 cm−1, which corresponded to O–H bending vibrations. Additionally, an identifiable peak was observed at 1004 cm−1 which corresponded to C![[double bond, length as m-dash]](https://www.rsc.org/images/entities/char_e001.gif) C bending.36 Other than the O–H moiety, no functional groups were apparent based on the data collected. This was due to the pyrolysis at high temperatures, which eliminated the majority of the volatile components.
C bending.36 Other than the O–H moiety, no functional groups were apparent based on the data collected. This was due to the pyrolysis at high temperatures, which eliminated the majority of the volatile components.


![[thin space (1/6-em)]](https://www.rsc.org/images/entities/char_2009.gif) :
:![[thin space (1/6-em)]](https://www.rsc.org/images/entities/char_2009.gif) 40)
40)![[thin space (1/6-em)]](https://www.rsc.org/images/entities/char_2009.gif) :
:![[thin space (1/6-em)]](https://www.rsc.org/images/entities/char_2009.gif) 40 ratio as a base fluid, with the nanoparticles, is shown in Fig. 10a and b, respectively. For EG as the base fluid, the experimental results showed that the highest value of the TC with a heating power 40 mW at a concentration of 0.01 wt% was 0.23 W m−1 K−1; for 0.02 wt%, the highest TC value was 0.28 W m−1 K−1; for 0.05 wt%, the highest TC value was 0.31 W m−1 K−1; and for 0.1 wt%, the TC value was 0.37 W m−1 K−1. Additionally, experiments were conducted using DI–EG in a 60
40 ratio as a base fluid, with the nanoparticles, is shown in Fig. 10a and b, respectively. For EG as the base fluid, the experimental results showed that the highest value of the TC with a heating power 40 mW at a concentration of 0.01 wt% was 0.23 W m−1 K−1; for 0.02 wt%, the highest TC value was 0.28 W m−1 K−1; for 0.05 wt%, the highest TC value was 0.31 W m−1 K−1; and for 0.1 wt%, the TC value was 0.37 W m−1 K−1. Additionally, experiments were conducted using DI–EG in a 60![[thin space (1/6-em)]](https://www.rsc.org/images/entities/char_2009.gif) :
:![[thin space (1/6-em)]](https://www.rsc.org/images/entities/char_2009.gif) 40 ratio. Water was chosen due to its high thermal conductivity, as elevated temperatures enhance the ion mobility, consequently increasing thermal conduction. These DI–EG mixtures in 60
40 ratio. Water was chosen due to its high thermal conductivity, as elevated temperatures enhance the ion mobility, consequently increasing thermal conduction. These DI–EG mixtures in 60![[thin space (1/6-em)]](https://www.rsc.org/images/entities/char_2009.gif) :
:![[thin space (1/6-em)]](https://www.rsc.org/images/entities/char_2009.gif) 40 NFs showed good stability. The results in Fig. 9b indicate that the nanofluid concentration of 0.1 wt% exhibited a TC value of 0.50 W m−1 K−1 at a power of 80 mW. In contrast, the 0.05, 0.02, and 0.01 wt% concentrations showed values of 0.46, 0.45, and 0.43 W m−1 K−1, respectively. Due to the Brownian motion of NPs, the TC values increased as the NP concentration increased. The increased nanoparticle concentration in a particular volume of the base fluid may be the cause for this increase. Due to the high interaction between the atoms of the fluid and the wall, the thermal conductivity of the nanofluid typically rises when the volume fraction is raised. As the concentration increases, an interfacial layer forms, consisting of liquid molecules arranged in an orderly manner around the surface of nanoparticles due to strong contact between the fluid and particles. This layer is commonly referred to as a nanolayer.50 One potential heat-transfer method for the thermal conductivity of NFs is heat transfer through the interfacial layer at the particle-fluid interface. The augmentation mechanism might be due to the material-to-material interface, nanoparticle clusters, and higher concentrations of the nanoparticles exhibiting Brownian motion. Brownian motion raises the thermal conductivity by causing microconvection in the nearby liquid molecules. Also, it was confirmed by Raman that the synthesised CNSs had sp3 bonding attributed to diamond-like carbon (DLC), which is a metastable form of α-C containing a significant fraction of sp3 bonds.51 The enhancement in the TC values was calculated using eqn (10).
40 NFs showed good stability. The results in Fig. 9b indicate that the nanofluid concentration of 0.1 wt% exhibited a TC value of 0.50 W m−1 K−1 at a power of 80 mW. In contrast, the 0.05, 0.02, and 0.01 wt% concentrations showed values of 0.46, 0.45, and 0.43 W m−1 K−1, respectively. Due to the Brownian motion of NPs, the TC values increased as the NP concentration increased. The increased nanoparticle concentration in a particular volume of the base fluid may be the cause for this increase. Due to the high interaction between the atoms of the fluid and the wall, the thermal conductivity of the nanofluid typically rises when the volume fraction is raised. As the concentration increases, an interfacial layer forms, consisting of liquid molecules arranged in an orderly manner around the surface of nanoparticles due to strong contact between the fluid and particles. This layer is commonly referred to as a nanolayer.50 One potential heat-transfer method for the thermal conductivity of NFs is heat transfer through the interfacial layer at the particle-fluid interface. The augmentation mechanism might be due to the material-to-material interface, nanoparticle clusters, and higher concentrations of the nanoparticles exhibiting Brownian motion. Brownian motion raises the thermal conductivity by causing microconvection in the nearby liquid molecules. Also, it was confirmed by Raman that the synthesised CNSs had sp3 bonding attributed to diamond-like carbon (DLC), which is a metastable form of α-C containing a significant fraction of sp3 bonds.51 The enhancement in the TC values was calculated using eqn (10).


