 Open Access Article
Core–shell niobium(V) oxide@molecularly imprinted polythiophene nanoreceptors for transformative, real-time creatinine analysis†
Zohaib
Saddique
a,
Maleeha
Saeed
a,
Muhammad
Faheem
b,
Sadia Z.
Bajwa
c,
Adnan
Mujahid
 a and
Adeel
Afzal
 *a
*a
aSensors and Diagnostics Lab, School of Chemistry, University of the Punjab, Quaid-i-Azam Campus, Lahore, 54590, Pakistan. E-mail: adeel.chem@pu.edu.pk
bSchool of Chemistry and Chemical Engineering, Jiangsu University, Zhenjiang, Jiangsu 212013, P. R. China
cNational Institute for Biotechnology and Genetic Engineering, PO Box 577, Jhang Road, Faisalabad, 38000, Pakistan
First published on 31st May 2024
Abstract
Creatinine, a byproduct of muscle metabolism, is typically filtered by the kidneys. Deviations from normal concentrations of creatinine in human saliva serve as a crucial biomarker for renal diseases. Monitoring these levels becomes particularly essential for individuals undergoing dialysis and those with kidney conditions. This study introduces an innovative disposable point-of-care (PoC) sensor device designed for the prompt detection and continuous monitoring of trace amounts of creatinine. The sensor employs a unique design, featuring a creatinine-imprinted polythiophene matrix combined with niobium oxide nanoparticles. These components are coated onto a screen-printed working electrode. Thorough assessments of creatinine concentrations, spanning from 0 to 1000 nM in a redox solution at pH 7.4 and room temperature, are conducted using cyclic voltammetry (CV), differential pulse voltammetry (DPV), and electrochemical impedance spectroscopy (EIS). The devised sensor exhibits a sensitivity of 4.614 μA cm−2 nM−1, an impressive trace level limit of detection at 34 pM, and remarkable selectivity for creatinine compared to other analytes found in human saliva, such as glucose, glutamine, urea, tyrosine, etc. Real saliva samples subjected to the sensor reveal a 100% recovery rate. This sensor, characterized by its high sensitivity, cost-effectiveness, selectivity, and reproducibility, holds significant promise for real-time applications in monitoring creatinine levels in individuals with kidney and muscle-related illnesses.
Introduction
Creatinine, a metabolic byproduct of muscle activity during typical human functions, results from the catabolism of creatine and phosphocreatine, releasing energy in the form of adenosine triphosphate (ATP). Produced by muscles, transported through the bloodstream, filtered by the kidneys, and eventually eliminated through urine, abnormal levels of creatinine are indicative biomarkers for the optimal functioning of these organs.1 The normal concentration of creatinine in human saliva typically falls within the range of 4.4 to 17.7 μM, subject to influences such as gender, body weight, and physiological conditions.2,3 Fluctuations in salivary creatinine levels play a pivotal role as biomarkers for renal diseases; elevated concentrations (>28 μM) signal kidney disorders, while lower concentrations (<2 μM) signify muscular dysfunction.3,4Given the significance of creatinine as a biomarker for conditions such as renal failure, chronic kidney disorder (CKD), and muscle dystrophy, it ranks as the second most analyzed biomolecule.5 Currently, there is no point-of-care (PoC) device that can readily detect creatinine in blood or saliva samples. The importance of timely creatinine monitoring in humans, particularly through PoC diagnostics, is highlighted by global fatalities due to renal failure. In this context, a human saliva sample is more advantageous in terms of convenience, non-invasiveness, and lower risk over urine and serum samples for PoC diagnostics.6,7 Additionally, the collection of saliva is easy and does not require a skilled individual, while posing a minimal risk of contamination or disease transmission.8,9
Although Jaffe's method has traditionally been used for creatinine detection, its drawbacks, including interference from other molecules, the need for skilled operators, higher costs, and incompatibility with PoC diagnostics, have prompted the exploration of alternative methods.10 For instance, Bai et al.11 developed a PoC colorimetric metabolomic sensor for different metabolites, including creatinine. Over recent decades, electrochemical methods have been developed for creatinine quantification in physiological fluids.12–14 These methods stand out for their excellent sensitivity and rapid response, offering considerable potential for real-time applications. However, it is important to overcome the challenges of non-selectivity and interferences in complex mixtures of nanomaterial-based electrochemical sensors.3
Molecularly imprinted polymers (MIP) serve as synthetic counterparts to enzymes and natural antibodies, offering biomimetic selectivity, greater stability, and cost-effectiveness.15 MIPs are suitable for developing PoC diagnostics, as they provide low cost and long-term results.16,17 Incorporating nanomaterials into MIP-based sensors enhances sensitivity, aligning the strengths of nanomaterials and MIP for optimal results.18,19 In our earlier works, we employed g-C3N4,19 MoO3:V2O5,20 or V-TiO2![[thin space (1/6-em)]](https://www.rsc.org/images/entities/char_2009.gif) 21 for the enhancement of the sensitivity of electrochemical sensors. Pristine metal oxide nanoparticles with higher metal oxidation states, such as Nb2O5, offer preferential reactivity toward hard bases such as creatinine, containing an R–NH2 groups, due to their hard acid characteristics.22
21 for the enhancement of the sensitivity of electrochemical sensors. Pristine metal oxide nanoparticles with higher metal oxidation states, such as Nb2O5, offer preferential reactivity toward hard bases such as creatinine, containing an R–NH2 groups, due to their hard acid characteristics.22
The merits and demerits of electrochemical sensors for creatinine detection are extensively discussed in prior works, outlining key limitations and proposing future recommendations.3,5 Alizadeh et al.23 used an innovative approach to design MIP with a Cu(II)-creatinine complex as the template. Thus-fabricated electrochemical sensor could detect creatinine down to 59 nM threshold detection limit (LOD) with a wide range linear response. Recently, Ashakirin et al.24 reported an amperometric Cu2O@MIP nanocomposite creatinine sensor, with a 22 nM LOD, and 2.16 μA cm−2 nM−1 sensitivity.
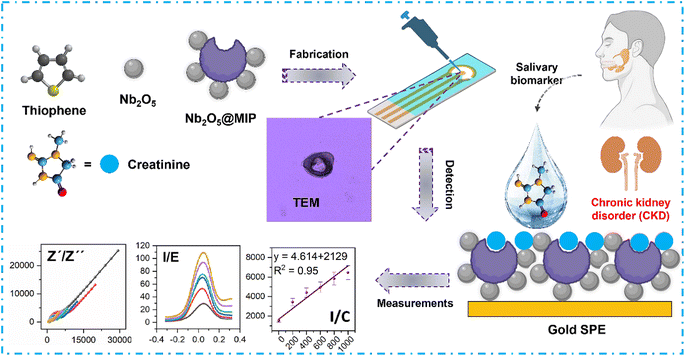
Herein, the design of Nb2O5@MIP nanoreceptors for real-time monitoring of salivary creatinine levels is presented. Nb2O5@MIP nanoreceptors are synthesized in situ via a chemical oxidative polymerization of thiophene to form inverse core–shell niobium(V) oxide nanoparticles at conductive, molecularly imprinted polythiophene (MIP). The as-synthesized Nb2O5@MIP nanoreceptors are fabricated on cost-effective, disposable, screen-printed electrodes (SPE) for the electrochemical recognition of creatinine and analysis of human saliva samples (Fig. 1).
To understand the composition-structure-sensing properties relations, pristine MIP, non-imprinted polythiophene (NIP), and Nb2O5@NIP sensors are also fabricated. These sensors are exposed to varying concentrations (0–1000 nM) of creatinine, with responses recorded through different electrochemical techniques including cyclic voltammetry (CV), differential pulse voltammetry (DPV), and electrochemical impedance spectroscopy (EIS). The reliability of the sensor for real-time applications is validated against different human saliva samples as a complex mixture of various molecules.
Experimental section
Synthesis
To prepare core–shell Nb2O5@MIP nanoreceptors, 410 mg of niobium(V) oxide nanoparticles, and 164 mg of sodium dodecyl sulfate (SDS, ≥98.5%, SigmaAldrich) were dissolved in 20 mL of deionized water and were homogenized under ultrasound sonication for 45 min. After that, 117 mg of creatinine (anhydrous, ≥98%, SigmaAldrich) and 840 μL of thiophene (Th, >98%, SigmaAldrich) were added to the solution. The reaction mixture was again homogenized for 30 min to self-organize the monomer, the template, and Nb2O5 nanoparticles. Separately, another solution containing 826 mg of the catalyst, copper sulfate pentahydrate (CuSO4·5H2O, SigmaAldrich), was prepared in 2 mL of the oxidant, hydrogen peroxide (H2O2, 35%, SigmaAldrich). Thus, in situ, oxidative polymerization was initiated by the addition of the later solution to the reaction mixture containing self-organized monomers, template, and Nb2O5 nanoparticles, which changed the color of the reaction mixture to dark brown. The resulting reaction mixture was heated at 50 °C for 7 hours under continuous magnetic stirring. Dark brown precipitates were obtained which were washed with deionized water and ethanol to remove unreacted species. The product (Nb2O5@MIP) was oven-dried at 60 °C for 12 hours. Similarly, Nb2O5@NIP nanoreceptors were prepared without creatinine (the template). Also, pristine MIP was prepared as a reference without the inclusion of Nb2O5 nanoparticles, while NIP was prepared without the addition of Nb2O5 nanoparticles and creatinine (the template).Characterization
Powder X-ray diffraction (PXRD) analysis of Nb2O5 nanoparticles was performed on a Siemens D5005 X-ray diffractometer, equipped with Cu Kα (λ = 1.5418 Å) irradiation, employing a scanning rate of 5° min−1. Nb2O5 nanoparticles and Nb2O5@NIP and Nb2O5@MIP nanoreceptors were analyzed by Fourier transform infrared (FTIR) spectroscopy using a Nicolet-410-FTIR spectrophotometer, across 4000 to 650 cm−1. Transmission electron micrographs (TEM) of Nb2O5@MIP nanoreceptors were obtained with a HITACHI-2100 PLUS TEM, at an acceleration voltage of 120 kV. Scanning electron micrographs (SEM) were obtained with a HITACHI SU8010 scanning electron microscope.Sensor fabrication
Four different electrochemical sensors were fabricated using NIP, MIP, Nb2O5@NIP, and Nb2O5@MIP nanoreceptors. First, as-synthesized nanoreceptors were immobilized in a 1% polystyrene (packaging waste, local) solution in tetrahydrofuran (THF; ≥99.9%, anhydrous, inhibitor-free, SigmaAldrich). The amount of nanoreceptors was optimized to be 1 mg mL−1. The immobilization mixture was sonicated for 30 min to homogenize the suspension. All samples were fabricated on disposable, ItalSens screen-printed gold (Au) electrodes (gold SPE), provided by PalmSens BV, The Netherlands. The diameter of the working electrode was 3 mm, with a geometrical area of 7.07 mm2. Before the fabrication of each sensor, SPEs were washed with water, ethanol, and acetone to remove any contaminants. Subsequently, 5 μL of the nanoreceptors' suspension was drop-coated on the electrode surface. All devices were air-dried at room temperature and stored in sealed containers for measurements. Before electrochemical characterization and sensor measurements, MIP and Nb2O5@MIP sensors were thoroughly washed with deionized water to remove the template. The removal of template, creatinine molecules, is characterized by FTIR spectroscopy, as shown in Fig. S1.†Electrochemical characterization and sensor measurements
The electrochemical characterization and sensor responses of fabricated creatinine sensors were measured with a PalmSens 4, a USB-powered, compact potentiostat, operated via PSTrace Windows software, provided by PalmSens BV, The Netherlands. For this purpose, firstly, a redox solution was prepared by dissolving equimolar concentrations (2.5 mM) of K4[Fe(CN)6]·3H2O (ACS reagent, 98.5–102.0%, SigmaAldrich) and K3[Fe(CN)6] (ACS reagent, ≥99.0%, SigmaAldrich) in phosphate buffer saline (PBS, pH 7.4, BioPLUS), prepared in deionized water. To enhance electron transfer, 0.05 M potassium chloride (KCl; analytical grade, local) was also added to the redox solution.EIS was used to investigate the interfacial electrochemical characteristics of different nanoreceptors. EIS measurements were performed in the frequency range of 1 Hz to 100 kHz with DC potential (Edc) of 0.1 V and AC potential (Eac) of 0.006 V while recording 50 frequencies per 9.8 decades. The electrochemical responses of the NIP, MIP, Nb2O5@NIP, and Nb2O5@MIP sensors were investigated by CV and DPV when exposed to varying concentrations of creatinine ranging from 0 to 1000 nM. Different concentrations (0–1000 nM) of creatinine were prepared in the above-mentioned redox solution. CV measurements were conducted in the potential range of −0.8 to +0.8 V at a scan rate of 100 mV s−1 with a potential step (E step) of 10 mV. To optimize the scan rate and determine the mechanisms, the effect of different scan rates (10–100 mV) was also studied. DPV responses of electrochemical creatinine sensors were recorded in a potential window of −0.5 to +0.5 V with a scan rate of 100 mV s−1. Peak current shifts with changing potential due to oxidation-reduction of [Fe(CN)6]3−/4− redox pairs in PBS were used as bases for CV and DPV analysis.
From these electrochemical measurements, the sensitivity, limit of detection (LOD), and limit of quantification (LOQ) were calculated by employing standard methods, as described elsewhere.20 The selectivity was tested by exposing the Nb2O5@MIP sensor to 100 nM of common analytes present in human saliva, such as urea, uric acid, tyrosine, glutamine, guanine, spermine, etc. To determine the reproducibility of Nb2O5@MIP sensors, three devices were separately fabricated and tested at a known concentration of creatinine. The mean values of sensor response and standard deviation were subsequently calculated.
Pre-treatment and analysis of human saliva
Real saliva samples were obtained from three healthy members of the Sensors and Diagnostics Laboratory, with their prior consent. Saliva samples were collected in 2 mL clean plastic vials via passive drooling. The samples were cooled down to 4 °C by placing them in an ice bath. To remove food particles, the samples were centrifuged at 4000 rpm. The supernatant was collected and treated in an ultrasonic bath to break down long-chain muco-polypeptides. These molecules impart viscosity and make handling difficult. Each sample was subsequently filtered through a 220 nm nylon syringe filter to remove large protein bodies and other irrelevant macromolecules. 400 μL of the saliva samples were diluted with 800 μL of the redox solution, to realize the same concentrations of the [Fe(CN)6]3−/4− redox pairs. Then, the saliva samples were tested to determine the initial concentration of creatinine in each sample. Separately, all saliva samples were spiked with 200 nM creatinine to investigate the differences in creatinine concentration and estimate the percent recovery of creatinine, as described elsewhere.25 During the measurements, the saliva samples were stored below 8 °C.Results and discussion
Fabrication of Nb2O5@MIP sensors
Fabrication of the Nb2O5@MIP sensor is monitored by EIS and CV. The interfacial properties of the sensors with changes in electrochemical characteristics before and after modification of the bare, gold SPE with Nb2O5@MIP nanoreceptors are investigated. Firstly, modification of the SPE exponentially reduces charge transfer resistance (Rct) from 14.74 KΩ to 203 Ω, as demonstrated by the Nyquist plots (Fig. S2a†). Lower Rct represents lower resistance at the Nb2O5@MIP-electrolyte interface leading to faster electron transfer and improved electrocatalytic properties. A similar trend is observed in the Bode magnitude plot (Fig. S2b†), featuring variation in absolute impedance as a function of frequency. It exhibits higher absolute impedance for bare electrodes as compared to Nb2O5@MIP modified SPE owing to the absence of ionic interactions on the bare electrode surface.26 These results are attested by Bode phase angle plots (Fig. S2c†), where the Nb2O5@MIP modified electrode shows deviation toward 40° demonstrating capacitive properties with surface defects and leakage current.25 These defect sites pertain to imprints and cavities that may act as diffusion channels in Nb2O5@MIP nanoreceptors, promoting the electrocatalytic activity for sensitive detection of the target analyte. This is manifested in the greater voltammetric response of the Nb2O5@MIP modified electrode (Fig. S2d†). CV results corroborate earlier conclusions from EIS analysis.The electroactive surface area (A) and heterogeneous rate constant (K°) emerge as pivotal factors distinguishing the electrocatalytic features, based on the presence of interaction sites and it is calculated through the Randles–Ševčík equation (eqn (1)).19
Ip = 2.69 × 105n![[/]](https://www.rsc.org/images/entities/char_e0ee.gif) AD½Cv½ AD½Cv½ | (1) |
The heterogeneous rate constant, on the other hand, is calculated by following equation (eqn (2)).27
| K° = RT/RctACF2 | (2) |
The calculated electroactive area for Nb2O5@MIP is 43.87 × 10⁻³ cm2, which is 24.5-fold higher than 1.79 × 10⁻³ cm2 for the bare electrode (Fig. S2e†). The heterogeneous rate constant, an indicator of the electron transfer kinetics at the electrode–electrolyte interface, signifies faster electron transfer for the Nb2O5@MIP-modified electrode. Calculated at 1.20 × 10⁻² cm s−1, it also outperforms the bare electrode at 4.04 × 10⁻³ cm s−1, as illustrated in (Fig. S2f†). In summary, these results confirm the fabrication of Nb2O5@MIP nanoreceptors and their superior electrocatalytic properties.
Microstructure and surface morphology
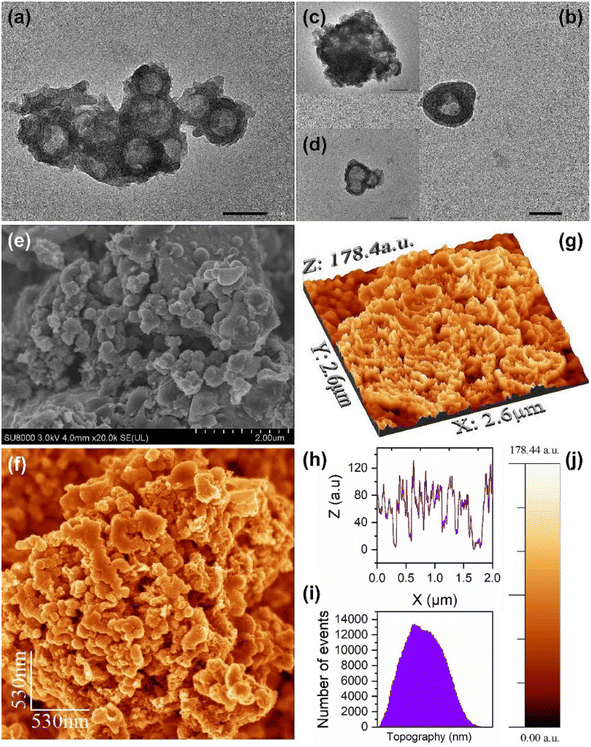
The revelations from TEM micrographs, depicted in Fig. 2a–d, reveal the intriguing architecture of Nb2O5@MIP nanostructures. These images suggest the existence of an inverted core–shell structure of Nb2O5@MIP. However, Nb2O5 nanoparticles do not form a complete shell due to the presence and removal of template molecules by a thorough washing step. 2D-SEM images of the sensor surface, shown in Fig. 2e and f, demonstrate a consistent distribution of irregularly shaped clusters of Nb2O5@MIP. Moving to the 3D perspective (Fig. 2g), a highly rough surface of the Nb2O5@MIP-modified electrode can be seen, an attribute desired for an effective electrocatalytic interface, maximizing the surface area available for the electrode–analyte interactions. The surface profile (Fig. 2h) illustrates the presence of peaks and valleys, while the size distribution of surface features is presented in the histogram (Fig. 2i). This topographical intricacy aligns with the insights from the Bode phase angle plot, where the observed current leakage and surface defects, attributed to molecular imprinting cavities, are comprehensible. In principle, Nb2O5@MIP-modified electrodes present morphology and structural features finely tuned for electrocatalytic applications.Structural characterization
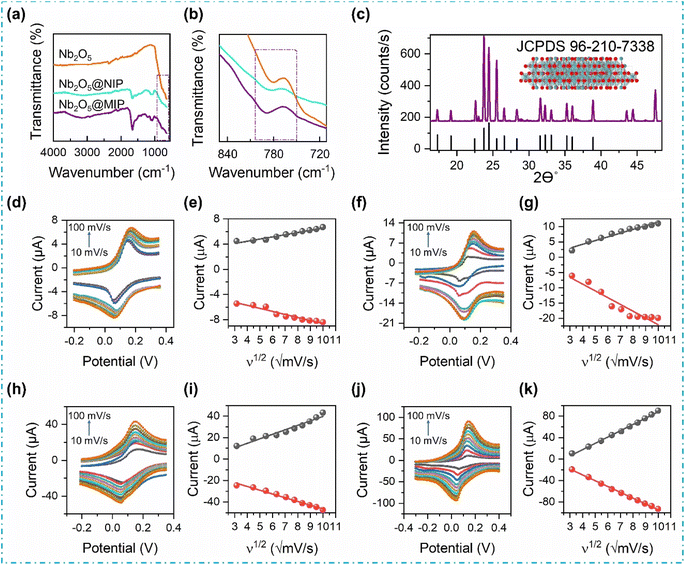
In Fig. 3a and b, the FTIR spectra of Nb2O5, Nb2O5@NIP, and Nb2O5@MIP are presented. The distinctive fingerprint region for polythiophene, spanning 600–1650 cm−1, unfolds peaks corresponding to νC–C ring stretching vibrations, νCα–Cα rings resonance absorption, and νC![[double bond, length as m-dash]](https://www.rsc.org/images/entities/char_e001.gif) C symmetric vibration at approximately 1072 cm−1, 1123 cm−1, and around 1650 cm−1, respectively.28–30 Nb2O5 introduces a less intense, co-linear Nb–O–Nb stretching peak at around 800 cm−1, evident in its FTIR spectrum. The inclusion of Nb2O5 in Nb2O5@NIP and Nb2O5@MIP manifests as a less intense Nb–O–Nb stretching peak at approximately 800 cm−1.31,32 The remainder of the spectra for Nb2O5@NIP and Nb2O5@MIP are anticipated to be consistent, given their equivalent quantities of monomers and other reacting reagents. However, a weak νC–N stretching is observed around 1215 cm−1 in Nb2O5@MIP, which is attributed to the presence of creatinine molecules in the polymeric matrix.33 The absence of this peak in Nb2O5@NIP is therefore justified. Furthermore, washing off the template or creatinine molecules leads to a significant decrease in the peak intensity (Fig. S1†), which also confirms the removal of template from the polymeric matrix.
C symmetric vibration at approximately 1072 cm−1, 1123 cm−1, and around 1650 cm−1, respectively.28–30 Nb2O5 introduces a less intense, co-linear Nb–O–Nb stretching peak at around 800 cm−1, evident in its FTIR spectrum. The inclusion of Nb2O5 in Nb2O5@NIP and Nb2O5@MIP manifests as a less intense Nb–O–Nb stretching peak at approximately 800 cm−1.31,32 The remainder of the spectra for Nb2O5@NIP and Nb2O5@MIP are anticipated to be consistent, given their equivalent quantities of monomers and other reacting reagents. However, a weak νC–N stretching is observed around 1215 cm−1 in Nb2O5@MIP, which is attributed to the presence of creatinine molecules in the polymeric matrix.33 The absence of this peak in Nb2O5@NIP is therefore justified. Furthermore, washing off the template or creatinine molecules leads to a significant decrease in the peak intensity (Fig. S1†), which also confirms the removal of template from the polymeric matrix.
In the XRD pattern (Fig. 3c), Nb2O5 unveils a monoclinic crystal system with space group P1 2/m 1, indexed as JCPDS. 96-210-7338. Distinct diffraction peaks at 17.30°, 19.18°, 22.54°, 23.75°, 24.44°, 26.55°, 28.32°, 31.59°, 32.23°, 33.09°, 35.24°, 36.018°, and 38.88° 2θ, along with their hkl Miller indices (103), (403), (105), (011), (504), (112), (604), (213), (114), (513), (308), (700), and (610), respectively, delineate the crystal structure.34,35 Employing the Debye–Scherrer equation, the crystallite size of Nb2O5 is calculated to be 40 nm. The monoclinic system's expanded surface area, coupled with the nanoscale size, positions Nb2O5 as a highly sought-after semiconductor for enhancing the sensitivity of electrochemical sensors.36,37
Effect of scan rate
CV was performed to examine the impact of scan rate (10–100 mV s−1) on anodic (Ipa) and cathodic (Ipc) peak currents, elucidating mass transfer mechanisms, and electron transfer kinetics at the electrode–electrolyte interface. Fig. 3d–k portray the escalating redox peak current with increasing scan rate when different sensors are exposed to a redox solution in PBS at pH 7.4. Linearity in the increase in Ipa with ascending values of the scan rate square root (ν1/2) is mathematically expressed, confirming our premise that this process is diffusion-limited.38,39 The results of the linear regression analysis for different sensors are given as follows:Pristine NIP:
| Ipa = (0.345 ± 0.0245) ν1/2 + (3.079 ± 0.181); (R2 = 0.96) |
Pristine MIP:
| Ipa = (1.215 ± 0.084) ν1/2 − (0.648 ± 0.627); (R2 = 0.96) |
Nb2O5@NIP:
| Ipa = (4.189 ± 0.312) ν1/2 − (2.108 ± 2.31); (R2 = 0.95) |
Nb2O5@MIP:
| Ipa = (11.74 ± 0.244) ν1/2 − (29.46 ± 1.8); (R2 = 0.99) |
A similarly linear but opposite trend is observed in the case of Ipc, which confirms the reversibility of the electron–transfer reactions, and their diffusion-limiting nature. Furthermore, the positive shift in oxidation peak potential and the negative shift in reduction peak potential with increasing scan rate indicate the occurrence of quasi-reversible redox reactions at the surface of the modified electrodes.40
Electrochemical characterization
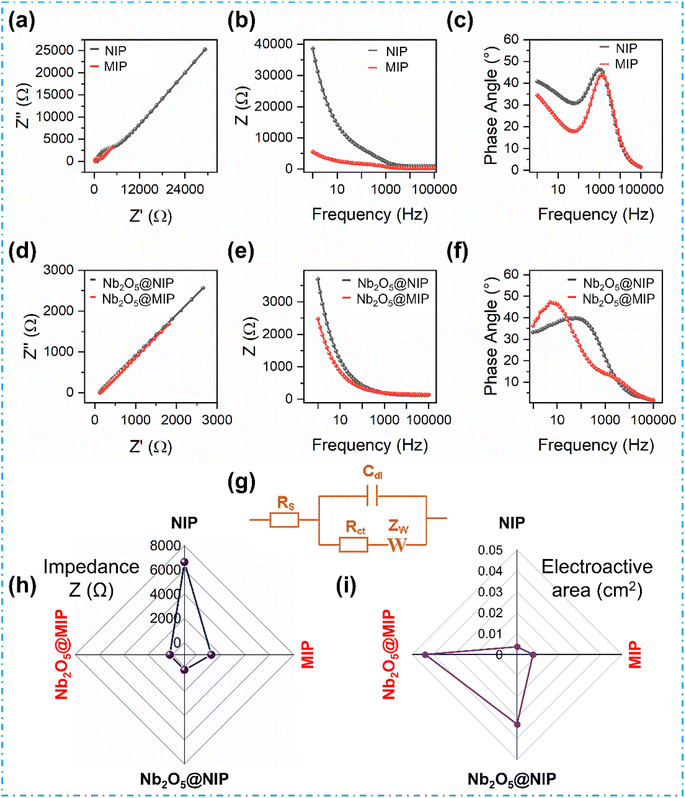
The deployment of EIS is a powerful tool for delving into the interfacial interactions of the fabricated sensor materials. All samples are tested to reveal their distinctive interfacial properties. In Fig. 4a–c, a side-by-side comparison of NIP and MIP is presented through Nyquist, Bode magnitude, and Bode phase plots. In the Nyquist plot, where real (Z′) and imaginary impedance (Z′′) are plotted, a large semi-circle area appears in the case of NIP, signifying an elevated polarization resistance at the electrode–electrolyte interface (Rct), quantified at a substantial 6.64 kΩ. Contrarily, the MIP showcases a smaller semi-circle area, an outcome of the introduction of diffusion channels and selective interaction sites that substantially reduce Rct to 1.21 kΩ. The NIP coatings are generally devoid of imprinted cavities and diffusion channels, whereas the MIP surface possesses imprints or cavities generated by the removal of template molecules, which improves interfacial electron transfer.41,42 The Bode magnitude plot reveals a similar trend, i.e., showing a significantly lower absolute impedance for MIP compared to NIP. The Bode phase angle plot also introduces a distinct perspective, with MIP displaying a more pronounced deviation from 90° compared to NIP, which indicates the presence of defects caused by molecularly imprinted cavities leading to a higher leakage current.To further improve the electrochemical characteristics, core–shell Nb2O5@NIP and Nb2O5@MIP electrodes were designed. The +5 oxidation state of Nb in Nb2O5 boosts robust electron transfer properties,43,44 evident in the exponential decrease in Rct from 6.64 kΩ of NIP to 254 Ω for Nb2O5@NIP. Bode plots corroborate these changes, highlighting improved electronic conduction with the addition of semiconducting particles. A comparison of the electrochemical impedance and electroactive surface area of variously modified electrodes is provided in Fig. 4h and i, respectively. The best results are achieved with Nb2O5@MIP, where higher electroactive area and superior diffusion synergize with the fast electron-transferring semiconductor. As illustrated in Nyquist and Bode plots in Fig. 4d–f, the most significant disparities in impedance occur in the lower frequency region, indicative of a diffusion-controlled process.45 Notably, Nb2O5@MIP exhibits the lowest impedance, emphasizing its exceptional electrocatalytic properties and better suitability for sensor applications.
CV analysis of creatinine sensors
Expanding this investigation, CV measurements are conducted at a scan rate of 100 mV s−1, across diverse creatinine concentrations (0–1000 nM). The CV responses from the fabricated sensors exhibit a discernible increase in the anodic peak current (Ipa) with an upswing in creatinine concentration, a visual representation of which is shown in Fig. S3.† This CV response aligns with the EIS findings, where an elevation in creatinine concentration induces a reduction in the impedance of the interfacial layer. Consequently, an incremental surge in the Ipa is witnessed in tandem with the increasing creatinine concentrations, owing to the electrochemical oxidation of creatinine.20,21 The sensors demonstrate commendable linearity within the range of 0.97–0.99 coefficient of determination (R2), with the highest CV Ipa sensitivity observed in the case of Nb2O5@MIP at 2.32 × 10⁻² μA nM−1, covering a linear dynamic range from 0 to 1000 nM. The CV response of the Nb2O5@MIP sensor is substantially high compared to other sensors: NIP = 3.64 × 10⁻³ μA nM−1; MIP = 4.71 × 10⁻³ μA nM−1; and Nb2O5@NIP = 9.87 × 10⁻³ μA nM−1. Thus, these results validate the earlier assertion regarding the superior performance of Nb2O5@MIP nanoreceptors.DPV analysis and sensor properties
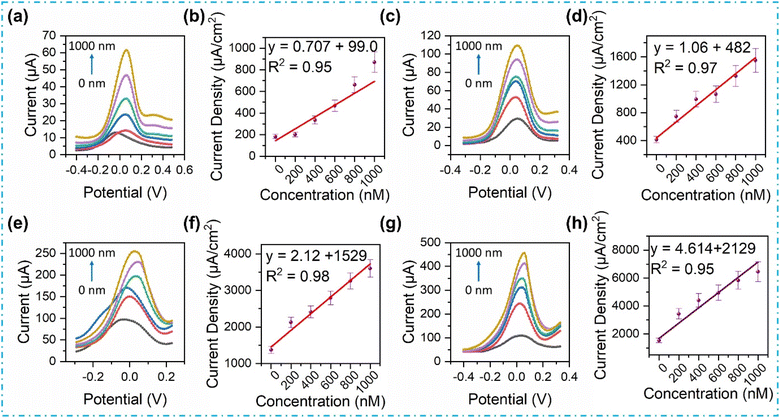
In pursuit of a comprehensive understanding and validation of the sensor responses, DPV measurements were thoroughly performed across various concentrations of creatinine (0–1000 nM). The resulting DPV responses, along with their respective calibration plots for the fabricated sensors, are shown in Fig. 5. DPV is a more reliable technique, offering a true perspective to distinguish between the fabricated sensors based on sensitivity, limit of detection (LOD), limit of quantification (LOQ), and linearity.46 Calculations for LOD and LOQ are performed using the linear regression method, expressed as sensitivity = slope of the calibration curve; LOD = 3.3 × (standard deviation/sensitivity) and LOQ = 10 × (standard deviation/sensitivity), as outlined elsewhere.47In the pursuit of identifying the paramount sensor, key parameters such as heightened sensitivity, minimal LOD, elevated LOQ, and robust linearity emerge as pivotal benchmarks. Notably, the Nb2O5@MIP sensor exhibits superior resolutions across varying concentrations of creatinine. It also boasts the highest DPV sensitivity at 4.614 μA cm−2 nM−1, coupled with an impressively low LOD of 34 pM, and LOQ of 103 pM, while maintaining a good linearity with an R2 value of 0.93. These figures of merit are compared with the NIP, MIP, and Nb2O5@NIP sensors in Table 1 along with examples from recently published data on electrochemical creatinine sensors. Thus, the Nb2O5@MIP sensor not only emerges as the epitome of performance among the fabricated sensors but also lays the foundation for subsequent examinations. These examinations encompass measurements of selectivity, reproducibility, and real sample analyses, as discussed below.
| Material | Method | Linear range | LOD | Sensitivity | Recovery | Ref. |
|---|---|---|---|---|---|---|
| PS/V:TiO2 | CV, DPV | 1–25 μM | 184 nM | 30.95 μA cm−2 μM−1 | — | 21 |
| PAA-Cu(II)/Cu2O | CV | 200–100![[thin space (1/6-em)]](https://www.rsc.org/images/entities/char_2009.gif) 000 μM 000 μM |
6.5 μM | — | 84.9% | 48 |
| CdSe-QD/IL | DPV | 0.442–8840 μM | 229 nM | 28.77 μA μM−1 | 94% | 49 |
| Cu2O | CV | 79.6–132.7 μM | 602 nM | — | — | 50 |
| Cu NPs | DPV | 3.0–20.0 mM | 0.084 mM | 0.132 μA mM−1 | 99% | 51 |
| NIP | CV, DPV | 0–1000 nM | 368 pM | 0.707 μA cm−2 nM−1 | — | This work |
| MIP | 244 pM | 1.065 μA cm−2 nM−1 | — | |||
| Nb2O5@NIP | 223 pM | 2.126 μA cm−2 nM−1 | — | |||
| Nb2O5@MIP | 34 pM | 4.614 μA cm−2 nM−1 | 100% |
Selectivity and reproducibility
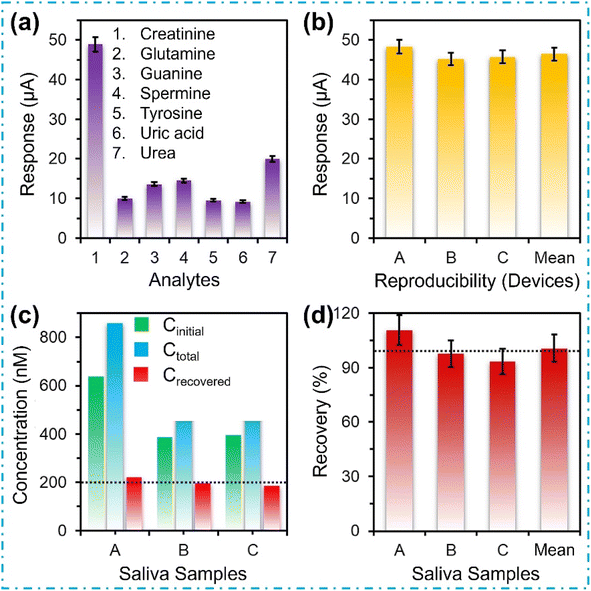
In the realm of practical application of these sensors, the selectivity of the device is of paramount significance, especially given the intricate composition of saliva. The Nb2O5@MIP sensor is exposed to prevalent analytes found in saliva, including urea, uric acid, glutamine, tyrosine, and others. The results are illustrated in Fig. 6a. Impressively, the sensor exhibits a remarkable selectivity for creatinine, showcasing a response that is 243% more pronounced compared to its closest contender – urea. Conversely, the sensor displays minimal responses (<30%) to other analytes.In Fig. 6b, the reproducibility of the Nb2O5@MIP sensors is illustrated. Three distinct disposable, gold SPEs are crafted using Nb2O5@MIP nanoreceptors. Subsequently, all devices are exposed to equivalent concentrations of creatinine under ambient conditions, and their voltammetric responses are recorded in triplicate. Notably, the current responses across these devices consistently align within the range of 45–48 μA, with a mean value of 46.41 ± 1.68 μA. This affirms the outstanding reproducibility of the Nb2O5@MIP sensors.
Real-time salivary creatinine analysis
Human saliva stands as a complex amalgamation of various chemical species, capable of reacting and influencing the electrochemical detection of creatinine. To ascertain the reliability of the Nb2O5@MIP sensor in real-world applications, different samples, both actual saliva samples and those spiked with 200 nM creatinine are introduced to the sensor. Fig. 6c and d presents the results of real-time salivary creatinine analyses. The recovery of the sensor is meticulously calculated using the formula: recovery (%) = {(Ctotal − Cinitial)/Cspiked} × 100.19 The recovery outcomes for three real-time human saliva samples spiked with a known concentration of creatinine demonstrate 100.6% recovery, with a standard deviation of 9.1%. Hence, the creation of a point-of-care electrochemical sensor utilizing Nb2O5@MIP nanoreceptors holds the potential to facilitate the monitoring of individuals with kidney-related diseases, offering a valuable tool for the timely diagnosis of renal failure.Conclusions
In summary, this work introduces a disposable, easy-to-use salivary creatinine-detecting device — a sensor integrating Nb2O5 into creatinine-imprinted polythiophene, i.e., Nb2O5@MIP, meticulously designed for the rapid identification of minute creatinine levels in human saliva. The sensor undergoes rigorous characterization through FTIR spectroscopy, XRD, TEM, and SEM techniques. Electrochemical evaluation, encompassing EIS, CV, and DPV analyses, reveals the sensor's exceptional features. EIS exhibits remarkable charge transfer, featuring minimal electrode–electrolyte interfacial resistance and indicating the diffusion-controlled nature of the redox process. CV and DPV measurements further demonstrate the potential of the Nb2O5@MIP combination. DPV, in particular, demonstrates heightened sensitivity, achieving a sub-100 pM LOD — a remarkable feat for detecting trace creatinine levels in human saliva. The sensor exhibits considerable selectivity, and excellent reproducibility, and delivers outstanding creatinine recovery performance when subjected to real saliva samples. Hence, the Nb2O5@MIP sensor is an unparalleled PoC diagnostic device, providing an innovative solution for monitoring trace creatinine levels in individuals with kidney ailments and those experiencing muscle dysfunction.Author contributions
Z. S. performed the synthesis and fabrication of electrocatalytic materials. Z. S. and M. S. designed the experiments, investigated sensor characteristics, and analyzed the data. M. F. carried out XRD and microscopic characterizations. Z. S. performed real sample analysis and wrote the first draft of the manuscript. S. Z. B. and A. M. revised the manuscript. A. A. conceived the idea, acquired funding, provided resources, supervised the research work, edited the first draft, and revised the manuscript.Conflicts of interest
The authors declare no competing financial interests.Acknowledgements
A. A. acknowledges the financial support provided by the Royal Society of Chemistry, UK (Research Grant: R21-9209614762).References
- C. S. Pundir, P. Kumar and R. Jaiwal, Biosens. Bioelectron., 2019, 126, 707–724 CrossRef CAS PubMed.
- V. Mani, T. Beduk, W. Khushaim, A. E. Ceylan, S. Timur, O. S. Wolfbeis and K. N. Salama, TrAC, Trends Anal. Chem., 2021, 135, 116164 CrossRef CAS.
- Z. Saddique, M. Faheem, A. Habib, I. UlHasan, A. Mujahid and A. Afzal, Diagnostics, 2023, 13, 1737 CrossRef CAS PubMed.
- S. Kalasin, P. Sangnuang, P. Khownarumit, I. M. Tang and W. Surareungchai, ACS Biomater. Sci. Eng., 2020, 6, 5895–5910 CrossRef CAS PubMed.
- R. R. Kumar, M. O. Shaikh and C.-H. Chuang, Anal. Chim. Acta, 2021, 1183, 338748 CrossRef PubMed.
- P. Dasgupta, V. Kumar, P. R. Krishnaswamy and N. Bhat, ACS Omega, 2020, 5, 22459–22464 CrossRef CAS PubMed.
- P. Delanaye, E. Cavalier and H. Pottel, Nephron, 2017, 136, 302–308 CrossRef CAS PubMed.
- C.-Z. Zhang, X.-Q. Cheng, J.-Y. Li, P. Zhang, P. Yi, X. Xu and X.-D. Zhou, Int. J. Oral Sci., 2016, 8, 133–137 CrossRef CAS PubMed.
- D.-S. Ciou, P.-H. Wu, Y.-C. Huang, M.-C. Yang, S.-Y. Lee and C.-Y. Lin, Sens. Actuators, B, 2020, 314, 128034 CrossRef CAS.
- M. Jaffé, Biol. Chem., 1886, 10, 391–400 CrossRef.
- S. Bai, P. Gonzalez-Vasquez, C. Torres-Calzada, S. MacKay, J. Cook, Y. Khaniani, G. Davies, U. Singh, P. Kovur, J. Chen and D. S. Wishart, Biosens. Bioelectron., 2024, 253, 116186 CrossRef CAS PubMed.
- Y. Dong, X. Luo, Y. Liu, C. Yan, H. Li, J. Lv, L. Yang and Y. Cui, Talanta, 2022, 248, 123592 CrossRef CAS PubMed.
- R. K. R. Kumar, M. O. Shaikh, A. Kumar, C.-H. Liu and C.-H. Chuang, ACS Appl. Nano Mater., 2023, 6, 2083–2094 CrossRef.
- G. Álvarez Menéndez, O. Amor-Gutiérrez, A. Costa García, M. Funes-Menéndez, C. Prado, D. Miguel, P. Rodríguez-González, A. González-Gago and J. I. García Alonso, Clin. Chim. Acta, 2023, 543, 117300 CrossRef PubMed.
- J. J. BelBruno, Chem. Rev., 2019, 119, 94–119 CrossRef CAS PubMed.
- J. W. Lowdon, H. Diliën, P. Singla, M. Peeters, T. J. Cleij, B. van Grinsven and K. Eersels, Sens. Actuators, B, 2020, 325, 128973 CrossRef CAS PubMed.
- M. Javanbakht, S. E. Fard, A. Mohammadi, M. Abdouss, M. R. Ganjali, P. Norouzi and L. Safaraliee, Anal. Chim. Acta, 2008, 612, 65–74 CrossRef CAS PubMed.
- A. Afzal, S. Feroz, N. Iqbal, A. Mujahid and A. Rehman, Sens. Actuators, B, 2016, 231, 431–439 CrossRef CAS.
- M. Saeed, Z. Saddique, A. Mujahid and A. Afzal, Biosens. Bioelectron., 2024, 247, 115899 CrossRef CAS PubMed.
- Z. Saddique, T. Siddique, A. Shehzadi, Q. Ul-Ain, A. Ali, N. Iqbal, A. Mujahid and A. Afzal, Compos. Commun., 2023, 42, 101673 CrossRef.
- T. Sawaira, A. Jamil, S. Aziz, A. Mujahid, T. Hussain and A. Afzal, Compos. Commun., 2023, 37, 101398 CrossRef.
- N. Manjula, S. Pulikkutty, T.-W. Chen, S.-M. Chen, C. H. Fan, M. A. Ali and F. M. Al-Hemaid, Colloids Surf., A, 2022, 637, 128277 CrossRef CAS.
- T. Alizadeh and Z. Mousavi, Microchim. Acta, 2022, 189, 393 CrossRef CAS PubMed.
- S. Nur Ashakirin, M. H. M. Zaid, M. A. S. M. Haniff, A. Masood and M. F. Mohd Razip Wee, Measurement, 2023, 210, 112502 CrossRef.
- S. Athar, I. Zaman, A. Liaqat and A. Afzal, ACS Appl. Polym. Mater., 2023, 5, 10438–10445 CrossRef CAS.
- J. Sopoušek, J. Věžník, J. Houser, P. Skládal and K. Lacina, Electrochim. Acta, 2021, 388, 138616 CrossRef.
- E. Pradeepa, Y. Arthoba Nayaka and H. R. Sahana, Anal. Biochem., 2024, 687, 115451 CrossRef CAS PubMed.
- X.-G. Li, J. Li and M.-R. Huang, Chem.–Eur. J., 2009, 15, 6446–6455 CrossRef CAS PubMed.
- R. Liu and Z. Liu, Chin. Sci. Bull., 2009, 54, 2028–2032 CrossRef CAS.
- A. Khan, A. Habib and A. Afzal, Beilstein J. Nanotechnol., 2020, 11, 1190–1197 CrossRef CAS PubMed.
- S. Nagarajan, V. Raman and N. Rajendran, Mater. Chem. Phys., 2010, 119, 363–366 CrossRef CAS.
- A. Pawlicka, M. Atik and M. A. Aegerter, Thin Solid Films, 1997, 301, 236–241 CrossRef CAS.
- S. Shariati and G. Khayatian, Microfluid. Nanofluid., 2022, 26, 30 CrossRef CAS.
- J. H. Lim and J. Choi, J. Ind. Eng. Chem., 2009, 15, 860–864 CrossRef CAS.
- H. Park, D. Lee and T. Song, J. Power Sources, 2019, 414, 377–382 CrossRef CAS.
- R. Shao, Z. Cao, Y. Xiao, H. Dong, W. He, Y. Gao and J. Liu, RSC Adv., 2014, 4, 26447–26451 RSC.
- L. Durai and S. Badhulika, IEEE Sens. J., 2021, 21, 4152–4159 CAS.
- H. Essousi, H. Barhoumi, S. Karastogianni and S. T. Girousi, Electroanalysis, 2020, 32, 1546–1558 CrossRef CAS.
- E. Sharafi and S. Sadeghi, New J. Chem., 2023, 47, 500–514 RSC.
- A. M. Abdel-Aziz, H. H. Hassan and I. H. A. Badr, ACS Omega, 2022, 7, 34127–34135 CrossRef CAS PubMed.
- W. Liu, Y. Ma, G. Sun, S. Wang, J. Deng and H. Wei, Biosens. Bioelectron., 2017, 92, 305–312 CrossRef CAS PubMed.
- W. Zheng, M. Zhao, W. Liu, S. Yu, L. Niu, G. Li, H. Li and W. Liu, J. Electroanal. Chem., 2018, 813, 75–82 CrossRef CAS.
- C. Nico, T. Monteiro and M. P. F. Graça, Prog. Mater. Sci., 2016, 80, 1–37 CrossRef CAS.
- Z. Zhao, Z. Xue, Q. Xiong, Y. Zhang, X. Hu, H. Chi, H. Qin, Y. Yuan and H. Ni, Sustainable Mater. Technol., 2021, 30, e00357 CrossRef CAS.
- V. Ratautaite, M. Nesladek, A. Ramanaviciene, I. Baleviciute and A. Ramanavicius, Electroanalysis, 2014, 26, 2458–2464 CrossRef CAS.
- B. J. Privett, J. H. Shin and M. H. Schoenfisch, Anal. Chem., 2010, 82, 4723–4741 CrossRef CAS PubMed.
- U. Arshad, A. Mujahid, P. Lieberzeit, A. Afzal, S. Zafar Bajwa, N. Iqbal and S. Roshan, RSC Adv., 2020, 10, 34355–34363 RSC.
- S. Kalasin, P. Sangnuang, P. Khownarumit, I. M. Tang and W. Surareungchai, ACS Biomater. Sci. Eng., 2020, 6, 1247–1258 CrossRef CAS PubMed.
- S. Hooshmand and Z. Es'haghi, Anal. Chim. Acta, 2017, 972, 28–37 CrossRef CAS PubMed.
- C.-H. Chen and M. S. Lin, Biosens. Bioelectron., 2012, 31, 90–94 CrossRef CAS PubMed.
- S. Jankhunthod, K. Kaewket, P. Termsombut, C. Khamdang and K. Ngamchuea, Anal. Bioanal. Chem., 2023, 415, 3231–3242 CrossRef CAS PubMed.
Footnote |
| † Electronic supplementary information (ESI) available. See DOI: https://doi.org/10.1039/d4na00300d |
| This journal is © The Royal Society of Chemistry 2024 |

