DOI:
10.1039/D4NA00326H
(Paper)
Nanoscale Adv., 2024,
6, 4885-4899
Biosynthesis of ZnO nanoparticles using aqueous extracts of Eclipta prostrata and Piper longum: characterization and assessment of their antioxidant, antibacterial, and photocatalytic properties†
Received
19th April 2024
, Accepted 19th July 2024
First published on 7th August 2024
Abstract
Chemical syntheses of nanoparticles that release toxic substances into the environment rarely meet the strict requirements of green chemistry principles. Instead, green synthesis of nanoparticles using plant extracts brings a safe, rapid, and effective process, contributing to solving environmental pollution problems. Here, we report the green synthesis of multifunctional ZnO nanoparticles (ZnONPs) using aqueous extracts of E. prostrata leaves and P. longum fruits. The XRD results affirmed the existence of hexagonal crystalline ZnONPs with particle sizes of 17–30 nm. The optical analysis revealed bandgap energies of 3.10 eV and 3.16 eV for ZnONPs biosynthesized using E. prostrata and P. longum extracts, respectively. The synthesized ZnONPs showed potential antioxidant activity through DPPH and ABTS methods. Among the antibacterial outcomes against pathogenic bacterial strains (S. aureus, B. cereus, E. coli, and S. typhimurium), ZnONPs exhibited the highest zone of inhibition (18.5 mm) for S. aureus. Moreover, both ZnONPs biosynthesized using E. prostrata and P. longum extracts served as strong photocatalysts in the degradation of crystal violet with degradation efficiencies of 95.64% and 99.90%, respectively. Therefore, biosynthesized ZnONPs hold significant promise as antioxidants, antibacterial agents, and photocatalysts.
1 Introduction
Currently, nanoparticles (NPs) are garnering significant attention across various domains, including catalysis, electronics, and biomedical sciences, due to their tiny size and high surface area.1 Notably, metal oxide (M–O) NPs are widely acknowledged for their versatile applications such as sensors, catalysts, antimicrobial agents, cosmetics, and energy storage devices.2–4 Among these NPs, zinc oxide nanoparticles (ZnONPs) exhibit exceptional optical, semiconducting, antifungal, antioxidant, and antibacterial properties.5,6 ZnONPs possess a wide band gap, high chemical stability, a high electron transfer rate, biocompatible substances and minimal toxicity.7 Importantly, ZnONPs have been recognized as a safe metal oxide by the US Food and Drug Administration (FDA). Consequently, ZnONPs can be adopted as antioxidant and antibacterial agents in surface coatings for food containers and within biological systems.8
Various methods, including chemical precipitation,9 physical vapor deposition,10 hydrothermal,11 sol–gel,12 ultrasound-assisted,13 thermal decomposition,14 green synthesis,15 microwave-assisted,16 ball milling,17 and others, have been employed for synthesizing ZnONPs. Among these approaches, green synthesis has attracted considerable attention for its ability to overcome the limitations of conventional chemical and physical synthesis of NPs, such as the use of expensive and toxic chemicals, dependence on specialized equipment, and the substantial generation of chemical waste that can harm the environment and impact application areas.18 By contrast, the use of green synthesis offers advantages such as cost-effectiveness, the generation of non-toxic byproducts, ease of scaling up for large-scale production, and improved biocompatibility, particularly in clinical applications.19
Different parts of plants (leaves, flowers, roots, etc.) are available in phytochemicals and biomolecules, including polyphenols, flavonoids, alkaloids, saponin, terpenoids, amino acids, proteins, tannins, and glycosides.20,21 These compounds play a crucial role in reducing metal ions and acting as capping agents to minimize nanoparticle aggregation, making them ideal candidates for the green synthesis of zinc oxide nanoparticles (ZnONPs).20,21 This method is noted for its ease of synthesis, affordability, and safety.
Recent studies have utilized the C. jambhiri Lush. leaf extract to prepare ZnONPs for investigating their photocatalytic applications.22 Extracts of leaves from C. reticulata,23 and P. pinnata24 have been employed for the synthesis of ZnONPs. The bacterial and photocatalytic activities of the resulting ZnONPs were also studied. Indeed, Venkatesan et al.25 reported the preparation ZnONPs using E. milii leaf constituents to catalyze the decomposition of methylene blue under direct solar light irradiation. Additionally, ZnONPs synthesized using leaf extracts from two medicinal species, C. fistula and M. azedarach, demonstrated bactericidal applications against two clinical strains of S. aureus and E. coli.26
False daisy, scientifically identified as Eclipta prostrata L. and a member of the Asteraceae family, is commonly grown in tropical and subtropical regions such as Asia and Africa. This versatile herb features multiple branches, reaching heights of about 20–90 cm, and strigose leaves measuring approximately 2.2–8.5 cm long. The flowers are white or yellow and arranged in compact clusters. E. prostrata has been utilized in ancient healing traditions to address various conditions such as loose teeth, hemorrhagic, hepatic and renal issues, whitening of hair, dizziness, diabetes, respiratory problems, tuberculosis and more.27E. prostrata yields a diverse range of chemical compounds, including alkaloids, flavonoids, steroids, saponins, alkenynes, triterpenes, polyacetylenes, polypeptides and carbohydrates, all of which have been successfully isolated and identified.28
Piper longum L., belonging to the Piperaceae family, is predominantly cultivated for its fruits and grows across India, Indonesia, Brazil, Philippines, Myanmar, Vietnam, Thailand, and other regions.29 These plants are traditionally valued for their anticancer, spasmolytic, antidiabetic, anti-inflammatory, antimicrobial, hepatoprotection and cardioprotection properties. They are commonly used to treat conditions such as cough, constipation, stomachache, asthma and spleen-related diseases.30 The oblong, blunt and blackish-green P. longum fruits, measuring approximately 2.5–3.5 cm in length and 5 mm in thickness, showcase a spectrum of pharmacological activities.31 These include anticancer, anti-inflammatory, antimicrobial, antioxidant, immunomodulatory, larvicidal, hepatoprotective, antiplatelet, antihyperlipidemic, and antifungal properties.32 They contain numerous alkaloids such as rosin, piperchabaoside, guineensine, and piperlongumine, alongside compounds like lignans, esters, volatile oils, proteins, tannins, saponins, amino acids, phenols, starch, and carbohydrates.33,34 Due to the presence of these constituents, both E. prostrata and P. longum extracts play a pivotal role in bioreducing metal ions to nano-scale dimensions and acting as capping agents for nanoparticles. This capability is critical for achieving stability and biocompatibility in nanoparticle synthesis. Moreover, their rich chemical composition and associated medicinal benefits highlight their potential for efficient green synthesis of nanoparticles.
The primary objective of this study is to propose an eco-friendly and effective approach to synthesize ZnONPs using plant extracts from E. prostrata and P. longum as natural reducing and capping agents. The prepared ZnONPs underwent a detailed investigation to assess their structural, vibrational, optical, morphological, zeta potential, compositional, and band-gap properties through analytical techniques. Furthermore, the antibacterial activity of the synthesized ZnONPs was assessed against four bacterial strains: S. aureus, B. cereus, E. coli, and S. typhimurium. Additionally, the photocatalytic activity of ZnONPs was investigated by studying their ability to degrade an organic pollutant, specifically crystal violet dye. This study contributes to the green chemistry field by demonstrating the potential of plant extracts in the fabrication of multi-functional ZnONPs for wastewater treatment and biomedical engineering.
2 Materials and methods
2.1. Materials and characterization
Chemicals, raw materials (E. prostrata and P. longum), bacterial strains, and characterization are detailed in the ESI.†
2.2. Preparation of aqueous plant extracts
E. prostrata and P. longum were cleaned using distilled water to eliminate undesired impurities. The raw precursors were dried at 50 °C using an air drier to remove moisture. Then, the dried plants were finely ground using an electric mixer. For the extraction process, 2 g of the prepared powder was immersed in 100 mL distilled water and the mixture was magnetically agitated at 60 °C in 1 h. Subsequently, the mixture was filtered through Whatman No. 1 filter paper and the resulting supernatant was stored at 4 °C for further experiments.
2.3. Synthesis of ZnONPs using aqueous extracts of E. prostrata and P. longum
The green ZnONPs were fabricated based on a method published in a previous study.35 Initially, 80 mL of 0.1 M Zn(CH3COO)2 solution was combined with 30 mL of the aqueous extract of E. prostrata or P. longum. The resulting solution underwent stirring for 120 min at 80 °C. Subsequently, the pH of this mixture was adjusted to 7 using a 2 M NaOH solution and stirred continuously at 80 °C for another 60 min. Following this, centrifugation at 5000 rpm was carried out for 30 min to isolate the precipitate. This solid was then washed with deionized water and ethanol and then air-dried at 80 °C for 12 h. Finally, the obtained samples using E. prostrata or P. longum extract were calcined at 500 °C for 4 h in an air environment, denoted as ZnO_EPE and ZnO_PLE, respectively. The flow chart for the synthesis of ZnONPs is thoroughly described in Fig. 1.
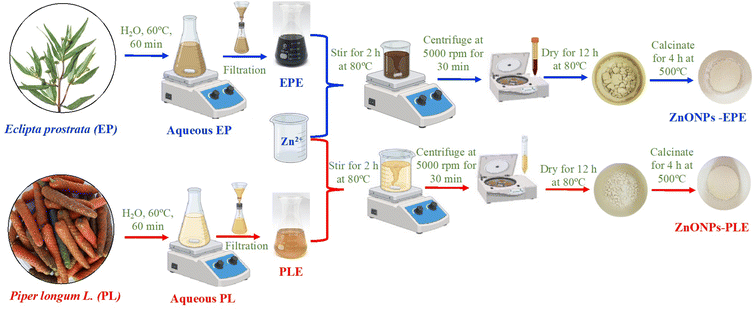 |
| | Fig. 1 Schematic representation of green synthesis of ZnONPs. | |
2.4. Antibacterial, antioxidant, and photocatalytic activities of ZnONPs
Antibacterial, antioxidant, and photocatalytic activities of ZnONPs are described in the ESI.†
3 Results and discussion
3.1. Phytochemical test and the mechanism for green synthesis of ZnONPs
The role of phytochemicals derived from extracts of E. prostrata and P. longum in the reduction and stabilization of ZnONPs was assessed using qualitative analysis methods. The results in Table 1 showcase the presence of flavonoids, saponins, steroids, phenolics, and tannins in the E. prostrata extract, while the P. longum extract contains alkaloids, flavonoids, saponins, phenolics, terpenoids, and tannins. Furthermore, the phenolic and flavonoid contents of the aqueous extracts of E. prostrata and P. longum were determined using the quantitative analysis method, as shown in Table 2. The results indicate that the phenolic content in the E. prostrata extract (37.72 mg GAE per g) was higher than that in the P. longum extract (20.83 mg GAE per g). A similar trend is observed for flavonoid content, with the total content of flavonoids (20.83 mg QE per g) in the E. prostrata extract being higher than that in the P. longum extract (5.82 mg QE per g).
Table 1 Phytochemical screening of E. prostrata leaf and P. longum fruit extracts
| Phytochemicals |
Resultsa |
|
E. prostrata extract |
P. longum extract |
|
(+++): indicates high intensity, (++) indicates medium intensity, (+) indicates presence, and (−) absence of phytochemical constituents.
|
| Alkaloids |
− |
+++ |
| Anthocyanins |
− |
− |
| Flavonoids |
+++ |
++ |
| Glycosides |
− |
− |
| Saponins |
+++ |
− |
| Steroid |
++ |
− |
| Phenolic compound |
+++ |
++ |
| Terpenoid |
− |
++ |
| Tannins |
+++ |
+++ |
Table 2 The amount of the phenolic and flavonoid compounds in the aqueous extracts of E. prostrata leaf (EPE) and P. longum fruit (PLE). Abbreviations: GAE, gallic acid equivalents; QE, quercetin equivalents
| Sample |
Phenolic compounds (mg GAE per each gram of the sample) |
Flavonoid compounds (mg QE per each gram of the sample) |
| EPE |
37.72 |
20.83 |
| PLE |
15.23 |
5.82 |
The precise mechanism of ZnONP production using the plant extracts remains incompletely understood, presenting a notable challenge for academic societies. At present, phytochemicals play an important role as reducing, capping and stabilizing agents in the synthesis of metal oxide nanoparticles, thereby controlling their size. In this study, the presence of phenolics, alkaloids, tannins and flavonoids containing –OH and –NH2 groups in the E. prostrata and P. longum extracts facilitates the formation of ZnONPs.36 The proposed mechanism for the formation of ZnONPs involves three main stages, as illustrated in Fig. 2. Firstly, the phytochemicals in the E. prostrata or P. longum extracts act as chelating agents, forming stable complexes with Zn2+ ions. Secondly, a hydrolysis reaction transforms these complexes into Zn(OH)2. Thirdly, calcination is employed to remove the phytochemicals and convert Zn(OH)2 into ZnO, initiating a growth phase through electrostatic interaction, leading to the formation of ZnONPs.
 |
| | Fig. 2 Plausible mechanism for green synthesis of ZnONPs using quercetin as one of the phytochemicals in the aqueous extract of E. prostrata leaves and P. longum fruits. | |
3.2. Effect of pH and [Zn2+]
The formation of ZnONPs is remarkably reliant on pH, which changes the electrical charges of biochemical compounds present in the plant extract. This modification may alter their ability to reduce, cap and stabilize, consequently influencing the growth of the nanoparticles.37 The formation of ZnONPs in the presence of either the E. prostrata leaves or P. longum fruit extract was conducted across a pH range of 7–10. Fig. 3 illustrates the XRD pattern of the ZnONPs synthesized through the green process, depicting pH changes during the ZnO nanoparticle synthesis. The diffraction peaks of ZnO_EPE conducted at pH 7 were observed at 32.13°, 34.78°, 36.61°, 47.88°, 56.94°, 63.20°, 66.72°, 68.28°, 69.40°, 72.88°, and 77.30°. Additionally, ZnO_EPE peaks for pH 8 exhibited diffraction angles (2θ) of 32.01°, 34.66°, 36.48°, 47.77°, 56.82°, 63.09°, 66.63°, 68.17°, 69.29°, 72.79°, and 77.19°. Similarly, the peaks of ZnO_EPE at pH 9 were positioned at 32.09°, 34.74°, 36.57°, 47.86°, 56.91°, 63.17°, 66.70°, 68.26°, 69.38°, 72.87°, and 77.26°. Furthermore, diffraction peaks of ZnO_EPE at pH 10 displayed 2θ values of 32.04°, 34.70°, 36.52°, 47.81°, 56.85°, 63.12°, 66.68°, 68.21°, 69.32°, 72.79°, and 77.21°. These 2θ values aligned with diffraction planes (100), (002), (101), (102), (110), (103), (200), (112), (201), (004), and (202), respectively, matching with the hexagonal wurtzite structure of ZnONPs (JCPDS no. 36-1451).38 Importantly, the XRD pattern of ZnO_EPE showed no impurity peaks, affirming the pure nature of ZnO_EPE.
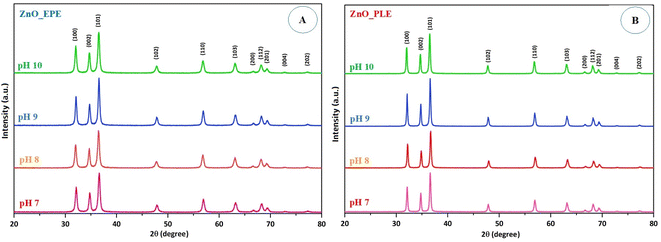 |
| | Fig. 3 XRD pattern of (A) ZnO_EPE and (B) ZnO_PLE synthesized at different pH values. | |
The average particle sizes of ZnO_EPE nanoparticles at pH 7, pH 8, pH 9, and pH 10, determined based on the most intense diffraction peak at 2θ = 36° (101) using the Debye–Scherrer equation, were 17.30 nm, 17.62 nm, 20.73 nm and 18.09 nm, respectively. Similar observations were noted in ZnO_PLE. The XRD pattern of ZnO_PLE at different pH values showed diffraction peaks located around 32° (100), 34° (002), 36° (101), 47° (102), 56° (110), 63° (103), 66° (200), 68° (112), 69° (201), 72° (004), and 77° (202), indicating that ZnO_PLE nanoparticles exhibit a fine hexagonal crystalline structure. The absence of diffraction peaks rather than peaks of ZnONPs suggests that the ZnONPs were uncontaminated by additional phase impurities, underscoring their elevated phase purity. The average crystallite sizes of ZnO_PLE nanoparticles at pH 7, pH 8, pH 9, and pH 10 were found to be 26.23 nm, 27.74 nm, 29.47 nm, and 27.77 nm, respectively. The outcomes showed that crystallite sizes of ZnO_EPE as well as ZnO_PLE gradually increased with increase in pH, and a slight decrease occurred at higher pH owing to the dissolution of ZnONPs, leading to smaller particle sizes and agglomeration.39
The impact of Zn2+ concentrations on the particle size of both ZnO_EPE and ZnO_PLE was determined at different concentrations (0.05–0.2 M). The XRD pattern of all samples in Fig. 4 shows the peaks at 32°, 34°, 36°, 47°, 56°, 63°, 66°, 68°, 69°, 72°, and 77°, which correspond to the hexagonal crystalline structure of ZnONPs. The average crystallite sizes of ZnO_EPE at Zn2+ concentrations of 0.05 M, 0.10 M, 0.15 M, and 0.20 M were calculated to be 20.32 nm, 17.67 nm, 18.55 nm and 18.97 nm, respectively. Similarly, the corresponding average crystallite sizes of ZnO_PLE were found to be 26.23 nm, 22.07 nm, 21.29 nm, and 23.27 nm. According to these results, a rise in [Zn2+] tended to lower the crystallite size of ZnONPs. This phenomenon could be explained by an increase in Zn2+ concentration up to an optimum level subsequently facilitating accelerated particle growth, yielding nanoparticles of smaller size. However, at higher [Zn2+], the ZnONP size slightly increased. At higher [Zn2+] in the reaction mixture, it is possible to observe the shortage of functional groups, enhancing aggregation of growing nanoparticles, giving rise to bigger size nanoparticles.40 Kaningini et al.41 reported that concentrations of zinc nitrate hexahydrate up to 1 g lead to the formation of a smaller crystallite size of ZnO nanoparticles, while the crystallite size increased at 5 g of zinc nitrate hexahydrate.
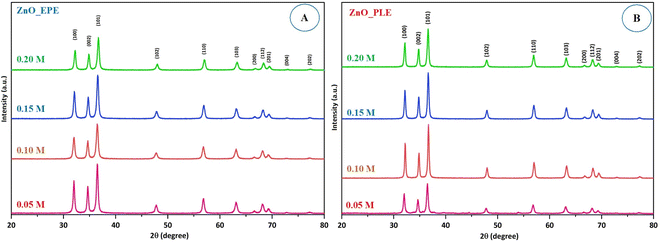 |
| | Fig. 4 XRD pattern of (A) ZnO_EPE and (B) ZnO_PLE synthesized at different Zn2+ concentrations. | |
3.3. Surface chemistry
Surface chemistry analysis identifies chemical bonds present in both the plant extract and the synthesized ZnONPs. The spectra of the EPE extract and ZnO_EPE nanoparticles are shown in Fig. 5a and b. The FTIR spectrum of EPE (Fig. 5a) reveals bands at 3436 cm−1 referring to O–H stretching of phenolic compounds, at 2974 cm−1 for –CH stretching vibration, at 1643 cm−1 for C![[double bond, length as m-dash]](https://www.rsc.org/images/entities/char_e001.gif) C stretching of aromatic compounds such as flavonoids, at 1394 cm−1 for C–H bonds in aldehydes, at 1054 cm−1 for C–O ether stretch, and at 879 cm−1 for N–H amine stretch. These results are in good agreement with those reported by Maheswari et al.42 The FTIR spectrum (Fig. 5b) of ZnO_EPE nanoparticles exhibited a characteristic band at around 460–490 cm−1 corresponding to the stretching vibrations of Zn–O.43 A broad peak at 3515 cm−1 could be attributed to the –OH group and surface water of ZnO_EPE nanoparticles. Meanwhile, the spectra of the PLE extract and ZnO_PLE nanoparticles are shown in Fig. 5c and d. The peaks of PLE were observed at 3305 cm−1 (–OH stretching vibration), 2927 cm−1 (–CH stretching of aromatic compound), 1636 cm−1 (C
C stretching of aromatic compounds such as flavonoids, at 1394 cm−1 for C–H bonds in aldehydes, at 1054 cm−1 for C–O ether stretch, and at 879 cm−1 for N–H amine stretch. These results are in good agreement with those reported by Maheswari et al.42 The FTIR spectrum (Fig. 5b) of ZnO_EPE nanoparticles exhibited a characteristic band at around 460–490 cm−1 corresponding to the stretching vibrations of Zn–O.43 A broad peak at 3515 cm−1 could be attributed to the –OH group and surface water of ZnO_EPE nanoparticles. Meanwhile, the spectra of the PLE extract and ZnO_PLE nanoparticles are shown in Fig. 5c and d. The peaks of PLE were observed at 3305 cm−1 (–OH stretching vibration), 2927 cm−1 (–CH stretching of aromatic compound), 1636 cm−1 (C![[double bond, length as m-dash]](https://www.rsc.org/images/entities/char_e001.gif) C), 1445 cm−1 (–OH bond of polyphenols), and 1038 cm−1 (C–O–C).44 Similar to the FTIR spectrum of ZnO_EPE, a characteristic peak at around 460–490 cm−1 is present, assigned to Zn–O bonds of ZnO_PLE nanoparticles.43
C), 1445 cm−1 (–OH bond of polyphenols), and 1038 cm−1 (C–O–C).44 Similar to the FTIR spectrum of ZnO_EPE, a characteristic peak at around 460–490 cm−1 is present, assigned to Zn–O bonds of ZnO_PLE nanoparticles.43
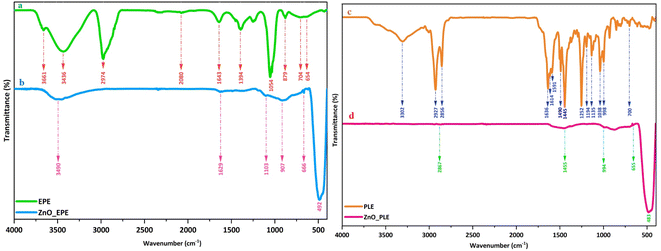 |
| | Fig. 5 FTIR spectra of (a) EPE, (b) ZnO_EPE, (c) PLE and (d) ZnO_PLE. | |
3.4. Optical properties
The optical absorption behavior of biosynthesized ZnO_EPE and ZnO_PLE nanoparticles was assessed using UV-DRS profiles, as shown in Fig. 6A. The spectra revealed that the absorption band edges at 415 nm for ZnO_EPE and 407 nm for ZnO_PLE may be attributed to the electron transition from the valence band (VB) to the conduction band (CB), corroborating prior research findings.45 To further analyze the optical properties, the Kubelka–Munk function (eqn (2)) is employed to transform diffuse reflectance data into absorption coefficients (α). As illustrated in Fig. 6B, absorption bands at 381 nm and 375 nm are observed for ZnO_EPE and ZnO_PLE nanoparticles, consistent with existing literature.46 The bandgap energy of ZnO_EPE and ZnO_PLE was measured using the Kubelka–Munk function (eqn (1)) and Tauc's equation (eqn (2)), as follows:| | | F(RE) = (1 − RE)2/(2 × RE) | (1) |
where R, E, h, B, ν, n and Eg represent the reflectance coefficient, photon energy, Planck constant, a constant coefficient, frequency, the type of optical transition of the semiconductor (for indirect transition n = 1/2 and for direct transition n = 2) and bandgap energy, respectively. Direct bandgap values are determined to be 3.10 eV for ZnO_EPE and 3.16 eV for ZnO_PLE, corresponding to indirect bandgap values of 2.84 eV and 2.90 eV, as depicted in Fig. 6C and D. The findings reveal subtle discrepancies in bandgap energies attributed to the difference in plant extracts utilized in the ZnONP production. This observation aligns with established literature on green-synthesized ZnO nanoparticles and direct bandgap energies of both biosynthesized ZnO nanoparticles.47
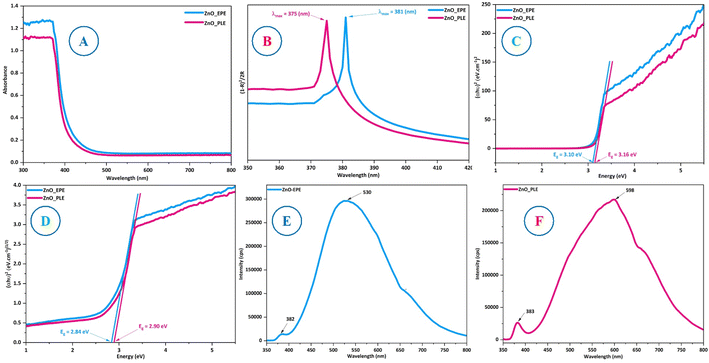 |
| | Fig. 6 (A) UV-Vis DRS profiles, (B) UV-Vis spectra, (C) direct bandgap values, (D) indirect bandgap values, and (E and F) photoluminescence spectra of ZnO_EPE and ZnO_PLE. | |
The photoluminescence (PL) spectra of ZnO_EPE and ZnO_PLE at an excitation wavelength of 325 nm are shown in Fig. 6E and F. Both types of biosynthesized ZnO exhibit distinct peaks. The PL spectra of ZnO_EPE nanoparticles showed a UV emission peak at 382 nm and a broad-deep level visible emission peak at 530 nm. Similarly, the PL spectra of ZnO_PLE nanoparticles revealed peaks around 383 nm and 598 nm. The initial peaks at approximately 382 nm or 383 nm denote UV arising from the band edge of the ZnO_EPE or ZnO_PLE nanoparticles, indicating the recombination of free excitons through an exciton–exciton collision process.48 The calculated bandgaps for these emissions, 3.25 eV and 3.24 eV respectively, align closely with the Tauc plot band gap, as depicted in Fig. 6C. Furthermore, the second broad-deep level emission peaks of ZnO_EPE at 530 nm and ZnO_PLE at 538 nm are attributed to the radiative recombination of holes in the VB and electrons in the CB, associated with singly ionized oxygen vacancies.49 These findings corroborate existing literature on ZnO nanoparticle photoluminescence behavior.50
3.5. Zeta potential and BET surface analysis
Zeta potential measurement provides information about surface charges present on ZnO nanoparticles, thus contributing to a deeper understanding of their potential stability in colloidal suspension. Furthermore, zeta potential can provide valuable insights into the particle distribution and aggregation behavior. Nanoparticles with large negative or positive zeta potential values experience no aggregation due to electrostatic repulsion among the particles, leading to an increase in the stability of the formulation.51 Meanwhile, particles with low zeta potential values tend to aggregate due to interparticle van der Waals attractions. Typically, zeta potential values higher than +30 mV or lower than −30 mV are considered indicative of good nanoparticle stability.52 The zeta potential values of the biosynthesized ZnONPs, as shown in Fig. 7, were found to be −42.2 mV for ZnO_EPE and −62.6 mV for ZnO_PLE, confirming the stability of the synthesized ZnO nanoparticles.
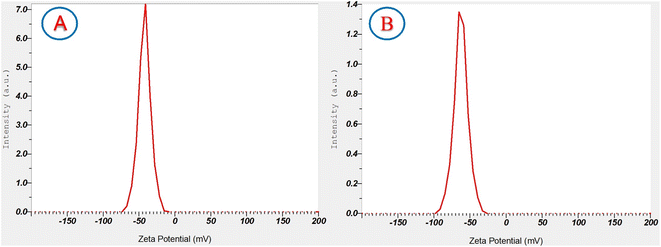 |
| | Fig. 7 Zeta potential of (A) ZnO_EPE and (B) ZnO_PLE nanoparticles. | |
The antibacterial, antioxidant, and photocatalytic activities of ZnONPs are widely recognized to be influenced by their specific surface area (SBET). Through BET analysis, SBET values of ZnO_EPE and ZnO_PLE NPs were measured to be relatively low, at around 8.6 m2 g−1 and 8.0 m2 g−1, respectively. The results indicate that ZnO_EPE NPs possess a slightly larger surface area with a greater abundance of active sites compared to ZnO_PLE NPs. Similarly, several studies also reported low surface areas of ZnONPs biosynthesized using the Pontederia crassipes leaf extract (SBET,ZnO: 12.8 m2 g−1),53Zea mays husk extract (SBET,ZnO: 11.3 m2 g−1),54 and Artocarpus heterophyllus peel extract (SBET,ZnO: 6.6 m2 g−1).54 This distinction suggests that ZnO_EPE NPs may exhibit enhanced bioactive applications and photocatalytic processes relative to ZnO_PLE NPs.
3.6. Morphology and composition
The morphology and size of green synthesized ZnO_EPE and ZnO_PLE nanoparticles were examined using SEM as shown in Fig. 8A and B. The outcomes reveal that the morphology of ZnO_EPE was uneven, with heterogeneous particles exhibiting quasi-spherical and rod-like shapes with aggregations. This irregular shape is common in metal oxides formed during solution combustion processes.55 The particles of ZnO_PLE show spherical shapes with little agglomeration, as represented in Fig. 8C and D. This agglomeration observed in SEM images can be attributed to high polarity and electrostatic attraction between ZnONPs.56 The sizes of ZnO_EPE and ZnO_PLE were determined to be 16–58 nm and 27–78 nm, respectively. The morphology and size of the ZnO_EPE and ZnO_PLE are also shown in TEM micrographs (Fig. 9). Fig. 9A and B display the TEM images of the spherical shaped ZnO_EPE in selected areas where the uniform spheres have particles size from 14 nm to 58 nm. The TEM images of ZnO_PLE shown in Fig. 9C and D show that the shape of the nanoparticles is spherical and their size ranges from 16 nm to 97 nm. These results are in accordance with the SEM observations (Fig. 8) and are higher than their crystal sizes calculated from XRD profiles owing to the polycrystalline aggregation.57 Recent research on the green synthesis of ZnONPs, along with various morphologies and sizes, is listed in Table 3. EDX measurements were carried out to determine the elemental composition of the ZnO_EPE and ZnO_PLE, with the results presented in Fig. 8E and F. The EDX spectrum of both ZnO samples showed only the presence of zinc (Zn) and oxygen (O) without any other compositions, indicating the formation of biosynthesized ZnO nanoparticles in a pure chemical state. The quantitative analysis of all elemental constituents of ZnO_EPE and ZnO_PLE is summarized in the table inserted in Fig. 8E and F. The compositions of obtained peaks were Zn (53.73%) and O (46.27%) for ZnO_EPE while the chemical composition of ZnO_PLE exhibited Zn (50.29%) and O (49.71%). These results closely align with the findings of the chemical composition [Zn (43.07%) and O (56.93%)] of ZnONPs synthesized using the R. tuberosa extract as reported by Vasantharaj et al.58
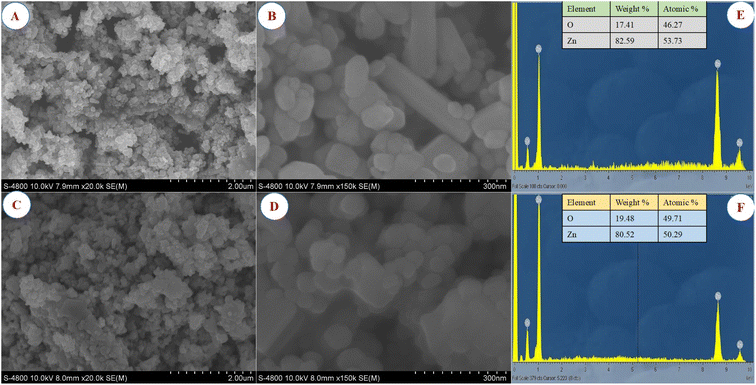 |
| | Fig. 8 Low and high magnification SEM images of (A and B) ZnO_EPE and (C and D) ZnO_PLE; EDX spectra and elemental composition (table inset) of (E) ZnO_EPE and (F) ZnO_PLE. | |
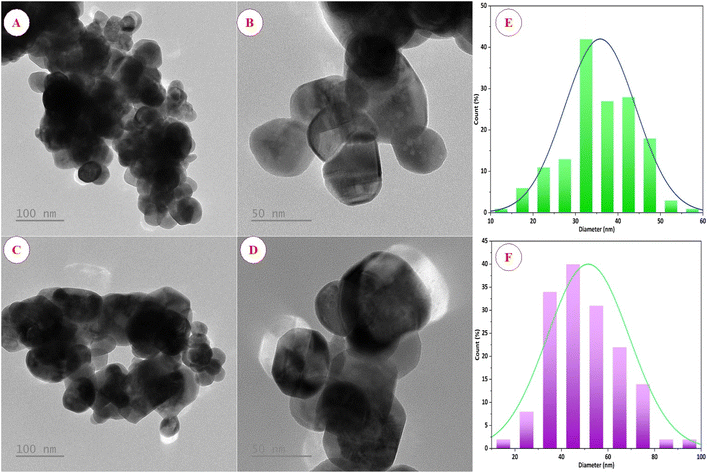 |
| | Fig. 9 TEM images (C and D) at low and high magnifications and size distribution histograms of ZnO_EPE (A, B and E) and ZnO_PLE (C, D and F). | |
Table 3 Comparison of properties and applications of green ZnONPs synthesized using different plant extracts
| Zn source |
Plant source |
Particle size |
Morphology |
Application |
Reference |
| Zinc acetate |
A. esculentus mucilage |
20–70 nm |
Spherical and rod shape |
Photocatalytic degradation |
59
|
| Zinc acetate |
M. fragrans fruit |
41.23 nm |
Spherical or elliptical shape |
Photocatalytic degradation, antibacterial, antidiabetic, antiparasitic, larvicidal and antioxidant activity |
60
|
| Zinc acetate |
A. barbadensis Mill. leaf |
35 nm |
Spherical shape |
Seeding growth and germination |
61
|
| Zinc nitrate |
P. hysterophorus L. leaf |
27–84 nm |
Spherical and hexagonal shape |
Antifungal activity |
62
|
| Zinc nitrate |
Zea mays husk, A. heterophyllus peel, P. granatum peel |
28–74 nm |
Flower shape |
Antibacterial and antioxidant activity |
54
|
| Zinc acetate |
E. prostrata leaves |
14–58 nm |
Spherical and rod shape |
Photocatalytic degradation, antibacterial and antioxidant activity |
Present work |
| Zinc acetate |
P. longum fruits |
16–97 nm |
Spherical shape |
Photocatalytic degradation, antibacterial and antioxidant activity |
Present work |
3.7. Photocatalytic performance of green ZnONPs
The investigation into the photocatalytic performance of ZnONPs biosynthesized utilizing extracts from the E. prostrata or P. longum was conducted by evaluating the degradation efficiency under direct solar light irradiation. Fig. 10 shows that both ZnO_EPE and ZnO_PLE exhibited poor CV dye adsorption percentages at approximately 6.11% and 6.40%, respectively, after 60 min of stirring in darkness. Adsorption works out thanks to the electrostatic attraction between the negative charges of ZnONPs and the positive charges of CV dye. The results from the photocatalytic degradation of CV under solar light for both ZnO_EPE and ZnO_PLE suggest significantly high photocatalytic activity. In particular, ZnO_PLE nanoparticles demonstrated superior degradation, achieving a remarkable 99.90% degradation at 120 min, while ZnO_EPE nanoparticles attained a slightly lower degradation of 95.64%. This difference is elucidated by the substantial amount of CV adsorbed on the ZnO_PLE surface, coupled with dispersion and size distribution of ZnONPs, contributing to enhanced photocatalytic efficiency. Indeed, the photocatalytic performance of ZnONPs depends on their morphology, size, and crystallographic structure.63 The solar light-induced CV degradation kinetics catalyzed by ZnO_EPE or ZnO_PLE could be assessed using the Langmuir–Hinshelwood equation (eqn (3)).| |  | (3) |
where Co: CV concentration at t = 0 min, Ct: CV concentration at any time t, and k: rate constant of the pseudo first-order reaction. Fig. 10E demonstrates that the rate constant (k) of ZnO_PLE is 0.0593 min−1, which is higher than that of ZnO_EPE (0.0273 min−1), indicating that ZnO_PLE exhibits better photo-reactivity towards CV dye than ZnO_EPE.3 Comparative results of the photocatalytic performance of various NPs are listed in Table 4, indicating higher activities of both ZnO_PLE and ZnO_EPE.
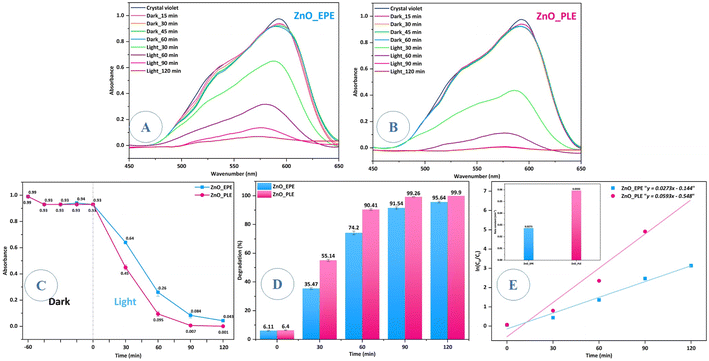 |
| | Fig. 10 Photocatalytic activity of ZnO_EPE and ZnO_PLE: (A–C) absorption spectra of CV dye versus irradiation time, (D) photocatalytic degradation versus irradiation time, (E) pseudo-first order kinetics for CV degradation versus irradiation time. | |
Table 4 Comparison of photocatalytic performance of biosynthesized NPs for degradation of dyes
| Nanomaterial |
Synthesis method |
Light source |
Target |
Degradation time |
Reference |
| In2O3 NPs |
Green synthesis |
W-lamp light |
Crystal violet |
93.7% in 80 min |
64
|
| Cu–Ni NPs |
Green synthesis |
UV light |
Crystal violet |
95.6% in 160 min |
65
|
| CuO NPs |
Green synthesis |
Sunlight |
Crystal violet |
87.0% in 100 min |
66
|
| ZnONPs |
Co-precipitation |
UV light |
Crystal violet |
82.0% in 240 min |
67
|
| ZnONPs |
Green synthesis |
UV light |
Crystal violet |
76.0% in 90 min |
68
|
| Methylene blue |
81.5% in 120 min |
| Phenol red |
83.0% in 90 min |
| ZnO_EPE NPs |
Green synthesis |
Sunlight |
Crystal violet |
95.6% in 120 min |
Present work |
| ZnO_PLE NPs |
Green synthesis |
Sunlight |
Crystal violet |
99.9% in 120 min |
Present work |
The photocatalysis mechanism, as illustrated in Fig. 11, was proposed to further understand the role of ZnO_EPE or ZnO_PLE in degradation of CV. First, under solar irradiation, ZnO nanoparticles were subjected to energy equal to or greater than bandgap energies (in this case, 3.16 eV for ZnO_EPE and 3.10 eV for ZnO_PLE). This led to the excitation of electrons from the VB to CB, generating electron–hole pairs that migrated to the surface of ZnONPs. Subsequently, holes in the valence band directly oxidized with H2O or OH−, yielding hydroxyl radicals (˙OH), while the photogenerated electrons in the conduction band reduced O2, giving rise to superoxide anion radicals (O2˙−). Ultimately, O2˙− and ˙OH radicals played a crucial role in degrading crystal violet in the water-based solution, yielding environmentally friendly and non-toxic byproducts such as CO2 and H2O as shown in the equations below:
| ZnONPs + hν → ZnONPs (h+, VB) + ZnONPs (e−, CB) |
| ZnONPs (e−, CB) + O2 → ZnONPs + O2˙− |
| ZnONPs (h+) + H2O or OH− → ZnONPs + OH˙ + H+ |
| ZnONPs (h+) + CV → ZnONPs + CV+ |
| CV+ + O2˙− + ˙OOH → CO2 + H2O |
 |
| | Fig. 11 Plausible mechanism for photodegradation of CV dye of ZnO_EPE and ZnO_PLE. | |
To investigate the role of radicals in decomposition of crystal violet dye, runs were conducted the same as standard experiments and addition of 0.5 mM tert-butanol (t-BuOH), p-benzoquinone (BQ), and triethanolamine (TEOA) as scavengers for the hydroxyl radical (OH˙), superoxide radical (O2˙−), and holes (h+), respectively. As depicted in Fig. 12, the photocatalytic efficiency of ZnO_EPE and ZnO_PLE decreased when p-benzoquinone was added as a superoxide radical scavenger, dropping from 94.87% to 57.85% and from 99.52% to 70.53%, respectively, compared to conditions without a scavenger. Similarly, in the presence of triethanolamine as a hole scavenger, the degradation rate of CV was 72.65% (for ZnO_EPE) and 76.61% (for ZnO_PLE). However, tert-butanol had no significant effect on CV dye degradation, indicating that OH˙ had a lesser impact on the photocatalytic reaction. These results indicate that the role of holes and electrons were not identical, suggesting that O2˙− was generated by the reaction between CB electrons and O2. Since the CV dye degradation was affected by addition of triethanolamine, the direct impact of photogenerated holes on the dye degradation process should also be considered. Consequently, the photocatalytic reaction mechanism involves pivotal species, which can be specified as O2˙−, h+, and OH˙.
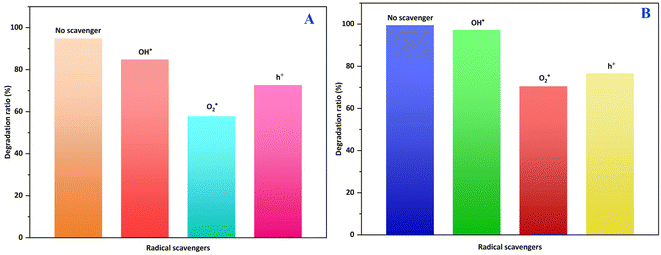 |
| | Fig. 12 The photocatalytic activity of (A) ZnO_EPE and (B) ZnO_PLE in the presence of t-BuOH, TEOA, and BQ for the degradation of CV dye. | |
3.8. Bioactive applications
3.8.1. Antibacterial activity.
Antibacterial activity of ZnO_EPE and ZnO_PLE was investigated against Gram-negative bacteria (E. coli and S. typhimurium) and Gram-positive bacteria (S. aureus and B. cereus), as shown in Fig. 13. According to Table 5, both types of ZnONPs in this study exhibited good antibacterial activity. ZnO_EPE NPs demonstrated potent antibacterial activity against S. aureus and B. cereus, with inhibition zones measuring 18.5 ± 0.1 mm and 13.6 ± 0.3 mm, respectively, which were higher compared to ZnO_PLE NPs, which exhibited inhibition zones of 13.4 ± 0.3 mm for S. aureus and 11.9 ± 0.3 mm for B. cereus. However, the inhibition zones of ZnO_EPE NPs against E. coli (9.6 ± 0.3 mm) and S. typhimurium (10.1 ± 0.3 mm) were similar to those of ZnO_PLE NPs (9.9 ± 0.6 mm against E. coli and 10.1 ± 0.1 mm). This discrepancy in activity can be attributed to variation in the surface area between ZnO_EPE (8.582 m2 g−1) and ZnO_PLE (7.998 m2 g−1), with a larger surface area facilitating enhanced interaction with bacteria, thereby augmenting antimicrobial activity.69
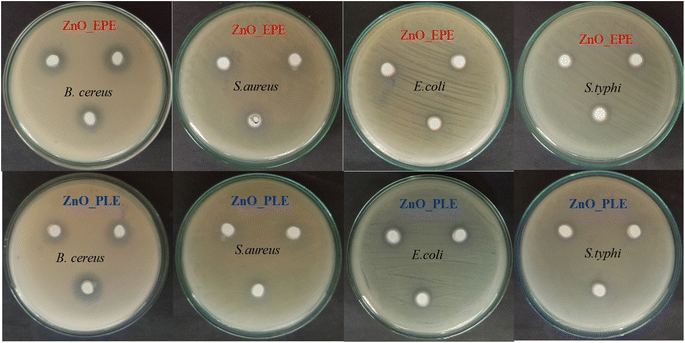 |
| | Fig. 13 Antibacterial activity of ZnO_EPE and ZnO_PLE nanoparticles against E. coli, S. aureus, B. cereus and S. typhi. | |
Table 5 Antibacterial assay of synthesized ZnO nanoparticles against the test bacteria
| Bacterial species |
Zone of inhibition (mm) |
| ZnO_EPE |
ZnO_PLE |
|
S. aureus
|
18.5 ± 0.1 |
13.4 ± 0.3 |
|
B. cereus
|
13.6 ± 0.3 |
11.9 ± 0.3 |
|
E. coli
|
9.6 ± 0.3 |
9.9 ± 0.6 |
|
S. typhimurium
|
10.1 ± 0.3 |
10.1 ± 0.1 |
The minimum inhibitory concentration (MIC) data were obtained using the broth dilution method for both S. aureus and E. coli bacterial strains to determine the minimum quantity of ZnONPs needed to inhibit microbial growth. As depicted in Fig. 14, ZnO_EPE NPs exhibit MIC values of 62.5 μg mL−1 and 31.2 μg mL−1 against E. coli and S. aureus bacteria, respectively. Compared to ZnO_PLE NPs, the MIC values of ZnO_EPE NPs were similar, indicating their potent antibacterial properties. The results suggest that both ZnO_EPE and ZnO_PLE NPs are bacteriostatic at low concentrations. Previous reports also revealed that the MIC values of ZnONPs biosynthesized using the A. altissima leaf extract against E. coli, K. pneumoniae, S. aureus and S. pyogenes were 0.3125 mg mL−1, 0.625 mg mL−1, 0.3125 mg mL−1 and 0.625 mg mL−1, respectively.70
 |
| | Fig. 14 MIC values of ZnO_EPE and ZnO_PLE NPs against E. coli and S. aureus bacteria. | |
As a result, both ZnO_EPE and ZnO_PLE NPs may be more effective against Gram-(+) bacteria than against Gram-(−) bacteria. This finding aligns with antibacterial activity of ZnONPs synthesized using the A. marmelos leaf extract, which was greater against Gram-(+) (S. aureus) than Gram-(−) (K. pneumonia) bacteria as reported by Dhiman et al.71 In another study, Şahin et al.72 utilized the aqueous leaf extract of T. syriacus to synthesize ZnONPs. These authors observed a stronger antibacterial activity against Gram-(+) bacteria such as C. michiganensis and B. subtilis, compared to Gram-(−) bacteria including P. syringae, P. cichorii, X. axonopodis and P. carotovorum. Similarly, Sama et al.73 also reported that ZnONPs biosynthesized using the C. album L. leaf extract had less antimicrobial activity against Gram-(−) bacteria than against Gram-(+) bacteria. Their investigations highlighted a greater resistance of Gram-negative E. coli to ZnO nanocrystals compared to Gram-positive S. aureus.
The mentioned phenomenon underscores the importance of considering the differing cell wall structures of Gram-(+) and Gram-(−) bacteria in contact with ZnONPs. Gram-(+) bacteria possess a thick cell wall with multilayers of peptidoglycan. By contrast, Gram-(−) bacteria have a thinner cell wall with a peptidoglycan layer.74 The ZnO nanoparticles attach directly to the outer cell wall of Gram-(+) bacteria, which consists of plenty of pores facilitating nanoparticle penetration, resulting in intracellular content leakage, causing cell death without cell breakage (Fig. 15). On the other hand, ZnO nanoparticles interact directly with the outer cell wall of Gram-(−) bacteria, which contains lipoprotein, phospholipids, and lipopolysaccharide, acting as a barrier against ZnO nanoparticles penetration.75 In contrast, a previous study reported that the antibacterial activity of synthesized ZnONPs from date pulp waste was more efficient against Gram-(−) than Gram-(+) bacterial pathogens.76 Additionally, Aldeen et al.3 investigated the antibacterial activity of ZnONPs synthesized from P. roebelenii leaves against S. aureus, S. pneumoniae, E. coli and S. typhi bacteria. The results revealed that the biosynthesized ZnONPs exhibited the most significant effect against Gram-(−) bacteria compared to Gram-(+) bacteria. ZnONPs have various mechanisms for causing antibacterial action, the most common of which is the interaction between nanoparticles and bacteria, the release of Zn2+ ion, penetration through the cell membrane, and the generation of reactive oxygen species to destroy lipids, protein and bacterial DNA, ultimately leading to bacteria death (Fig. 15).77
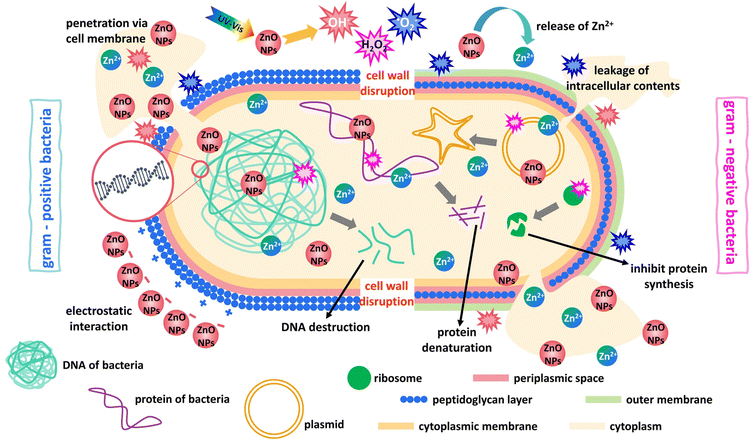 |
| | Fig. 15 Proposed mechanism of antibacterial activity of ZnONPs. | |
3.8.2. Antioxidant activity.
Antioxidant assays were conducted on ZnO_EPE and ZnO_PLE nanoparticles using DPPH and ABTS free radical scavenging assays, commonly utilized to evaluate the radical scavenging activity of nanoparticles. When the concentration of both biosynthesized ZnO increased from 250 μg mL−1 to 2500 μg mL−1, the percentage inhibition also increased (Fig. 16). At 2500 μg mL−1, ZnO_EPE exhibited a maximum DPPH free radical inhibition of 80.83%, while ZnO_PLE showed 83.37% inhibition. Similarly, for ABTS free radicals, ZnO_EPE and ZnO_PLE demonstrated inhibition rates of 99.30% and 99.67%, respectively. Here, both ZnO_EPE and ZnO_PLE NPs exhibited stronger inhibition of the ABTS radical compared to the DPPH radical. This finding may be attributed to the heightened sensitivity of ABTS, as it displays faster reaction kinetics, thereby generating a more pronounced response to antioxidants.78 In Table 6, the percentages of DPPH and ABTS free radicals scavenged by gallic acid, a well-known standard antioxidant, were compared to those scavenged by ZnO_EPE and ZnO_PLE nanoparticles as well as EPE and PLE extracts. The biosynthesized ZnONPs and plant extracts displayed a moderate scavenging capability compared to the standard gallic acid. Notably, the comparison investigation revealed that ZnO_PLE showed an antioxidant capacity on par with that of ZnO_EPE NPs. In the ABTS assay, the IC50 values of ZnO_EPE and ZnO_PLE were 1533.32 μg mL−1 and 1390.80 μg mL−1, respectively, whereas for DPPH assay, the IC50 values were observed as 925.70 μg mL−1 and 767.88 μg mL−1, respectively. Therefore, the results indicate that both ZnO_EPE and ZnO_PLE nanoparticles possess promising antioxidant properties.
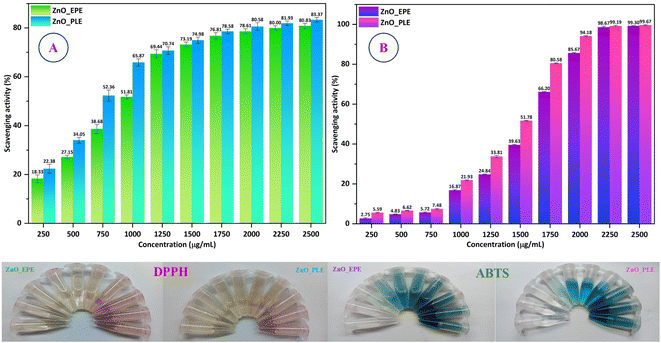 |
| | Fig. 16 (A) DPPH and (B) ABTS scavenging studies of ZnO_EPE and ZnO_PLE nanoparticles. | |
Table 6 Antioxidant activity of ZnO nanoparticles
| Samples |
IC50 (μg mL−1) |
| DPPH |
ABTS |
| ZnO_EPE |
925.69 ± 24.10 |
1546.90 ± 2.53 |
| ZnO_PLE |
767.84 ± 13.85 |
1415.62 ± 1.77 |
| EPE |
1270.03 ± 9.80 |
2049.64 ± 4.25 |
| PLE |
1891.87 ± 10.90 |
2433.60 ± 6.85 |
| GA |
1.30 ± 0.01 |
10.19 ± 0.01 |
4 Conclusion
Here, ZnONPs were successfully synthesized through a green method using E. prostrata leaves and P. longum fruits as reducing and capping agents. Comprehensive characterization of the biosynthesized ZnONPs was performed, encompassing structural, morphological, optical and elemental analyses conducted via FTIR, SEM, TEM, XRD, DRS and EDX. The ZnO_EPE exhibited quasi-spherical and rod-like shapes ranging from 16–58 nm, while the ZnO_PLE showcased spherical morphology with an average diameter of 27–78 nm. FTIR analysis confirmed the presence of Zn–O bond peaks within the range of 460–490 cm−1. Zeta potential measurements demonstrated negative values (−42.2 mV for ZnO_EPE and −62.6 mV for ZnO_PLE), indicating enhanced stability. In terms of CV dye degradation under natural sunlight, ZnO_PLE exhibited superior catalytic activity (99.90%) compared to ZnO_EPE (95.64%). Furthermore, ZnO_PLE and ZnO_EPE pseudo-first order kinetics were calculated to be 0.0593 min−1 and 0.0273 min−1, respectively. Principally, the superoxide radical (O2˙−) was responsible for the degradation of CV dye contaminants. In the biological studies, both ZnO_EPE and ZnO_PLE demonstrated pronounced antibacterial activity against Gram-(+) bacterial strains compared to Gram-(−) bacterial strains and exhibited antioxidant properties. Overall, the ZnONPs obtained in this study have a promising future in photocatalytic, antimicrobial and antioxidant applications.
Data availability
The data supporting this article have been included as part of the ESI.†
Author contributions
Tran Thanh Xuan: software, investigation. Bien Thi Lan Thanh: methodology, supervision. Thuan Van Tran: conceptualization, validation, writing – review & editing. Nguyen Thi Thanh Thuy: conceptualization, methodology, writing – original draft, supervision, project administration.
Conflicts of interest
The authors declare no conflict of interest.
Acknowledgements
This research was funded by the Ministry of Education and Training (MOET), Vietnam under Grant Code: B2024-NLS-02. The authors sincerely thank the Ministry of Education and Training and Nong Lam University Ho Chi Minh City supported the implementation of this study.
References
- S. Kumar, N. Bithel, S. Kumar, Kishan, M. Sen and C. Banerjee, S. Afr. J. Bot., 2024, 164, 146–151 CrossRef CAS.
- A. Dey, Mater. Sci. Eng., B, 2018, 229, 206–217 CrossRef CAS.
- T. S. Aldeen, H. E. Ahmed Mohamed and M. Maaza, J. Phys. Chem. Solids, 2022, 160, 110313 CrossRef CAS.
- M. Gadewar, G. K. Prashanth, M. Ravindra Babu, M. S. Dileep, P. Prashanth, S. Rao, M. Mahadevaswamy, M. Kumar Ghosh, N. Singh, S. K. Mandotra, A. Chauhan, S. Rustagi, R. Yogi, S. Chinnam, B. Ali, S. Ercisli and E. Orhan, J. Saudi Chem. Soc., 2024, 28, 101774 CrossRef CAS.
- M. Janani, T. Gomathi, R. Babujanarthanam and K. Kaviyarasu, J. King Saud Univ., Sci., 2023, 35, 102753 CrossRef.
- N. Rani, S. Rani, H. Patel, Bhavna, S. Yadav, M. Saini, S. Rawat and K. Saini, Inorg. Chem. Commun., 2023, 150, 110516 CrossRef CAS.
- R. Sha, S. K. Puttapati, V. V. Srikanth and S. Badhulika, J. Electroanal. Chem., 2017, 785, 26–32 CrossRef CAS.
- Fahaduddin and T. Bal, J. Mech. Behav. Biomed. Mater., 2024, 150, 106330 CrossRef CAS PubMed.
- S. Thambidurai, P. Gowthaman, M. Venkatachalam and S. Suresh, Optik, 2020, 207, 163865 CrossRef CAS.
- I. A. Ahmad and Y. H. Mohammed, Micro Nanostruct., 2023, 181, 207628 CrossRef CAS.
- S. B. Somvanshi, M. V. Khedkar, P. B. Kharat and K. M. Jadhav, Ceram. Int., 2020, 46, 8640–8650 CrossRef CAS.
- Z. Aalami, M. Hoseinzadeh, P. Hosseini Manesh, A. H. Aalami, Z. Es'haghi, M. Darroudi, A. Sahebkar and H. A. Hosseini, Heliyon, 2024, 10, e24212 CrossRef CAS PubMed.
- S. Cui, Y. Wu, Z. Cui, P. He, N. Huang, W. Xu and J. Hu, Mater. Lett., 2023, 341, 134158 CrossRef CAS.
- S. Baskoutas, P. Giabouranis, S. N. Yannopoulos, V. Dracopoulos, L. Toth, A. Chrissanthopoulos and N. Bouropoulos, Thin Solid Films, 2007, 515, 8461–8464 CrossRef CAS.
- J. Gaur, S. Kumar, M. Pal, H. Kaur, K. M. Batoo, J. O. Momoh and Supreet, Hybrid Adv., 2024, 5, 100128 CrossRef.
- R. Perez-Cuapio, J. Alberto Alvarado, H. Juarez and H.-J. Sue, Mater. Sci. Eng., B, 2023, 289, 116263 CrossRef CAS.
- C. M. Montemayor Palos, A. E. Mariño-Gámez, G.-E. Acosta-González, M. B. Hernández, S. García-Villarreal, L. Falcon Franco, L. García-Ortiz and J. A. Aguilar-Martínez, Phys. B, 2023, 656, 414776 CrossRef CAS.
- G. Kalaiyan, S. Suresh, K. M. Prabu, S. Thambidurai, M. Kandasamy, N. Pugazhenthiran, S. K. Kumar and T. Muneeswaran, J. Environ. Chem. Eng., 2021, 9, 104847 CrossRef CAS.
- S. Venkatesan, S. Suresh, J. Arumugam, P. Ramu, N. Pugazhenthiran, R. Jothilakshmi and K. M. Prabu, Results Chem., 2024, 7, 101315 CrossRef CAS.
- O. J. Nava, C. A. Soto-Robles, C. M. Gómez-Gutiérrez, A. R. Vilchis-Nestor, A. Castro-Beltrán, A. Olivas and P. A. Luque, J. Mol. Struct., 2017, 1147, 1–6 CrossRef CAS.
- A. Kavitha, A. Doss, R. P. Praveen Pole, T. P. K. Pushpa Rani, R. Prasad and S. Satheesh, Biocatal. Agric. Biotechnol., 2023, 48, 102654 CrossRef CAS.
- S. Waseem, T. Sittar, Z. N. Kayani, S. S. A. Gillani, M. Rafique, M. Asif Nawaz, S. Masood Shaheen and M. A. Assiri, Phys. B, 2023, 663, 415005 CrossRef CAS.
- M. Rafique, M. Sohaib, R. Tahir, M. B. Tahir, N. R. Khalid, M. Shakil, S. S. A. Gillani, M. I. Khan, H. Alrobei, K. Shahzad, A. M. Ali and S. Muhammad, Optik, 2021, 243, 167495 CrossRef CAS.
- M. Sundrarajan, S. Ambika and K. Bharathi, Adv. Powder Technol., 2015, 26, 1294–1299 CrossRef CAS.
- S. Venkatesan, S. Suresh, P. Ramu, M. Kandasamy, J. Arumugam, S. Thambidurai, K. M. Prabu and N. Pugazhenthiran, J. Indian Chem. Soc., 2022, 99, 100436 CrossRef CAS.
- M. D. Jayappa, C. K. Ramaiah, M. A. P. Kumar, D. Suresh, A. Prabhu, R. P. Devasya and S. Sheikh, Appl. Nanosci., 2020, 10, 3057–3074 CrossRef CAS PubMed.
- L. Feng, Y.-Y. Zhai, J. Xu, W.-F. Yao, Y.-D. Cao, F.-F. Cheng, B.-H. Bao and L. Zhang, J. Ethnopharmacol., 2019, 245, 112109 CrossRef CAS PubMed.
- I.-M. Chung, G. Rajakumar, J.-H. Lee, S.-H. Kim and M. Thiruvengadam, Appl. Microbiol. Biotechnol., 2017, 101, 5247–5257 CrossRef CAS PubMed.
- Jyoti, S. P. S. Saini, H. Singh, S. S. Rath and N. K. Singh, Exp. Parasitol., 2022, 241, 108356 CrossRef CAS PubMed.
- B. R. Tiwari, M. Naseeruddin Inamdar, R. Orfali, A. Alshehri, A. Alghamdi, M. E. Almadani, S. Alshehri, S. Imam Rabbani and S. Mohammed Basheeruddin Asdaq, Saudi Pharm. J., 2023, 31, 101705 CrossRef CAS PubMed.
- S. Kumar, J. Kamboj, Suman and S. Sharma, J. Acupunct. Meridian Stud., 2011, 4, 134–140 CrossRef PubMed.
- N. Viet Phong, D. Thi Nguyet Anh, H. Yeong Chae, S. Young Yang, M. Jeong Kwon, B. Sun Min and J. Ah Kim, Bioorg. Chem., 2022, 128, 106072 CrossRef CAS PubMed.
- D. Li, R. Wang, X. Cheng, J. Yang, Y. Yang, H. Qu, S. Li, S. Lin, D. Wei, Y. Bai and X. Zheng, Nat. Prod. Res., 2022, 36, 674–679 CrossRef CAS PubMed.
- P. A. Shenoy, S. S. Nipate, J. M. Sonpetkar, N. C. Salvi, A. B. Waghmare and P. D. Chaudhari, J. Ethnopharmacol., 2013, 147, 373–382 CrossRef CAS PubMed.
- T. T. T. Nguyen, Y. N. N. Nguyen, X. T. Tran, T. T. T. Nguyen and T. Van Tran, J. Environ. Chem. Eng., 2023, 11, 111003 CrossRef CAS.
- C. A. Soto-Robles, O. Nava, L. Cornejo, E. Lugo-Medina, A. R. Vilchis-Nestor, A. Castro-Beltrán and P. A. Luque, J. Mol. Struct., 2021, 1225, 129101 CrossRef CAS.
- C. M. Rafeeq, E. Paul, E. Vidya Saagar and P. P. Manzur Ali, Ceram. Int., 2021, 47, 12375–12380 CrossRef CAS.
- K. A. Sultana, M. T. Islam, J. A. Silva, R. S. Turley, J. A. Hernandez-Viezcas, J. L. Gardea-Torresdey and J. C. Noveron, J. Mol. Liq., 2020, 307, 112931 CrossRef CAS.
- S. S. Alias, A. B. Ismail and A. A. Mohamad, J. Alloys Compd., 2010, 499, 231–237 CrossRef CAS.
- H. M. H. Al-Kordy, S. A. Sabry and M. E. M. Mabrouk, Sci. Rep., 2021, 11, 10924 CrossRef CAS PubMed.
- A. G. Kaningini, S. Azizi, N. Sintwa, K. Mokalane, K. C. Mohale, F. N. Mudau and M. Maaza, ACS Omega, 2022, 7, 31658–31666 CrossRef CAS PubMed.
- P. Maheswari, S. Harish, M. Navaneethan, C. Muthamizhchelvan, S. Ponnusamy and Y. Hayakawa, Mater. Sci. Eng., C, 2020, 108, 110457 CrossRef CAS PubMed.
- H. Agarwal, A. Nakara, S. Menon and V. Shanmugam, J. Drug Delivery Sci. Technol., 2019, 53, 101212 CrossRef CAS.
- J. R. Nakkala, R. Mata and S. R. Sadras, Process Saf. Environ. Prot., 2016, 100, 288–294 CrossRef CAS.
- E. M. Ezz elregal, M. A. Ahmed, M. F. Abdel-Messih and Z. M. Abou-Gamra, Opt. Mater., 2021, 111, 110597 CrossRef CAS.
- L. Fu and Z. Fu, Ceram. Int., 2015, 41, 2492–2496 CrossRef CAS.
- M. Aliannezhadi, S. Z. Mirsanaee, M. Jamali and F. Shariatmadar Tehrani, Sci. Rep., 2024, 14, 2035 CrossRef CAS PubMed.
- I. Musa, N. Qamhieh and S. T. Mahmoud, Results Phys., 2017, 7, 3552–3556 CrossRef.
- K. L. Foo, U. Hashim, K. Muhammad and C. H. Voon, Nanoscale Res. Lett., 2014, 9, 429 CrossRef PubMed.
- M. S. Geetha, H. Nagabhushana and H. N. Shivananjaiah, J. Sci.: Adv. Mater. Devices, 2016, 1, 301–310 Search PubMed.
- Z. Abbas, C. Labbez, S. Nordholm and E. Ahlberg, J. Phys. Chem. C, 2008, 112, 5715–5723 CrossRef CAS.
- H. Agarwal and V. K. Shanmugam, J. Drug Delivery Sci. Technol., 2019, 54, 101291 CrossRef CAS.
- M. A. Albo Hay Allah and H. A. Alshamsi, Biomass Convers. Biorefin., 2024, 14, 10487–10500 CrossRef CAS.
- J.-A. Quek, J.-C. Sin, S.-M. Lam, A. R. Mohamed and H. Zeng, J. Mater. Sci.: Mater. Electron., 2020, 31, 1144–1158 CrossRef CAS.
- D. Suresh, P. C. Nethravathi, H. Rajanaika, H. Nagabhushana and S. C. Sharma, Mater. Sci. Semicond. Process., 2015, 31, 446–454 CrossRef CAS.
- N. Elavarasan, K. Kokila, G. Inbasekar and V. Sujatha, Res. Chem. Intermed., 2017, 43, 3361–3376 CrossRef CAS.
- Y. Gao, D. Xu, D. Ren, K. Zeng and X. Wu, LWT, 2020, 126, 109297 CrossRef CAS.
- S. Vasantharaj, S. Sathiyavimal, P. Senthilkumar, V. N. Kalpana, G. Rajalakshmi, M. Alsehli, A. Elfasakhany and A. Pugazhendhi, J. Environ. Chem. Eng., 2021, 9, 105772 CrossRef CAS.
- A. R. Prasad, J. Garvasis, S. K. Oruvil and A. Joseph, J. Phys. Chem. Solids, 2019, 127, 265–274 CrossRef CAS.
- S. Faisal, H. Jan, S. A. Shah, S. Shah, A. Khan, M. T. Akbar, M. Rizwan, F. Jan, Wajidullah, N. Akhtar, A. Khattak and S. Syed, ACS Omega, 2021, 6, 9709–9722 CrossRef CAS PubMed.
- J. Singh, S. Kumar, A. Alok, S. K. Upadhyay, M. Rawat, D. C. W. Tsang, N. Bolan and K.-H. Kim, J. Cleaner Prod., 2019, 214, 1061–1070 CrossRef CAS.
- P. Rajiv, S. Rajeshwari and R. Venckatesh, Spectrochim. Acta, Part A, 2013, 112, 384–387 CrossRef CAS PubMed.
- V. Seerangaraj, S. Sathiyavimal, S. N. Shankar, J. G. T. Nandagopal, P. Balashanmugam, F. A. Al-Misned, M. Shanmugavel, P. Senthilkumar and A. Pugazhendhi, J. Environ. Chem. Eng., 2021, 9, 105088 CrossRef CAS.
- Z. Ali, M. Aadil, B. Zainab, M. H. Rasool, W. Hassan, S. Mubarik, Z. Ahmad, N. A. Almuhous, A. A. Alothman and M. Hussain, Inorg. Chem. Commun., 2023, 157, 111399 CrossRef CAS.
- Abdullah, T. Hussain, S. Faisal, M. Rizwan, Saira, N. Zaman, M. Iqbal, A. Iqbal and Z. Ali, J. Saudi Chem. Soc., 2022, 26, 101486 CrossRef CAS.
- S. Sathiyavimal, S. Vasantharaj, D. Bharathi, M. Saravanan, E. Manikandan, S. S. Kumar and A. Pugazhendhi, J. Photochem. Photobiol., B, 2018, 188, 126–134 CrossRef CAS PubMed.
- J. Puneetha, N. Kottam and A. Rathna, Inorg. Chem. Commun., 2021, 125, 108460 CrossRef.
- S. Sasi, P. H. Fathima Fasna, T. K. Bindu Sharmila, C. S. Julie Chandra, J. V. Antony, V. Raman, A. B. Nair and H. N. Ramanathan, J. Alloys Compd., 2022, 924, 166431 CrossRef CAS.
- P. Kumar, M. R. Ramesh, M. Doddamani, J. Suresh and R. Lingaraj, Mater. Lett., 2024, 359, 135918 CrossRef CAS.
- S. Shabbir Awan, R. Taj Khan, A. Mehmood, M. Hafeez, S. Rizwan Abass, M. Nazir and M. Raffi, Saudi J. Biol. Sci., 2023, 30, 103487 CrossRef CAS PubMed.
- S. Dhiman, A. Kumari, A. Sharma, A. Kandwal and R. Sharma, Inorg. Chem. Commun., 2024, 161, 112088 CrossRef CAS.
- B. Şahin, R. Aydin, S. Soylu, M. Türkmen, M. Kara, A. Akkaya, H. Çetin and E. Ayyıldız, Inorg. Chem. Commun., 2022, 135, 109088 CrossRef.
- S. Samar, A. Kumar and P. Kumar, Mater. Sci. Eng., B, 2024, 299, 117005 CrossRef CAS.
- S. Paisoonsin, O. Pornsunthorntawee and R. Rujiravanit, Appl. Surf. Sci., 2013, 273, 824–835 CrossRef CAS.
- P. Kanmani and J.-W. Rhim, Carbohydr. Polym., 2014, 106, 190–199 CrossRef CAS PubMed.
- K. Rambabu, G. Bharath, F. Banat and P. L. Show, J. Hazard. Mater., 2021, 402, 123560 CrossRef CAS PubMed.
- S. Z. Razavi, E. Saljoughi, S. M. Mousavi and M. M. Matin, Int. J. Biol. Macromol., 2024, 256, 128090 CrossRef CAS PubMed.
- H. Mohd Yusof, N. Abdul Rahman, R. Mohamad, U. H. Zaidan and A. A. Samsudin, OpenNano, 2022, 8, 100106 CrossRef.
|
| This journal is © The Royal Society of Chemistry 2024 |
Click here to see how this site uses Cookies. View our privacy policy here.  Open Access Article
 *b and
Thuy Thi Thanh
Nguyen
*a

![[double bond, length as m-dash]](https://www.rsc.org/images/entities/char_e001.gif) C stretching of aromatic compounds such as flavonoids, at 1394 cm−1 for C–H bonds in aldehydes, at 1054 cm−1 for C–O ether stretch, and at 879 cm−1 for N–H amine stretch. These results are in good agreement with those reported by Maheswari et al.42 The FTIR spectrum (Fig. 5b) of ZnO_EPE nanoparticles exhibited a characteristic band at around 460–490 cm−1 corresponding to the stretching vibrations of Zn–O.43 A broad peak at 3515 cm−1 could be attributed to the –OH group and surface water of ZnO_EPE nanoparticles. Meanwhile, the spectra of the PLE extract and ZnO_PLE nanoparticles are shown in Fig. 5c and d. The peaks of PLE were observed at 3305 cm−1 (–OH stretching vibration), 2927 cm−1 (–CH stretching of aromatic compound), 1636 cm−1 (C
C stretching of aromatic compounds such as flavonoids, at 1394 cm−1 for C–H bonds in aldehydes, at 1054 cm−1 for C–O ether stretch, and at 879 cm−1 for N–H amine stretch. These results are in good agreement with those reported by Maheswari et al.42 The FTIR spectrum (Fig. 5b) of ZnO_EPE nanoparticles exhibited a characteristic band at around 460–490 cm−1 corresponding to the stretching vibrations of Zn–O.43 A broad peak at 3515 cm−1 could be attributed to the –OH group and surface water of ZnO_EPE nanoparticles. Meanwhile, the spectra of the PLE extract and ZnO_PLE nanoparticles are shown in Fig. 5c and d. The peaks of PLE were observed at 3305 cm−1 (–OH stretching vibration), 2927 cm−1 (–CH stretching of aromatic compound), 1636 cm−1 (C![[double bond, length as m-dash]](https://www.rsc.org/images/entities/char_e001.gif) C), 1445 cm−1 (–OH bond of polyphenols), and 1038 cm−1 (C–O–C).44 Similar to the FTIR spectrum of ZnO_EPE, a characteristic peak at around 460–490 cm−1 is present, assigned to Zn–O bonds of ZnO_PLE nanoparticles.43
C), 1445 cm−1 (–OH bond of polyphenols), and 1038 cm−1 (C–O–C).44 Similar to the FTIR spectrum of ZnO_EPE, a characteristic peak at around 460–490 cm−1 is present, assigned to Zn–O bonds of ZnO_PLE nanoparticles.43


