 Open Access Article
A catalytic amplification platform based on Fe2O3 nanoparticles decorated graphene nanocomposites for highly sensitive detection of rutin†
Zhuzhen
Chen
a,
Tingting
Zhang
b,
Xue
Zhang
a,
Wangxing
Cheng
*a,
Linwei
Chen
 *a and
Nannan
Lu
 *a
*a
aCollege of Pharmacy, Anhui University of Chinese Medicine, Hefei 230013, PR China. E-mail: wxcheng@ahtcm.edu.cn; chenlw@ahtcm.edu.cn; lunn@ahtcm.edu.cn
bQingdao Cancer Institute, Qingdao University, Qingdao 266071, PR China
First published on 11th September 2024
Abstract
Exploration of nanocomposites with exceptional catalytic activities is essential for harnessing the unique advantages of each constituent in the domains of pharmaceutical analysis and electrochemical sensing. In this regard, we illustrated the synthesis of iron oxide/N-doped reduced graphene oxide (Fe2O3/N-rGO) nanocomposites through a one-step thermal treatment of iron phthalocyanine (FePc), melamine, and graphene oxide for electrochemical sensing. The large specific surface area and good conductivity of N-rGO can efficiently capture rutin molecules and accelerate electron transport, thereby improving the electrochemical performance. Moreover, the Fe2O3 nanoparticles with distinct electronic characteristics significantly enhanced the detection sensitivity of the constructed electrochemical platform. Because of the outstanding electrical conductivity, an extensive surface area, and synergistic catalysis, Fe2O3/N-rGO was employed as an advanced electrode modifier to build an electrochemical sensing platform for rutin detection. Significantly, the manufactured sensor showed a broad detection range from 7 nM to 150 μM and a high sensitivity of 5632 μA mM−1. Furthermore, the fabricated sensor showed desirable results in terms of stability, selectivity, and practical application. This work presents a facile method to prepare Fe2O3/N-rGO and supplies a valuable example for building metal oxide/graphene nanocomposites for electrochemical analysis.
1. Introduction
Rutin, commonly referred to as vitamin P, is extensively distributed in many foods, such as buckwheat, eggplants, grapes, and olives.1 As a type of flavonoid glycoside, rutin performs enormous biological and pharmacological functions, including hemostatic, anti-inflammatory, anti-fungal, and antiphlogistic.2 In addition, it can be utilized as a radical scavenger to eliminate multiple reactive oxygen species.3 Clinically, rutin has shown positive therapeutic effects on cerebral hemorrhage, diabetes, coronavirus illness, and hypertension.4 However, long-term or excessive intake of rutin (more than 4 g per day) can cause adverse effects such as allergies, vomiting, nausea, and eczema in some patients.5,6 Given the effects of rutin, it is significant to establish a reliable approach for ultrasensitively and precisely determining rutin in pharmaceutical analysis and clinical samples. Until now, sensing techniques including chromatography,7 fluorescence spectroscopy,8 electrochemiluminescence,9 and UV-Vis spectrophotometry10 have been adopted to analyze rutin. However, some of them involve several obstacles, such as a time-consuming and complex process, the use of additional hazardous reagents, and expensive instruments, which can restrict their real-time and practical application.11 Compared to the above-mentioned techniques, electrochemical approaches are characterized by the benefits of rapid response, high sensitivity, on-site observation, and low cost. They could be considered a promising alternative for rutin detection.12 Furthermore, it is worth noting that rutin is an electroactive substance and can be detected by electrochemical analysis.13 With regard to electrode selection, it is comparatively difficult to obtain higher detection performance for rutin on a bare glassy carbon electrode (GCE) due to its finite electron transfer kinetics, small electroactive area, and poor catalytic ability. To surmount these issues, several studies have focused on exploring suitable materials with outstanding physicochemical properties for electrochemical determination of rutin, including noble nanoparticles,14 metal–organic frameworks,15 carbon materials,16 and polymers.17Compared with single-component nanomaterials, nanocomposites, which integrate the distinct features of their constituent components, are expected to present exceptional electrochemical sensing performance for the analysis of various analytes stemming from their special architecture and synergistic catalysis.18–20 Transition metal oxides (such as Co3O4, Cu2O, and Fe2O3) have attracted more attention due to their fascinating catalytic features and have emerged as the most advantageous electrode materials in electrocatalytic domains.21,22 Changeable valence states and distinct electronic characteristics of transition metal oxides can facilitate the electron transfer process. Specifically, iron oxide (Fe2O3) has gained more attention for electrochemical sensing of analytes owing to its affordability, earth abundance, ease of production, environmental friendliness, and good biocompatibility.23 However, it is still problematic to achieve the nanoscale level of Fe2O3 owing to inevitable aggregation, constrained electrical conductivity and restricted specific surface area. The above obstructive effects could limit their electrochemical performance and cause electrode instability. In order to solve the above issues, conductive nanomaterials with large surface areas are suggested to support Fe2O3 to enhance the dispersibility and electrical conductivity.
Among various conductive matrix materials, two-dimensional (2D) carbon nanomaterials have drawn significant attention in the field of electrochemical analysis for diverse biomolecules because of their exceptional electrical conductivity, higher surface area, and acceptable surface-to-volume ratio.24 The unique sheet-like structure of 2D nanomaterials could access more active molecules to obtain higher sensitivity. Reduced graphene oxide (rGO), a typical 2D carbon nanomaterial, has been utilized in constructing different nanocomposites to realize the improvement of sensing performances.25,26 Additionally, the doping of N atoms in rGO sheets can further improve the catalytic activity and accelerate the electron transfer rate since it can efficiently regulate the charge distribution of the carbon architecture. The electronic interactions and synergistic effects between Fe2O3 nanoparticles (NPs) and N-doped reduced graphene oxide (N-rGO) would exhibit promoted electrocatalytic effects.27,28 Nonetheless, the proposed synthesis procedures mostly involve the use of pre-synthesized larger-sized Fe2O3 NPs, complex synthesis processes, or unavoidable aggregation of Fe2O3 NPs during the synthesis. Also, on the basis of the intrinsic overlap tendency of rGO, it is necessary to prevent stacking and ensure nitrogen doping during the fabrication of rGO-based nanomaterials. Therefore, it is particularly urgent to develop an efficacious and facile technique to prepare nanocomposites that could integrate the advantages of both Fe2O3 and N-rGO for electrochemical analysis.
From previous reports, FeCl3 was utilized as an iron source to synthesize Fe2O3 NP-anchored carbon materials.29 However, FeCl3 may cause a larger size of metal oxide nanoparticles, which could lead to unsatisfactory catalytic activity in the electrochemical process. Because of the existence of a phenyl group in the structure, iron phthalocyanine (FePc) has greater potential to be captured on the carbon surface than Fe3+,30 which could be beneficial for converting to smaller Fe2O3 NPs during pyrolysis. In this work, we illustrated the one-pot synthesis of Fe2O3/N-rGO by simply mixing FePc, melamine, and GO, subsequently undergoing pyrolysis in an N2 atmosphere, along with the electrochemical application for rutin determination. Among the precursors, melamine, an organic triazine molecule with a high content of nitrogen (66.7%), was easily decomposed to generate nitrogen-contained gases to realize N doping during the pyrolysis process. Simultaneously, the produced gases were beneficial for preventing the aggregation of GO. Furthermore, N-rGO was adopted as the matrix material to enhance the dispersion of Fe2O3 NPs for a better detection signal. Due to its boosted conductivity, increased active surface area, and synergistic catalytic effect of Fe2O3 and N-rGO components, Fe2O3/N-rGO could serve as a superior signal amplification platform for the redox reaction of rutin. The electrocatalytic activity was evidenced by the enhanced current response and low detection limit. Moreover, the designed sensor displayed good selectivity, stability, and practical application, indicating promising potential for biological, pharmacological, and clinical analysis applications.
2. Experimental section
2.1. Instruments and reagents
In this experiment, the instruments and reagents that we used have been displayed in ESI.†2.2. Synthesis of N-rGO
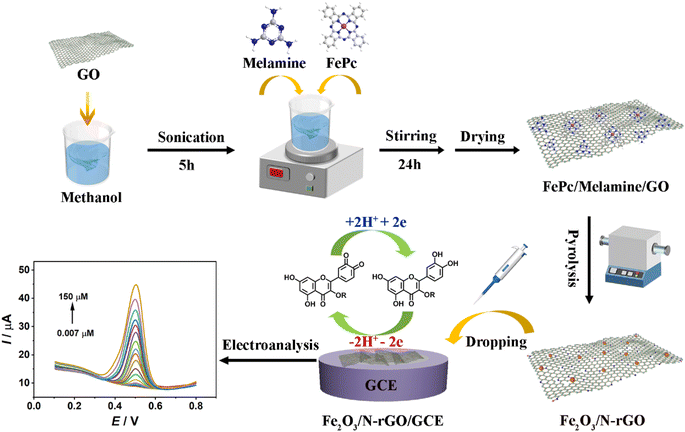
50 mg of GO was mixed with 30 mL of methanol under 5 h ultrasonic treatment. Then, 0.25 g of melamine were added into the above suspension with stirring for 24 h. The prepared mixture was washed with water and collected via centrifugation. Melamine/GO was placed in a vacuum oven at 70 °C overnight. The solid produced was calcined at 850 °C for 2 h in a tube furnace under a N2 atmosphere (ramping rate: 5 °C min−1). The resulting product was N-rGO.2.3. Synthesis of Fe2O3/N-rGO
Initially, the modified Hummer's approach using graphite powder as a precursor was chosen to synthesize GO.31 Next, GO, melamine, and FePc were selected as precursors to produce Fe2O3/N-rGO by thermal treatment. The synthesis process was shown as follows: 50 mg of GO was mixed with 30 mL of methanol under continuous sonication. After 5 h, 10 mg of FePc and 0.25 g of melamine were added to the GO suspension, and it was agitated for a further 24 h. Consequently, the fabricated mixture was washed with water via centrifugation. The product was stored in a vacuum oven at a temperature of 70 °C for 8 h. Subsequently, the collected powder was heated at 850 °C under a N2 atmosphere and remained for 2 h. The heating rate of the process was set at 5 °C min−1. The resulting sample was denoted as Fe2O3/N-rGO.2.4. Preparation process of Fe2O3/N-rGO/GCE
For the preparation of catalyst-modified electrodes, a cleaned GCE (3 mm in diameter) should be obtained as a priority. 0.3 and 0.05 μm alumina powders were used to polish the surface of the GCE to achieve mirror-like conditions. After that, the polished GCE was subjected to an ultrasonic treatment for 1 min in nitric acid/water (with a volume of 1![[thin space (1/6-em)]](https://www.rsc.org/images/entities/char_2009.gif) :
:![[thin space (1/6-em)]](https://www.rsc.org/images/entities/char_2009.gif) 1). It was then washed with absolute alcohol and doubly distilled water for 1 min, respectively. Before modification, 1 mg of Fe2O3/N-rGO was dispersed in 1 mL of 0.1% Nafion under continuous sonication for 15 min to prepare a homogeneous suspension. 10 μL of Fe2O3/N-rGO suspension was modified on a cleaned GCE surface. The dosage of the Fe2O3/N-rGO suspension was chosen at 10 μL due to the appropriate current response (Fig. S3†). The acquired modified GCE was Fe2O3/N-rGO/GCE. Scheme 1 provides information on the preparation and sensing processes. For comparison, N-rGO and GO-modified electrodes were prepared by the same procedure.
1). It was then washed with absolute alcohol and doubly distilled water for 1 min, respectively. Before modification, 1 mg of Fe2O3/N-rGO was dispersed in 1 mL of 0.1% Nafion under continuous sonication for 15 min to prepare a homogeneous suspension. 10 μL of Fe2O3/N-rGO suspension was modified on a cleaned GCE surface. The dosage of the Fe2O3/N-rGO suspension was chosen at 10 μL due to the appropriate current response (Fig. S3†). The acquired modified GCE was Fe2O3/N-rGO/GCE. Scheme 1 provides information on the preparation and sensing processes. For comparison, N-rGO and GO-modified electrodes were prepared by the same procedure.
3. Results and discussion
3.1. Characterization of composites
Initially, the morphology of the synthesized catalysts could be explored by scanning electron microscopy (SEM) and transmission electron microscopy (TEM). The SEM image in Fig. 1a exhibited the morphology characteristic features of GO with typical wrinkled sheets. After pyrolysis with melamine, N-rGO showed a more curved surface than GO (Fig. 1b). The results further indicated that melamine may effectively prevent the aggregation of GO sheets during pyrolysis. The TEM image in Fig. S1† also displays the wrinkled structure of N-rGO. As can be seen in Fig. 1c, Fe2O3/N-rGO retained the sheet architecture of N-rGO. It could be observed that Fe2O3 NPs were dispersed on the N-rGO surface without apparent aggregation. As shown in Fig. 1d, the diameter size of Fe2O3 NPs was between 20 and 40 nm. The high-resolution TEM (HRTEM) in Fig. 1e displayed evident lattice fringes with an adjacent distance of 0.296 nm, corresponding to the (220) planes of maghemite (γ-Fe2O3). Additionally, there were no obvious lattice fringes of carbon, confirming the amorphous character of Fe2O3/N-rGO. The energy-dispersive X-ray (EDX) results proved the existence of C, N, O, and Fe elements in Fe2O3/N-rGO (Fig. 1f). The weight percentage of different atoms is shown in Table S1.† EDS mapping images of Fe2O3/N-rGO in Fig. S2† implied the uniform dispersion of C, N, O, and Fe elements.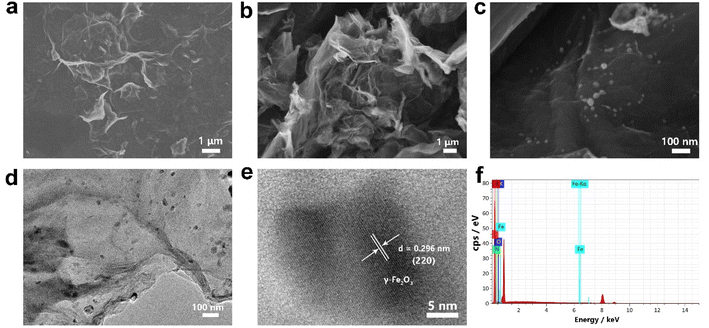 | ||
| Fig. 1 SEM images of (a) GO, (b) N-rGO, (c) Fe2O3/N-rGO, (d and e) TEM and HRTEM images of Fe2O3/N-rGO, and (f) EDX result of Fe2O3/N-rGO. | ||
The X-ray powder diffraction (XRD) technique was adopted to reveal the phase composition of the prepared samples. As shown in Fig. 2a, the XRD pattern of GO had a strong peak located at around 10.6°, which was attributed to the GO plane. As for N-rGO, the two distinctive signals at approximately 26° and 43.5° corresponded to the (002) and (100) reflections of amorphous carbon.32 The diffraction peak at 26.2° of Fe2O3/N-rGO was assigned to the (002) carbon plane. The series of peaks of Fe2O3/N-rGO at 30.2°, 35.5°, 43.2°, 57.2°, and 62.8° matched well with the (220), (311), (400), (511), and (440) diffraction planes of Fe2O3 (PDF Card No. 39-1346).33 The chemical compositions of catalysts were inspected by X-ray photoelectron spectroscopy (XPS) analysis. Fig. 2b displays the element signals of C 1s, N 1s, O 1s, and Fe 2p. The elemental composition obtained by XPS is shown in Table S2.† The high-resolution C 1s was fitted to three peaks with binding energies of 284.7, 285.8, and 287.3 eV (Fig. 2c), corresponding to C![[double bond, length as m-dash]](https://www.rsc.org/images/entities/char_e001.gif) C, C–N, and C–O, respectively.34 As shown in Fig. 2d, four peaks with positions of 398.5, 399.8, 400.9, and 402.3 eV can be identified as pyridinic N, pyrrolic N, graphitic N, and oxidized N, respectively.35 Pyridinic N and pyrrolic N configurations were dominant species in the N 1s spectrum, which could act as active sites for improved catalytic activity and contribute to the high conductivity.36,37 The O 1s spectrum manifested three components (Fig. 2e). The signal observed at 530.1 eV was attributed to the Fe–O bond, while two components centered at 531.4 and 533.2 eV corresponded to the structure of Fe–O–C and C–O, respectively.33,38 The presence of Fe–O–C signified a strong connection between Fe2O3 and the carbon support.39 The Fe 2p spectrum depicted doublet peaks at approximately 710.8 eV (Fe 2p3/2) and 724.8 eV (Fe 2p1/2) (Fig. 2f). Besides, it could be resolved into three components with the positions of 710.8, 712.4, and 724.8 eV, respectively, revealing the existence of Fe–OH, C–O–Fe, and Fe–O bonds. Additionally, two satellite peaks at 718.1 and 731.3 eV could be observed besides the two main peaks.40,41
C, C–N, and C–O, respectively.34 As shown in Fig. 2d, four peaks with positions of 398.5, 399.8, 400.9, and 402.3 eV can be identified as pyridinic N, pyrrolic N, graphitic N, and oxidized N, respectively.35 Pyridinic N and pyrrolic N configurations were dominant species in the N 1s spectrum, which could act as active sites for improved catalytic activity and contribute to the high conductivity.36,37 The O 1s spectrum manifested three components (Fig. 2e). The signal observed at 530.1 eV was attributed to the Fe–O bond, while two components centered at 531.4 and 533.2 eV corresponded to the structure of Fe–O–C and C–O, respectively.33,38 The presence of Fe–O–C signified a strong connection between Fe2O3 and the carbon support.39 The Fe 2p spectrum depicted doublet peaks at approximately 710.8 eV (Fe 2p3/2) and 724.8 eV (Fe 2p1/2) (Fig. 2f). Besides, it could be resolved into three components with the positions of 710.8, 712.4, and 724.8 eV, respectively, revealing the existence of Fe–OH, C–O–Fe, and Fe–O bonds. Additionally, two satellite peaks at 718.1 and 731.3 eV could be observed besides the two main peaks.40,41
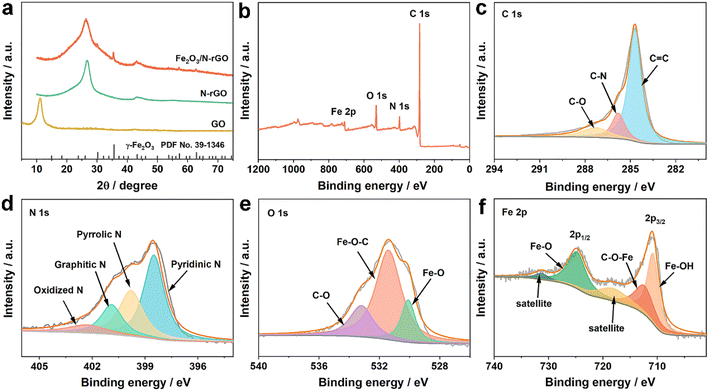 | ||
| Fig. 2 (a) XRD patterns of different materials, and (b) XPS spectrum and high-resolution (c) C 1s, (d) N 1s, (e) O 1s, and (f) Fe 2p spectra of Fe2O3/N-rGO. | ||
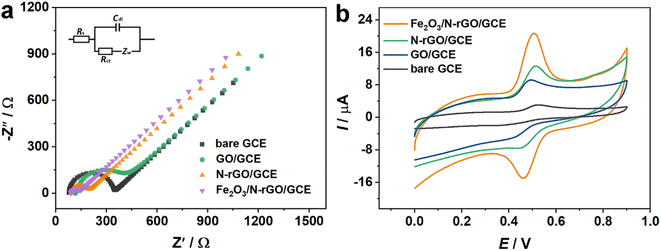
The charge transfer performance and interface characteristics of fabricated electrodes should be explored to further investigate the properties of electrochemical sensors. Electrochemical impedance spectroscopy (EIS) analysis was adopted to obtain the above features (Fig. 3a). The Nyquist plots included a semicircle and straight portions, in which the former was related to the electron transfer-limited course and the latter represented the diffusion-limited procedure.42 From the illustration in Fig. 3a, the symbol Rs signifies the resistance of the electrolytic medium, while Rct corresponds to the resistance associated with the charge transfer process. The parameter Cdl emulates the capacitance of the electric double layer and Zw denotes the Warburg impedance. Under ideal conditions, Zw reflects the comprehensive properties of the solution and Rs is the diffusion characteristics of the electrochemical probe. Thus, they remain unaffected by the incorporation of surface modifiers on the electrode. Additionally, Cdl and Rct are linked to the dielectric and insulating attributes at the electrode–electrolyte interface, which can be modulated through surface modifications on the electrode. Generally, the diameter of the semicircle part is equivalent to the value of the charge transfer resistance (Rct). The Rct of the bare GCE was assessed at 258.8 Ω. When GO was dropped on the electrode surface, the Rct value was 404.3 Ω, proving that GO had inferior electrical conductivity. Moreover, the semicircle diameter of N-rGO/GCE was obviously reduced, and the Rct value was 88.57 Ω. Surprisingly, Fe2O3/N-rGO/GCE presented a smaller diameter with an estimated Rct value of 33.23 Ω. The lower resistance of Fe2O3/N-rGO/GCE could be due to that N-rGO was favorable for the dispersion of Fe2O3 NPs, thus promoting the electron transfer behavior of Fe2O3/N-rGO.43 Furthermore, the heterogeneous electron transfer rate constants (Ket) of the prepared electrodes could be calculated from Rct values, and the calculation equation was shown as follows:44
3.2. Electrochemical analysis of rutin on Fe2O3/N-rGO/GCE
The detecting capabilities of the electrodes for rutin were revealed via the CV approach in 0.1 M PBS. As exhibited in Fig. 3b, redox peaks of rutin were displayed at different electrodes. A weak oxidation peak with a value of 1.70 μA was detected on the bare GCE. With regard to GO/GCE, the oxidation current increased to 4.78 μA. The oxidation peak further boosted to 7.23 μA at N-rGO/GCE. The result indicated that N-rGO had higher conductivity and N atoms in the carbon framework were beneficial for the electrochemical reaction of rutin. Interestingly, redox peaks with higher currents were observed in Fe2O3/N-rGO/GCE. The oxidation peak response was 14.54 μA. The following reasons can cause the improved electrochemical activity of Fe2O3/N-rGO/GCE. First, the large surface area of N-rGO can restrict the aggregation of Fe2O3 NPs and expand the specific surface area of the catalyst. Second, the excellent conductivity of Fe2O3/N-rGO could be considered a superior signal amplification platform for collecting and amplifying the electrochemical signal of rutin. Finally, the synergistic effect generated from Fe2O3 NPs and N-rGO offers enormous active sites for rutin. The results showed that Fe2O3/N-rGO could be utilized as a good modifier for the sensitive analysis of rutin.3.3. Effect of pH
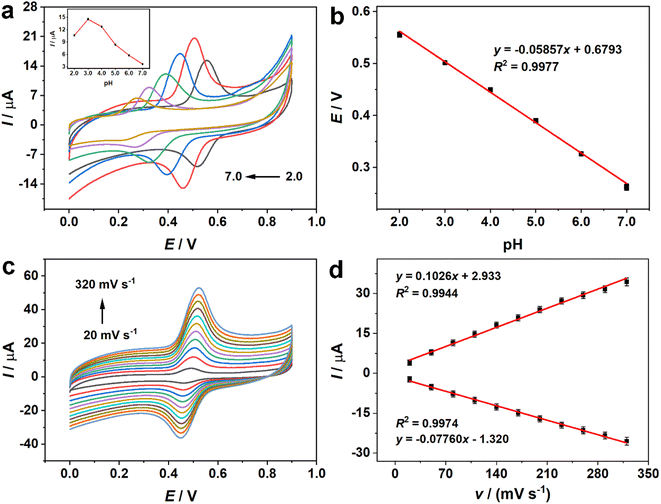
The pH of the solution was optimized in order to achieve the best response and high sensitivity. As depicted in Fig. 4a, the oxidation peak currents increased with the change of pH from 2.0 to 3.0. Afterwards, the currents progressively diminished when the pH varied from 3.0 to 7.0. The weak oxidation of rutin at pH 7.0 could be attributed to the fact that the relatively higher pH led to the loss of phenolic hydroxyl groups of rutin. As a result, rutin was harder to oxidize at higher pH values.45 Consequently, the following experiments were conducted at pH 3.0. The oxidation potential (E) had a linear trend with the variation of pH, and the related equation was depicted as E (V) = −0.05857 pH + 0.6793 (R2 = 0.9977) (Fig. 4b). The slope value of this equation approached the theoretical value (0.059 V per pH). Based on the Nernst formula,46where m and n represent the numbers of protons and electrons. The ratio between m and n was approximately 1, revealing that the number of protons involved in the oxidation procedure was the same as the number of electrons. From the previous literature, the redox process of rutin was related to two electrons and two protons.47,48 The electrochemical oxidation of rutin at the electrode interface implicated several consecutive and rapid steps (Scheme S1†).49 When rutin was electrochemically oxidized, it first lost one electron and one proton, resulting in the formation of four types of phenoxy radicals (a–d). Among them, the radical (b) was most stable on account of the electronic influence of the hydroxyl groups. Afterwards, the radical (b) underwent the other electron transfer process, potentially resulting in the carbocation (e). Eventually, carbocation (e) went through a rapid dehydrogenation process to generate the ultimate product 3′,4′-diquinone. The final product could be reduced to rutin in a reversible process.
3.4. Effect of scan rates
To illustrate the redox mechanism of rutin, the influence of scan rates on rutin was evaluated, and the consequences were depicted in Fig. 4c and d. The redox peak currents progressively increased with the scan rates from 20 to 320 mV s−1. The corresponding linear relationship could be described by the following equations: Ipa (μA) = 0.1026v (mV s−1) + 2.933 (R2 = 0.9944) and Ipc (μA) = −0.07760v (mV s−1) − 1.320 (R2 = 0.9974). Accordingly, both redox peak currents exhibited a linear relationship with the scan rates, manifesting that the electrochemical process of rutin at Fe2O3/N-rGO/GCE was a surface-controlled process.503.5. Optimization of accumulation time and potential
According to previous research, accumulation time and potential have an effect on the sensing process of rutin. To achieve the sensitive detection for rutin, both accumulation time and potential were investigated by the differential pulse voltammetry (DPV) technique. First, the influence of accumulation potential was assessed with a potential range of 0–0.8 V (Fig. S4†). From Fig. S4a,† as the accumulation potential was increased, the peak currents presented an increasing tendency and reached the maximum at 0.4 V. Accordingly, 0.4 V was selected as the optimal accumulation potential. The influence of accumulation time was examined and the result was exhibited in Fig. S4b.† The current responses varied rapidly with extending accumulation time and presented the best current response at 2 min. Thus, 2 min was picked as the ideal accumulation time.3.6. Electrochemical determination of rutin on Fe2O3/N-rGO/GCE
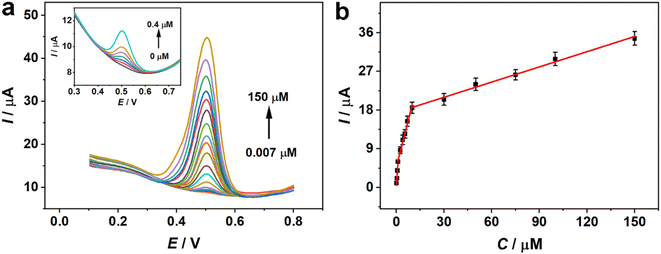
Under ideal conditions, the sensing ability of the constructed sensor for quantitative analysis of rutin was tested by the DPV technique. Fig. 5a depicts the DPV plots of various concentrations of rutin on Fe2O3/N-rGO/GCE. The oxidation peaks showed an increasing trend with the addition of different concentrations of rutin. The DPV responses of rutin had a linear proportion of the concentrations within the range of 0.007 to 150 μM, but the relationship varied depending on the concentration ranges (Fig. 5b). The linear equation was recorded as I (μA) = 5.632C (μM) + 0.1766 (R2 = 0.9916) with a concentration range from 0.007 to 1 μM. When the concentrations were from 1 to 10 μM and 10 to 150 μM, the associated linear relationships can be denoted as I (μA) = 1.456C (μM) + 4.667 (R2 = 0.9928) and I (μA) = 0.1178C (μM) + 17.45 (R2 = 0.9927), respectively. The two linear plots can be clearly seen in Fig. S5.† Simultaneously, the limit of detection (LOD) was 1.8 nM with a S/N value of 3. It was found that the slopes of calibration lines decreased with the increment of rutin. This phenomenon could be due to the fact that the oxidation currents increased quickly at relatively low concentrations and then tended to increase moderately at higher contents. This situation could be illustrated by the saturated adsorption of analytes on the modified electrode and the corresponding increase in the diffusion current response at higher levels of rutin.51,52Table 1 displays a list of electrochemical analyses of rutin with different materials. Fe2O3/N-rGO showed some merits in terms of the linear range and the detection limit. Therefore, Fe2O3/N-rGO was regarded as a promising modifier for the sensitive detection of rutin.| Catalyst | Detection method | Linear range (μM) | LOD (μM) | References |
|---|---|---|---|---|
| Zn/Co@N-CNSs-1 | Electrochemistry | 0.01–1.0 | 0.0027 | 2 |
| Cu–CS/MWCNT | Electrochemistry | 0.05–100 | 0.01 | 53 |
| MIPIL/IL-GR | Electrochemistry | 0.03–1 | 0.010 | 54 |
| N-MCS@graphene | Electrochemistry | 0.5–189 | 0.05 | 55 |
| Pt@r-GO@MWCNTs | Electrochemistry | 0.05–50 | 0.005 | 56 |
| Ce-PEDOT | Electrochemistry | 0.02–9.0 | 0.0147 | 17 |
| GR/AuNPs/AN | Electrochemistry | 0.08–200 | 0.025 | 57 |
| Fe2O3/GAC | Electrochemistry | 0.1–130 | 0.027 | 43 |
| Cu-Guo NRs | Colorimetry | 0.77–54.46 | 0.114 | 58 |
| Cuf-Lys | Colorimetry | 0.25–150 | 0.16 | 59 |
| CDs-E | Fluorimetry | 0.05–30 | 0.015 | 60 |
| BPGQDs@NaV | Fluorimetry | 0.005–0.11 | 0.01516 | 61 |
| OACuH | Fluorimetry | 0.1–200 | 0.05 | 62 |
| β-CD-VS2 QDs | Fluorimetry | 0.058–45.0 | 0.018 | 5 |
| SiNPs | Fluorimetry | 0.33–33.30 | 0.04 | 63 |
| Fe2O3/N-rGO | Electrochemistry | 0.007–150 | 0.0018 | This work |
3.7. Reproducibility, repeatability, stability and selectivity
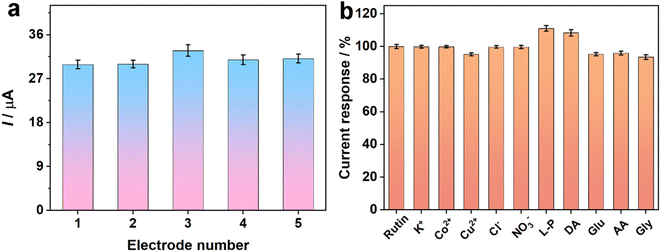
Reproducibility is a significant aspect of assessing the performance of the prepared sensor. Hence, the DPV response of the five constructed electrodes was recorded to inspect the reproducibility (Fig. 6a). The relative standard deviation (RSD) of the oxidation peak responses of the five independent electrodes was calculated to be 3.73%, displaying the superb reproducibility of Fe2O3/N-rGO-modified electrodes. Moreover, the repeatability of the proposed sensor was explored by utilizing the same electrode in six consecutive tests (Fig. S6a†). The RSD result of 100 μM rutin was 4.29%, which showed that the prepared electrochemical sensor had remarkable repeatability.Stability is another crucial aspect for evaluating the properties of a sensor. To inspect the stability of Fe2O3/N-rGO/GCE, the prepared electrode was placed at 4 °C for seven days (Fig. S6b†). The oxidation peak current still maintained 94.1% of its original current after seven days, manifesting that the proposed electrode displayed sufficient stability for rutin detection.
The anti-interference capability of the sensor was explored in the presence of 10 μM rutin and interfering species. Some possible interferents, including 100-fold K+, Co2+, Cu2+, Cl−, and NO3− and 10-fold L-proline (L-P), dopamine (DA), glucose (Glu), ascorbic acid (AA), and glycine (Gly) were used as interferents. The change in oxidation peak currents was studied using DPV techniques. Fig. 6b shows that the interferents had a negligible signal compared with 10 μM rutin. The obtained conclusions signified that Fe2O3/N-rGO/GCE possessed good selectivity in rutin analysis.
3.8. Application in real samples
The practicability of the established sensor was estimated by measuring the amount of rutin in commercial rutin tablets. Rutin solution was created by grinding five pieces of tablets with a mortar and then dissolving them in absolute alcohol. Then, the rutin solution was diluted with 0.1 M PBS solution for real sample determination. Different concentrations of standard rutin solutions were added and Table S3† presents the detected results. The recoveries range from 93.3% to 106.5%. The RSD value was below 4%. Consequently, the aforementioned findings implied that the developed electrochemical sensor proved to be suitable for monitoring rutin in practical samples with satisfactory accuracy. At the same time, the standard method (spectrum method) was utilized to verify the accuracy of the sensor and the result validated that the proposed sensor can determine rutin with acceptable accuracy.4. Conclusions
In summary, we described a facile one-step pyrolysis method to obtain Fe2O3/N-rGO using FePc, melamine, and GO as precursors. Notably, melamine not only served as a nitrogen source to achieve N doping but also efficiently prevented the aggregation of GO sheets. The synergistic effect, created by the exceptional catalytic ability of Fe2O3 NPs and the superior conductivity of N-rGO, allowed the resulting nanocomposite to be exploited as an outstanding electrocatalyst for the sensitive detection of rutin. According to our research, the sensor based on Fe2O3/N-rGO exhibited the features of high sensitivity, a broad linear range, a low detection limit, and satisfactory stability for electrochemical analysis of rutin. Moreover, the sensor was employed in detecting rutin in pharmaceutical samples with considerable results. This work presents a facile method for the fabrication of nanocomposites for the electroanalysis of rutin and supplies the potential application of metal oxide-based nanocomposites in the fields of pharmaceutical analysis and electrochemical sensing.Data availability
The original contributions presented in the study are included in the article; further inquiries can be directed to the corresponding author.Author contributions
Zhuzhen Chen: methodology, investigation, visualization, writing – original draft. Tingting Zhang: formal analysis, data curation, funding acquisition. Xue Zhang: validation, investigation. Wangxing Cheng: supervision, formal analysis. Linwei Chen: methodology, supervision, writing – review & editing. Nannan Lu: resources, conceptualization, project administration, writing – review & editing, funding acquisition.Conflicts of interest
The authors declare that they have no known competing financial interests or personal relationships that could have appeared to influence the work reported in this paper.Acknowledgements
This work was supported by the National Natural Science Foundation of China (No. 22104068), University Natural Science Research Project of Anhui Province (No. 2023AH050777), and Innovative Talents Support Program of Anhui University of Chinese Medicine (No. 2022rczd008).References
- S. L. Yang, G. Li, J. Feng, P. Y. Wang and L. B. Qu, Electrochim. Acta, 2022, 412, 140157 CrossRef CAS.
- L. Zhang, J. J. Li, R. X. Zhou, S. Q. Hu, C. X. Wang, Y. L. Wang, P. C. Zhao, Y. X. Xie and J. J. Fei, Electrochim. Acta, 2023, 470, 143304 CrossRef CAS.
- A. Şenocak, A. Khataee, E. Demirbas and E. Doustkhah, Sens. Actuators, B, 2020, 312, 127939 CrossRef.
- Y. Q. Yang, J. J. Li, Z. W. Luo, X. N. Li, J. Y. Zou, C. Y. Li, C. Chen, Y. X. Xie, P. C. Zhao and J. J. Fei, Sens. Actuators, B, 2023, 394, 134366 CrossRef CAS.
- A. M. Mahmoud, M. H. Mahnashi, F. M. Alshareef and M. M. El-Wekil, Microchem. J., 2023, 187, 108430 CrossRef CAS.
- Y. Shi, K. Hu, L. Mei, L. Chao, M. Wu, Z. Chen, X. Wu, J. Qiao, P. Zhu, M. Miao and S. Zhang, Talanta, 2024, 270, 125548 CrossRef CAS PubMed.
- X. W. Xu, L. Y. Huang, Y. J. Wu, L. J. Yang and L. Y. Huang, J. Chromatogr. B, 2021, 1168, 122589 CrossRef CAS.
- X. Q. Xie, M. F. Pan, L. P. Hong, K. X. Liu, J. Y. Yang, S. Wang, Y. Song and S. Wang, Sens. Actuators, B, 2022, 368, 132196 CrossRef CAS.
- Y. M. Nie, X. L. Tao, H. W. Zhang, Y. Q. Chai and R. Yuan, Anal. Chem., 2021, 93, 3445–3451 CrossRef CAS PubMed.
- A. Q. Gong, W. H. Ping, J. Wang and X. S. Zhu, Spectrochim. Acta, Part A, 2014, 122, 331–336 CrossRef CAS.
- X. R. Zhao, T. T. Cui, R. Guo, Y. Liu, X. Wang, Y. X. An, X. C. Qiao and B. H. Zheng, Anal. Chim. Acta, 2019, 1047, 71–80 CrossRef CAS.
- M. Y. Li, X. Niu, W. Y. Pei, H. L. Xu and J. F. Ma, Chem. Eng. J., 2023, 470, 144060 CrossRef CAS.
- N. Yalikun, X. Mamat, Y. Li, X. Hu, P. Wang and G. Hu, Microchim. Acta, 2019, 186, 379 CrossRef PubMed.
- H. P. Zhang, S. Huang, X. Gao, H. Bai, H. Su, S. Yang and H. Y. Yue, Sens. Actuators, B, 2023, 382, 133536 CrossRef CAS.
- P. Arul, S. T. Huang, N. S. K. Gowthaman, M. Govindasamy and N. Jeromiyas, Microchim. Acta, 2020, 187, 650 CrossRef CAS PubMed.
- F. Y. Kong, R. F. Li, S. F. Zhang, Z. X. Wang, H. Y. Li, H. L. Fang and W. Wang, Microchem. J., 2021, 160, 105684 CrossRef CAS.
- Y. L. Wang, J. Chen, C. X. Wang, L. Zhang, Y. Q. Yang, C. Chen, Y. X. Xie, P. C. Zhao and J. J. Fei, Talanta, 2023, 263, 124678 CrossRef CAS.
- H. Gu, X. Shui, Y. Zhang, T. Zeng, J. Yang, Z. Wu, X. Zhang and N. Yang, Carbon, 2024, 221, 118954 CrossRef CAS.
- Y. Yang, P. Wang, Z. Luo, J. Li, Y. Wang, Z. Li, C. Chen, Y. Xie, P. Zhao and J. Fei, Chem. Eng. J., 2023, 468, 143815 CrossRef CAS.
- J. Chen, M. Fei, M. Ni, Y. Wang, Z. Liu, Y. Xie, P. Zhao, Z. Zhang and J. Fei, Small, 2024, 20, 2310217 CrossRef CAS PubMed.
- L. Yuan, D. W. Boukhvalov, C. Lv, J. Dong, T. He, Z. Yu, W. Luo, C. Cheng, M. G. Humphrey, C. Zhang and Z. Huang, J. Mater. Chem. A, 2022, 10, 13769–13779 RSC.
- W. Niu, T. Moehl, P. Adams, X. Zhang, R. Lefèvre, A. M. Cruz, P. Zeng, K. Kunze, W. Yang and S. D. Tilley, Environ. Sci. Technol., 2022, 15, 2002–2010 CAS.
- R. Shanmugam, J. Ganesamurthi, T. W. Chen, S. M. Chen, M. Balamurugan, M. A. Ali, A. M. Al-Mohaimeed, W. A. Al-onazi and K. Alagumalai, Mater. Today Chem., 2022, 25, 100982 CrossRef CAS.
- N. N. Lu, Y. Liu, X. Y. Yan, Z. Q. Xu, Y. Xing, Y. Song, P. Y. Zhao, M. H. Liu, Y. Gu, Z. Q. Zhang and S. Y. Zhai, ACS Appl. Nano Mater., 2022, 5, 11361–11370 CrossRef CAS.
- A. Chen, Y. Wei, D. Tuo, C. Zhou, S. Shi, N. Tang, Q. He and J. Liu, J. Alloys Compd., 2024, 970, 172557 CrossRef CAS.
- B. Wu, L. Xiao, M. Zhang, C. Yang, Q. Li, G. Li, Q. He and J. Liu, J. Solid State Chem., 2021, 296, 122023 CrossRef CAS.
- A. G. Ramu, S. Salla, S. Gopi, P. Silambarasan, D. J. Yang, M. J. Song, H. M. Ali, M. Z. M. Salem and D. Choi, Chemosphere, 2021, 268, 128853 CrossRef CAS.
- S. Meng, D.-L. Zhao, L.-L. Wu, Z.-W. Ding, X.-W. Cheng and T. Hu, J. Alloys Compd., 2018, 737, 130–135 CrossRef CAS.
- S. Wang, Q. Jiao, X. Liu, Y. Xu, Q. Shi, S. Yue, Y. Zhao, H. Liu, C. Feng and D. Shi, ACS Sustainable Chem. Eng., 2019, 7, 7004–7013 CrossRef CAS.
- N. Du, Y. Liu, Q. Li, W. Miao, D. Wang and S. Mao, Chem. Eng. J., 2021, 413, 127545 CrossRef CAS.
- D. Li, M. B. Müller, S. Gilje, R. B. Kaner and G. G. Wallace, Nat. Nanotechnol., 2008, 3, 101–105 CrossRef CAS PubMed.
- N. N. Lu, T. T. Zhang, X. Y. Yan, Y. Gu, H. Liu, Z. Q. Xu, H. X. Xu, X. W. Li, Z. Q. Zhang and M. Yang, Nanoscale, 2018, 10, 14923–14930 RSC.
- M. Hong, Y. Su, C. Zhou, L. Yao, J. Hu, Z. Yang, L. Zhang, Z. Zhou, N. Hu and Y. Zhang, J. Alloys Compd., 2019, 770, 116–124 CrossRef CAS.
- Y. Q. Wang, K. Liu, J. Li, X. T. Yang, J. H. Hu, T. S. Chan, X. Q. Qiu, W. Z. Li and M. Liu, Chem. Eng. J., 2022, 429, 132119 CrossRef CAS.
- F. Pan, A. Liang, Y. Duan, Q. Liu, J. Zhang and Y. Li, J. Mater. Chem. A, 2017, 5, 13104–13111 RSC.
- Y. Li, Y. Kong, Y. Hou, B. Yang, Z. Li, L. Lei and Z. Wen, ACS Sustainable Chem. Eng., 2019, 7, 8853–8859 CrossRef CAS.
- J. Lv, Z. Liu and Z. Dong, Mol. Catal., 2020, 498, 111249 CrossRef CAS.
- M. Sun, G. Zhang, H. Liu, Y. Liu and J. Li, Sci. China Mater., 2015, 58, 683–692 CrossRef CAS.
- C. Zhang, Z. Chen, H. Wang, Y. Nie and J. Yan, ACS Appl. Nano Mater., 2021, 4, 8744–8752 CrossRef CAS.
- Z. M. Zheng, Y. Zao, Q. B. Zhang, Y. Cheng, H. X. Chen, K. L. Zhang, M. S. Wang and D. L. Peng, Chem. Eng. J., 2018, 347, 563–573 CrossRef CAS.
- W. Hou, Q. W. Liao, M. Z. Wu, K. X. Liao, Y. J. Song and L. Qin, J. Alloys Compd., 2023, 937, 168283 CrossRef CAS.
- N. N. Lu, X. Y. Yan, Y. Gu, T. T. Zhang, Y. Liu, Y. Song, Z. Q. Xu, Y. Xing, X. W. Li, Z. Q. Zhang and S. Y. Zhai, Electrochim. Acta, 2021, 395, 139197 CrossRef CAS.
- M. Elancheziyan, S. Ganesan, K. Theyagarajan, M. Duraisamy, K. Thenmozhi, C.-H. Weng, Y.-T. Lin and V. K. Ponnusamy, Environ. Res., 2022, 211, 113012 CrossRef CAS.
- P. Arul, N. S. K. Gowthaman, S. A. John and M. Tominaga, Electrochim. Acta, 2020, 354, 136673 CrossRef CAS.
- S. Yang, G. Wang, G. Li, J. Du and L. Qu, Electrochim. Acta, 2014, 144, 268–274 CrossRef CAS.
- M. J. Ni, J. Chen, C. X. Wang, Y. L. Wang, L. Z. Huang, W. C. Xiong, P. C. Zhao, Y. X. Xie and J. J. Fei, Microchem. J., 2022, 178, 107410 CrossRef CAS.
- Ş. U. Karabiberoğlu and Z. Dursun, J. Electroanal. Chem., 2018, 815, 76–85 CrossRef.
- S. Cui, L. Li, Y. Ding, J. Zhang, H. Yang and Y. Wang, Talanta, 2017, 164, 291–299 CrossRef CAS.
- A. El Jaouhari, L. Yan, J. Zhu, D. Zhao, M. Zaved Hossain Khan and X. Liu, Anal. Chim. Acta, 2020, 1106, 103–114 CrossRef CAS.
- N. N. Lu, H. Liu, R. Huang, Y. Gu, X. Y. Yan, T. T. Zhang, Z. Q. Xu, H. X. Xu, Y. Xing, Y. Song, X. W. Li and Z. Q. Zhang, Anal. Chem., 2019, 91, 11938–11945 CrossRef CAS.
- Y. Wu, P. Deng, Y. Tian, Z. Ding, G. Li, J. Liu, Z. Zuberi and Q. He, Bioelectrochemistry, 2020, 131, 107393 CrossRef CAS.
- S. T. Shi, C. Q. Zhou, Y. P. Wei, A. T. Chen, N. N. Tang, Q. G. He and P. H. Deng, Microchem. J., 2023, 194, 109310 CrossRef CAS.
- M. B. Gholivand, L. Mohammadi-Behzad and H. Hosseinkhani, Anal. Biochem., 2016, 493, 35–43 CrossRef CAS.
- Y. X. Lu, J. Hu, Y. B. Zeng, Y. Zhu, H. L. Wang, X. L. Lei, S. S. Huang, L. H. Guo and L. Li, Sens. Actuators, B, 2020, 311, 127911 CrossRef CAS.
- Q. F. Zhen, H. Y. Ma, Z. X. Jin, D. Zhu, X. Liu, Y. Sun, C. J. Zhang and H. J. Pang, New J. Chem., 2021, 45, 4986–4993 RSC.
- S. Tursynbolat, Y. Bakytkarim, J. Huang and L. Wang, J. Pharm. Anal., 2019, 9, 358–366 CrossRef PubMed.
- X. Niu, Z. Wen, X. Li, W. Zhao, X. Li, Y. Huang, Q. Li, G. Li and W. Sun, Sens. Actuators, B, 2018, 255, 471–477 CrossRef CAS.
- K. Davoodi-Rad, A. Shokrollahi, F. Shahdost-Fard and K. Azadkish, Biosensors, 2023, 13, 374 CrossRef CAS.
- P. Sun, Y. Zhou, T. Qiu and J. Peng, Anal. Bioanal. Chem., 2023 DOI:10.1007/s00216-023-05095-7.
- X.-L. Xie, Z. Zhang, W. Xiong, J. Wang, W. Gong, W. Xu, S. Cai and J. Li, Arabian J. Chem., 2024, 17, 105888 CrossRef CAS.
- J. Duhan and S. Obrai, Food Chem., 2024, 460, 140630 CrossRef CAS PubMed.
- B. The Huy, L. Thi Cam Huong, M. Sharipov, H. Bang Truong and Y.-I. Lee, Microchem. J., 2024, 200, 110325 CrossRef CAS.
- L. Yu, S. Zhang, H. Xu, L. Wang, X. Zhu, X. Chen, W. Xu, W. Xu, H. Zhang and Y. Lin, Anal. Chim. Acta, 2020, 1126, 7–15 CrossRef CAS PubMed.
Footnote |
| † Electronic supplementary information (ESI) available. See DOI: https://doi.org/10.1039/d4na00583j |
| This journal is © The Royal Society of Chemistry 2024 |

