 Open Access Article
Harnessing sustainable nanoclusters for sensitive optical detection of tetracyclines and the underlying mechanism†
Miguel
Justo-Tirado‡
 a,
Irene
Pérez-Herráez‡
 a,
Jorge
Escorihuela
 b,
Raúl
Arenal
 cde,
Elena
Zaballos-García
 *b and
Julia
Pérez-Prieto
 *a
*a
aInstituto de Ciencia Molecular (ICMol), Universitat de València, Catedrático José Beltrán 2, Paterna, Valencia, Spain. E-mail: julia.perez@uv.es
bDepartamento de Química Orgánica, University de València, Av. Vicent Andres Estelles s/n, Burjassot, Spain
cInstituto de Nanociencia y Materiales de Aragon (INMA), CSIC-Universidad de Zaragoza, 50009 Zaragoza, Spain
dLaboratorio de Microscopias Avanzadas (LMA), U. Zaragoza, C/Mariano Esquillor s/n, 50018 Zaragoza, Spain
eARAID Foundation, 50018 Zaragoza, Spain
First published on 6th September 2024
Abstract
Simple and rapid sensing methods for the detection of antibiotics in drinks and foods are highly desirable due to the presence of these drugs in food products, as a consequence of extensive abuse of antibiotics in livestock production. In this study, we report a facile synthesis strategy of gold nanoclusters (AuNCs) passivated with N-acetyl-L-cysteine (AuNC@NAC). This nanocluster exhibits a fluorescence emission peak at 700 nm, which gradually decreases at increasing concentrations of antibiotics, such as tetracyclines. The limit of detection (LOD) was determined to be 0.8 ppm with a linear range of 0.1–140 μM (0.04–62 ppm). This method showcased exceptional selectivity in the detection of tetracyclines compared to anions, metallic cations and amino acids. The underlying mechanism has been elucidated, and the fluorescence quenching was found to be a combination of dynamic and static quenching mechanisms, with photoinduced electron transfer (PET) identified as the primary process for dynamic quenching.
1. Introduction
Tetracyclines are a specific group of broad-spectrum antibiotics commonly used in both human and veterinary medicine, for the treatment of various bacterial infections.1,2 Nevertheless, the excessive and improper use of tetracyclines has contributed to the emergence of new bacterial resistance and the accumulation of this antibiotic in the environment and animal products.3,4 This accumulation constitutes a significant threat to human health by suppressing the growth of microorganisms.5,6 Tetracycline residues can severely result in a wide range of side effects, such as allergic reactions, gastrointestinal disturbances, liver toxicity and other adverse physiological reactions, besides environmental issues through their promotion of bacterial resistance to antibiotics.7 For this reason, many countries and organizations have established maximum residue limits (MRLs) of tetracyclines in food of animal origin to ensure food safety.8 Accordingly, the U.S. Food and Drug Administration (FDA) has established 2 ppm as the tolerance for the sum of tetracycline residues in animal muscles.9Consequently, there is an urgent demand for efficient tetracycline detection to safeguard human health and the environment. In the past few decades, various methods have been established for this aim, including high performance liquid chromatography (HPLC)10,11 and enzyme-linked immunoassay.12–15 Despite the good performance of these methods (e.g., good sensitivity), they suffer from shortcomings: they are costly, they entail the use of complicated equipment, thus requiring specific skilled operation, and they are time-consuming. As such, it is of great significance to develop a low-cost, fast and visual method for the detection of tetracyclines. It should be highlighted that fluorescence sensing has become a preferable option for detection of environmental pollutants.
Gold nanoclusters (AuNCs)16 are ultra-small size nanoparticles, which offer unique features compared to traditional fluorescent dyes, such as large Stokes shift emission and good photostability. Their low toxicity and good biocompatibility make them suitable for a broad range of applications in the biological field.17–20 They are also of utmost interest in materials and life science and have demonstrated broad applications in areas such as biosensing,21–25 optical imaging,26–29 drug delivery30,31 and tumour therapy.32,33
In this study, we describe the synthesis of N-acetyl-L-cysteine-capped AuNC (AuNC@NAC), by a straightforward protocol which simplifies the synthesis by avoiding the use of additional chemicals and complicated synthetic and purification steps. The synthesized AuNC@NACs have proved to be effective to detect tetracycline (TC) at low concentrations. The sensing mechanism was investigated and thoroughly discussed. Overall, a detection method for TC has been developed with high sensitivity and selectivity towards other interfering analytes.
2. Results and discussion
2.1. Synthesis of AuNC@NAC
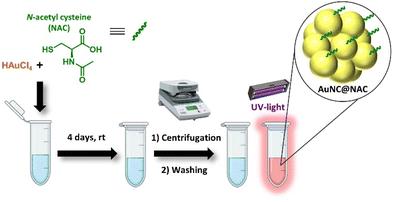
An aqueous solution of AuNC@NAC was prepared by combining N-acetyl-L-cysteine (NAC), which worked dually as a reducing agent and capping ligand, with HAuCl4 at ambient temperature (Fig. 1). The temporal evolution of the dispersion was meticulously monitored through absorbance and photoluminescence (PL) measurements (Fig. S1, ESI†). The emission spectrum revealed a gradual enhancement in AuNC@NAC luminescence over time post-synthesis. After 4 days, the formed precipitate was isolated by centrifugation, washed with water, and precipitated by centrifugation. After purification, the AuNC@NAC water suspension was stored at room temperature.2.2. Characterization of AuNC@NAC
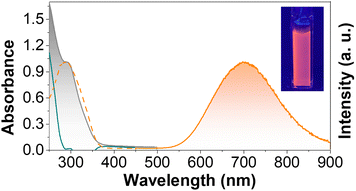
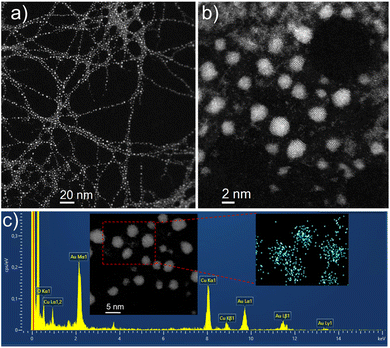
The UV-vis spectrum of AuNC@NAC dispersed in water displayed an absorption band with a maximum at ca. 300 nm (Fig. 2, grey area). The PL spectrum of AuNC@NAC at λexc = 310 nm showed a broad emission from green to the near infrared (NIR), with the peak maximum at 700 nm (Fig. 2, orange line). The PL spectrum of AuNC@NAC did not change with the excitation wavelength, varying from 300 to 420 nm (Fig. S2, ESI†), which was indicative that the emission was real luminescence from the relaxed states and not due to scattering effects. The prepared AuNC@NAC exhibited a photoluminescence quantum yield (ΦPL) of around 1%.Fig. S3a (see the ESI)† displays transmission electron microscopy (TEM) images of AuNC@NAC. Statistical analysis of 300 measured nanoclusters indicates that the synthesized AuNC@NAC samples are nearly spherical, with diameters averaging 2.2 ± 0.5 nm (Fig. S3b, ESI†). High-resolution TEM (HRTEM) images of AuNC@NAC showed the crystallinity of the samples. The inverse Fast Fourier Transform (i-FFT) analysis revealed an interplanar distance of 0.23 nm (Fig. S3c, d and S4a, ESI†), corresponding to the (111) lattice spacing of face-centred-cubic Au.34,35 The presence of Au in the sample was also corroborated by energy dispersive X-ray spectrometry (EDAX) (Fig. S4b, ESI†). Elemental mapping images of AuNC@NAC showed that Au and S elements were uniformly distributed (Fig. S4c–f, ESI†). Scanning transmission electron microscopy (STEM) imaging and spectroscopy (energy dispersive X-ray spectroscopy (EDS)) techniques were employed to investigate these materials at the local scale. A low-magnification high-angle annular dark field ((HAADF)-STEM) image of one of these samples is displayed in Fig. 3a and b and shows small (less than 3 nm) and crystalline Au nanoclusters (AuNC@NAC). Fig. 3c displays an EDS spectrum recorded in the red rectangle highlighted in the inset HAADF-HRSTEM image and confirms the presence of the Au elemente.
Comparison between the Fourier Transform Infrared (FT-IR) spectra of free NAC and AuNC@NAC (Fig. S5, ESI†) showed that both exhibited similar peaks; however, the signal at 2544 cm−1, assigned to the S–H stretching vibration mode, disappeared.36 This is indicative of the breakage of the cystine S–H bond, followed by the anchoring of the moieties to the nanocluster surface. The shift of the amide C![[double bond, length as m-dash]](https://www.rsc.org/images/entities/char_e001.gif) O peak and N–H peak suggested the electrostatic interaction between the amide of the NAC moiety and the Au atoms at the AuNC surface (see the ESI† for further information).
O peak and N–H peak suggested the electrostatic interaction between the amide of the NAC moiety and the Au atoms at the AuNC surface (see the ESI† for further information).
The weight contribution of NAC in AuNC@NAC was estimated by thermogravimetric analysis (TGA) to be about 35% (Fig. S6, ESI†). The typical weight loss of NAC (at 185 °C) occurred at 205 °C, suggesting a higher thermal stability of NAC when it is attached to the nanomaterial surface.37 According to the mass after TGA analysis, an estimation of one NAC molecule per Au atom was obtained, which is in line with the inductively coupled plasma-mass spectrometry (ICP-MS) analyses (Table S1, ESI†), which provided a 1![[thin space (1/6-em)]](https://www.rsc.org/images/entities/char_2009.gif) :
:![[thin space (1/6-em)]](https://www.rsc.org/images/entities/char_2009.gif) 1 NAC
1 NAC![[thin space (1/6-em)]](https://www.rsc.org/images/entities/char_2009.gif) :
:![[thin space (1/6-em)]](https://www.rsc.org/images/entities/char_2009.gif) Au ratio. MALDI-MS was performed on as-synthesized AuNC@NAC (Fig. S7, ESI†). Under the ionization conditions, the original clusters could not be detected; nevertheless, characteristic fragments were clearly assigned in the spectra, such as Au4(NAC)3 at m/z 1273.93, Au4(NAC)4 at m/z 1458.95 or Au5(NAC)8 at m/z 2288.78. The isotopic pattern is also consistent with the presence of gold.
Au ratio. MALDI-MS was performed on as-synthesized AuNC@NAC (Fig. S7, ESI†). Under the ionization conditions, the original clusters could not be detected; nevertheless, characteristic fragments were clearly assigned in the spectra, such as Au4(NAC)3 at m/z 1273.93, Au4(NAC)4 at m/z 1458.95 or Au5(NAC)8 at m/z 2288.78. The isotopic pattern is also consistent with the presence of gold.
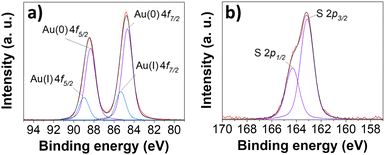
X-ray photoelectron spectroscopy (XPS) measurements were carried out to investigate the electronic structure of AuNC@NAC, suggesting the existence of Au0 and Au+ (at 84.7 and 88.4 eV for Au0 and 85.3 and 89.0 eV for Au+, Fig. 4a).38,39 The S 2p peaks were found in the 163–165 eV range (Fig. 4b), and the peaks centred at 163.2 and 164.3 eV can be fitted using a single component of S 2p3/2 and 2p1/2 signals, with an energy separation of ca. 1.2 eV and a splitting ratio of 2![[thin space (1/6-em)]](https://www.rsc.org/images/entities/char_2009.gif) :
:![[thin space (1/6-em)]](https://www.rsc.org/images/entities/char_2009.gif) 1. These results indicated that NAC was linked to the nanocluster Au surface via a S bond.40 High resolution XPS C 1s analysis was also consistent with the presence of NAC in AuNC@NAC (Fig. S8, ESI†).
1. These results indicated that NAC was linked to the nanocluster Au surface via a S bond.40 High resolution XPS C 1s analysis was also consistent with the presence of NAC in AuNC@NAC (Fig. S8, ESI†).
The effect of the pH value on the AuNC PL intensity was also evaluated. As shown in Fig. 5a, the PL intensity of AuNC@NAC at 700 nm remained high and nearly constant in the 2 to ca. 6 pH range, but it dropped drastically at pH > 6. This effect may be attributed to the degree of deprotonation of the organic ligand with the pH, that could possibly improve the interaction with the nanocluster surface, thereby facilitating the direct donation of delocalized electron density to the gold core. It is known that the presence of electron donating groups enhances the PL response of AuNCs.41
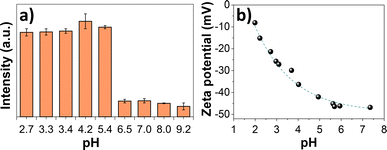 | ||
| Fig. 5 (a) Variation of PL intensity at 700 nm of AuNCs with pH. (b) ζ potentials with the pH of AuNC@NAC. | ||
Zeta (ζ) potential measurements of AuNC@NAC in acidic pH media were also conducted. The measurements revealed that the nanoclusters were highly stable with an average surface charge of −15.2 mV, at pH 2.7, and −37.2 mV, at pH 4.2, i.e., the value increases with the pH of the medium (Fig. 5b). The NAC ligand contains a carboxylic acid group (pKa = 3.24); thus, at pH above 3.3, the carboxylic groups will be deprotonated with an overall negative surface charge, as supported by the negative ζ potential.
At pH values higher than pH 6.5, the decomposition of the cluster might happen, or even the formation of another species. At these pH values, the loss of emission was not recovered when returning to the initial pH acidic values,42i.e., the optimal experimental conditions according to the emission intensity were at pH values below 5.
2.3. AuNC@NAC for the detection of TC
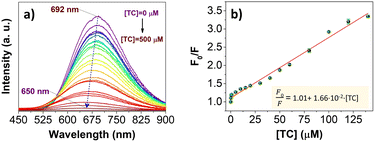
The PL intensity of AuNC@NAC at 700 nm gradually decreased with an increasing tetracycline concentration and was totally quenched at a 500 μM concentration, concomitantly with a blue shift of the emission maximum of about 40 nm (Fig. 6a).When using a low concentration of TC, specifically in the 0.1–140 μM range, the relative F0/F PL intensity showed a linear relationship, which was expressed as F0/F = 0.101 + 1.66 × 10⁻² × [TC] (R2 = 0.986) (Fig. 6b), where F0 and F were the PL intensity of AuNC@NAC in the absence and in the presence of TC, respectively. Moreover, the limit of detection (LOD) was calculated to be 0.8 ppm according to the formula LOD = 3σk−1, where σ was the standard deviation of fluorescence intensity of AuNC@NAC (n = 11) and k was the value of the slope in the linear graph. Compared with other fluorescence assays based on AuNCs for TC detection,43–45 the present methodology provides a rapid and sensitive method for antibiotic detection with similar performance to other TC detection methods based on fluorescent nanomaterials and similar metallic nanoclusters capped with thiolated and non-thiolated ligands (see Tables S2 and S3, ESI†).
Compared to other fluorescence assays based on AuNCs for TC detection,43–45 the present methodology offers a rapid and sensitive approach for antibiotic detection, delivering comparable performance to other TC detection methods using fluorescent nanomaterials and similar metallic nanoclusters capped with both thiolated and non-thiolated ligands (see Tables S2 and S3, ESI†).
In order to verify the specificity of AuNC@NAC to TC, some common interfering analytes, such as anions and metallic cations (Cl−, Al3+, Ca2+, SO42−, Cu2+, K+, Mg2, CO32−, NO3− and Na+), amino acids (L-Tyr, L-Phe, L-Hys, L-Cys and L-Pen), small molecules (thiomicamine and tyramine), antibiotics (erythromycin, kanamycin, chloramphenicol and ampicillin) and other TC derivatives (doxycycline (DOX), oxytetracycline (OTC) and chlortetracycline (CTC)) were selected.
Fig. 7 shows the relative PL intensity (F0/F) with various interfering analytes. The PL of the AuNC@NAC sensor exhibited no significant changes in the presence of different anions, metallic cations or amino acids. AuNC@NAC was also selective toward other molecules of interest, such as thiomicamine and tyramine. Finally, the fluorimetric AuNC@NAC sensor exhibits good selectivity toward several tetracycline antibiotics. As shown in Fig. 6, TC, CTC, OTC and DOX could significantly decrease the fluorescence intensity of AuNC@NAC at 700 nm among all the tested antibiotics. These data demonstrate that the AuNC@NAC sensor is particularly effective for detecting tetracyclines. The remarkable selectivity of AuNC@NAC can be attributed to the ability of the NAC ligand to establish interactions with TC, CTC, OTC, and even DOX. However, the AuNC@NAC sensor exhibits lower sensitivity towards DOX. This behaviour can be attributed to minor structural differences in the tetracycline molecules, such as the absence of the hydroxy group (R3) in DOX.
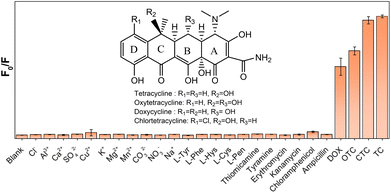 | ||
| Fig. 7 Selectivity of the AuNC@NAC sensor towards some common interfering ions, several amino acids and antibiotics. | ||
Next, in order to explore the potential value of the AuNC@NAC detection method for TC in practical samples, TC levels in tap water were measured using standard addition methods. Recovery tests demonstrated good recoveries, ranging from 90% to 108% (Table S4, ESI†). These results confirm the feasibility and reliability of the proposed method for quantifying TC in practical samples.
2.4. Mechanism for the sensing of TC
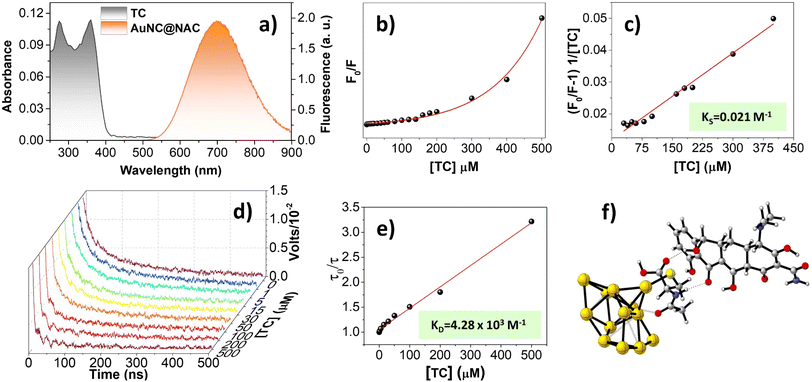
Fluorescence sensors can be deactivated through a variety of processes triggered by the presence of an analyte in the system. These processes between the fluorophore and the analyte can be either ground-state interactions, such as complex formation and hydrogen bonding, or excited-state interactions, such as Förster Resonance Energy Transfer (FRET),46 electron-exchange quenching (or Dexter interaction) and photoinduced electron transfer (PET). Also, in certain cases, the inner filter effect (IFE) can occur, i.e., there is loss of observed fluorescence intensity caused by absorption of light by the sample. These mechanisms are not mutually exclusive, and many reports indicate that quenching occurs by a combination of them that can collectively influence the fluorescence response of the fluorometric sensors.47FRET, electron-exchange quenching, and IFE mechanisms rely on spectral overlap of the donor and acceptor; however, there was a negligible overlap between the absorption spectrum of the analyte and the emission spectrum of the AuNC (see Fig. 8a) and consequently, this type of mechanism can be excluded.48
Collisional quenching of fluorescence is described by the Stern–Volmer equation, and its plot is linear when only one type of quenching occurs.49,50 In this study, the Stern–Volmer plot exhibits a positive deviation from linearity and is concave to the Y-axis, providing direct evidence for the presence of both static and dynamic quenching (Fig. 8b).51
A system involving both static and dynamic processes is represented by a polynomial equation:
 | (1) |
 | (2) |
For dynamic quenching, the relationship is expressed as
 | (3) |
Since KD is higher than KS, dynamic quenching predominates over the static quenching in our system. Thus, the fluorescence quenching was primarily influenced by dynamic processes and any observed static quenching can be attributed to relatively weak nonbonding interactions, such as hydrogen bonding. The gold nanocluster surface has a considerable number of functional groups due to its capping with NAC ligands. When TC is mixed with AuNC@NAC, the functional groups from AuNC@NAC could easily form hydrogen bonds with TC. The formation of hydrogen bonds between AuNC@NAC and TC facilitates their proximity, thereby enhancing the possibility of electron transfer between them. As a result, this process can help the dynamic quenching of the nanocluster fluorescence.
The observed decrease in lifetime confirms the presence of dynamic quenching in the system. If quenching was limited to the ground state, this phenomenon would not be evident. The system shows both dynamic and static quenching, as indicated by the positive deviation from linearity in the Stern–Volmer plot (Fig. 8b). Consequently, changes in the IR spectrum upon addition of TC would be expected, though dynamic quenching plays a more significant role in the fluorescence decrease compared to static quenching. When comparing the FT-IR spectra of pure TC with that of AuNC@NAC after TC addition, subtle differences are observed (Fig. S9, ESI†). In particular, the stretching vibration absorption bands for TCs attributed to –OH and –NH groups shift from 3296 cm−1 to 3284 cm−1, and the C![[double bond, length as m-dash]](https://www.rsc.org/images/entities/char_e001.gif) O stretch vibration band weakens and shifts from 1674 cm−1 to 1645 cm−1. These shifts suggest that the C
O stretch vibration band weakens and shifts from 1674 cm−1 to 1645 cm−1. These shifts suggest that the C![[double bond, length as m-dash]](https://www.rsc.org/images/entities/char_e001.gif) O and –OH groups in TC participate in weak intermolecular interactions, such as hydrogen bonding, with the –NH and –OH groups of NAC present on the nanocluster surface.
O and –OH groups in TC participate in weak intermolecular interactions, such as hydrogen bonding, with the –NH and –OH groups of NAC present on the nanocluster surface.
Furthermore, a comparison of the FT-IR spectra of pure AuNC@NAC with those obtained after adding TC reveals similar results (Fig. S9, ESI†). The shoulder at 3543 cm−1, corresponding to the –OH stretching vibration was nearly obscured by the TC signal but exhibited a slight shift. A similar shift was observed in the C![[double bond, length as m-dash]](https://www.rsc.org/images/entities/char_e001.gif) O stretch vibration, which changed from 1710 cm−1 to 1735 cm−1.
O stretch vibration, which changed from 1710 cm−1 to 1735 cm−1.
To gain more insight into these weak nonbonding interactions, DFT calculations were performed at the B3LYP-D3/def2TZVP (SDD for Au) level of theory using Gaussian 16.52 Initially, different coordination modes of the NAC ligand with the AuNC were evaluated (Fig. S10, ESI†). Among the different modes, the most stable coordination was found involving the sulphur atom and the oxygen of the N-acetyl moiety of NAC with gold atoms. The interaction between a TC molecule and AuNC@NAC involves intermolecular hydrogen bonds between the –OH and C![[double bond, length as m-dash]](https://www.rsc.org/images/entities/char_e001.gif) O groups on the C6 ring of TC (Fig. 8f), as supported by the FT-IR analysis. This finding is in accordance with the observed lower sensitivity of AuNC@NAC to DOX, the only TC tested that lacks the –OH group on the C6 ring.
O groups on the C6 ring of TC (Fig. 8f), as supported by the FT-IR analysis. This finding is in accordance with the observed lower sensitivity of AuNC@NAC to DOX, the only TC tested that lacks the –OH group on the C6 ring.
The direction of electron transfer in the excited state is determined by the oxidation and reduction potentials of the ground and excited states. When discussing PET, the term donor refers to species that donate an electron to an acceptor. In PET the terms donor and acceptor do not identify which species is initially in the excited state. This is different from RET, where a fluorophore acts always as the donor.
To elucidate this, we estimated the relative ordering of energy states by electrochemical measurements (Fig. S11 and Table S6, ESI†) as has been done in other studies.53,54 When AuNC@NAC is excited upon irradiation, the electron is promoted from the valence band (VB; −7.37 eV) to the conduction band (CB; −3.78 eV), creating a vacancy (hole) in the VB. This hole moves from the VB of AuNC@NAC to the HOMO level (−6.82 eV) of the TC. This event is equivalent to an electron transfer from the TC HOMO level to the VB of AuNC@NAC (hole transfer, hT), as shown in Fig. 9. This is consistent with the observed blue shift of the emission of AuNC@NAC (Fig. 6a) in the presence of TC that in this case may indicate the reduction of AuNC@NAC due to its role as an acceptor vs. the TC, which acts as a donor.
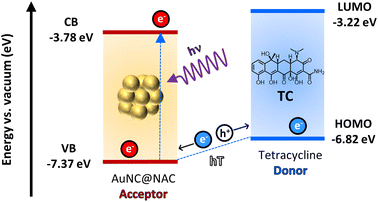 | ||
| Fig. 9 Schematic diagram of PET or PHT showing the conduction band valence band energy levels of AuNC@NAC and the HOMO–LUMO levels of TC obtained by cyclic voltammetry. | ||
3. Conclusions
A straightforward synthesis of a fluorometric sensor utilizing AuNCs coated with NAC for the sensitive and selective detection of TC is described. The AuNC@NAC sensor exhibits a fluorescence maximum at 700 nm, which diminishes with increasing TC concentrations. This nanomaterial effectively detects TC within the 0 to 500 μM range, showing a linear response up to 140 μM and a limit of detection (LOD) of 0.8 ppm. Selectivity tests against various ions demonstrate that only TC significantly affects the fluorescence, highlighting the sensor's excellent selectivity for TC. The sensor features easy preparation, rapid response, a broad linear range, high sensitivity, and superior selectivity. Our findings indicate that TC-induced fluorescence quenching of AuNC@NAC involves both dynamic and static quenching mechanisms, with photoinduced electron transfer (PET) being the primary dynamic quenching process. We finally demonstrate that in the case under study dynamic quenching predominates over static quenching. This study advances our understanding of fluorescence quenching mechanisms in AuNC-based sensors, and further research is underway to develop additional fluorescent antibiotic sensors using AuNCs.4. Experimental
4.1. Materials
The chemicals and solvents used in this work were of analytical grade and used without prior purification. Gold(III) chloride trihydrate (HAuCl4·3H2O), N-acetyl-L-cysteine (NAC), hydrochloric acid (HCl), citric acid, sodium hydroxide (NaOH), tetracycline hydrochloride (TC), chlortetracycline hydrochloride (CTC), doxycycline monohydrate (DOX), oxytetracycline hydrochloride (OTC), sodium nitrate (NaNO3), potassium chloride (KCl), sodium carbonate (Na2CO3), sodium chloride (NaCl), copper sulphate (CuSO4), aluminium chloride (AlCl3), manganese chloride (MnCl2), calcium chloride (CaCl2), magnesium sulphate (MgSO4), L-tyrosine (L-Tyr), L-phenylalanine (L-Phe), L-histidine (L-His), L-cysteine (L-Cys), thiomicamine, tyramine, erythromycin, kanamycin, chloramphenicol and ampicillin were purchased from Sigma-Aldrich. In all cases, the glassware used in the following procedures was cleaned in a bath of freshly prepared solution of HNO3–HCl (1![[thin space (1/6-em)]](https://www.rsc.org/images/entities/char_2009.gif) :
:![[thin space (1/6-em)]](https://www.rsc.org/images/entities/char_2009.gif) 3, v/v) and rinsed thoroughly with water prior to use. For all aqueous solutions, high purity deionized water from a Millipore system was used. Saline sodium citrate buffer (0.1 M citric acid, 1 M NaOH, and 0.1 M HCl) was used to maintain the pH near a value of 3.5.
3, v/v) and rinsed thoroughly with water prior to use. For all aqueous solutions, high purity deionized water from a Millipore system was used. Saline sodium citrate buffer (0.1 M citric acid, 1 M NaOH, and 0.1 M HCl) was used to maintain the pH near a value of 3.5.
4.2. Instruments
The following instruments were used for characterization and analysis. Centrifugation was carried out on a Thermo-Scientific Legend XIR; the supernatant was collected with care to avoid disturbing the precipitate. The zeta (ζ) potential was determined by employing a Zetasizer Ultra (Malvern, UK).Transmission electron microscopy (TEM) images were acquired using a HITACHI HT7800 microscope with a filament of LaB6 operated at 100 kV. High-resolution transmission electron microscopy (HRTEM) images were recorded using a TECNAI G2 F20 microscope operating at 200 kV (point resolution of 0.24 nm) and equipped with a CCD GATAN camera. Energy-dispersive X-ray analysis (EDAX) was performed on the TECNAI G2 F20 microscope by using a Si(Li) detector (active area: 30 mm2 and resolution: <142 eV) and the Genesis software. The samples were deposited on a Formvar/carbon film supported on a 300 mesh copper grid from dispersion in water and dried under vacuum at room temperature.
For the TEM structural and EDS analyses, the sample was dispersed in ethanol and this suspension was ultrasonicated and dropped onto a copper carbon holey grid. STEM studies were performed on a probe-corrected FEI Titan-Low-Base 60–300 operating at 300 keV (equipped with an X-FEG® gun and Cs-probe corrector (CESCOR from CEOS GmbH)). Energy dispersive X-ray spectroscopy (EDS) data were acquired using an Oxford Instruments X-MaxN 100TLE spectrometer.
Fourier transform infrared (FT-IR) spectra were obtained using a Bruker Alpha II FT-IR-ATR spectrometer with a 4 cm−1 resolution between 400 and 4000 cm−1.
MALDI-MS spectra were obtained on a TIMS-TOF fleX (Bruker) in MALDI operation, in reflector positive mode in 700–3500 and 1000–10![[thin space (1/6-em)]](https://www.rsc.org/images/entities/char_2009.gif) 000 m/z ranges and a laser intensity of 60–80%.
000 m/z ranges and a laser intensity of 60–80%.
Thermogravimetric analyses (TGA) were performed with a TGA 550 from TA Instruments with an operative temperature range of 25–950 °C (rate of 10 °C min−1) and under nitrogen flux.
X-ray photoelectron spectroscopy (XPS) spectra were acquired with VG-Microtech Multilab 3000 equipment, which has a semispherical electron analyser with 9 channels, a pass energy of 2200 eV and an X-ray radiation source with Mg and Al anodes.
Inductively coupled plasma-mass spectrometry (ICP-MS) analyses were carried out in triplicate using an ICP-MS Agilent 7900 in helium mode.
UV-vis absorption spectra were recorded on a PerkinElmer 1050+ UV/vis/NIR spectrometer.
Steady-state emission spectra were recorded on a FLS1000 photoluminescence spectrometer (Edinburgh Instruments) equipped with a 450 W ozone free xenon arc lamp. The Fluoracle software was used to register the data. The detection correction was applied to all the spectral data.
The emission deactivation kinetics were obtained through laser-induced emission mode with the photomultiplier detector of a laser flash photolysis spectrometer (LP980-KS, Edinburgh Instruments) equipped with a Nd:YAG INDI Quanta-Ray laser (Spectra Physics). The laser output power was 32 mW for 350 nm. Additionally, a 395 nm long pass filter was used before the detection monochromator. The kinetics were fitted with the L900 software (Edinburgh Instruments). All measurements were carried out in air. All data were acquired using 1 cm × 1 cm path length quartz cuvettes.
Absolute photoluminescence quantum yield (ΦPL) measurements were performed in sealed-tube quartz cuvettes (1 cm optical path length) in a Quantaurus QY Plus (C13534-11, Hamamatsu Photonics K.K.). The measurements were carried out under an air atmosphere and the excitation source used was the built-in Xe lamp.
The electrochemical studies were carried out with the BAS CV50 equipment and Metrohm PGSTAT 101 Autolab in a conventional cell with three electrodes. The reference electrode used is Ag (3 M NaCl)/AgCl and the electrochemical cell is completed using a carbon working electrode and an auxiliary platinum electrode. Before carrying out the test, the working electrode is washed, polished and activated. Before each experimental measurement, the working electrode was polished with a soft alumina surface, which was subsequently dried and cleaned. A ferrocene/ferrocenium redox couple has been used as an external standard.
4.3. Methods
The molar ratio of HAuCl4/NAC was optimized to obtain high quality luminescent AuNC@NAC. Under the described conditions, the concentration of HAuCl4 was kept constant and different HAuCl4/NAC molar ratios were assayed: 1![[thin space (1/6-em)]](https://www.rsc.org/images/entities/char_2009.gif) :
:![[thin space (1/6-em)]](https://www.rsc.org/images/entities/char_2009.gif) 1, 1
1, 1![[thin space (1/6-em)]](https://www.rsc.org/images/entities/char_2009.gif) :
:![[thin space (1/6-em)]](https://www.rsc.org/images/entities/char_2009.gif) 2, 1
2, 1![[thin space (1/6-em)]](https://www.rsc.org/images/entities/char_2009.gif) :
:![[thin space (1/6-em)]](https://www.rsc.org/images/entities/char_2009.gif) 3, 1
3, 1![[thin space (1/6-em)]](https://www.rsc.org/images/entities/char_2009.gif) :
:![[thin space (1/6-em)]](https://www.rsc.org/images/entities/char_2009.gif) 4, 1
4, 1![[thin space (1/6-em)]](https://www.rsc.org/images/entities/char_2009.gif) :
:![[thin space (1/6-em)]](https://www.rsc.org/images/entities/char_2009.gif) 5, 1
5, 1![[thin space (1/6-em)]](https://www.rsc.org/images/entities/char_2009.gif) :
:![[thin space (1/6-em)]](https://www.rsc.org/images/entities/char_2009.gif) 6, 1
6, 1![[thin space (1/6-em)]](https://www.rsc.org/images/entities/char_2009.gif) :
:![[thin space (1/6-em)]](https://www.rsc.org/images/entities/char_2009.gif) 7, 1
7, 1![[thin space (1/6-em)]](https://www.rsc.org/images/entities/char_2009.gif) :
:![[thin space (1/6-em)]](https://www.rsc.org/images/entities/char_2009.gif) 10 and 1
10 and 1![[thin space (1/6-em)]](https://www.rsc.org/images/entities/char_2009.gif) :
:![[thin space (1/6-em)]](https://www.rsc.org/images/entities/char_2009.gif) 20. Recording of the fluorescence spectrum of AuNC@NAC, at different molar ratios, showed that the highest fluorescence intensity was obtained for the 1
20. Recording of the fluorescence spectrum of AuNC@NAC, at different molar ratios, showed that the highest fluorescence intensity was obtained for the 1![[thin space (1/6-em)]](https://www.rsc.org/images/entities/char_2009.gif) :
:![[thin space (1/6-em)]](https://www.rsc.org/images/entities/char_2009.gif) 20 molar ratio, while the fluorescence intensity gradually decreased with the HAuCl4/NAC molar ratio. AuNC@NAC exhibited almost no fluorescence when the ratio of HAuCl4/NAC was below 1
20 molar ratio, while the fluorescence intensity gradually decreased with the HAuCl4/NAC molar ratio. AuNC@NAC exhibited almost no fluorescence when the ratio of HAuCl4/NAC was below 1![[thin space (1/6-em)]](https://www.rsc.org/images/entities/char_2009.gif) :
:![[thin space (1/6-em)]](https://www.rsc.org/images/entities/char_2009.gif) 5.
5.
![[thin space (1/6-em)]](https://www.rsc.org/images/entities/char_2009.gif) 000 rpm for 15 min. The supernatant was slowly removed without disturbing the precipitate and this was washed two times by dispersion in water and precipitation by centrifugation at 10
000 rpm for 15 min. The supernatant was slowly removed without disturbing the precipitate and this was washed two times by dispersion in water and precipitation by centrifugation at 10![[thin space (1/6-em)]](https://www.rsc.org/images/entities/char_2009.gif) 000 rpm for 15 min. After purification, the AuNC@NAC solutions were dispersed in water or the solutions were diluted with buffer solution, meanwhile, to avoid the effect of pH change.
000 rpm for 15 min. After purification, the AuNC@NAC solutions were dispersed in water or the solutions were diluted with buffer solution, meanwhile, to avoid the effect of pH change.
Data availability
The data supporting this article have been included as part of the ESI.†Author contributions
Conceptualization: J. E., E. Z. G. and J. P. P. Data curation: I. P. H. and M. J. T. Formal analysis: I. P. H., M. J. T. and J. E. Funding acquisition: J. P. P. Investigation: I. P. H. and M. J. T. Methodology: J. E. and E. Z. G. STEM measurement: R. A. Project administration: J. P. P. Resources: J. P. P. Supervision: J. E., E. Z. G. and J. P. P. Writing – original draft: I. P. H. and M. J. T. Writing – review & editing: J. E., E. Z. G. and J. P. P. All authors have given approval to the final version of the manuscript.Conflicts of interest
There are no conflicts to declare.Acknowledgements
This study forms part of the Advanced Materials programme (MFA/2022/051) and was supported by MCIN with funding from European Union NextGenerationEU (PRTR-C17.I1) and by Generalitat Valenciana (CIPROM/2022/57). R. A. acknowledges funding from the Government of Aragon (project DGA E13-23R (FEDER, EU)) and the support from the ‘Severo Ochoa’ Programme for Centres of Excellence in R&D of the Spanish Ministry of Science, Innovation and Universities (MICIU CEX2023-001286-S MICIU/AEI/10.13039/501100011033). The computational resources from the Servei d'Informàtica de la Universitat de Valencia (SIUV) are gratefully acknowledged. The proteomics facility of Servicio Central de Soporte a la Investigación Experimental (SCSIE) at the University of Valencia is acknowledged for the MALDI-MS analysis.Notes and references
- F. Nguyen, A. L. Starosta, S. Arenz, D. Sohmen, A. Dönhöfer and D. N. Wilson, Biol. Chem., 2014, 395, 559–575 CrossRef CAS PubMed.
- H.-B. Wang, B.-B. Tao, A.-L. Mao, Z.-L. Xiao and Y.-M. Liu, Sens. Actuators, B, 2021, 348, 130729 CrossRef CAS.
- Y. Amangelsin, Y. Semenova, M. Dadar, M. Aljofan and G. Bjørklund, Antibiotics, 2023, 12, 1–15 CrossRef PubMed.
- J. A. Ayukekbong, M. Ntemgwa and A. N. Atabe, Antimicrob. Resist. Infect. Control, 2017, 6, 47 CrossRef PubMed.
- D. Zhu and J. Sun, Environ. Sci. Eur., 2021, 33, 64 CrossRef.
- M. E. Ruiz and G. W. Wortmann, Cleve. Clin. J. Med., 2019, 86, 277–281 CrossRef PubMed.
- S. Shao and X. Wu, Crit. Rev. Biotechnol., 2020, 40, 1010–1018 CrossRef CAS PubMed.
- X. Liu, D. Huang, C. Lai, G. Zeng, L. Qin, C. Zhang, H. Yi, B. Li, R. Deng, S. Liu and Y. Zhang, TrAC, Trends Anal. Chem., 2018, 109, 260–274 CrossRef CAS.
- Code of Federal Regulations, Food and Drug Administration, Department of Health and Human Services, 1–1299, Food and Drugs, ch. 1, Animal Drugs, Feeds, and Related Products, 500–599, https://www.ecfr.gov/current/title-21/chapter-I/subchapter-E. Search PubMed.
- E. Patyra and K. Kwiatek, Chromatographia, 2021, 84, 741–749 CrossRef CAS.
- H.-C. Ri, J. Piao, L. Cai, X. Jin, X. Piao, X. Jin, C.-S. Jon, L. Liu, J. Zhao, H.-B. Shang and D. Li, Anal. Chim. Acta, 2021, 1182, 338957 CrossRef CAS PubMed.
- X. Gong, X. Li, T. Qing, P. Zhang and B. Feng, Analyst, 2019, 144, 1948–1954 RSC.
- C. Schwake-Anduschus and G. Langenkämper, J. Sci. Food Agric., 2018, 98, 4542–4549 CrossRef CAS PubMed.
- N. Pastor-Navarro, S. Morais, Á. Maquieira and R. Puchades, Anal. Chim. Acta, 2007, 594, 211–218 CrossRef CAS PubMed.
- J. Adrian, F. Fernández, F. Sánchez-Baeza and M.-P. Marco, J. Agric. Food Chem., 2012, 60, 3837–3846 CrossRef CAS PubMed.
- Q. Zhang, J. Xie, Y. Yu and J. Y. Lee, Nanoscale, 2010, 2, 1962–1975 RSC.
- Z. Liu, Z. Wu, Q. Yao, Y. Cao, O. J. H. Chai and J. Xie, Nano Today, 2021, 36, 101053 CrossRef CAS.
- X. Qu, Y. Li, L. Li, Y. Wang, J. Liang and J. Liang, J. Nanomater., 2015, 2015, 784097 CrossRef.
- I. Pérez-Herráez, M. Justo-Tirado, M. Bueno-Cuenca, E. Zaballos-García, J. Pérez-Prieto and I. Pérez-Herráez, Nanoscale Adv., 2022, 5, 2250–2254 RSC.
- I. Pérez-Herráez, J. Ferrera-González, E. Zaballos-García, M. González-Béjar and J. Pérez-Prieto, Chem. Mater., 2024, 36, 4426–4436 CrossRef PubMed.
- C. Huang, Z. Yang, K. Lee and H. Chang, Angew. Chem., 2007, 119, 6948–6952 CrossRef.
- F. Yu, H. Xiang, S. He, G. Zhao, Z. Cao, L. Yang and H. Liu, Analyst, 2022, 147, 2773–2778 RSC.
- X. Yuan, Z. Luo, Y. Yu, Q. Yao and J. Xie, Chem.–Asian J., 2013, 8, 858–871 CrossRef CAS PubMed.
- F. Cao, E. Ju, C. Liu, W. Li, Y. Zhang, K. Dong, Z. Liu, J. Ren and X. Qu, Nanoscale, 2017, 9, 4128–4134 RSC.
- I. M. Khan, S. Niazi, W. Akhtar, L. Yue, I. Pasha, M. K. I. Khan, A. Mohsin, M. W. Iqbal, Y. Zhang and Z. Wang, Coord. Chem. Rev., 2023, 474, 214842 CrossRef.
- L. Shang, R. M. Dörlich, S. Brandholt, R. Schneider, V. Trouillet, M. Bruns, D. Gerthsen and G. U. Nienhaus, Nanoscale, 2011, 3, 2009–2014 RSC.
- X. Wu, X. He, K. Wang, C. Xie, B. Zhou and Z. Qing, Nanoscale, 2010, 2, 2244–2249 RSC.
- C. Zhang, X. Gao, W. Chen, M. He, Y. Yu, G. Gao and T. Sun, iScience, 2022, 25, 105022 CrossRef CAS PubMed.
- S. Zhu, X. Wang, Y. Cong and L. Li, ACS Omega, 2020, 5, 22702–22707 CrossRef CAS PubMed.
- T. Chen, S. Xu, T. Zhao, L. Zhu, D. Wei, Y. Li, H. Zhang and C. Zhao, ACS Appl. Mater. Interfaces, 2012, 4, 5766–5774 CrossRef CAS PubMed.
- A. Yahia-Ammar, D. Sierra, F. Mérola, N. Hildebrandt and X. Le Guével, ACS Nano, 2016, 10, 2591–2599 CrossRef CAS PubMed.
- Y. Zhang, J. Li, H. Jiang, C. Zhao and X. Wang, RSC Adv., 2016, 6, 63331–63337 RSC.
- W. He, G. Ma, Q. Shen and Z. Tang, Nanomaterials, 2022, 12, 1738 CrossRef CAS PubMed.
- C. Wang, Y. Hu, C. M. Lieber and S. Sun, J. Am. Chem. Soc., 2008, 130, 8902–8903 CrossRef CAS PubMed.
- A. Al-Kattan, G. Tselikov, K. Metwally, A. A. Popov, S. Mensah and A. V. Kabashin, Nanomaterials, 2021, 11, 1–13 Search PubMed.
- Q. Wang, X. Yu, G. Zhan and C. Li, Biosens. Bioelectron., 2014, 54, 311–316 CrossRef PubMed.
- P. Gao, M. Li, Y. Zhang, C. Dong, G. Zhang, L. Shi, G. Li, M. Yuan and S. Shuang, Talanta, 2019, 197, 1–11 CrossRef CAS PubMed.
- F. Kang, X. Qu, P. J. J. Alvarez and D. Zhu, Environ. Sci. Technol., 2017, 51, 2776–2785 CrossRef CAS PubMed.
- A. Bonanno, I. Pérez-Herráez, E. Zaballos-García and J. Pérez-Prieto, Chem. Commun., 2020, 56, 587–590 RSC.
- Z.-C. Xu, C.-M. Shen, T.-Z. Yang, H.-R. Zhang, H.-L. Li, J.-Q. Li and H.-J. Gao, Chem. Phys. Lett., 2005, 415, 342–345 CrossRef CAS.
- X. Kang, X. Li, H. Yu, Y. Lv, G. Sun, Y. Li, S. Wang and M. Zhu, RSC Adv., 2017, 7, 28606–28609 RSC.
- H. Kawasaki, S. Kumar, G. Li, C. Zeng, D. R. Kauffman, J. Yoshimoto, Y. Iwasaki and R. Jin, Chem. Mater., 2014, 26, 2777–2788 CrossRef CAS.
- H.-B. Wang, Y. Li, H.-Y. Bai, Z.-P. Zhang, Y.-H. Li and Y.-M. Liu, Food Anal. Methods, 2018, 11, 3095–3102 CrossRef.
- D. Liu, X. Pan, W. Mu, C. Li and X. Han, Anal. Sci., 2019, 35, 367–370 CrossRef CAS PubMed.
- Y. Li, Q. Du, X. Zhang and Y. Huang, Talanta, 2020, 206, 120202 CrossRef CAS PubMed.
- D. W. Piston and G.-J. Kremers, Trends Biochem. Sci., 2007, 32, 407–414 CrossRef CAS PubMed.
- D. A. Giljohann, D. S. Seferos, W. L. Daniel, M. D. Massich, P. C. Patel and C. A. Mirkin, Angew. Chem., Int. Ed., 2010, 49, 3280–3294 CrossRef CAS PubMed.
- U. Sivasankaran, S. T. Cyriac, S. Menon and K. G. Kumar, J. Fluoresc., 2017, 27, 69–77 CrossRef CAS PubMed.
- M. Koneswaran and R. Narayanaswamy, Sens. Actuators, B, 2009, 139, 104–109 CrossRef CAS.
- U. Anand, C. Jash, R. K. Boddepalli, A. Shrivastava and S. Mukherjee, J. Phys. Chem. B, 2011, 115, 6312–6320 CrossRef CAS PubMed.
- Y. Xiao, J. W. Wang, X. G. Feng and H. Y. Wang, J. Anal. Chem., 2007, 62, 438–443 CrossRef CAS.
- T. Rinkel, J. Nordmann, A. N. Raj and M. Haase, Nanoscale, 2014, 6, 14523–14530 RSC.
- A. Cortés-Villena, D. A. Caminos, R. E. Galian and J. Pérez-Prieto, Adv. Opt. Mater., 2023, 11, 1–10 Search PubMed.
- A. Cortés-Villena, D. Bellezza, C. Cunha, I. Rosa-Pardo, Á. Seijas-Da Silva, J. Pina, G. Abellán, J. S. Seixas de Melo, R. E. Galian and J. Pérez-Prieto, J. Am. Chem. Soc., 2024, 146, 14479–14492 CrossRef PubMed.
Footnotes |
| † Electronic supplementary information (ESI) available. See DOI: https://doi.org/10.1039/d4na00637b |
| ‡ These authors contributed equally to this work. |
| This journal is © The Royal Society of Chemistry 2024 |

