
Investigating nalidixic acid adsorption onto ferrihydrite and maghemite surfaces: molecular-level insights via continuous-flow ATR-FTIR spectroscopy†
Ana C.
Schuh Frantz
ad,
Alberto
Mezzetti
a,
Ari Paavo
Seitsonen
 b,
Sylvie
Nélieu
c,
Etienne
Balan
d,
Guillaume
Morin
d and
Xavier
Carrier
*a
b,
Sylvie
Nélieu
c,
Etienne
Balan
d,
Guillaume
Morin
d and
Xavier
Carrier
*a
aSorbonne Université, CNRS, Laboratoire de Réactivité de Surface, LRS, F-75005 Paris, France. E-mail: xavier.carrier@sorbonne-universite.fr
bDépartement de Chimie, École Normale Supérieure, F-75005 Paris, France
cUniversité Paris-Saclay, INRAE, AgroParisTech, UMR ECOSYS, 91120 Palaiseau, France
dIMPMC, UMR 7590 CNRS – Sorbonne Université – MNHN – IRD, Paris, France
First published on 1st November 2024
Abstract
Contaminants sequestration by iron oxides are of particular relevance in environmental chemistry and Fourier transform infrared (FTIR) spectroscopy in attenuated total reflectance (ATR) mode is used in this study to investigate the molecular-scale adsorption mechanism of the antibiotic nalidixic acid (NAL) onto ferrihydrite and maghemite surfaces. High-surface area ferrihydrite and nano-sized maghemite were prepared as model adsorbents. This work provides a complete band assignment for protonated and deprotonated NAL to better describe in situ adsorption processes. In situ ATR-FTIR spectroscopy suggests that NAL mainly adsorbs on both iron oxides by a bidentate mode. Results also suggest that two sorption sites coexist on Maghemite surfaces leading to two sorption modes through the carboxylate group: bidentate chelate and bidentate bridging. The obtained results can contribute significantly towards molecular level understanding of antibiotics binding modes on iron oxides, a valuable piece of information to develop environmental remediation strategies.
Introduction
Organic pollution has raised significant environmental concern due to the uncertain long-term fate of pollutants within natural media. Prolonged exposure to toxic substances, such as pesticides, pharmaceuticals, and industrial additives, can modify microbial ecology, thereby posing risks to aquatic life and human health.1,2 One critical process controlling the spreading of contaminants is chemical sorption, particularly at the surface of reactive and high surface area minerals that are widespread in natural environment.1,3–7 Hence, the use of nanotechnology in remediation processes has expanded with iron substrates being at the forefront due to their remarkable versatility, sorption capacity and organics affinity. As a matter of fact, chemical adsorption to natural or geo-inspired substrates emerge as a potential alleviation mechanism for mitigating pollution.8Extensive studies have elucidated the binding mechanism of various adsorbate and adsorbent (solid substrate) couples.1,3,6,9–14 In the 90s, more abundant and reactive anionic solutes easily found in groundwater were often targeted in sorption studies, such as sulfates, phosphates and carbonates,3,4,9,11,15 while in the last decade, pharmaceuticals gained relevance due to their higher toxicological relevance and appearance even in drinking water.2,16
Quinolones, i.e. a class of antibiotics, have garnered attention in recent decades due to their toxicological concerns associated with antimicrobial resistance enhancement and public health issues stemming from incomplete metabolization.2,17 Among these, nalidixic acid (NAL), namely 1-ethyl-7-methyl-4-oxo-1,8-naphthyridine-3-carboxylic acid (IUPAC nomenclature), is a synthetic antibiotic that has been the object of several sorption studies.1,8,18–22 NAL consists of a bicyclic ring system that contains some groups attached to a naphthyridine, i.e. two pyridine rings fused, which provides unique pharmacological properties and antibacterial activity; more precisely, an ethyl group (–CH2CH3) at position 1, a carboxylic acid group (–COOH) at position 3, a keto–carbonyl (−C![[double bond, length as m-dash]](https://www.rsc.org/images/entities/char_e001.gif) O) at position 4 and a methyl group (–CH3) at position 8 (Fig. 1). Its pKa value is reported to be in the 5.8–6.2 range1,18,19,23–26 and due to the presence of the carboxylic acid group, NAL can also exist in a deprotonated form, the nalidixate anion (NAL−) above ca. pH 6. Its solubility in water is thus strongly dependent on pH, varying from 33 (pH 5) to 27
O) at position 4 and a methyl group (–CH3) at position 8 (Fig. 1). Its pKa value is reported to be in the 5.8–6.2 range1,18,19,23–26 and due to the presence of the carboxylic acid group, NAL can also exist in a deprotonated form, the nalidixate anion (NAL−) above ca. pH 6. Its solubility in water is thus strongly dependent on pH, varying from 33 (pH 5) to 27![[thin space (1/6-em)]](https://www.rsc.org/images/entities/char_2009.gif) 600 mg L−1 (pH 9).26
600 mg L−1 (pH 9).26
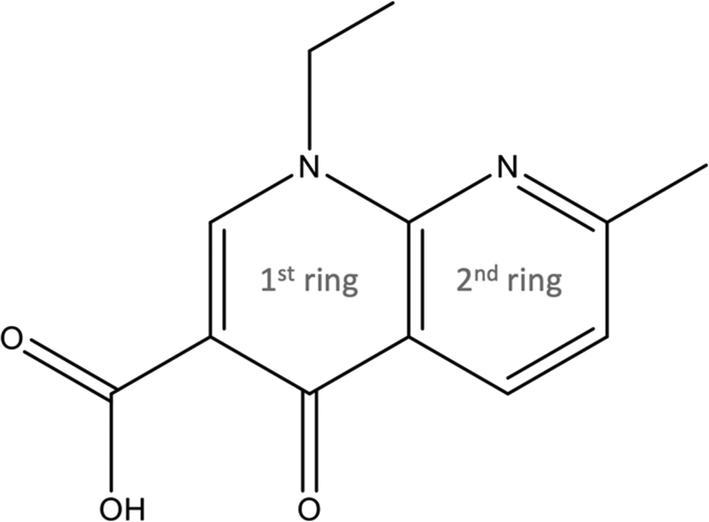 | ||
| Fig. 1 The nalidixic acid structure. | ||
The escalating presence of NAL in natural environments has elicited growing concerns due to its deleterious effects since it is recognized as toxic.27 NAL has been detected in different environments all around the world: in river sediments downstream of Paris28 (with a maximum concentration of 22 μg kg−1), in municipal waste water treatment plants effluents and rivers samples collected in Queensland, Australia16 (with maximum concentrations of 0.45 and 0.75 μg L−1) and in hospital effluents samples in Taiwan29 (maximum concentration of 67 μg L−1).
In situ spectroscopy is vigorously favored to reach a molecular-scale understanding of sorption phenomena in order to fully integrate the effect of surface hydration on the geometry of sorption complexes,11 mimicking colloidal interfaces in natural settings that typically retain water. Consequently, in situ studies mitigate the problems usually associated with ex situ investigations, such as structural modifications caused by drying.9,11 IR spectroscopy in attenuated total reflectance (ATR) mode arises as a key technique to perform in situ studies of chemical sorption by exploiting the principles of total reflection.30 Its short path lengths reduce solvent interference, enabling the study of sorption modes even in presence of strongly IR-light absorbing media, such as water.
This work explores quinolone, specifically NAL, binding modes onto maghemite, an iron oxide γ-Fe2O3, and ferrihydrite, a hydrous ferric oxyhydroxide (used as model of iron oxides ubiquitous in natural environments) under dry and aqueous condition with IR spectroscopy in ATR mode to conduct in situ studies to discuss the molecular interactions at solid–liquid and solid–air interfaces. Maghemite was chosen since it is a direct oxidation product of magnetite and zero-valent iron31 and has a well-known surface reactivity and affinity for inorganic and organic pollutant sorption.32 Maghemite can exhibit high surface area when prepared in nano-sized form, with potential use as sorbent for different purposes, such as water decontamination. Moreover, high-surface area ‘two-lines’ ferrihydrite was chosen as adsorbent because it plays a substantial role in the sequestration of contaminants from groundwater due to its abundance in natural media.33
Materials and methods
Adsorbents synthesis and characterization
:1 parts of ferric and ferrous 1 M chloride solutions was prepared. By slowly adding 1 M NaOH solution, the pH was raised to 12 and the solution was then stirred for 24 hours. The synthesis was performed in a Jacomex glovebox under N2 atmosphere (<10 ppm of O2) with O2-free deionized water (18.2 MΩ cm; Milli-pore Milli-Q system and degassed by bubbling N2 for 45 min at 85 °C) to avoid Fe(II) oxidation, improving the yield and quality of the synthesized nano-particles. Final coprecipitate was centrifuged, washed three times and vacuum dried. A black fine powder was recovered and then heated at 200 °C for 18 h in open-air.8 A dark-brown powder was finally recovered.
ATR-FTIR measurements
A Bruker Vertex 80 spectrometer constantly purged with N2 gas and equipped with mercury cadmium telluride (MCT, liquid nitrogen) detector was used. It has to be noted that the detector is operational (and experiments are possible) up to 24 h after cooled down before being recharged with liquid nitrogen. Spectra were recorded in the rapid-scan mode with a 160 kHz speed and using the double-sided forward–backward interferogram recording. A flow-through horizontal attenuated total reflection (HATR) accessory from PIKE Technologies was used. The accessory is composed of a rectangular stainless-steel base, supplied with 10 reflections flat-long (70 × 10 × 4 mm) zinc selenide crystal (45° ZnSe), with a screwable metallic lid and two threaded-to-female Luer ports. Depending on the interface involved – varying between solid–liquid or solid–air-, background was differently collected by averaging 2000 scans. For static experiments, i.e. ex situ, the background spectrum was collected with the mineral substrate over the ZnSe crystal only. For dynamic experiments, i.e. in situ, the background was collected with the mineral substrate over the ZnSe crystal and with a constant aqueous flow circulating over it. For static measurements, samples were recorded with 2000 scans, while for dynamic experiments, kinetics was monitored by collecting 500 scans per minute and averaged by groups of 4 (i.e. 2000 scans total). Resolution was set at 4 cm−1 and data analysis was performed with Origin 2018 (OriginLab Corporation) and Python 3.10.11 open-source.Results
NAL and NAL− vibrational band assignments
ATR-FTIR spectra of solid-state NAL, aqueous state NAL(aq) (pH = 5 i.e. pH < pKa) and NAL−(aq) (pH = 9 i.e. pH > pKa) are shown in Fig. 2. These spectra provide valuable information about the molecular structure of protonated and deprotonated quinolone molecules and thus serve as a basis for further assigning vibrational bands of surface-bounded NAL species.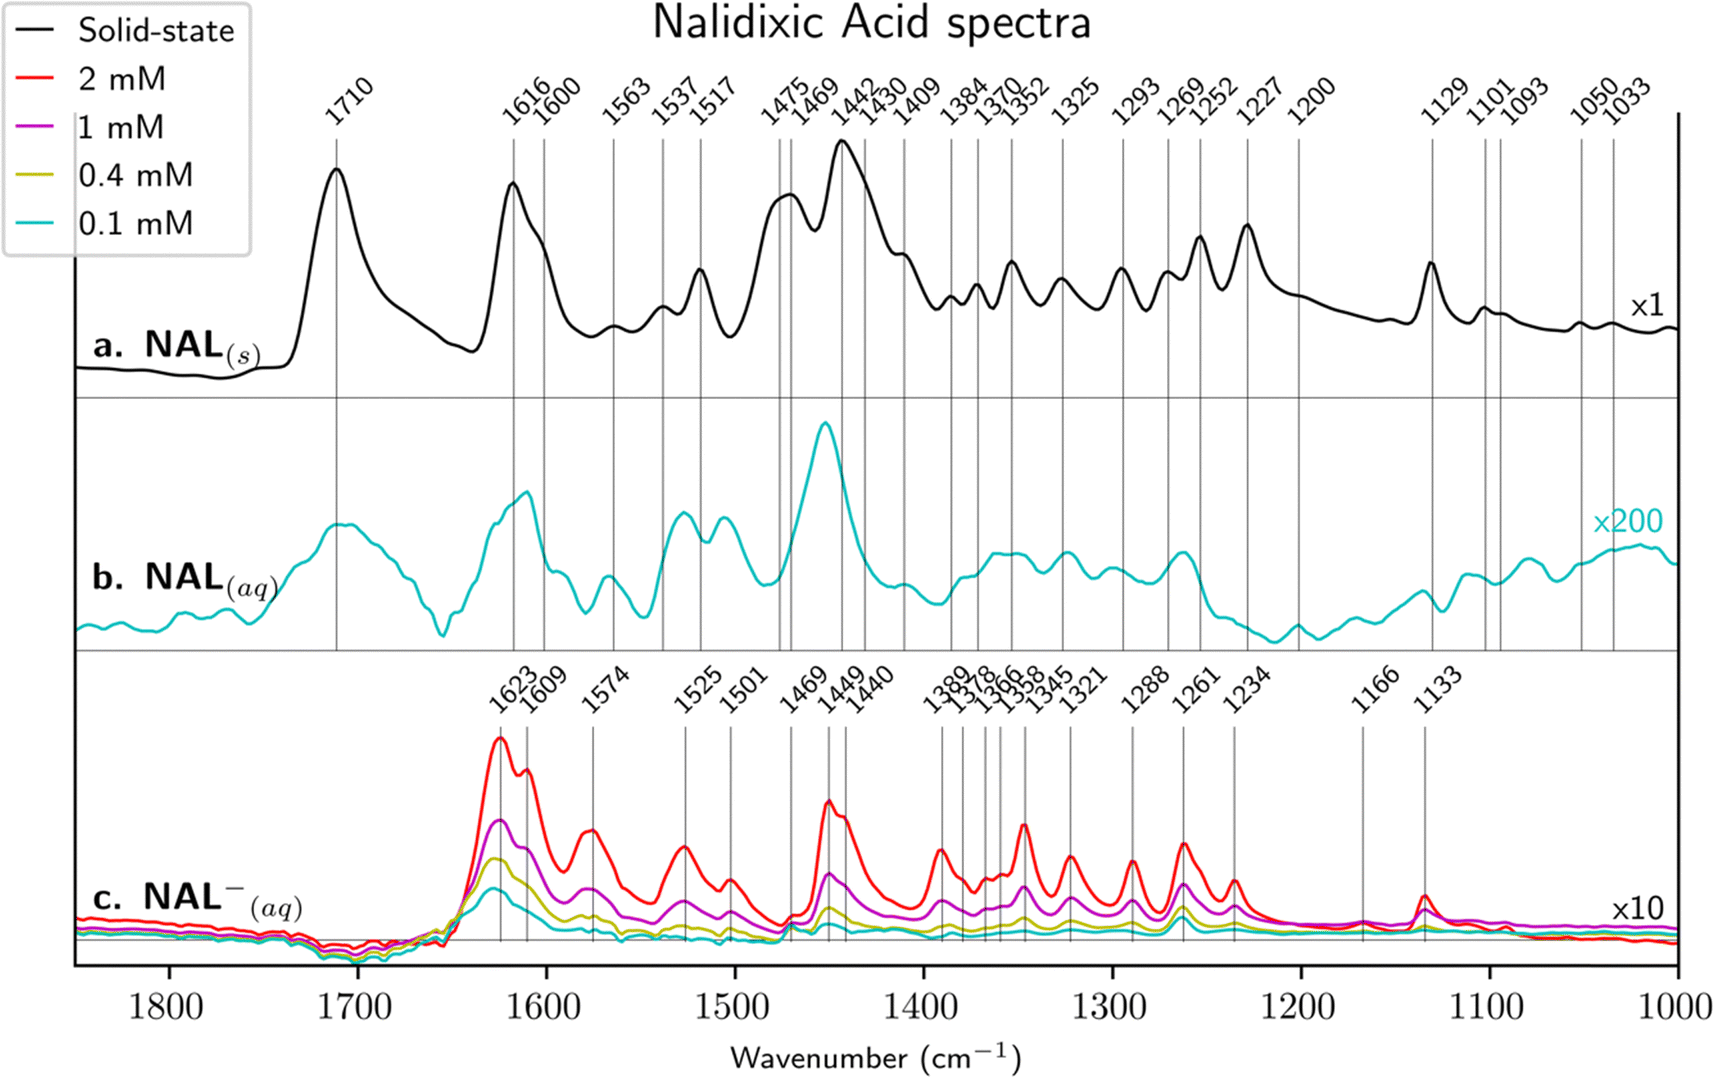 | ||
| Fig. 2 ATR-FTIR spectra of (a) solid-state nalidixic acid (NAL(s)), (b) aqueous nalidixic acid (NAL(aq), pH 5) and (c) aqueous nalidixate (NAL−(aq), pH 9). Aqueous species spectra have been magnified and vertically shifted for clarity. | ||
O) band assignments. For instance, bands at 1715–1712 cm−1 have been sometimes attributed to keto–carbonyl vibrational mode instead of carboxyl.1,22,50 Also, bands at 1620–1614 cm−1 have been occasionally wrongly attributed to νCC vibration of the aromatic rings instead of keto–carbonyl.1,22,24,50 DFT calculations show that each vibrational mode involves simultaneous movement of several atoms/bonds, which might explain literature discrepancies in their assignments. However, a better description of each vibrational mode is fundamental for further discussion.
| Experimental position [cm−1] | Assignment based on literature | Assignment based on DFT | |||
|---|---|---|---|---|---|
| NAL(s) | NAL(aq) | Vibrational mode | Range [cm−1] | Vibrational mode (the main bands involved for each mode are indicated) | DFT Position [cm−1] |
| 1710 | 1709 |
ν
CO carboxyl |
1720–170614,23,24,48,49,51–53 |
ν
C![[double bond, length as m-dash]](https://www.rsc.org/images/entities/b_char_e001.gif) O
carboxyl O
carboxyl
|
1736 |
| 1616 | 1610 |
ν
CO carbonyl |
1640–162048,51–53 |
ν
CO
carbonyl, δC–H1st ring |
1596 |
| 1600 | — | — |
ν
C–C
and ν
CN
rings
|
1585 | |
| 1563 | 1567 |
ν
CC
|
1560–154450,54 |
ν
CO
carbonyl, δC–H1st ring |
1560 |
| 1537 | 1526 |
ν
C–C
and ν
CN
rings
|
1522 | ||
| 1517 | 1505 |
ν
CC or νCN |
1518–151950,54 | δ O–H, ethyl, methyl, δC–H 2nd ring | 1478 |
| 1475 | 1483 | — | δ C–H ethyl | 1453 | |
| 1469 | — |
ν
CN
|
1470–147350,54 | Mainly δ O–H | 1443 |
| 1442 | 1451 |
ν
CN
|
144454 | δ C–H ethyl | 1440 |
| — | — | — | δ C–H methyl, ethyl | 1434 | |
| 1430 | — | — | δ C–H methyl, ethyl | 1433 | |
| — | — | — | δ C–H methyl | 1425 | |
| 1409 | — |
ν
CN
|
140950 | Delocalized | 1416 |
| 1384 | — |
δ
C–N–H or νCN |
1384–138550,54 | δ C–H ethyl | 1368 |
| 1370 | — | — | δ C–H mainly methyl | 1364 | |
| 1352 | — | δ C–N–H or νC–C | 135350,54 | δ C–H ethyl, methyl | 1358 |
| — | — | — | δ C–H ethyl, δC–H 1st ring | 1340 | |
| 1325 | — | ν C–OH | 132750 | 70% δC–H ethyl | 1335 |
| 1293 | — | ν C–OH and δC–OH | 1300–126048,50 | 70% δC–H ethyl | 1309 |
| 1269 | 1264 | Coupled mode νCOOH/δC–OH | 125818 | δ C–H 1st ring, 15% δO–H | 1267 |
| 1252 | — | δ CH | 1253–122850 | 70% ethyl | 1253 |
| 1227 | — | δ C–H 1st ring | 1230 | ||
| 1200 | — | — | δ C–H 2nd ring | 1212 | |
| — | — | — | δ OH, νC–COOH, δC–H 2nd ring | 1183 | |
| 1129 | — | δ C–CH asy and sy | 113054 | δ C–H rings, ethyl | 1132 |
| — | — | — | Torsion of the ethyl group and bending of C–H in rings | 1112 | |
| 1101 | — | δ C–CH or νC–C | 110250,54 | δ C–H rings, Ethyl | 1079 |
| 1093 | — | — | 70% δC–H ethyl | 1071 | |
| 1050 | — | δ C–CH asy and sy | 105150,54 | Delocalized | 1027 |
| 1033 | — | δ C–C–H or νC–C | 1035–102050,54 | δ C–H methyl | 1022 |
The strong peak at 1710 cm−1 in NAL(s) is attributed to CO carboxylic group stretching (i.e. νCO carboxyl). The equivalent DFT calculated value is 1736 cm−1 and a higher frequency is consistent since intermolecular interactions are not taken into account with DFT. The following experimental strong peak is centered at 1616 cm−1 in NAL(s), which is largely identified in literature as the stretching of the CO attached to the naphthyridine (i.e. νCO carbonyl). Our DFT calculations support this assignment, despite a downshift in the calculated wavenumber. This downshift can be due to the fact that in gas-phase, the OH from the carboxyl and the keto–carbonyl of NAL (see Fig. 1) have a strong intramolecular hydrogen bond OH–OC interaction inducing the formation of a particularly stable 6-membered ring. This interaction is probably somehow modified in solid-state NAL, due to the presence of intermolecular forces. Other bands and their proposed assignments are reported in Table 2.
The 0.1 mM NAL(aq) spectrum at pH 5 is displayed in Fig. 2b. It is important to remind that NAL solubility is limited in water at this pH (only 0.142 mM26), so that it was not possible to increase further the concentration in order to improve the signal-to-noise ratio. By comparing NAL(s) and NAL(aq), many similarities are observable, and band assignments are consistent with those summarized in Table 2. Among modest differences, we may mention that the keto–carbonyl stretching slightly downshifts from 1616 to 1610 cm−1. This and other shifts are likely to be ascribed to intermolecular interactions with surrounding water molecules.
The NAL−(aq) spectra at pH 9 for various concentrations are displayed in Fig. 2c and peak positions and assignments are summarized in Table 3. The alkaline conditions (pH > pKa) lead to deprotonation of the carboxylic acid, inducing structural changes and favoring a resonance-stabilized structure as well as a much higher solubility (about 0.1 M26). As previously, band assignments have also been compared with literature data and with results obtained from DFT calculations. The most intense calculated bands (DFT) have been highlighted in bold in Table 3 and the experimental spectra are compared to calculated band positions and intensities in Fig. S3 in ESI.† It is important to note that, to the best of our knowledge, only partial assignment18,23 has been provided for nalidixate in the literature up to now.
| Experimental position [cm−1] | Assignment based on literature | Assignment based on DFT | ||
|---|---|---|---|---|
| NAL−(aq) | Vibrational mode | Range [cm−1] | Vibrational mode | DFT Position [cm−1] |
| 1623 |
ν
CO carbonyl |
1640–162018,23,49,55,56 |
ν
CO
carbonyl, νCOO−as |
1650 |
| 1609 | — |
ν
CO
carbonyl, νCOO−as |
1614 | |
| 1574 | ν COO− as | 1586–157814,18,23,48,49,53,55,56 | ν C–C 1st ring, νC–H | 1574 |
| 1525 | ν C–C | ∼1540–152818,23,49,56 |
ν
C–C
and ν
CN
2nd ring, δC–H |
1554 |
| 1501 | ν C–C or δC–H | ∼1500–149818,23,49 |
ν
C–C and νCN rings |
1523 |
| 1469 | ν C–C | ∼147049 | δ C–H ethyl | 1454 |
| 1449 | ν C–C or δC–H | 144823 | δ C–H ethyl | 1450 |
| — | — | δ C–H ethyl | 1438 | |
| 1440 | — | δ C–H ethyl, methyl | 1436 | |
| — | — | δ C–H ethyl, methyl | 1429 | |
| — | — | δ C–H methyl | 1426 | |
| 1389 | ν COO− s | 1395–138014,18,23,48,49,53 | δ C–H ethyl, δC–H2nd ring | 1412 |
| 1378 | — | δ C–H methyl and ethyl | 1360 | |
| 1366 | — | δ C–H methyl | 1357 | |
| 1358 | — | δ C–H ethyl | 1351 | |
| 1345 | — | δ C–H 1st ring | 1339 | |
| 1321 | — | δ C–H ethyl | 1320 | |
| 1288 | δ NH+, δCOO− | 1300–129048 | δ C–H ethyl | 1289 |
| 1261 | — | ν COO − s, νC–C | 1276 | |
| 1234 | — | δ C–H ethyl, methyl | 1268 | |
| — | — | δ C–H 1st ring | 1225 | |
| — | — | δ C–H 2nd ring | 1211 | |
| 1166 | — | δ C–H both rings | 1194 | |
| 1133 | — | δ C–H 2nd ring | 1116 | |
Deprotonation of NAL leads to the formation of a carboxylate moiety (COO−) resulting in the absence of the carboxyl (COOH) centered at 1710 cm−1. In some previous studies (see Table 3), bands assigned to the carboxylate group are located at about 1580 and 1390 cm−1 for the carboxylate asymmetric and symmetric stretching modes respectively. However, DFT calculations performed in the present work disagree in part with those assignments. Asymmetric stretching of the carboxylate is found to contribute to both 1650 and 1614 cm−1 bands, while the symmetric stretching is found to contribute to the 1276 cm−1 band. In this scenario, both bands reflecting the asymmetric stretching overlaps with the position classically identified in the literature18,23,49,55,56 to the stretching mode of the keto–carbonyl (at 1623 cm−1). This discrepancy can be explained by the conjugation of the carboxyl and carbonyl moieties in the quinolone molecule, so that the 1623 and 1609 cm−1 bands (1650 and 1614 cm−1 in DFT calculations) both reflect contributions from the carbonyl CO and the COO− asymmetric stretching. In contrast, the symmetric COO− stretching mode found at 1276 cm−1 with DFT can be correlated to the experimental bands at 1288 or 1261 cm−1 (see Fig. S3, ESI†). However, Fig. 3 (see below) shows that the relative intensity of the band at 1262 cm−1 is strongly modified after NAL− adsorption, which suggests an implication of this vibrational mode upon adsorption. Consequently, the band at 1261 cm−1 for NAL−(aq) in Table 3 is assigned to the symmetric COO− stretching mode. Another important band to mention is the one centered at 1449 cm−1, which is known to remain stable under pH modification and consequently has been commonly used for spectra normalization in the literature.23,24 Previous works18,23 have assigned this band to ring stretching or C–H bending. Present DFT calculations suggest that the band at 1449 cm−1 is due to a bending mode of the ethyl group.
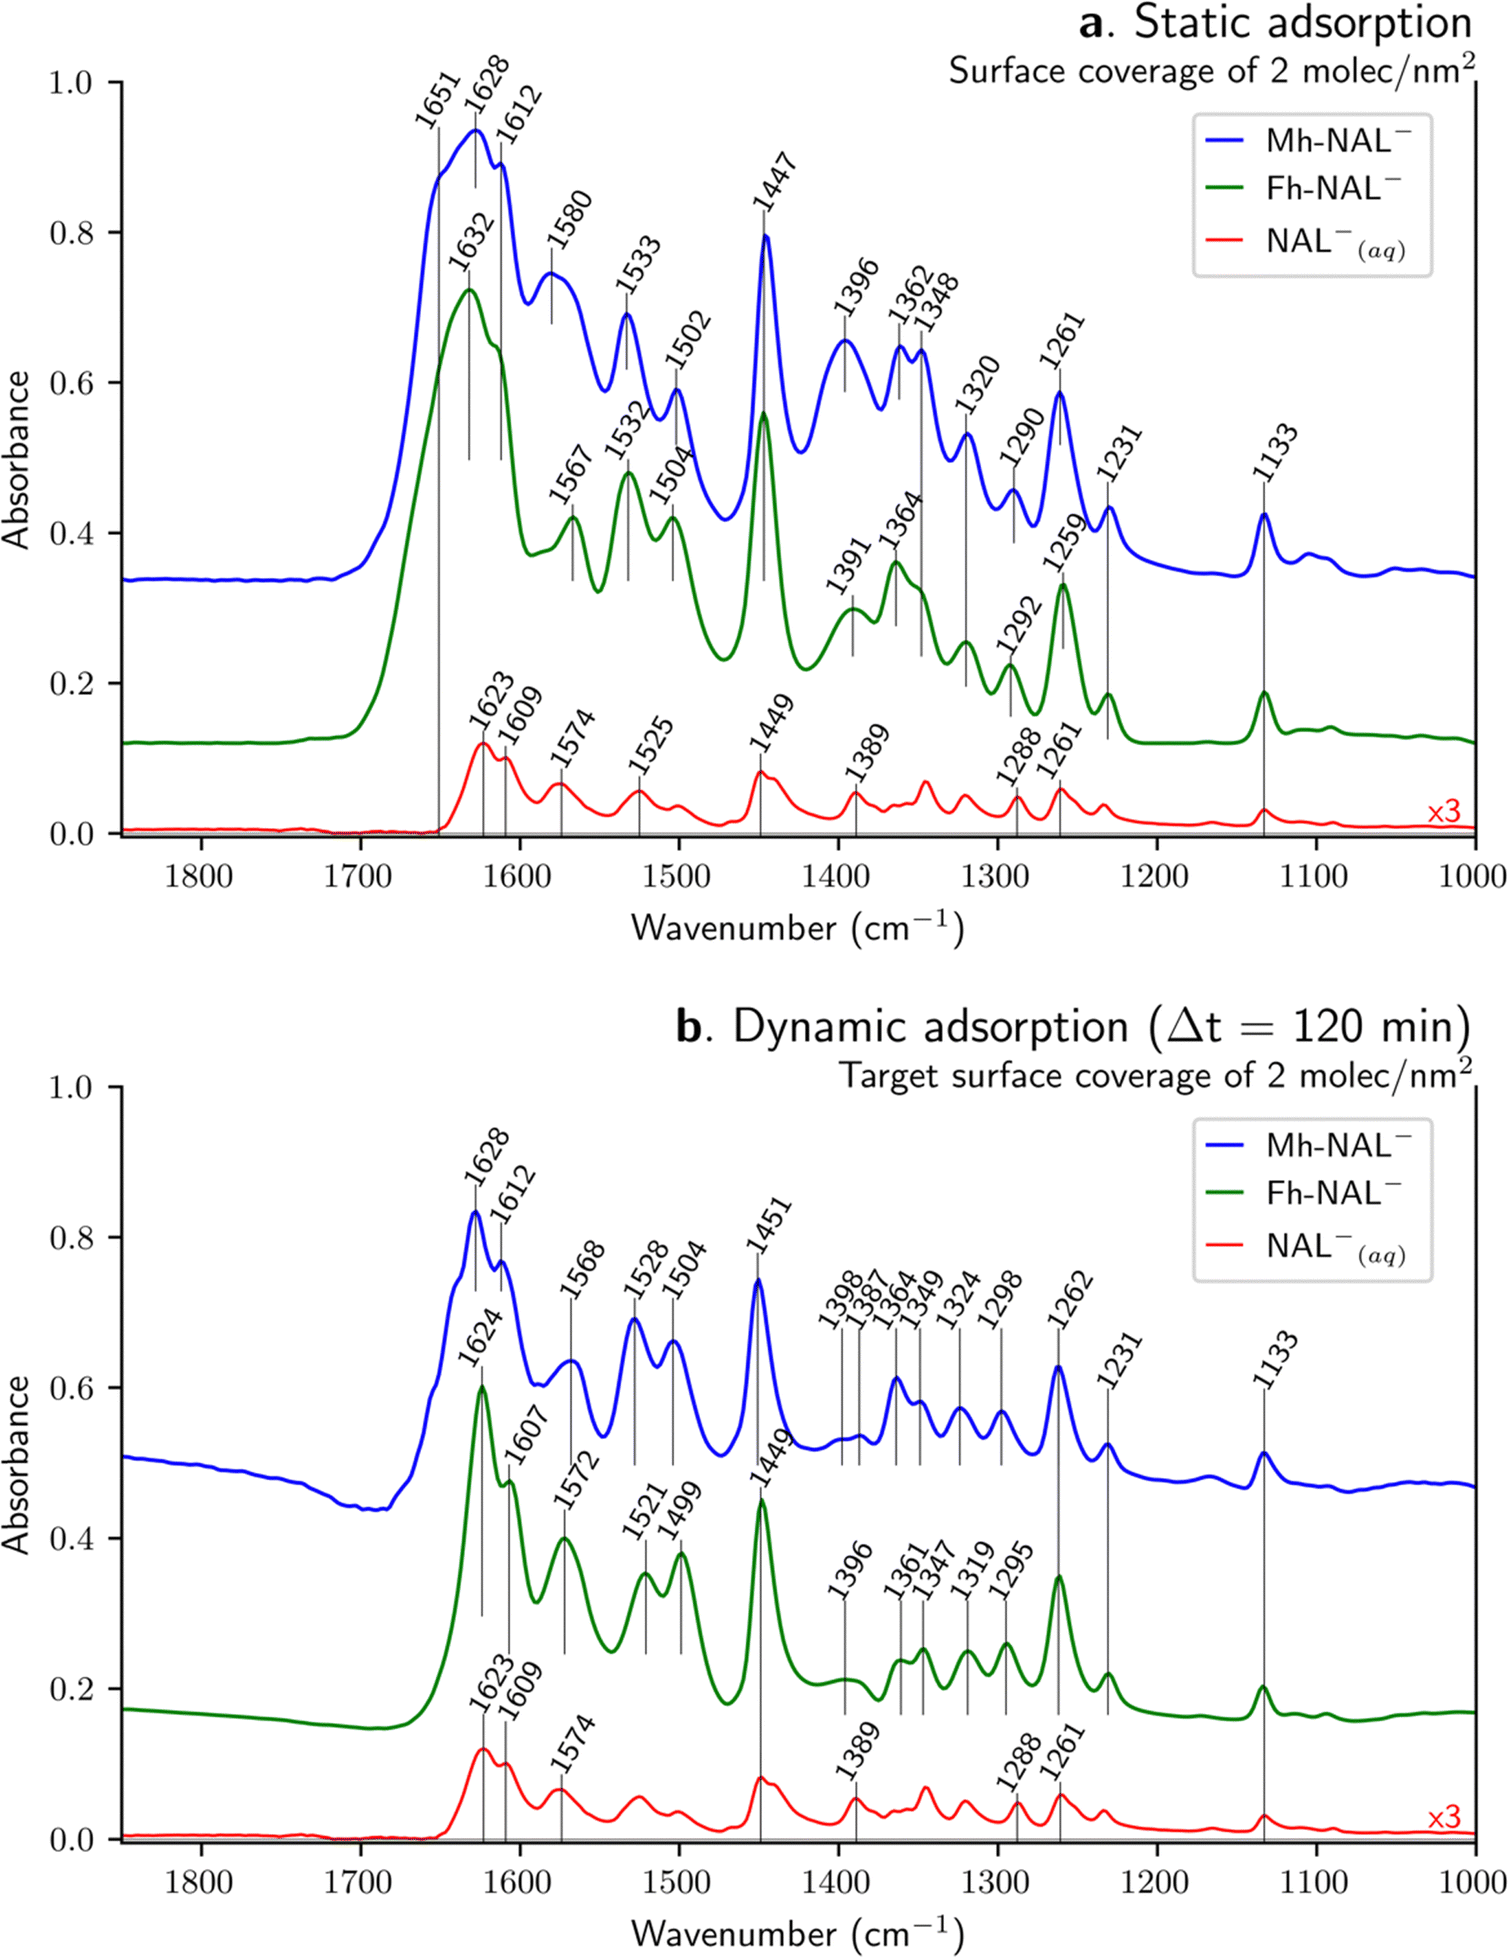 | ||
| Fig. 3 ATR-FTIR spectra for adsorbed NAL onto Mh and Fh (at neutral pH) compared to NAL−(aq) stock solution (2 mM with pH 9). The target surface loading of NAL is 2 molecules nm−2 performed via (a) static and (b) dynamic (after 120 minutes circulating) approaches. NAL spectra sorbed on Mh are normalized with respect to Fh with the intensity of the peak at about 1450 cm−1. Spectra have been vertically shifted for clarity. | ||
Sorbed NAL vibrational band assignments
IR spectra of sorbed NAL onto Mh and Fh surfaces are displayed in Fig. 3. In order to normalize the spectra of the sorbed species, we have used the 1450 ± 3 cm−1 band, which is mainly due to δC–H of the ethyl group (as suggested by DFT calculations). In this comparison, different interfaces are probed, solid–air (air-dried samples) for the static approach (Fig. 3a) and solid–liquid (aqueous conditions) for the dynamic one (Fig. 3b). In both cases, sorbed spectra are compared to the spectrum of the NAL−(aq) stock solution, which has been only multiplied 3-fold for clarity (not normalized). The intensity of the different spectra illustrates the surface-sensitivity of the ATR-FTIR technique. The intensity of IR bands assigned to the NAL− species present considerably higher intensities when adsorbed than when dissolved in aqueous media (i.e. NAL−(aq)) despite a lower number of molecules present in the HATR cell for the solid samples. For instance, by comparing Fh-NAL− with NAL−(aq) the respective amount of quinolone varies from 2.2 μmol (16.1 mL of 0.136 mM solution) to 3 μmol (1.5 mL of a 2 mM solution). The difference in intensity between the sorption results and the NAL−(aq) arises mainly from the concentration of the adsorbed species on the absorbent layer deposited on the ATR crystal.O carbonyl) but according to our DFT calculations, this vibration is coupled with asymmetric stretching of the carboxylate as already discussed. Therefore, this band arises both from the keto–carbonyl stretching and from the asymmetric stretching of the carboxylate (i.e. νCO carbonyl and νCOO− as). The shoulder at 1609 cm−1 observed in the NAL−(aq) is present after static sorption but slightly upshifted to 1612 cm−1 on both substrates. At higher wavenumbers, a shoulder arises around 1650 cm−1 during adsorption – more evidenced at Mh than in Fh-, which can also be observed in other sorption study18 but is not discussed. As far as the 1574 and 1389 cm−1 band are concerned – identified in literature as carboxylate vibrational modes (see Table 3) –, they shift to 1580 and 1396 cm−1 for Mh-NAL− and to 1567 and 1391 cm−1 for Fh-NAL−. Modifications of the asymmetric carboxylate band is explained by a distortion of the carbon angle (i.e. C–O bond lengths), which depends on the absorbent involved and might upshift and downshift48,57 or even not be affected by adsorption.23 Differences concerning the symmetric carboxylate band suggest molecular interaction of this group with surface hydroxo-groups with various hydrogen-bonds strengths, leading to an inhomogeneous band broadening,23 while the upshifts can be attributed to the formation of a surface bonded complex.49,58 However, it was detailed above that our DFT calculations on isolated NAL− disagree with these assignments (1574 cm−1 for νCOO− as and 1389 cm−1 for νCOO− s). DFT calculations suggest that the asymmetric carboxylate stretching for NAL− is at 1623 and 1609 cm−1 while the symmetric COO− stretching is at 1261 cm−1. Thus, once adsorption takes place, the asymmetric COO− bands upshifts to 1628–1612 cm−1 for Mh-NAL− and to 1632–1612 cm−1 for Fh-NAL−, while the symmetric band is weakly affected. In this scenario, the asymmetric COO− bands might upshift upon carbon angle distortion, as already pointed out, while being simultaneously affected by possible H-bonding involvement due to the conjugated keto–carbonyl stretching mode. Following DFT calculations, the bands previously assigned to νCOO−(as) and νCOO−(s) at around 1580 and 1390 cm−1 are reassigned to C–C and C–H stretchings as well as C–H bending, coming mainly from the rings and might upshift due to complexation. Lastly, concerning the CC ring stretching mode, the shift from 1525 cm−1 to 1533 or 1532 cm−1 band for NAL− species when adsorbed, can be attributed to variations of the electronic distribution in the NAL molecule upon surface complexation.23,24
Time-course evolution of the sorbed NAL− species in dynamic mode
The adsorption of NAL− on Mh and Fh were followed in situ by time-resolved FTIR spectroscopy. The results shown previously (in Fig. 3b) are the final spectra collected after 120 minutes of circulating flow. However, more information might be acquired by following their sorption over time as shown in Fig. 4.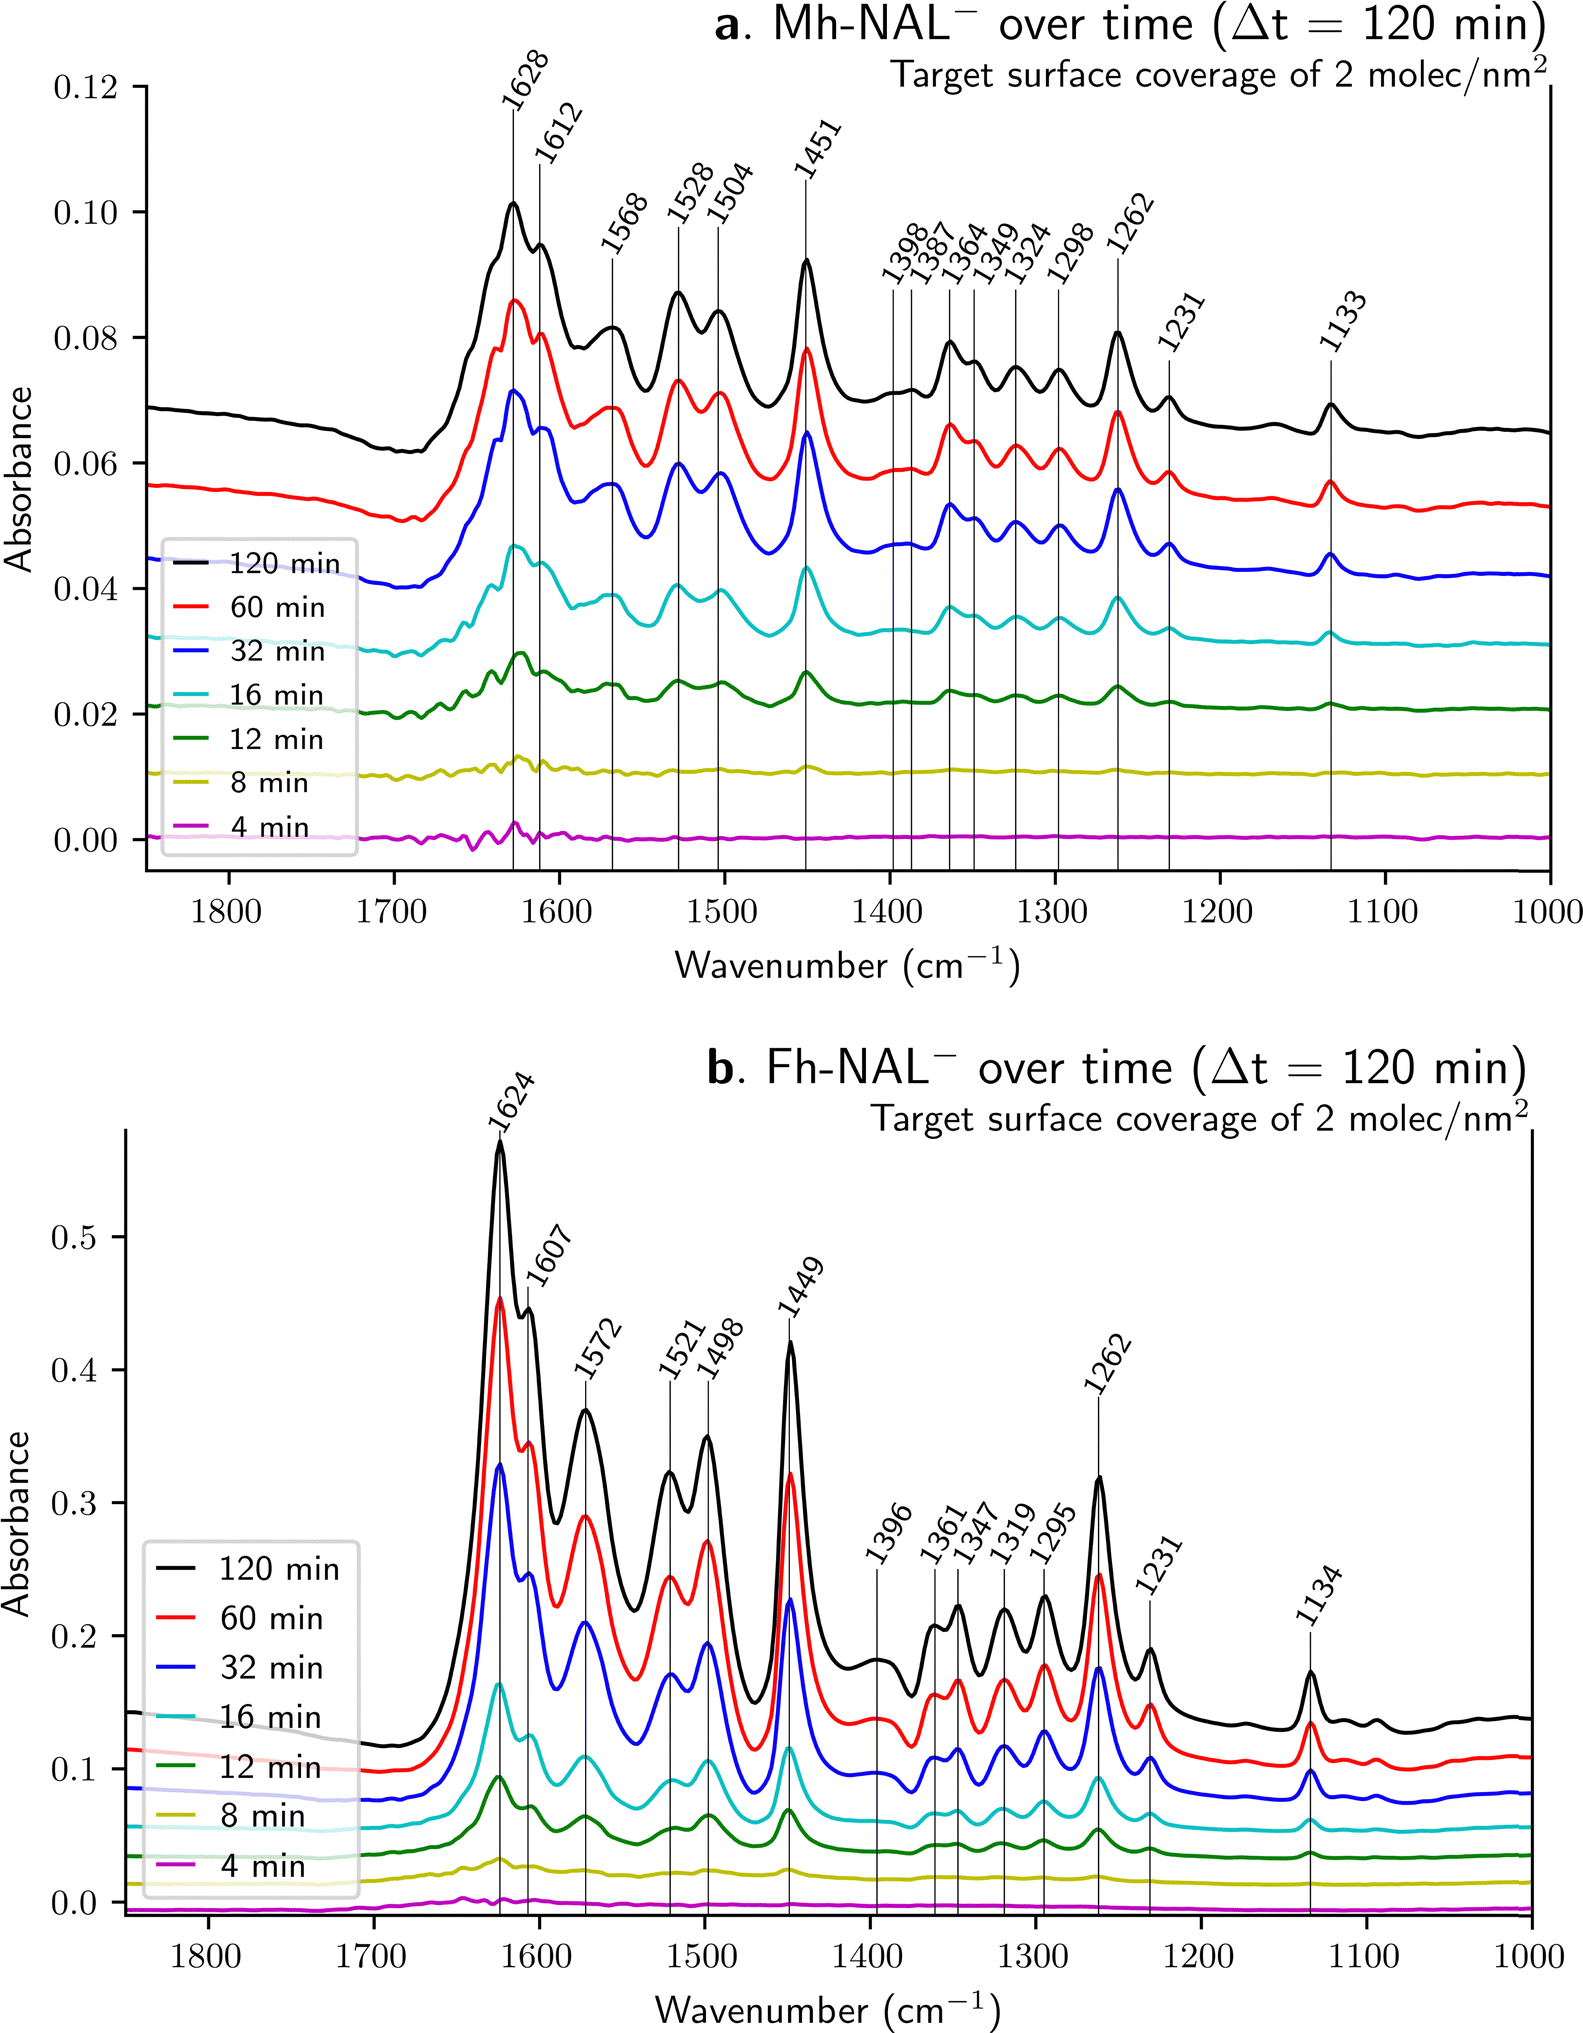 | ||
| Fig. 4 Temporal evolution of the dynamic adsorption using ATR-FTIR spectra of NAL onto (a) Mh and (b) Fh with initial circulating concentrations of 0.026 and 0.137 mM and a final pH of 6.3 and 6.9 after equilibrium respectively. Spectra have been vertically shifted for clarity and no normalization has been performed. | ||
Fig. 5 illustrates the progressive NAL− sequestration at the sorbent surface by plotting the relative intensity of target bands as a function of time (details on the calculation of peak intensities are provided in ESI,† as well as detailed numerical values concerning the fitting – shown as dashed lines in Fig. 5).
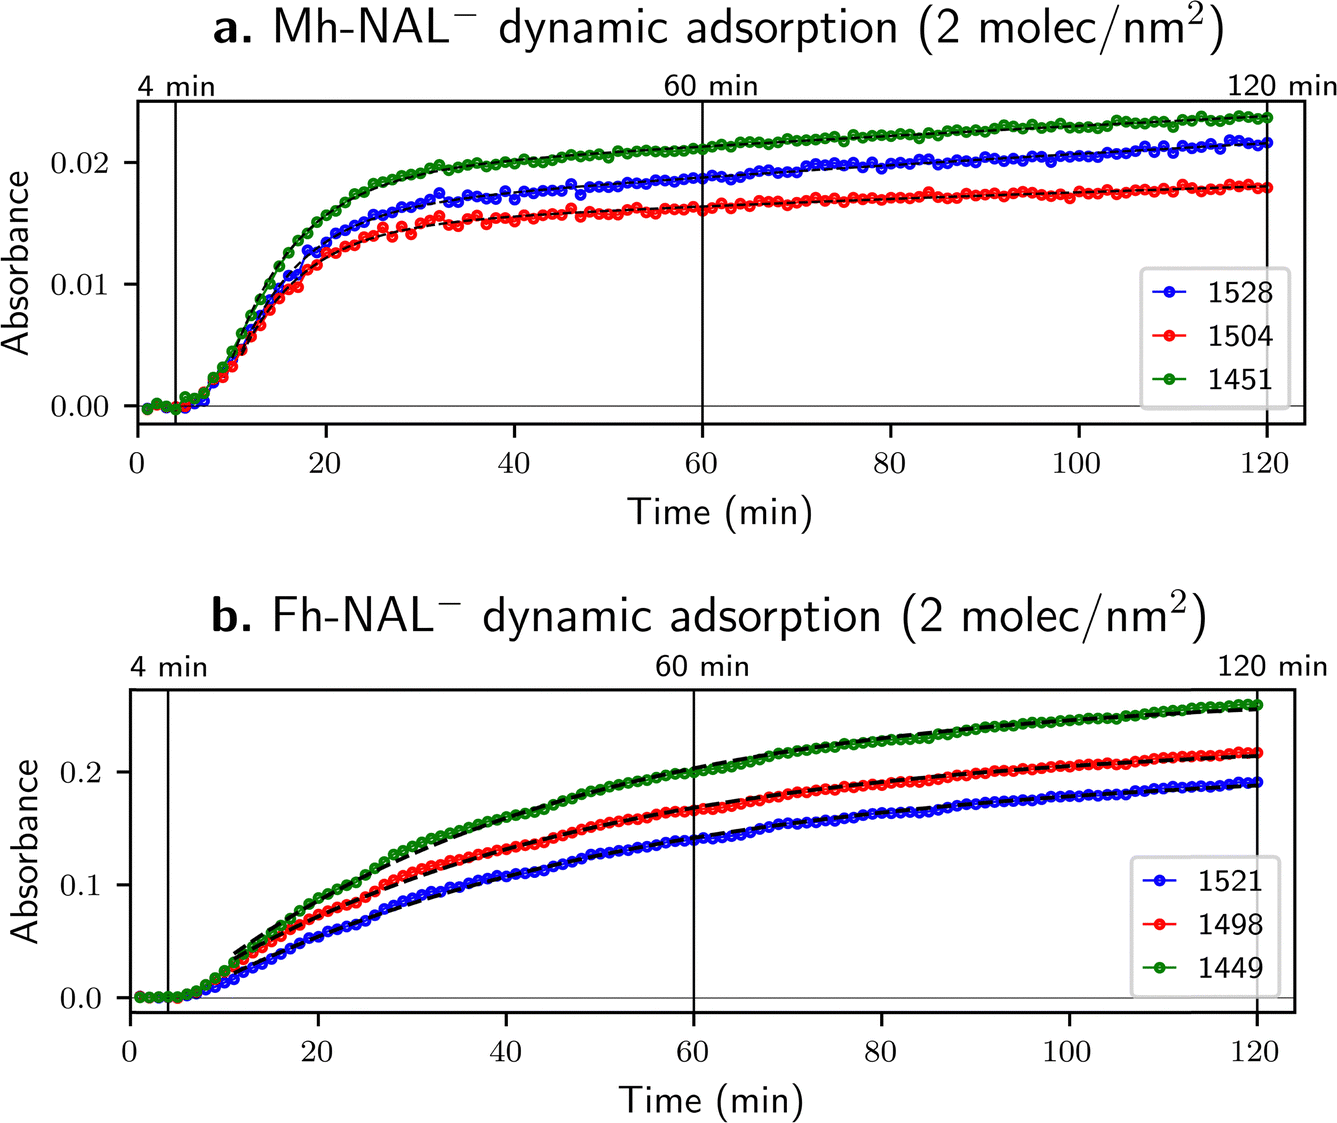 | ||
| Fig. 5 Kinetics extracted from ATR-FTIR spectra for dynamic sorption of NAL−(aq) onto (a) Mh and (b) Fh at a target surface coverage of 2 molecules nm−2 for three individual bands. Absorbance data were extracted and fitted with exponential functions (dashed lines) in a 10–120-minute window (more details available in ESI†). | ||
Bands at 1525 ± 4, 1500 ± 4 and 1450 ± 1 cm−1 have been chosen because they are related to the quinolone ring (see Table 3) and thus are considered as related to vibrations involving chemical moieties far from adsorption sites.
A major difference among Fig. 5a and b is the order of magnitude of absorbance, being about 10 times higher for Fh than for Mh. Since the target surface coverage is the same (2 molecules nm−2) the main variable is the iron substrate involved. ATR-FTIR spectroscopy relies on optical properties of the material under study and Fig. 5 show that Fh is more transparent than Mh. This can be explained either by a porosity effect or a refractive index difference – nFh is about 2.3 while nMh is about 2.6 (see Table 1). Total reflection, the basis of ATR spectroscopy, occurs when light traveling through a medium with a higher refractive index hits the boundary of a medium with a lower refractive index at an angle greater than the critical angle, resulting in all the light being reflected into the original medium. In other words, the nIRE must be superior to nsample to guarantee the formation of an evanescent wave and probe the interface of interest. Since nZnSe is a constant in our set-up with a value of 2.4, when nsample increases the measurement might be globally attenuated – less light is reflected – and consequently less interface with the substrate is probed, which explains a lower absorbance for Mh.
In the case of NAL− adsorption onto Mh surface, bands at 1528, 1504 and 1451 cm−1 (Fig. 5a) can be smoothly fitted with a biexponential kinetic function, meaning that data can be model with two different time constants, which suggests the presence of two different adsorption sites. Changes in band intensities imply rapid adsorption on one site and slower adsorption on another one. The variations in relative intensities for the bands at 1528 and 1504 cm−1 for the sample on Fig. 4a are in agreement with this hypothesis. The intensity of the two bands is almost identical for the 12-minute spectrum (green line) while the band at 1528 cm−1 is more intense for the 120-minute spectrum (black line). This change also suggest that these two bands follow two slightly different kinetics, which would be in agreement with the presence of two binding sites in competition. In the same spirit, Fig. 4a shows that the band at about 1390 cm−1 for pure NAL−(aq) (Fig. 2c) splits into two bands at 1398 and 1387 cm−1 once NAL is sorbed onto Mh under the dynamic approach suggesting also the existence of two sorption sites.
Conversely, for NAL− adsorbed on Fh, the evolution of bands at 1521, 1498 and 1449 cm−1 (Fig. 5b) can be properly fitted both by a monoexponential or by a biexponential function since the adjusted R2 values are very close for both functions (see ESI†). However, no clear changes in relative intensity of bands can be seen from the spectra shown in Fig. 4b. Therefore, it may be concluded that progressive NAL adsorption onto Fh likely occurs through a single adsorption site, or, if more than one adsorption site is present, they all show similar adsorption kinetics.
Discussion
NAL− binding modes as derived from ATR-FTIR band assignment
Information on the binding mode of sorbed molecules can be extracted with IR spectroscopy since a modification of peak positions is observed with respect to the molecules in solution.10 Carboxylate stretching modes are very informative in this respect. Table 4 summarizes their peak positions with different assignments already discussed above.| Carboxylate assignments via literature (Table 3) | Carboxylate assignments with DFT calculations (this work, Table 3) | ||||||
|---|---|---|---|---|---|---|---|
| ν COO− as, cm−1 | ν COO− s, cm−1 | ΔνCOO−, cm−1 | ν COO− as, cm−1 | ν COO− s, cm−1 | ΔνCOO−, cm−1 | ||
| DFT calculated | NAL− | — | — | — | 1650 | 1276 | 374 |
| 1614 | 338 | ||||||
| Solution | NAL−(aq) | 1574 | 1389 | 185 | 1623 | 1261 | 362 |
| 1609 | 348 | ||||||
| NAL sorption via Static approach | Mh-NAL− | 1580 | 1396 | 184 | 1628 | 1261 | 367 |
| 1612 | 351 | ||||||
| Fh-NAL− | 1567 | 1391 | 176 | 1632 | 1259 | 373 | |
| 1612 | 353 | ||||||
| NAL sorption via dynamic approach | Mh-NAL− | 1568 | 1398 | 170 | 1628 | 1262 | 366 |
| 1387 | 181 | 1612 | 350 | ||||
| Fh-NAL− | 1572 | 1396 | 176 | 1624 | 1262 | 362 | |
| 1607 | 345 | ||||||
Surface complexes from carboxylate-containing molecules are usually forming either monodentate or bidentate structures. A way to interpret binding mode of acetate groups in pure metal acetate was first proposed by Nakamoto.59 This method is based on assessing the difference between the asymmetric and symmetric carboxylate stretching modes for surface complexes, noted as Δν, and now largely used in literature to determine molecular binding mode.5,59,60 By following this methodology, if Δν carboxylates for surface complexes is substantially greater than for the free anion (ΔνMe–COO > ΔνCOO−), it is suggested that one oxygen of the carboxylate binds to one surface site as a monodentate complex.48,59,60 If the contrary happens (ΔνMe–COO < ΔνCOO−), it is suggested that two oxygens bind to one surface site as a bidentate chelate.48,59 Lastly, if Δν remains similar, it is suggested that two oxygens bind to two surface sites as a bridging bidentate complex. Fig. 6 illustrates the possible binding modes for NAL onto iron(oxy)(hydr)oxides via carboxylate group attachment involving also potential additional hydrogen bonding discussed in the text.
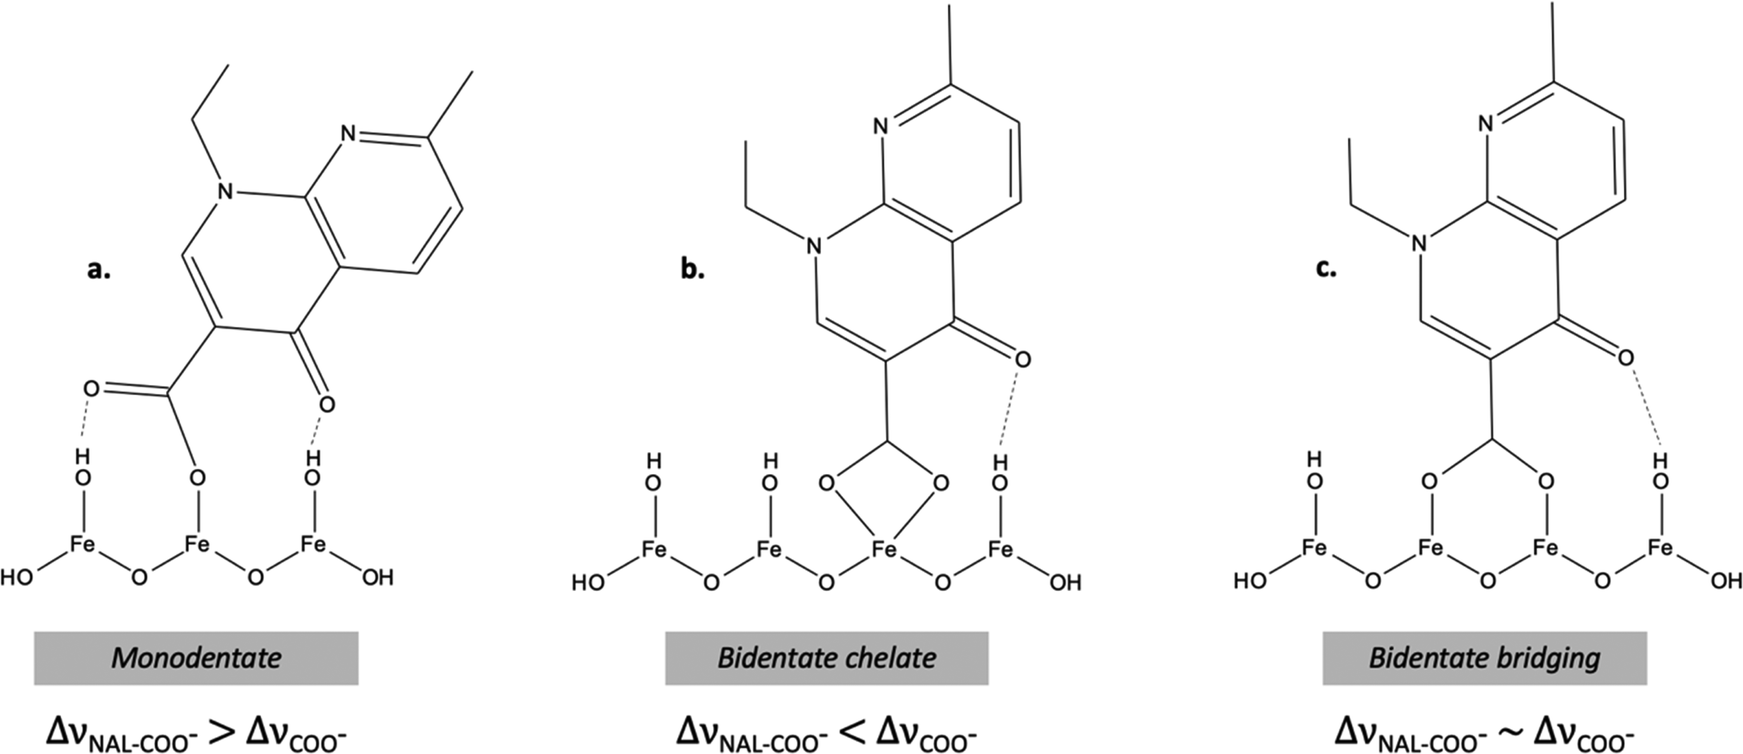 | ||
| Fig. 6 Possible binding modes for NAL sorbed onto iron oxides via carboxylate attachment. Using only one iron site as a (a) monodentate or a (b) bidentate chelate or using two surface sites as a (c) bidentate bridging mode. Potential additional hydrogen bonding is also shown. These models are suggested based on literature data for quinolones adsorption.1,23,49 | ||
It is noteworthy that there is no consensus on the definitive value from which Δν can be considered similar for the surface complex and the free anion. Trivedi and Vasudevan noted as ΔνMe–COO ≃ ΔνCOO− when the difference was equal or below 5 cm−1, under the argument that 5 wavenumber units is not statistically significant.48 Results using this methodology from published literature (obtained by ATR-FTIR spectroscopy on wet-pastes recovered from batch experiments) of NAL and ciprofloxacin (CIP, another quinolone) sorbed on Goethite (Gt) – the most abundant iron form in nature – and Magnetite (Mt) are summarized in Table 5.
| Absorbent–absorbate | pH | Free carboxylate | Substrate–quinolone complexed | Result | ||||
|---|---|---|---|---|---|---|---|---|
| ν COO− as | ν COO− s | ΔνCOO− | ν NAL–COO− as | ν NAL–COO− s | ΔνNAL–COO− | |||
| Gt-NAL18 | 7 | 1583 | 1394 | 189 | 1583 | 1387 | 196 | ΔνNAL–COO− > ΔνCOO− |
| Gt-NAL23 | 4–6 | 1578 | 1392 | 186 | Not affected by adsorption | Not marked | Not marked | ΔνNAL–COO− > ΔνCOO− |
| Gt-CIP48 | 6 | 1577 | 1381 | 196 | 1534 | 1384 | 150 | ΔνCIP–COO− < ΔνCOO− |
| Gt-CIP14 | 6 | 1577 | 1390 | 187 | 1572 | 1391 | 181 | ΔνCIP–COO− < ΔνCOO− |
| Mt-CIP53 | 4–8 | 1580 | 1385 | 195 | 1577 | 1390 | 187 | ΔνCIP–COO− < ΔνCOO− |
Cheng and co-workers18 presented results for NAL adsorbed on Gt where Δν increases upon binding which suggests a monodentate coordination following literature (ΔνNAL–COO− > ΔνCOO−). The authors suggested that the keto-group (i.e. the ketone group from the quinoline ring) is involved in the bonding mode either through a direct chemical bond with surface iron atoms or through hydrogen bonding such as that shown in Fig. 6a in agreement with other works.49,58 Overall, the involvement of the keto-group is usually suggested in literature when the band attributed to CO of the carbonyl blueshifts upon adsorption, which is the case for Cheng and co-workers.18 The same group23 had previously reached the same conclusion for NAL on Gt but the exact band position was not reported for the symmetric carboxylate mode as well as for ΔνNAL–COO−.
Table 5 also reports results obtained with another quinolone-type antibiotic, the Ciprofloxacin (CIP). Trivedi and Vasudevan,48 Gu and co-workers14 and Rakshit et al.53 show that Δν decreases upon CIP adsorption which suggests a bidentate chelate adsorption mode (ΔνCIP–COO− < ΔνCOO−). The only difference in their conclusions is coming from the potential involvement of the keto-group. Trivedi and Vasudevan48 suggest that the band shift of the carbonyl band is driven by the electron withdrawing nature of the ortho carboxylate–iron bond, while Gu and co-workers14 on Goethite and Rakshit et al.53 on Magnetite suggest that the band widening and shifting is the signature of the involvement of the keto-group in the surface complex (see Fig. 6c for NAL). It is noteworthy that the involvement of two functional groups of quinolones onto the surface coordination might explain its high affinity.53
Experimental data from the present work are summarized in Table 4. Two approaches are possible regarding the carboxylate binding mode, whether one considers the carboxylate peak assignment often reported in the literature (i.e. νCOO− as = 1574 cm−1 and νCOO− s = 1389 cm−1 for NAL−(aq) species free in solution) or the DFT calculations discussed above (i.e. νCOO− as = 1650 and 1614 cm−1 and νCOO− s = 1276 cm−1 for gas-phase NAL−).
In the first case, based on the carboxylate peak assignment often reported in the literature, ΔνCOO− is 185 cm−1 for the reference NAL−(aq). Experimental data for Mh under the static (dried) approach provide a Δν very close to the reference (184 cm−1 instead of 185 cm−1) while, when hydrated (dynamic approach), some ambiguity arises from the fact that peak assigned as νCOO− symmetric is very low in intensity and splits in two bands as previously discussed. It is proposed to follow the Δν with both positions leading to Δν of 170 and 181 cm−1. If this is the case, the former suggests a bidentate chelate (ΔνNAL–COO− < ΔνCOO−) while the second a bridging bidentate (ΔνNAL–COO− ≃ ΔνCOO−) – which agrees with the kinetic results suggesting that two sorption sites exist for Mh. Experimental data for Fh provided the same Δν of 176 cm−1 for both approaches (static or dynamic), suggesting a bidentate chelate surface complex (ΔνNAL–COO− < ΔνCOO−).
The alternative way to interpret values in Table 4 relies on peak assignment based on DFT calculations, where the COO− asymmetric stretching mode is conjugated with the carbonyl, appearing at higher frequencies, simultaneously at 1650 and 1614 cm−1 for the gas-phase NAL while the symmetric mode is centered at 1276 cm−1, giving a theoretical Δν of 374 cm−1 or 338 cm−1 depending on the peak chosen for the asymmetric mode. When it comes to solvated NAL−(aq), values are slightly downshifted – which is understandable since DFT is not explicitly considering the solvent – leading to a Δν of 362 cm−1 or 348 cm−1. Under the static (dried) approach, sorption onto Mh leads to a Δν of 367 cm−1 and 351 cm−1, which is very similar to NAL−(aq) and consistent with a bridging bidentate sorption complex previously discussed. In contrast, sorption onto Fh leads to a Δν of 373 cm−1 and 353 cm−1. From this, it is more difficult to draw a definite conclusion since the former suggests a monodentate (ΔνNAL–COO− > ΔνCOO−) while the second a bridging bidentate (ΔνNAL–COO− ≃ ΔνCOO−). Under the dynamic approach, Δν of 366 cm−1 and 350 cm−1 for Mh and 362 cm−1 and 345 cm−1 for Fh are found, which are similar to NAL−(aq) and indicate a bidentate bridging mode (ΔνNAL–COO− ≃ ΔνCOO−) for both substrates. Hence, all these results show that the Nakamoto59 methodology does not allow one to discriminate binding modes without any ambiguity based on the DFT assignments presented in this work.
Overall, the spectroscopic approach followed in this work points, predominantly, to the possible existence of two sorption modes for the aqueous nalidixate ion: a bidentate chelate and a bidentate bridging mode depending on the substrate (Maghemite and Ferrihydrite) and the interface considered (solid/air or solid/liquid). Two approaches have been considered by using the Nakamoto59 methodology based on the asymmetric and symmetric carboxylate stretching modes. These approaches differ in the assignment of the carboxylate modes whether literature data or DFT calculations performed in this work are considered. However, a bidentate mode appears to be predominant and a monodentate adsorption can be mostly excluded which is at variance with the results of Cheng and co-workers18 and Xu et al.23 on goethite. The existence of two adsorption modes for Maghemite (Mh), bidentate chelate and bridging bidentate, is also in line with the hypothesis that two sorption sites are present for this oxide.
Conclusions
Continuous-flow FTIR-ATR spectroscopy provides a real-time, in situ, monitoring of nalidixate (NAL−) adsorption on iron oxy-hydroxides, Maghemite (Mh) and Ferrihydrite (Fh), at the oxide water interface highlighting the critical role of surface hydration. A complete band assignment for nalidixic acid and nalidixate is discussed based on literature results and DFT calculations. The experimental results suggest that the nalidixate ion (NAL−) adsorbs onto maghemite and ferrihydrite surfaces via a bidentate mechanism mostly excluding monodentate adsorption. However, these result does not permit to fully conclude on the prevalence of the two bidentate sorption modes: bidentate chelate versus bidentate bridging. Nevertheless, the temporal evolution of IR spectra on Mh suggests the existence of two sorption sites: (i) band broadening (1628 cm−1), (ii) band splitting (1390 cm−1) and (iii) kinetic fitting (biexponential function). Hence, the two sorption modes (bidentate chelate and bidentate bridging) on two different sorption sites could coexist for Mh while only one sorption site is identified for Fh.This study advances our molecular-level comprehension of NAL adsorption, demonstrating the potential of iron oxides in environmental remediation applications. The information gained could help in the development of more effective strategies for mitigating pharmaceutical contamination in natural water systems, emphasizing the environmental relevance of iron oxides in contaminant sequestration.
Data availability
The data supporting this article (XRD characterization, full set of IR spectra of the time-resolved adsorption experiments – dynamic approach as well as kinetic fitting data), have been included as part of the ESI.†Conflicts of interest
There are no conflicts of interest to declare.Acknowledgements
The authors thank Ludovic Delbes for his help for XRD measurements, Jessica Brest for her help on handling the glovebox and Saremblé Kone-Guira for BET measurements. We thank Jean-Marc Krafft and Dr Thomas Onfroy for helpful discussions regarding infrared spectroscopy data. Arnaud Travert is acknowledged for giving access to his open-source library SpectroChemPy. This work was partially supported by the French national Agency for Research (ANR) under grant ANR-21-CE04-0009-02, project DEPOLECO.References
- Q. Wu, Z. Li and H. Hong, Adsorption of the Quinolone Antibiotic Nalidixic Acid onto Montmorillonite and Kaolinite, Appl. Clay Sci., 2013, 74, 66–73, DOI:10.1016/j.clay.2012.09.026.
- B. Halling-Sørensen, S. Nors Nielsen, P. F. Lanzky, F. Ingerslev, H. C. Holten Lützhøft and S. E. Jørgensen, Occurrence, Fate and Effects of Pharmaceutical Substances in the Environment – A Review, Chemosphere, 1998, 36(2), 357–393, DOI:10.1016/S0045-6535(97)00354-8.
- G. Lefèvre and M. Fédoroff, Sorption of Sulfate Ions onto Hematite Studied by Attenuated Total Reflection-Infrared Spectroscopy: Kinetics and Competition with Other Ions, Phys. Chem. Earth Parts ABC, 2006, 31(10–14), 499–504, DOI:10.1016/j.pce.2006.04.001.
- D. Peak, R. G. Ford and D. L. Sparks, An in Situ ATR-FTIR Investigation of Sulfate Bonding Mechanisms on Goethite, J. Colloid Interface Sci., 1999, 218(1), 289–299, DOI:10.1006/jcis.1999.6405.
- G. Lefèvre, T. Preočanin and J. Lützenkirchen, Attenuated Total Reflection – Infrared Spectroscopy Applied to the Study of Mineral – Aqueous Electrolyte Solution Interfaces: A General Overview and a Case Study, in Infrared Spectroscopy – Materials Science, Engineering and Technology, ed. T. Theophanides, InTech, 2012 DOI:10.5772/36459.
- T. Paul, J. Liu, M. L. Machesky and T. J. Strathmann, Adsorption of Zwitterionic Fluoroquinolone Antibacterials to Goethite: A Charge Distribution-Multisite Complexation Model, J. Colloid Interface Sci., 2014, 428, 63–72, DOI:10.1016/j.jcis.2014.04.034.
- Q. Liu, K. Xu, G. Hu, F. Zeng, X. Li, C. Li and Y. Zhang, Underwater Superelastic MOF/Polyacrylamide/Chitosan Composite Aerogel for Efficient 2,4-Dichlorophenoxyacetic Acid Adsorption, Colloids Surf., A, 2022, 635, 127970, DOI:10.1016/j.colsurfa.2021.127970.
- S. G. Ardo, S. Nélieu, G. Ona-Nguema, G. Delarue, J. Brest, E. Pironin and G. Morin, Oxidative Degradation of Nalidixic Acid by Nano-Magnetite via Fe2+/O2-Mediated Reactions, Environ. Sci. Technol., 2015, 49(7), 4506–4514, DOI:10.1021/es505649d.
- S. J. Hug, In Situ Fourier Transform Infrared Measurements of Sulfate Adsorption on Hematite in Aqueous Solutions, J. Colloid Interface Sci., 1997, 188(2), 415–422, DOI:10.1006/jcis.1996.4755.
- P. Roonasi and A. Holmgren, An ATR-FTIR Study of Sulphate Sorption on Magnetite; Rate of Adsorption, Surface Speciation, and Effect of Calcium Ions, J. Colloid Interface Sci., 2009, 333(1), 27–32, DOI:10.1016/j.jcis.2008.12.080.
- Y. Arai and D. L. Sparks, ATR-FTIR Spectroscopic Investigation on Phosphate Adsorption Mechanisms at the Ferrihydrite–Water Interface, J. Colloid Interface Sci., 2001, 241(2), 317–326, DOI:10.1006/jcis.2001.7773.
- A. M. Awad, R. Jalab, A. Benamor, M. S. Nasser, M. M. Ba-Abbad, M. El-Naas and A. W. Mohammad, Adsorption of Organic Pollutants by Nanomaterial-Based Adsorbents: An Overview, J. Mol. Liq., 2020, 301, 112335, DOI:10.1016/j.molliq.2019.112335.
- S. B. Johnson, T. H. Yoon, B. D. Kocar and G. E. Brown, Adsorption of Organic Matter at Mineral/Water Interfaces. 2. Outer-Sphere Adsorption of Maleate and Implications for Dissolution Processes, Langmuir, 2004, 20(12), 4996–5006, DOI:10.1021/la036288y.
- X. Gu, Y. Tan, F. Tong and C. Gu, Surface Complexation Modeling of Coadsorption of Antibiotic Ciprofloxacin and Cu(II) and onto Goethite Surfaces, Chem. Eng. J., 2015, 269, 113–120, DOI:10.1016/j.cej.2014.12.114.
- J. R. Bargar, J. D. Kubicki, R. Reitmeyer and J. A. Davis, ATR-FTIR Spectroscopic Characterization of Coexisting Carbonate Surface Complexes on Hematite, Geochim. Cosmochim. Acta, 2005, 69(6), 1527–1542, DOI:10.1016/j.gca.2004.08.002.
- A. J. Watkinson, E. J. Murby, D. W. Kolpin and S. D. Costanzo, The Occurrence of Antibiotics in an Urban Watershed: From Wastewater to Drinking Water, Sci. Total Environ., 2009, 407(8), 2711–2723, DOI:10.1016/j.scitotenv.2008.11.059.
- R. Sugden, R. Kelly and S. Davies, Combatting Antimicrobial Resistance Globally, Nat. Microbiol., 2016, 1(10), 16187, DOI:10.1038/nmicrobiol.2016.187.
- W. Cheng, J. Li, J. Sun, T. Luo, R. Marsac, J.-F. Boily and K. Hanna, Nalidixic Acid and Fe(II)/Cu(II) Coadsorption at Goethite and Akaganéite Surfaces, Environ. Sci. Technol., 2023, 57(41), 15680–15692, DOI:10.1021/acs.est.3c05727.
- S. Monti, I. Manet, F. Manoli, M. L. Capobianco and G. Marconi, Gaining an Insight into the Photoreactivity of a Drug in a Protein Environment: A Case Study on Nalidixic Acid and Serum Albumin, J. Phys. Chem. B, 2008, 112(18), 5742–5754, DOI:10.1021/jp711261n.
- E. Clervil, M. Usman, E. Emmanuel, V. Chatain and K. Hanna, Sorption of Nalidixic Acid onto Sediments under Batch and Dynamic Flow Conditions, Chem. Geol., 2013, 335, 63–74, DOI:10.1016/j.chemgeo.2012.10.041.
- X. Fan, H. Hao, Y. Wang, F. Chen and J. Zhang, Fenton-like Degradation of Nalidixic Acid with Fe3+/H2O2, Environ. Sci. Pollut. Res., 2013, 20(6), 3649–3656, DOI:10.1007/s11356-012-1279-0.
- M. Usman, S. Martin, N. Cimetière, S. Giraudet, V. Chatain and K. Hanna, Sorption of Nalidixic Acid onto Micrometric and Nanometric Magnetites: Experimental Study and Modeling, Appl. Surf. Sci., 2014, 299, 136–145, DOI:10.1016/j.apsusc.2014.01.197.
- J. Xu, R. Marsac, D. Costa, W. Cheng, F. Wu, J.-F. Boily and K. Hanna, Co-Binding of Pharmaceutical Compounds at Mineral Surfaces: Molecular Investigations of Dimer Formation at Goethite/Water Interfaces, Environ. Sci. Technol., 2017, 51(15), 8343–8349, DOI:10.1021/acs.est.7b02835.
- U. Neugebauer, A. Szeghalmi, M. Schmitt, W. Kiefer, J. Popp and U. Holzgrabe, Vibrational Spectroscopic Characterization of Fluoroquinolones, Spectrochim. Acta, Part A, 2005, 61(7), 1505–1517, DOI:10.1016/j.saa.2004.11.014.
- A. C. Hari, R. A. Paruchuri, D. A. Sabatini and T. C. G. Kibbey, Effects of pH and Cationic and Nonionic Surfactants on the Adsorption of Pharmaceuticals to a Natural Aquifer Material, Environ. Sci. Technol., 2005, 39(8), 2592–2598, DOI:10.1021/es048992m.
- D. Ross and C. Riley, Aqueous Solubilities of Some Variously Substituted Quinolone Antimicrobials, Int. J. Pharm., 1990, 63(3), 237–250, DOI:10.1016/0378-5173(90)90130-V.
- California Office of Environmental Health Hazard Assessment, Expedited Risk Assessment of Three Priority Carcinogens: 1,3-Butadiene, Ethylene Oxide, and 2-Amino-3-Methylimidazo[4,5-f]Quinoline (IQ), 2002, https://oehha.ca.gov/media/downloads/proposition-65/chemicals/expedit1aug2002.pdf.
- F. Tamtam, F. Van Oort, B. Le Bot, T. Dinh, S. Mompelat, M. Chevreuil, I. Lamy and M. Thiry, Assessing the Fate of Antibiotic Contaminants in Metal Contaminated Soils Four Years after Cessation of Long-Term Waste Water Irrigation, Sci. Total Environ., 2011, 409(3), 540–547, DOI:10.1016/j.scitotenv.2010.10.033.
- A. Y.-C. Lin, T.-H. Yu and C.-F. Lin, Pharmaceutical Contamination in Residential, Industrial, and Agricultural Waste Streams: Risk to Aqueous Environments in Taiwan, Chemosphere, 2008, 74(1), 131–141, DOI:10.1016/j.chemosphere.2008.08.027.
- S. J. Hug and B. Sulzberger, In Situ Fourier Transform Infrared Spectroscopic Evidence for the Formation of Several Different Surface Complexes of Oxalate on TiO2 in the Aqueous Phase, Langmuir, 1994, 10(10), 3587–3597, DOI:10.1021/la00022a036.
- S. P. Schwaminger, D. Bauer, P. Fraga-García, F. E. Wagner and S. Berensmeier, Oxidation of Magnetite Nanoparticles: Impact on Surface and Crystal Properties, CrystEngComm, 2017, 19(2), 246–255, 10.1039/C6CE02421A.
- T. Tatarchuk, L. Soltys and W. Macyk, Magnetic Adsorbents for Removal of Pharmaceuticals: A Review of Adsorption Properties, J. Mol. Liq., 2023, 384, 122174, DOI:10.1016/j.molliq.2023.122174.
- F. M. Michel, L. Ehm, S. M. Antao, P. L. Lee, P. J. Chupas, G. Liu, D. R. Strongin, M. A. A. Schoonen, B. L. Phillips and J. B. Parise, The Structure of Ferrihydrite, a Nanocrystalline Material, Science, 2007, 316(5832), 1726–1729, DOI:10.1126/science.1142525.
- G. Ona-Nguema, G. Morin, Y. Wang, A. L. Foster, F. Juillot, G. Calas and G. E. Brown, XANES Evidence for Rapid Arsenic(III) Oxidation at Magnetite and Ferrihydrite Surfaces by Dissolved O2via Fe2+-Mediated Reactions, Environ. Sci. Technol., 2010, 44(14), 5416–5422, DOI:10.1021/es1000616.
- T. Hiemstra, Surface and Mineral Structure of Ferrihydrite, Geochim. Cosmochim. Acta, 2013, 105, 316–325, DOI:10.1016/j.gca.2012.12.002.
- U. Schwertmann and R. M. Cornell, Iron Oxides in the Laboratory: Preparation and Characterization, John Wiley & Sons, 2008 Search PubMed.
- J. F. Bérar and G. Baldinozzi, XND Code: From X-Ray Laboratory Data to Incommensurately Modulated Phases, Commun. Powder Diffract Newsl., 1998, 20, 3–5 Search PubMed.
- Maghemite, Webmineral, https://www.Webmineral.Com/Data/Maghemite.Shtml, Accessed 9 June 2024.
- V. O. Leone, M. C. Pereira, S. F. Aquino, L. C. A. Oliveira, S. Correa, T. C. Ramalho, L. V. A. Gurgel and A. C. Silva, Adsorption of Diclofenac on a Magnetic Adsorbent Based on Maghemite: Experimental and Theoretical Studies, New J. Chem., 2018, 42(1), 437–449, 10.1039/C7NJ03214E.
- F. Maillot, G. Morin, Y. Wang, D. Bonnin, P. Ildefonse, C. Chaneac and G. Calas, New Insight into the Structure of Nanocrystalline Ferrihydrite: EXAFS Evidence for Tetrahedrally Coordinated Iron(III), Geochim. Cosmochim. Acta, 2011, 75(10), 2708–2720, DOI:10.1016/j.gca.2011.03.011.
- Ferrihydrite, Webmineral, https://www.Webmineral.Com/Data/Ferrihydrite.Shtml, Accessed 9 June 2024.
- N. Kumar, J. Lezama Pacheco, V. Noël, G. Dublet and G. E. Brown, Sulfidation Mechanisms of Fe(III)-(Oxyhydr)Oxide Nanoparticles: A Spectroscopic Study, Environ. Sci.: Nano, 2018, 5(4), 1012–1026, 10.1039/C7EN01109A.
- J. A. Davis and J. O. Leckie, Surface Ionization and Complexation at the Oxide/Water Interface II. Surface Properties of Amorphous Iron Oxyhydroxide and Adsorption of Metal Ions, J. Colloid Interface Sci., 1978, 67(1), 90–107, DOI:10.1016/0021-9797(78)90217-5.
- T. Bürgi and A. Baiker, Attenuated Total Reflection Infrared Spectroscopy of Solid Catalysts Functioning in the Presence of Liquid-Phase Reactants, Advances in Catalysis, Elsevier, 2006, vol. 50, pp. 227–283 DOI:10.1016/S0360-0564(06)50005-7.
- F. Neese, F. Wennmohs, U. Becker and C. Riplinger, The ORCA Quantum Chemistry Program Package, J. Chem. Phys., 2020, 152(22), 224108, DOI:10.1063/5.0004608.
- A. D. Becke, Density-Functional Thermochemistry. I. The Effect of the Exchange-Only Gradient Correction, J. Chem. Phys., 1992, 96(3), 2155–2160, DOI:10.1063/1.462066.
- F. Weigend and R. Ahlrichs, Balanced Basis Sets of Split Valence, Triple Zeta Valence and Quadruple Zeta Valence Quality for H to Rn: Design and Assessment of Accuracy, Phys. Chem. Chem. Phys., 2005, 7(18), 3297, 10.1039/b508541a.
- P. Trivedi and D. Vasudevan, Spectroscopic Investigation of Ciprofloxacin Speciation at the Goethite−Water Interface, Environ. Sci. Technol., 2007, 41(9), 3153–3158, DOI:10.1021/es061921y.
- R. Marsac, S. Martin, J.-F. Boily and K. Hanna, Oxolinic Acid Binding at Goethite and Akaganéite Surfaces: Experimental Study and Modeling, Environ. Sci. Technol., 2016, 50(2), 660–668, DOI:10.1021/acs.est.5b04940.
- S. Gunasekaran, R. K. Natarajan, R. Rathikha and D. Syamala, Vibrational Spectra and Normal Coordinate Analysis of Nalidixic Acid, Indian J. Pure Appl. Phys., 2005, 43(07), 503–508 CAS.
- S. Romero, P. Bustamante, B. Escalera, P. Mura and M. Cirri, Influence of Solvent Composition on the Solid Phase at Equilibrium with Saturated Solutions of Quinolones in Different Solvent Mixtures, J. Pharm. Biomed. Anal., 2004, 35(4), 715–726, DOI:10.1016/j.jpba.2004.02.006.
- P. Grubb, Analytical Profiles of Drug Substances, Academic Press, Inc., 1979, vol. 8 Search PubMed.
- S. Rakshit, D. Sarkar, E. J. Elzinga, P. Punamiya and R. Datta, Mechanisms of Ciprofloxacin Removal by Nano-Sized Magnetite, J. Hazard. Mater., 2013, 246–247, 221–226, DOI:10.1016/j.jhazmat.2012.12.032.
- S. Muthu, E. E. Porchelvi and Y. Erdogdu, Density Functional Theory and Abinitio Studies of Vibrational Spectra of Nalidixic Acid, J. Int. Acad. Phys. Sci., 2011, 15(2), 205–222 Search PubMed.
- T. Paul, M. L. Machesky and T. J. Strathmann, Surface Complexation of the Zwitterionic Fluoroquinolone Antibiotic Ofloxacin to Nano-Anatase TiO2 Photocatalyst Surfaces, Environ. Sci. Technol., 2012, 46(21), 11896–11904, DOI:10.1021/es302097k.
- K. W. Goyne, J. Chorover, J. D. Kubicki, A. R. Zimmerman and S. L. Brantley, Sorption of the Antibiotic Ofloxacin to Mesoporous and Nonporous Alumina and Silica, J. Colloid Interface Sci., 2005, 283(1), 160–170, DOI:10.1016/j.jcis.2004.08.150.
- M. Nara, H. Torii and M. Tasumi, Correlation between the Vibrational Frequencies of the Carboxylate Group and the Types of Its Coordination to a Metal Ion: An Ab Initio Molecular Orbital Study, J. Phys. Chem., 1996, 100(51), 19812–19817, DOI:10.1021/jp9615924.
- J. Xu, R. Marsac, C. Wei, F. Wu, J.-F. Boily and K. Hanna, Cobinding of Pharmaceutical Compounds at Mineral Surfaces: Mechanistic Modeling of Binding and Cobinding of Nalidixic Acid and Niflumic Acid at Goethite Surfaces, Environ. Sci. Technol., 2017, 51(20), 11617–11624, DOI:10.1021/acs.est.7b02900.
- K. Nakamoto, Infrared and Raman Spectra of Inorganic and Coordination Compounds, Part B: Applications in Coordination, Organometallic, and Bioinorganic Chemistry, John Wiley & Sons, 4th edn, 1986 Search PubMed.
- J. E. Tackett, FT-IR Characterization of Metal Acetates in Aqueous Solution, Appl. Spectrosc., 1989, 43(3), 483–489, DOI:10.1366/0003702894202931.
Footnote |
| † Electronic supplementary information (ESI) available. See DOI: https://doi.org/10.1039/d4nj03440f |
| This journal is © The Royal Society of Chemistry and the Centre National de la Recherche Scientifique 2024 |