Viscoelastic microfluidics for enhanced separation resolution of submicron particles and extracellular vesicles†
Samith
Hettiarachchi
 a,
Lingxi
Ouyang
a,
Haotian
Cha
a,
Helena H. W. B.
Hansen
a,
Honjie
An
a,
Lingxi
Ouyang
a,
Haotian
Cha
a,
Helena H. W. B.
Hansen
a,
Honjie
An
 a,
Nam-Trung
Nguyen
 *a and
Jun
Zhang
 *ab
*ab
aQueensland Micro- and Nanotechnology Centre, Griffith University, Nathan, Queensland 4111, Australia. E-mail: nam-trung.nguyen@griffith.edu.au; jun.zhang@griffith.edu.au
bSchool of Engineering and Built Environment, Griffith University, Nathan, Queensland 4111, Australia
First published on 25th January 2024
Abstract
Manipulation, focusing, and separation of submicron- and nanoparticles such as extracellular vesicles (EVs), viruses and bacteria have broad applications in disease diagnostics and therapeutics. Viscoelastic microfluidic technology emerges as a promising technique, and it shows an unparalleled capacity to manipulate and separate submicron particles in a high resolution based on the elastic effects of non-Newtonian mediums. The maximum particle separation resolution for the reported state-of-the-art viscoelastic microfluidics is around 200 nm. To further enhance the reseparation resolution, this work develops a viscoelastic microfluidic device that can achieve a finer separation resolution up to 100 nm, by optimising the operating conditions such as flow rate, flow rate ratio and polyethylene oxide (PEO) concentration. With these optimised conditions, we separated a ternary mixture of 100 nm, 200 nm and 500 nm polystyrene particles, with purities above 90%, 70% and 82%, respectively. Furthermore, we also applied the developed viscoelastic microfluidic device for the separation of cancer cell-secreted extracellular vesicles (EVs) into three different size groups. After single processing, the separation efficiencies for small EVs (sEVs, <150 nm), medium EVs (mEVs, 150–300 nm), and large EVs (>300 nm) were 86%, 80% and 50%, respectively. The enrichment factors for the three EV groups were 2.4, 1.1 and 1.3, respectively. Moreover, we observed an unexpected effect of high PEO concentrations (2000–5000 ppm) on the lateral migration of nanoparticles where nanoparticles of up to 50 nm surprisingly can migrate and concentrate at the middle of the microchannel. This simple and label-free viscoelastic microfluidic device possesses excellent potential for sorting submicron particles for various chemical, biological, medical and environmental applications.
1 Introduction
Manipulation, focusing, and sorting of submicron and nanoparticles such as exosomes,1 extracellular vesicles,2 viruses,3 bacteria,4 metals5 and polymer nanoparticles6 are indispensable in disease diagnostics and therapeutics, drug discovery and material synthesis.7–9 Conventional technologies such as ultracentrifugation, ultrafiltration, size-exclusion chromatography, precipitation and immunoaffinity capture have been developed to manipulate and separate those minuscule particles. However, these techniques are limited by high cost, low separation resolution, and potential damage to biological particles, etc.10 Microfluidic techniques can precisely control fluid flow and particle motion in the microchannels and have recently attracted increasing attention for manipulation and sorting of micro and nanoparticles with a high separation resolution and efficiency.11Many microfluidic techniques have been developed to manipulate particles, and they can be categorised as active and passive techniques based on the source of manipulating forces. Active techniques utilise external acoustic,12 electric,13 magnetic14 and optical15 force fields to manipulate particles. In contrast, the passive techniques work based on the intrinsic hydrodynamic forces and microchannel geometry such as inertial microfluidics,16 deterministic lateral displacement,17 microfluidic filtration,18 pinched flow fractionation19 and viscoelastic microfluidics.20 Among the microfluidic techniques, viscoelastic microfluidics is a promising technique for nanoparticle manipulation.
Viscoelastic microfluidics manipulates particles based on the elastic effects of non-Newtonian mediums. An elastic force arises due to the imbalance of normal stresses in a viscoelastic fluid flow. The elastic force can migrate the suspended particles laterally with different migration speeds or toward different lateral equilibrium positions, consequently enabling particle separation.21 It is label-free, simple and biocompatible and can offer a high separation resolution. Viscoelastic microfluidics has been applied to focus and sort polystyrene nanoparticles, bacteria,22 DNA,23 tumour cells,24 microvesicles25 and exosomes.26,27
Viscoelastic microfluidic devices with wavy27 and spiral28 microchannel structures have been developed to focus larger submicron particles and filtrate them from their smaller counterparts. In both works, particles above a certain size (i.e., 300 nm and 1000 nm) were focused and concentrated at a particular lateral equilibrium position of the microchannels, whereas smaller particles of 100 nm and 28 nm were randomly distributed. Therefore, larger particles were filtrated from the mixture. They have also used the device for the sorting of microvesicles and exosomes from the cell culture medium. In contrast, Liu et al.26 proposed a viscoelastic microfluidic device for the size-based separation of submicron particles based on the size-dependent migration speed of particles. The sheath flow confines nanoparticles along the two channel sidewalls at the inlet, and larger particles migrate faster to the channel centre than the smaller ones. At a proper channel length, smaller and larger particles are occupied at different lateral positions. Consequently, particles can be collected by different outlets and separated completely. Their work demonstrated the successful separation of 100 nm and 500 nm particles and the isolation of exosomes from larger EVs. Later, the team modified the viscoelastic medium by dissolving λ-DNA in Tris–borate–EDTA (TBE) buffer to enhance the separation performance of the viscoelastic microfluidic technique.25 Very recently, Meng et al.29 presented a cascaded viscoelastic-based microfluidic device for the separation of EVs from human blood. The first stage was used to filtrate and remove blood cells from the blood plasma, and the second stage continued to fractionate EVs into two different groups based on size. Although significant progress has been achieved, the separation resolution of viscoelastic microfluidics is still limited, and the finest separation resolution of state-of-the-art viscoelastic microfluidics is around 200 nm. Moreover, sorting particle mixtures into three different sizes remains a challenge.
In this work, we present a viscoelastic microfluidic device that can provide an enhanced separation resolution and achieve the separation of a ternary particle mixture. First, we systematically investigate the effects of particle size, flow rate ratio of sheath to sample flows, total flow rate, and polyethylene oxide (PEO) concentration on particle migration behaviour. This provides us with the optimal operating parameters of the devices for the separation of specific submicron particles. Second, we apply the device for the separation of ternary particle mixture of 100 nm, 200 nm and 500 nm, and characterise the separation performance quantitatively. The separation purities of 100 nm, 200 nm and 500 nm particles are over 90%, 70% and 82%, respectively. Finally, we demonstrate the separation of differently-sized extracellular vesicles using the viscoelastic microfluidic device. A recovery rate of 86%, 80% and 50% for small EVs (<150 nm), medium EVs (150–300 nm) and large EVs (>300 nm) were achieved with enrichment factors of 2.4, 1.1 and 1.3, respectively. This label-free viscoelastic microfluidic device has shown promising potential for the precise sorting of submicron particles, offering valuable utility across a broad spectrum of chemistry, biology and medicine.
2 Theory
2.1 Elastic lift force
Particles suspended in a viscoelastic fluid experience elastic lift force due to the imbalance of normal stresses in the fluid flow. Both the first normal stress (N1 = τxx − τyy) and second normal stress (N2 = τyy − τzz) contribute to the elastic force. τxx, τyy and τzz are the normal stresses in streamwise, transverse, and vorticity directions, respectively. Since N1 is significantly larger than N2 in a diluted viscoelastic medium, N2 can be neglected. Therefore, elastic lift force (FE) is proportional to the variation of N1 and can be expressed as30 | (1) |
 is the average shear rate.
2.2 Viscous drag force
The velocity difference between fluid elements and particles induces a viscous drag force influencing particle migration. For a spherical particle flowing in a uniform Stokes flow, the drag force (FD) can be expressed as:21| FD = 3πaη(uf − up) | (2) |
2.3 Particle migration in a viscoelastic co-flowing system
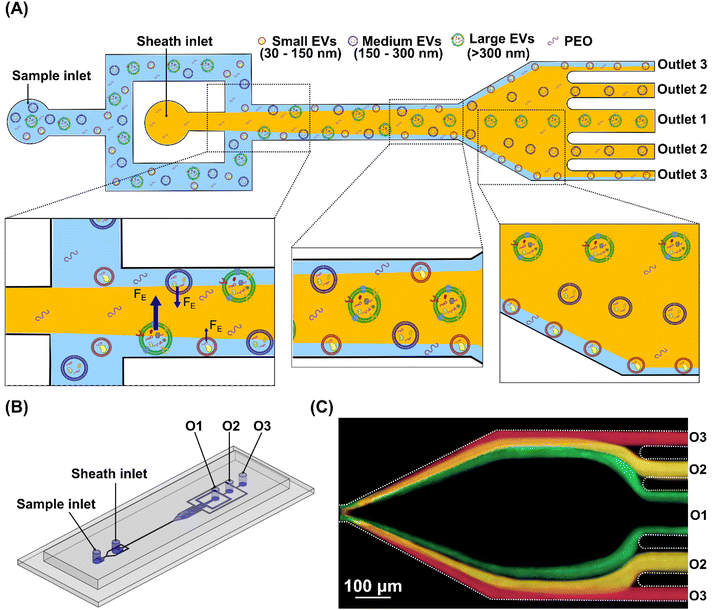
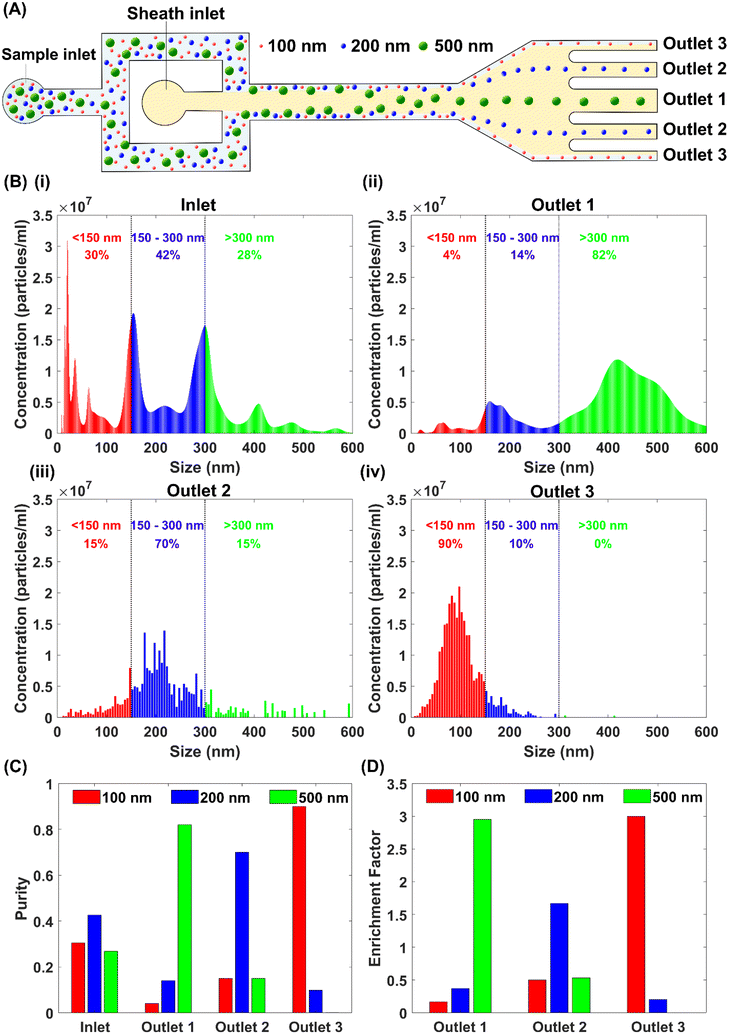
In the co-flowing system, the sample and sheath flows are the viscoelastic mediums of the same PEO aqueous solution. The suspended particles of different diameters in the sample flow are confined to channel sidewalls by the middle sheath flow at the inlet, Fig. 1(A). In the straight channel section, the interplay between the elastic lift force and viscous drag force determines the particle migration speed and the final equilibrium position. The elastic lift force FE propels particles toward the channel centre and is balanced by a lateral viscous drag induced by the velocity difference of fluid (uf = 0) and particles (up) along the lateral direction. Then, we can derive the particle lateral migration speed . This expression indicates that the particle lateral migration speed is proportional to a2. Thus, larger particles migrate faster to the channel centre than smaller particles. By properly designing flow speed and channel length, particles or EVs of different sizes can reach different lateral positions at the end of the straight channel, consequently enabling particle separation and respective collection from different outlets, Fig. 1(A).
3 Materials and methods
3.1 Device design and fabrication
The microfluidic device in this work consists of two inlets, a straight microchannel section, an expansion region, and five symmetric outlets along the channel centre. The sample flow is split into two streams and flows into the main channel from two sidewalls symmetrically, whereas the sheath flow is infused into the middle stream. The main straight channel section has a width of 20 μm and a length of 25 mm. The height of the whole microchannel is uniform at 50 μm. The microfluidic device was fabricated using the standard photolithography and soft-lithography techniques. Briefly, a polydimethylsiloxane (PDMS) mixture was made at the base and curing agent weight ratio of 10![[thin space (1/6-em)]](https://www.rsc.org/images/entities/char_2009.gif) :
:![[thin space (1/6-em)]](https://www.rsc.org/images/entities/char_2009.gif) 1, followed by 20 min vacuum degassing. Then, the PDMS mixture was poured over the silicon mould and baked in an oven at 70 °C for over 2 hours. Inlet and outlet holes were punched after peeling off the PDMS from the mould. Finally, the PDMS layer was treated with plasma and bonded to a glass substrate. A three-dimensional illustration and the geometry of the microfluidic device are shown in Fig. 1(B) and Fig. S1.†
1, followed by 20 min vacuum degassing. Then, the PDMS mixture was poured over the silicon mould and baked in an oven at 70 °C for over 2 hours. Inlet and outlet holes were punched after peeling off the PDMS from the mould. Finally, the PDMS layer was treated with plasma and bonded to a glass substrate. A three-dimensional illustration and the geometry of the microfluidic device are shown in Fig. 1(B) and Fig. S1.†
3.2 Particle sample preparation
For the experiments, different concentrations of PEO solutions were prepared by dissolving PEO (Mw = 600![[thin space (1/6-em)]](https://www.rsc.org/images/entities/char_2009.gif) 000 Da, Sigma-Aldrich) powder in Milli-Q water at concentrations of 400 ppm, 800 ppm, 1000 ppm, 2000 ppm, 3000 ppm and 5000 ppm, respectively. To obtain a solution of uniform concentration, the mixture was gently swung for 24 hours. Three sets of spherical fluorescent polystyrene particles with diameters of 100 nm (product no. R100), 200 nm (product no. R200), and 500 nm (product no. G500) were purchased from Thermo Fisher Scientific, and they were suspended in the above prepared PEO solutions with particle concentrations of 1.8 × 10⁹ counts per mL, 2.25 × 10⁸ counts per mL and 1.36 × 10⁷ counts per mL, respectively. Tween 20 was added into the suspension as a surfactant to prevent particle aggregation. To characterise the particle separation performance, a mixture of 100 nm, 200 nm, and 500 nm polystyrene particles was prepared with concentrations of 3 × 10⁸ counts per mL, 3 × 10⁸ counts per mL and 1.15 × 10⁸ counts per mL, respectively.
000 Da, Sigma-Aldrich) powder in Milli-Q water at concentrations of 400 ppm, 800 ppm, 1000 ppm, 2000 ppm, 3000 ppm and 5000 ppm, respectively. To obtain a solution of uniform concentration, the mixture was gently swung for 24 hours. Three sets of spherical fluorescent polystyrene particles with diameters of 100 nm (product no. R100), 200 nm (product no. R200), and 500 nm (product no. G500) were purchased from Thermo Fisher Scientific, and they were suspended in the above prepared PEO solutions with particle concentrations of 1.8 × 10⁹ counts per mL, 2.25 × 10⁸ counts per mL and 1.36 × 10⁷ counts per mL, respectively. Tween 20 was added into the suspension as a surfactant to prevent particle aggregation. To characterise the particle separation performance, a mixture of 100 nm, 200 nm, and 500 nm polystyrene particles was prepared with concentrations of 3 × 10⁸ counts per mL, 3 × 10⁸ counts per mL and 1.15 × 10⁸ counts per mL, respectively.
3.3 EV sample preparation
MDA-MB-231 human breast cancer cells (ATCC) were cultured in an incubator at 37 °C and 5% CO2. The growth DMEM/F-12 media without glutamine was supplemented with 10% fetal bovine serum (FBS), 100 U mL−1 penicillin and 100 U mL−1 streptomycin. All materials were from Thermo Fisher Scientific. After four days of incubation, the culture media was pipetted from the cell culture flasks and centrifuged at 4500g for 20 min. The supernatant was carefully extracted and diluted in PBS containing PEO to achieve 1000 ppm concentration.3.4 Experimental setup
The microfluidic device was placed on the stage of an inverted microscope (Olympus IX73 Fluorescence Microscope). Two syringe pumps were used to infuse the sample and sheath flows into the device, respectively. To investigate the effect of total flow rate and flow rate ratio on particle migration and separation, we varied the total flow rates from 300 μL h−1 to 1800 μL h−1 and the flow rate ratio of sheath to sample flow from 1![[thin space (1/6-em)]](https://www.rsc.org/images/entities/char_2009.gif) :
:![[thin space (1/6-em)]](https://www.rsc.org/images/entities/char_2009.gif) 1 to 5
1 to 5![[thin space (1/6-em)]](https://www.rsc.org/images/entities/char_2009.gif) :
:![[thin space (1/6-em)]](https://www.rsc.org/images/entities/char_2009.gif) 1. A high-speed camera (Phantom VEO) was used to capture the fluorescence trajectories of particles at the expansion region. Then, the images were post-processed and analysed using the software ImageJ (National Institutes of Health). The fluorescence intensity profile across the channel width was also measured to characterise the distribution of particles along the lateral direction. Fig. 1(C) presents a merged image of fluorescent trajectories of 100 nm (red), 200 nm (yellow) and 500 nm (green) particles at the expansion region of the channel.
1. A high-speed camera (Phantom VEO) was used to capture the fluorescence trajectories of particles at the expansion region. Then, the images were post-processed and analysed using the software ImageJ (National Institutes of Health). The fluorescence intensity profile across the channel width was also measured to characterise the distribution of particles along the lateral direction. Fig. 1(C) presents a merged image of fluorescent trajectories of 100 nm (red), 200 nm (yellow) and 500 nm (green) particles at the expansion region of the channel.
3.5 Characterisation of particles and EVs
Nanoparticle tracking analysis (NanoSight NS300, Malvern Panalytical Ltd) was used to evaluate the size distribution of samples of nanoparticles and EVs before and after separation. This technique utilises light scattering to acquire the size distribution and concentration of the particles in a dispersed medium. The hydrodynamic diameter of the particles is evaluated by estimating their speed due to the Brownian motion. The size distribution data were captured and analysed with an NTA Analytical Software Suite. All the measurements were conducted at 22.5 °C. The size and morphology of the EVs after the separation was examined using transmission electron microscopy (HITACHI HT7700-B). The samples were prepared by dipping a small volume (∼10 μl) of outlet 3 into the copper grid (230 mesh and coated by formvar carbon film) and waiting until they were thoroughly dried. The accelerating voltage is 80 kV, and the emission current is 10 μA.4 Results and discussion
4.1 Effect of flow rate ratio
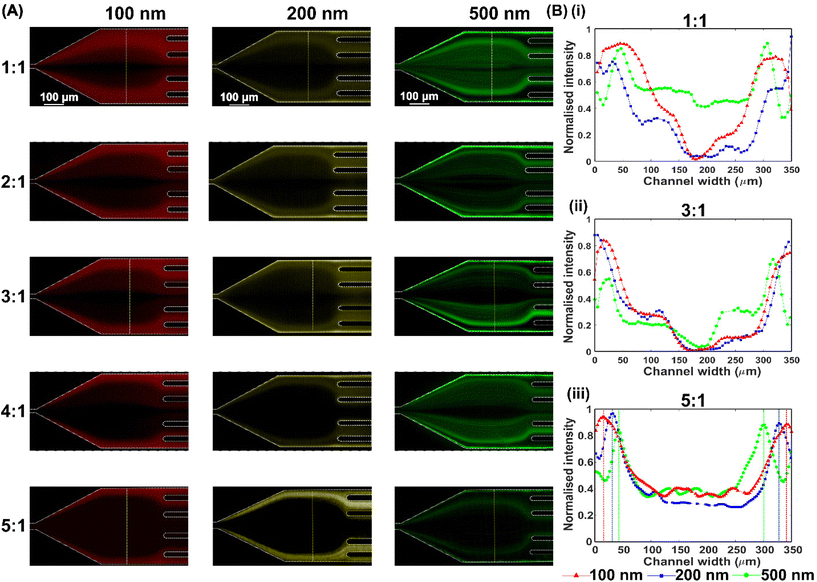
We first studied the effect of the flow rate ratio (FRR) of the sheath flow to sample flow on particle migration. Both sample and sheath flows were 1000 ppm PEO aqueous solution. The 100 nm, 200 nm and 500 nm fluorescent particles were respectively dispersed into the sample flow. We varied the flow rate ratio of the sheath to sample from 1![[thin space (1/6-em)]](https://www.rsc.org/images/entities/char_2009.gif) :
:![[thin space (1/6-em)]](https://www.rsc.org/images/entities/char_2009.gif) 1 to 5
1 to 5![[thin space (1/6-em)]](https://www.rsc.org/images/entities/char_2009.gif) :
:![[thin space (1/6-em)]](https://www.rsc.org/images/entities/char_2009.gif) 1, while keeping the total flow rate constant at 1200 μL h−1. The fluorescent trajectories of 100 nm, 200 nm and 500 nm particles at the end of the straight channel are shown in Fig. 2(A) and the fluorescence intensities across the channel width of the expansion region at the FRRs of 1
1, while keeping the total flow rate constant at 1200 μL h−1. The fluorescent trajectories of 100 nm, 200 nm and 500 nm particles at the end of the straight channel are shown in Fig. 2(A) and the fluorescence intensities across the channel width of the expansion region at the FRRs of 1![[thin space (1/6-em)]](https://www.rsc.org/images/entities/char_2009.gif) :
:![[thin space (1/6-em)]](https://www.rsc.org/images/entities/char_2009.gif) 1, 3
1, 3![[thin space (1/6-em)]](https://www.rsc.org/images/entities/char_2009.gif) :
:![[thin space (1/6-em)]](https://www.rsc.org/images/entities/char_2009.gif) 1 and 5
1 and 5![[thin space (1/6-em)]](https://www.rsc.org/images/entities/char_2009.gif) :
:![[thin space (1/6-em)]](https://www.rsc.org/images/entities/char_2009.gif) 1 are plotted in Fig. 2(B). Generally, the higher the FRR, the tighter the distribution of fluorescent particles at the expansion region. The narrow distribution of particles is because the sample flow is confined into a more limited space at the inlet by a high sheath flow rate. Besides, the higher the FRR, the more distinguishable distribution of different nanoparticles at the expansion region can be observed, Fig. 2(B). When FRR is from 1
1 are plotted in Fig. 2(B). Generally, the higher the FRR, the tighter the distribution of fluorescent particles at the expansion region. The narrow distribution of particles is because the sample flow is confined into a more limited space at the inlet by a high sheath flow rate. Besides, the higher the FRR, the more distinguishable distribution of different nanoparticles at the expansion region can be observed, Fig. 2(B). When FRR is from 1![[thin space (1/6-em)]](https://www.rsc.org/images/entities/char_2009.gif) :
:![[thin space (1/6-em)]](https://www.rsc.org/images/entities/char_2009.gif) 1 to 3
1 to 3![[thin space (1/6-em)]](https://www.rsc.org/images/entities/char_2009.gif) :
:![[thin space (1/6-em)]](https://www.rsc.org/images/entities/char_2009.gif) 1, the distribution of 100 nm, 200 nm and 500 nm particles largely overlaps because of the wide distribution of particles and slight difference in lateral position among different particles. When increasing FRR to 5
1, the distribution of 100 nm, 200 nm and 500 nm particles largely overlaps because of the wide distribution of particles and slight difference in lateral position among different particles. When increasing FRR to 5![[thin space (1/6-em)]](https://www.rsc.org/images/entities/char_2009.gif) :
:![[thin space (1/6-em)]](https://www.rsc.org/images/entities/char_2009.gif) 1, the particle distribution becomes much narrower, and the lateral distribution difference between various particles becomes more distinguishable. All three particles have distinct equilibrium positions due to the size-dependent elastic lift force. Therefore, a complete separation of 100 nm, 200 nm and 500 nm particles based on the differential lateral positions is possible if we carefully design the bifurcated outlets to collect the respective nanoparticles. Therefore, in the following, we chose FRR as 5
1, the particle distribution becomes much narrower, and the lateral distribution difference between various particles becomes more distinguishable. All three particles have distinct equilibrium positions due to the size-dependent elastic lift force. Therefore, a complete separation of 100 nm, 200 nm and 500 nm particles based on the differential lateral positions is possible if we carefully design the bifurcated outlets to collect the respective nanoparticles. Therefore, in the following, we chose FRR as 5![[thin space (1/6-em)]](https://www.rsc.org/images/entities/char_2009.gif) :
:![[thin space (1/6-em)]](https://www.rsc.org/images/entities/char_2009.gif) 1 to study the effects of the total flow rate, PEO concentration and particle separation.
1 to study the effects of the total flow rate, PEO concentration and particle separation.
4.2 Effect of total flow rate
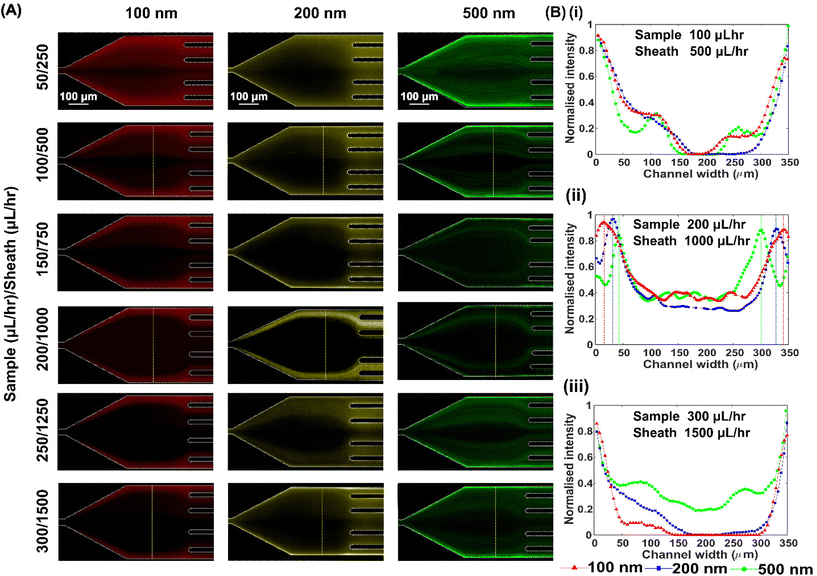
We next investigated the effect of total flow rate on particle migration in the viscoelastic microfluidic device. Particle suspensions were pumped into the device at different total flow rates from 300 μL h−1 to 1800 μL h−1 with an interval of 300 μL h−1, while maintaining the FRR constant at 5![[thin space (1/6-em)]](https://www.rsc.org/images/entities/char_2009.gif) :
:![[thin space (1/6-em)]](https://www.rsc.org/images/entities/char_2009.gif) 1, Fig. 3(A). Also, both sample and sheath flows were 1000 ppm PEO aqueous solution. At a relatively low rate from 300 μL h−1 to 600 μL h−1, the viscoelastic lift force is very weak, and the Brownian motion mainly dominates the particle migration. Besides, particles had enough residence time in the channel to migrate laterally due to a low primary flow velocity. Therefore, particles were diffused laterally and spread from the sidewall region to the channel middle in a wide area, and no apparent focusing positions of particles could be observed, subfigure (i) in Fig. 3(B).
1, Fig. 3(A). Also, both sample and sheath flows were 1000 ppm PEO aqueous solution. At a relatively low rate from 300 μL h−1 to 600 μL h−1, the viscoelastic lift force is very weak, and the Brownian motion mainly dominates the particle migration. Besides, particles had enough residence time in the channel to migrate laterally due to a low primary flow velocity. Therefore, particles were diffused laterally and spread from the sidewall region to the channel middle in a wide area, and no apparent focusing positions of particles could be observed, subfigure (i) in Fig. 3(B).
Increasing the flow rate to 1200 μL h−1, the viscoelastic lift force became dominant in the lateral migration of particles, especially for large 200 nm and 500 nm particles. Since the viscoelastic lift force is proportional to a3 from eqn (1), 500 nm and 200 nm particles migrated laterally at different velocities. They reached the distinct lateral positions at the end of the channel, while 100 nm particles mainly stayed along the sidewalls and diffused minorly due to short residence time. The fluorescence intensity profile in (ii) of Fig. 3(B) indicates that three particles occupied distinct lateral positions. Further increasing the flow rates to 1800 μL h−1, the residence time for particle migration within the straight channel became too short, so that both 200 nm and 100 nm particles migrated negligibly and mainly stayed near the sidewalls. Thus, separation between 100 nm and 200 nm particles became impossible. In contrast, large 500 nm particles could still migrate significantly due to a strong enough viscoelastic lift force and mainly reached the channel middle area, as shown in subfigure (iii) of Fig. 3(B). In this case, separating 500 nm and 200 nm or smaller particles is still possible. In summary, the total flow rate of 1200 μL h−1 is feasible for the separation of a ternary particle mixture of 100 nm, 200 nm and 500 nm.
4.3 Effect of PEO concentration
We further investigated the influence of PEO concentration on the lateral migration of ternary particle mixture in the viscoelastic microfluidic device. PEO solution with concentrations of 400 ppm, 800 ppm, 1000 ppm, 2000 ppm, 3000 ppm and 5000 ppm were prepared for the experiment. Both the sample and sheath flows had the same PEO concentration. The total flow rate was kept constant at 1200 μL h−1 and the FRR was fixed at 5![[thin space (1/6-em)]](https://www.rsc.org/images/entities/char_2009.gif) :
:![[thin space (1/6-em)]](https://www.rsc.org/images/entities/char_2009.gif) 1, except for PEO concentrations of 3000 ppm and 5000 ppm. The reason that we used the flow rate ratio of 4
1, except for PEO concentrations of 3000 ppm and 5000 ppm. The reason that we used the flow rate ratio of 4![[thin space (1/6-em)]](https://www.rsc.org/images/entities/char_2009.gif) :
:![[thin space (1/6-em)]](https://www.rsc.org/images/entities/char_2009.gif) 1 for PEO concentrations of 3000 ppm and 5000 ppm is because the flow oscillations happened at the inlet cross conjunction area at the flow rate ratio of 5
1 for PEO concentrations of 3000 ppm and 5000 ppm is because the flow oscillations happened at the inlet cross conjunction area at the flow rate ratio of 5![[thin space (1/6-em)]](https://www.rsc.org/images/entities/char_2009.gif) :
:![[thin space (1/6-em)]](https://www.rsc.org/images/entities/char_2009.gif) 1 in our experiments, Fig. S2.† A similar observation was also reported.22 Therefore, we used the flow rate ratio of 4
1 in our experiments, Fig. S2.† A similar observation was also reported.22 Therefore, we used the flow rate ratio of 4![[thin space (1/6-em)]](https://www.rsc.org/images/entities/char_2009.gif) :
:![[thin space (1/6-em)]](https://www.rsc.org/images/entities/char_2009.gif) 1 for two PEO concentrations to ensure the viscoelastic flow was stable in our experiments.
1 for two PEO concentrations to ensure the viscoelastic flow was stable in our experiments.
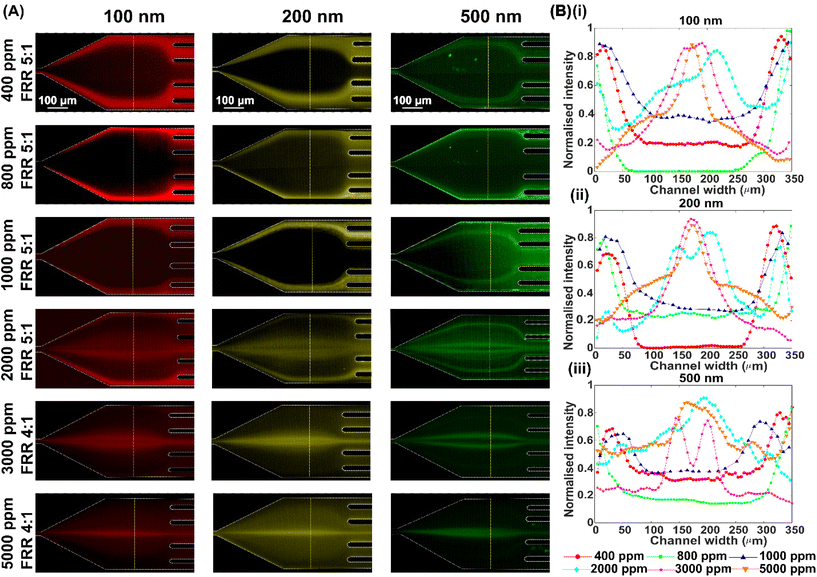
The fluorescent trajectories of particles are shown in Fig. 4(A). We observed that the lateral distribution of three particles varied with the increase in PEO concentration. When the PEO concentration increased from 400 ppm to 1000 ppm, particles migrated laterally toward the channel centre from the channel sidewalls, but could not completely reach the channel central area. At 1000 ppm PEO concentration, 100 nm, 200 nm and 500 nm particles occupied different lateral positions and existed from five outlets, respectively. This could enable size-based sorting of submicron triple particle mixture effectively at 1000 ppm PEO concentration.
When further increasing the PEO concentration from 2000 ppm to 5000 ppm, an intriguing phenomenon happened that a large portion of all three submicron particles could successfully migrate and concentrate at the channel middle area. We speculate that a high PEO concentration induces a sufficiently strong elastic force to migrate laterally the small submicron particles (e.g., 100 nm) to the channel centre. The fluorescence intensity profiles also clearly illustrated that the trajectories of all three particles moved from the channel sidewalls gradually toward the channel centre when increasing the PEO concentration from 400 ppm to 5000 ppm, Fig. 4(B). Furthermore, we tested even smaller nanoparticles (50 nm) in the viscoelastic microfluidic device with different PEO concentrations. We observed a similar behaviour as that of 100 nm. The 50 nm particles could migrate laterally towards the channel centre at 3000 ppm and 5000 ppm PEO concentrations, Fig. S3.†
To explore this interesting phenomenon, we designed the microchannel of the exact dimensions without sheath flows and studied the migration of particles in the high PEO concentration solutions, Fig. S4.† Unexpectedly, we observed that neither of the 100 nm, 200 nm and 500 nm particles could migrate and focus at the channel middle area in the 5000 ppm PEO aqueous solutions but instead randomly distributed, Fig. S5.† This phenomenon is in direct contrast to the observation in the co-flowing system, indicating that the central sheath flow is essential to facilitate the lateral migration of particles. Future work is needed to reveal the underlying mechanism and to explain why a middle sheath flow can facilitate the lateral migration of particles as small as 50 nm.
4.4 Separation of ternary particle mixture of 100 nm, 200 nm, and 500 nm
To characterise the separation performance of the device, we prepared a ternary particle mixture with diameters of 100 nm, 200 nm and 500 nm in viscoelastic non-Newtonian fluids. Based on the above results on individual particles, we chose the total flow rate of 1200 μL h−1 and the FRR of 5![[thin space (1/6-em)]](https://www.rsc.org/images/entities/char_2009.gif) :
:![[thin space (1/6-em)]](https://www.rsc.org/images/entities/char_2009.gif) 1. The PEO concentration of sample and sheath flows was 1000 ppm.
1. The PEO concentration of sample and sheath flows was 1000 ppm.
With the aid of the sheath flow, the particle mixture was confined near the side walls when entering into the straight section of the microfluidic device. Due to the elastic lift force, larger particles gradually migrated toward the channel centre over the length of the straight channel and the smaller particles remained near the side walls, Fig. 5(A). We observed that the 500 nm particles migrated to the channel centre and exited primarily through the middle outlet 1, while 100 nm particles remained near the channel walls and exited through outlet 3. Meanwhile, 200 nm particles exhibited a transition behaviour. Even though they have migrated slightly along the lateral direction, their equilibrium position remained between 100 nm and 500 nm particles due to the relatively weaker lift forces than the 500 nm particles. This allows them to exit through outlet 2 mainly. Finally, the differential particle lateral positions facilitated the successful sorting of 100 nm, 200 nm and 500 nm particles. We collected the separated sample from three outlets and characterised particle size and concentration using NTA equipment. The distinct particle distribution bands were observed with peak concentrations at 419 nm, 218 nm and 98 nm at outlets 1, 2 and 3, respectively, Fig. 5(B). The separation performance was calculated, such as the purity and enrichment factor. The purity is defined as the ratio of specific particles to the total particle number at the same inlet or outlet. The enrichment factor is the ratio of particle purity at a given outlet to the purity of the same particles at the inlet. Due to the measurement errors of NTA and the size distribution of commercial nanoparticles, the particle sizes measured by NTA are not individual peaks, but a relatively wide size distribution. To roughly determine the particle numbers of three particle groups in the ternary particle mixture, we defined the NTA measured sizes ranging from 0 to 150 nm as the 100 nm particle group, from 150 nm to 300 nm as the 200 nm particle group, and above 300 nm as 500 nm particle category. The separation purity for 500 nm, 200 nm and 100 nm particles are 82%, 70%, and 90%, with enrichment factors of 2.95, 1.67 and 3, respectively, Fig. 5(C) and (D).
4.5 Size-based separation of EVs
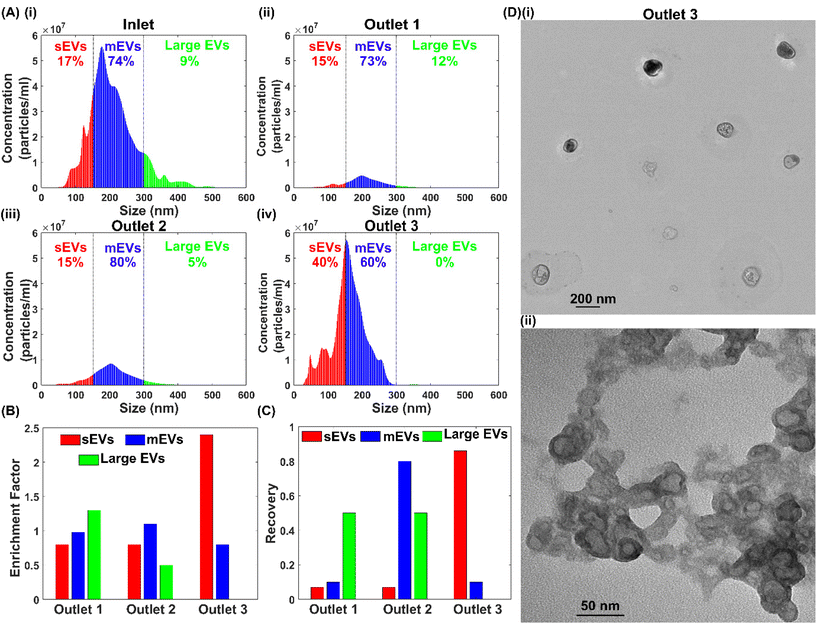
Extracellular vesicles are a group of nanoparticles enclosed by a lipid bilayer present in biofluids such as blood, serum, plasma, saliva, urine and breast milk.31 Depending on the sizes, EVs have been classified into exosomes (30–150 nm), microvesicles (100–1000 nm) and apoptotic bodies (1–4 μm). EVs play a critical role in intercellular communication, and the separation of EVs is an essential step to use them as biomarkers in various diseases and immunotherapies.32,33 In this work, we employed the developed viscoelastic microfluidic device to separate EVs depending on their sizes. The migration behaviour of the EVs is similar to the polystyrene particles because they have a similar spherical shape and are close in density.34,35 Therefore, we used the same operating conditions of the ternary particle mixture separation to sort EVs based on their sizes.The EVs were obtained from cell culture media of MDA-MB-231 human breast cancer cells. The raw sample was characterised by NTA and EVs’ sizes ranged from 30 nm to 520 nm with a higher concentration between 150 nm to 300 nm, Fig. 6(A). Then, the EVs were processed through the microfluidic device and collected respectively from different outlets. The NTA results of collected samples showed that the EVs had migrated similarly depending on their sizes. Here, we defined EVs with sizes ranging from 30 nm to 150 nm as small EVs (sEVs), 150 nm to 300 nm as medium EVs (mEVs), and 300 nm to 500 nm as large EVs. It showed that most of the sEVs remained near the channel sidewalls and exited through side outlets 3. The peak concentrations of particle size were approximately 154 nm for outlet 3 and 204 nm for outlet 2, which generally agrees with the particle testing results, Fig. 6(A). Fig. 6(B) and (C) are purity enrichment factors and recoveries of three EV groups. More than 86% of the sEVs were recovered at outlet 3, with the purity enhanced from 17% to 40%. At outlet 2, mEVs were sorted with both purity and recovery rate of ∼80% in a single sorting process. At outlet 3, the recovery rate of large EVs is ∼50%, with purity improved from 9% to 12%. The enrichment factor for large EVs, mEVs and sEVs are 1.3, 1.1 and 2.4, respectively. Furthermore, consecutive processing of samples from outlets can further purify the EVs of specific groups. Finally, we used the transmission electron microscopy (TEM) to EVs after the separation, and TEM images of EVs from outlet 3 show the intact morphology of EVs after separation and the consistent size range with the NTA measurement, Fig. 6(D).
Furthermore, we have compared the performance of the conventional and reported microfluidic techniques with our device, as shown in Table S1.† We can see that conventional techniques such as ultracentrifugation, ultrafiltration, and size exclusion chromatography generally have a higher throughput than microfluidic techniques. However, the separation efficiency of ultracentrifugation is relatively lower than the developed viscoelastic microfluidic device. This is because the centrifugal force on nanoparticles is very weak even at ultra-high rotational speeds and insufficient settlement of small nanoparticles leads to considerable loss of small nanoparticles during centrifugation. Conventional and microfluidic ultrafiltration and size exclusion chromatography (SEC) have a separation efficiency similar to that of our device. However, in ultrafiltration and microfluidic filtration, nanoparticles experience high shear stress during the passage through the membrane nanopores, which is prone to breaking the biological particles. Moreover, larger particles trapped on the membrane during the filtration process will eventually cause clogging and malfunction of the membrane. Size exclusion chromatography uses stationary porous beads with defined pore sizes to separate nanoparticles depending on their travelling speeds. SEC needs specialised equipment, and irreversible adsorption of nanoparticles to the stationary phase is also a drawback.10,36
Microfluidic techniques such as acoustophoresis, electrophoresis, magnetophoresis, inertial and pinched flow fractionation suffer from two to eight times lower separation resolution than our work. Deterministic lateral displacement (DLD) is limited by its lower separation efficiency and smaller throughput than our device, although it has a comparable separation resolution. Moreover, the fabrication cost for the DLD devices with nanoscale pillar arrays is more costly than ours, where channels are in tens of micrometres. Compared to the reported viscoelastic microfluidic techniques, our works achieved enhanced separation resolution and simultaneous fractionation of samples into three size groups. The above analysis shows that our device is advantageous for higher separation resolution, a simple device design, lower device costs, and easier operation. We also acknowledge that the reported throughput of the developed device is much lower compared to inertial microfluidics and conventional techniques. The parallelisation design for the microfluidic device with parallel straight channels will be a promising strategy to enhance the overall throughput, Fig. S6.† To fabricate the parallelised device, the multi-layer stacking method can be used. This will be one of the future research works.
5 Conclusions
In this work, we systematically investigated the sorting of submicron particles in a viscoelastic co-flow microfluidic device. We studied the effects of particle size, flow rate ratio of sheath to sample flows, total flow rate, and polyethylene oxide (PEO) concentration on the particle migration behaviour. To demonstrate the potential of the microfluidic device to sort submicron particles, the viscoelastic microfluidic devices were applied to separate a ternary mixture of polystyrene beads (100 nm, 200 nm and 500 nm). The separation purities of 100 nm, 200 nm and 500 nm particles are over 90%, 70% and 82%, respectively. Besides, we applied the device for the separation of differently-sized extracellular vesicles. The results showed a recovery rate of 86%, 80% and 50% for small EVs (<150 nm), medium EVs (150–300 nm) and large EVs (>300 nm), with purity enrichment of 2.4, 1.1 and 1.3, respectively. In conclusion, viscoelastic microfluidics offers a promising platform to separate submicron particles with a simple device design and higher separation resolution, indicating broad biomedical and clinical applications.Author contributions
J. Z. and N.-T. N. conceived the idea and supervised the project. S. H. designed and fabricated the device, prepared samples, carried out the experiments, analysed the data and wrote the manuscript. L. O., H. C., and H. H. contributed to characterisation and biological sample preparation. All authors provided critical feedback and read, revised and approved the manuscript.Conflicts of interest
The authors have declared no conflict of interest.Acknowledgements
The authors acknowledge the support from the Australian Research Council (ARC) Discovery Project (Grant No. DP180100055), ARC DECRA fellowship (Grant No. DE210100692),ARC Future Fellowships (FT180100361), and Australian Laureate Fellowship (Grant No. FL230100023).References
- P. Li, M. Kaslan, S. H. Lee, J. Yao and Z. Gao, Theranostics, 2017, 7, 789–804 CrossRef CAS PubMed.
- W. Wang, J. Luo and S. Wang, Adv. Healthcare Mater., 2018, 7, e1800484 CrossRef PubMed.
- T. Hamacher, J. T. W. Berendsen, J. E. van Dongen, R. M. van der Hee, J. J. L. M. Cornelissen, M. L. W. J. Broekhuijse and L. I. Segerink, Lab Chip, 2021, 21, 4477–4486 RSC.
- S. Chan Hong, J. Sang Kang, J. Eun Lee, S. Soo Kim and J. Hee Jung, Lab Chip, 2015, 15, 1889–1897 RSC.
- L. Calzolai, D. Gilliland, C. P. Garcìa and F. Rossi, J. Chromatogr. A, 2011, 1218, 4234–4239 CrossRef CAS PubMed.
- H. Cai, M. Chen, F. Du, S. Matthews and H. Shi, Water Res., 2021, 203, 117509 CrossRef CAS PubMed.
- M. Bouri, R. Salghi, M. Algarra, M. Zougagh and A. Ríos, RSC Adv., 2015, 5, 16672–16677 RSC.
- D. Maiti, X. Tong, X. Mou and K. Yang, Front. Pharmacol., 2019, 9, 1401 CrossRef PubMed.
- C. M. Abreu, B. Costa-Silva, R. L. Reis, S. C. Kundu and D. Caballero, Lab Chip, 2022, 22, 1093–1125 RSC.
- S. Hettiarachchi, H. Cha, L. Ouyang, A. Mudugamuwa, H. An, G. Kijanka, N. Kashaninejad, N.-T. Nguyen and J. Zhang, Lab Chip, 2023, 23, 982–1010 RSC.
- T. Salafi, K. K. Zeming and Y. Zhang, Lab Chip, 2016, 17, 11–33 RSC.
- K. Lee, H. Shao, R. Weissleder and H. Lee, ACS Nano, 2015, 9, 2321–2327 CrossRef CAS PubMed.
- L. Shi, A. Rana and L. Esfandiari, Sci. Rep., 2018, 8, 6751 CrossRef PubMed.
- W. Zhao, R. Cheng, S. H. Lim, J. R. Miller, W. Zhang, W. Tang, J. Xie and L. Mao, Lab Chip, 2017, 17, 2243–2255 RSC.
- P. Paiè, T. Zandrini, R. M. Vázquez, R. Osellame and F. Bragheri, Micromachines, 2018, 9, 200 CrossRef PubMed.
- J. Zhang, S. Yan, D. Yuan, G. Alici, N.-T. Nguyen, M. E. Warkiani and W. Li, Lab Chip, 2015, 16, 10–34 RSC.
- T. Salafi, Y. Zhang and Y. Zhang, Nano-Micro Lett., 2019, 11, 77 CrossRef PubMed.
- L.-G. Liang, M.-Q. Kong, S. Zhou, Y.-F. Sheng, P. Wang, T. Yu, F. Inci, W. P. Kuo, L.-J. Li, U. Demirci and S. Wang, Sci. Rep., 2017, 7, 46224 CrossRef PubMed.
- S. Wang, Z. Liu, S. Wu, H. Sun, W. Zeng, J. Wei, Z. Fan, Z. Sui, L. Liu and X. Pan, Electrophoresis, 2021, 42, 2223–2229 CrossRef CAS PubMed.
- J. Zhou and I. Papautsky, Microsyst. Nanoeng., 2020, 6, 1–24 CrossRef PubMed.
- D. Yuan, Q. Zhao, S. Yan, S.-Y. Tang, G. Alici, J. Zhang and W. Li, Lab Chip, 2018, 18, 551–567 RSC.
- T. Zhang, A. K. Cain, L. Semenec, L. Liu, Y. Hosokawa, D. W. Inglis, Y. Yalikun and M. Li, Anal. Chem., 2023, 95, 2561–2569 CrossRef CAS PubMed.
- J. Y. Kim, S. W. Ahn, S. S. Lee and J. M. Kim, Lab Chip, 2012, 12, 2807–2814 RSC.
- N. Xiang, Z. Ni and D. Wu, Sens. Diagn., 2023, 2, 929–937 RSC.
- C. Liu, J. Zhao, F. Tian, J. Chang, W. Zhang and J. Sun, J. Am. Chem. Soc., 2019, 141, 3817–3821 CrossRef CAS PubMed.
- C. Liu, J. Guo, F. Tian, N. Yang, F. Yan, Y. Ding, J. Wei, G. Hu, G. Nie and J. Sun, ACS Nano, 2017, 11, 6968–6976 CrossRef CAS PubMed.
- Y. Zhou, Z. Ma, M. Tayebi and Y. Ai, Anal. Chem., 2019, 91, 4577–4584 CrossRef CAS PubMed.
- F. Shiri, H. Feng, K. E. Petersen, H. Sant, G. T. Bardi, L. A. Schroeder, M. L. Merchant, B. K. Gale and J. L. Hood, Sci. Rep., 2022, 12, 6146 CrossRef CAS PubMed.
- Y. Meng, Y. Zhang, M. Bühler, S. Wang, M. Asghari, A. Stürchler, B. Mateescu, T. Weiss, S. Stavrakis and A. J. deMello, Sci. Adv., 2023, 9, eadi5296 CrossRef CAS PubMed.
- A. M. Leshansky, A. Bransky, N. Korin and U. Dinnar, Phys. Rev. Lett., 2007, 98, 234501 CrossRef CAS PubMed.
- S. Zhang, J. Deng, J. Li, F. Tian, C. Liu, L. Fang and J. Sun, TrAC, Trends Anal. Chem., 2022, 157, 116817 CrossRef CAS.
- J. Kowal, G. Arras, M. Colombo, M. Jouve, J. P. Morath, B. Primdal-Bengtson, F. Dingli, D. Loew, M. Tkach and C. Théry, Proc. Natl. Acad. Sci. U. S. A., 2016, 113, E968–E977 CrossRef CAS PubMed.
- S. Razavi Bazaz, S. Zhand, R. Salomon, E. H. Beheshti, D. Jin and M. E. Warkiani, Appl. Mater. Today, 2023, 30, 101730 CrossRef.
- D. Raju, S. Bathini, S. Badilescu, A. Ghosh and M. Packirisamy, Micromachines, 2022, 13, 730 CrossRef PubMed.
- K. Brennan, K. Martin, S. P. FitzGerald, J. O'Sullivan, Y. Wu, A. Blanco, C. Richardson and M. M. Mc Gee, Sci. Rep., 2020, 10, 1039 CrossRef CAS PubMed.
- C.-S. Hong, S. Funk, L. Muller, M. Boyiadzis and T. L. Whiteside, J. Extracell. Vesicles, 2016, 5, 29289 CrossRef PubMed.
Footnote |
| † Electronic supplementary information (ESI) available. See DOI: https://doi.org/10.1039/d3nr05410a |
| This journal is © The Royal Society of Chemistry 2024 |

