 Open Access Article
Photochemical synthesis, characterization, and electrochemical sensing properties of CD–AuNP nanohybrids†
Giuseppe
Nocito‡
 a,
Rayhane
Zribi
b,
Meryam
Chelly
b,
Luca
Pulvirenti
c,
Giuseppe
Nicotra
d,
Corrado
Bongiorno
d,
Antonino
Arrigo
 *ae,
Barbara
Fazio
fg,
Giovanni
Neri
b,
Francesco
Nastasi
*aef and
Sabrina
Conoci
 afh
afh
aDepartment of Chemical, Biological, Pharmaceutical and Environmental Sciences, University of Messina, Viale Ferdinando Stagno d'Alcontres, 31, 98166 Messina, Italy. E-mail: antonino.arrigo@unime.it
bDepartment of Engineering, University of Messina, Contrada Di Dio, 98166 Messina, Italy
cDepartment of Chemical Sciences, University of Catania, Viale Andrea Doria, 6, 95125 Catania, Italy
dConsiglio Nazionale delle Ricerche, Istituto per la Microelettronica e Microsistemi (CNR-IMM), Strada VIII, n. 5, Zona Industriale, Catania, 1-95121 Italy
eInteruniversitary Research Center for Artificial Photosynthesis (Solar Chem, Messina Node), Viale Ferdinando Stagno d'Alcontres, 31, 98166 Messina, Italy
fConsiglio Nazionale delle Ricerche, URT Lab-Sens Beyond Nano – Department of Physical Science and Technologies of Matter, Viale Ferdinando Stagno d'Alcontres, 31, 98166 Messina, Italy
gConsiglio Nazionale delle Ricerche, Istituto per i Processi Chimico Fisici (CNR-IPCF), Viale Ferdinando Stagno d'Alcontres, 37, 98158 Messina, Italy
hDepartment of Chemistry “Giacomo Ciamician”, University of Bologna, Via Selmi, 2, 40126 Bologna, Italy
First published on 19th January 2024
Abstract
Among the existing nanosystems used in electrochemical sensing, gold nanoparticles (AuNPs) have attracted considerable attention owing to their intriguing chemical and physical properties such as good electrical conductivity, high electrocatalytic activity, and high surface-to-volume ratio. However, despite these useful characteristics, there are some issues due to their instability in solution that can give rise to aggregation phenomena and the use of hazardous chemicals in the most common synthetic procedures. With an aim to find a solution to these issues, recently, we prepared and characterized carbon dots (CDs), from olive solid wastes, and employed them as reducing and capping agents in photo-activated AuNP synthesis, thus creating CD–Au nanohybrids. These nanomaterials appear extremely stable in aqueous solutions at room temperature, are contemporary, and have been obtained using CDs, which are exclusively based on non-toxic elements, with an additional advantage of being generated from an otherwise waste material. In this paper, the synthesis and characterization of CD–Au nanohybrids are described, and the electrochemical experiments for hydroquinone detection are discussed. The results indicate that CD–Au acts as an efficient material for sensing hydroquinone, matching a wide range of interests in science from industrial processes to environmental pollution.
1. Introduction
Gold nanoparticles (AuNPs) are subjected to the quantum size effect and display surface plasmon resonance (SPR), which gives rise to their photophysical properties,1 such as photostability, high molar extinction coefficient, and optical tunability, as demonstrated by the dependence of their localized surface plasmon resonance (LSPR) band as a function of particle diameter,2 shape,3 and aggregation.4 However, in most common procedures to synthesize AuNPs, external reducing agents (e.g. NaBH4 or hydrazine), sacrificial agents, and capping layers (e.g. cetyltrimethylammonium bromide, polyvinylpyrrolidone) are needed, which in some cases are hazardous for the environment and the human health.5 Currently, researchers are focusing on finding alternative sustainable ways to metallic nanoparticle synthesis,6 possibly involving non-toxic reagents obtained from waste materials.7AuNPs have favorable chemical and physical properties, such as good electrical conductivity, high electrocatalytic activity, and specific surface area. For these advantageous characteristics, electrochemical sensors based on AuNPs have been proposed for the detection of many analytes.8–11 Further, owing to their high reactivity, AuNPs avoid the accumulation of oxidation products on the electrode surface, which is a serious problem for electrochemical sensors, leading to electrode fouling with loss of sensitivity, selectivity, and reproducibility. However, the high surface energy of AuNPs makes them unstable and leads to particle aggregation with a loss of surface area and reactivity.
To enhance their stability, the deposition/direct growth of AuNPs on support materials is an appropriate choice. Among the support materials, carbon dots (CDs) have attracted remarkable interest because of their photo and redox properties, chemical stability, low toxicity, biocompatibility, and large surface-active area. Furthermore, the reduction of AuNPs directly on the surface of CDs is easy and does not require additional reducing agents.12
In this view, CDs appear as intriguing candidates to act as a reducing as well as a capping agent in AuNPs synthesis to create a CD–Au nanohybrid material. CDs are carbon-based nanoparticles,13 serendipitously discovered in 2004 during an electrophoretic purification of carbon nanotube fragments.14 Since their discovery, much attention has been paid to CDs, so that such a category of nanomaterials now includes carbon nanodots (CNDs), carbon quantum dots (CQDs), and graphene quantum dots (GQDs).15 Generally, CDs are quasi-spherical carbonaceous nanoparticles with amorphous or crystalline cores surrounded by polar groups (e.g., hydroxyls, carboxylates, or amines).15 They are exclusively composed of non-toxic elements (C, N, and O) and possess several useful properties, such as (i) biocompatibility, (ii) photostability, (iii) low toxicity, (iv) the possibility to be synthesized starting from waste materials, and (v) high luminescence quantum yield due to the recombination of hole–electron pairs generated upon UV/Vis light absorption.16 Thanks to all these characteristics, CDs are involved in a plethora of applications: chemical and biological sensing,1,17–19 biomedicine,20,21 solar energy conversion,22,23 optoelectronics,24 cancer diagnosis and therapy,13 and so on.25
In previous years, some research groups have investigated the capping ability of CDs to gold nanoparticles, generating nanoalloys or nanocomposites26–30 following a thermal reduction process. Another promising strategy to synthesize metallic nanoparticles is the photochemical route, where organic chromophores are transformed into free radicals upon UV light absorption and play the role of reducing agents in the synthesis.31–33
Inspired by such considerations, we prepared and studied CD–Au nanohybrid structures, following a photochemical synthetic strategy, where functionalized carbon dots (CD-E), once photoexcited by blue light, reduce Au(III) to Au(0). The as-prepared samples have been characterized, and their photophysical properties as well as efficiency as electrode materials for developing electrochemical sensors, have been investigated. The electrochemical characteristics were evaluated by cyclic voltammetry (CV) and electrochemical impedance spectroscopy (EIS). Further, the monitoring of hydroquinone (HQ) as a model phenolic analyte has been investigated. HQ plays a key role in a wide range of industrial processes (e.g., paper manufacturing or photography) and the biomedical field, and it is considered a toxic pollutant for the water environment.34 Thus, the detection and quantification of HQ by means of simple sensors is of wide interest nowadays and can facilitate analyses in the environmental and clinical fields.
2. Experimental
2.1 Materials
All the chemicals were purchased from Merck-Sigma-Aldrich in the commercially available highest purity grade and used without further purification. HPLC-grade ultrapure water (HPLC Plus, Sigma-Aldrich) was used for all the experimental steps.2.2 Carbon dot preparation (CDs)
Carbon dots (CDs) were prepared using the method by Sawalha et al.35 Briefly, olive solid wastes collected from the Mediterranean region, Calabria (Italy), were washed several times with boiling deionized water until a clear solution appeared; then, they were dried overnight in an oven (60 °C), and pyrolyzed for 1 h at 600 °C in a muffle furnace in the absence of air. The resulting material was finely ground and suspended in ultrapure water (10 mg mL−1, 100 mL). The mixture was sonicated (ultrasonic bath Bandelin Sonorex RK 100 H, Bandelin electronic GmbH & Co. KG, Berlin, Deutschland) for 10 min and then 1 mL of hydrogen peroxide (H2O2 sol. 30% w/w) was added and refluxed for 90 min whilst stirring. The reaction mixture was purified by centrifugation at 6800 RCF for 20 min, and the supernatant was syringe-filtered (Sartorius Minisart RC 0.2 μm, Sartorius AG, Göttingen, Deutschland), obtaining the final CDs colloidal dispersion. A production yield of 2% (CDs dispersion concentration 0.2 mg mL−1) was estimated by weighing after solvent evaporation under reduced pressure and subsequent drying in the oven.2.3 Ethylenediamine functionalization of carbon dots (CD-E)
50 mL of 0.2 mg mL−1 carbon dot (CDs) aqueous colloidal dispersion was diluted with 50 mL of ultrapure water and degassed at 0 °C for 1 h with Ar flow in a two-neck round bottom flask before the pH was modified to 4 by adding 0.1 M HCl. As the next step, 159.6 mg of (N-(3-dimethylaminopropyl)-N′-ethylcarbodiimide hydrochloride) – EDC hydrochloride, and subsequently, 143.8 mg of N-hydroxysuccinimide were added. The reaction mixture was magnetically stirred for 1 h in the ice bath. Ethylenediamine (5.56 mL) was poured, and the reaction was continued for 1 h under ice and overnight at room temperature, maintaining the inert atmosphere (Fig. 1). The reaction mixture was purified by dialysis (MWCO = 14 kDa) using deionized water for two days, changing the water every 2–8 h obtaining a light-yellow CD-ethylenediamine (CD-E) dispersion of about 0.1 mg mL−1. The concentration of CD-E was quantified by weighing the residue obtained from solvent evaporation.2.4 Carbon dots–Au (CD–Au) nanohybrid preparation
A 4.77 × 10⁻³ M mother solution of tetrachloroauric(III) acid was prepared by dissolving 16.2 mg of gold(III) chloride hydrate (HAuCl4·xH2O) in 10 mL of ultrapure water.HAuCl4 mother solution (2.5 × 10⁻⁴ mol L−1) was added to an aqueous dispersion of CD-ethylenediamine (100 mL, 0.1 mg mL−1) under vigorous stirring. The mixture was irradiated with a blue (420–430 nm) LED for 310 min and left under stirring overnight in the darkness (Fig. 2). The crude was purified by filtration to remove larger aggregates and subsequent centrifugation (1 h, 8500 RCF). The supernatant was discarded because only unreacted CDs were present according to UV/Vis absorption and fluorescence spectra, while the precipitate was collected, washed two times with ultrapure water, and sonicated for 2 h. CD–Au nanohybrid was stored at RT in ultrapure water dispersion, appreciating at least 2 months of stability, and was characterized without further purification. All the reaction steps and the reaction kinetics were monitored via UV/Vis absorption spectroscopy.
2.5 Spectroscopic and morphological characterizations
The morphology of the synthesized samples was determined through transmission electron microscopy (TEM) and scanning electron microscopy (SEM). TEM measurements were performed by depositing the sample onto a copper grid with a lacey carbon support film. The samples were vacuum-dried overnight before the analysis. A JEOL ARM200F equipped with a Cold Field Emission Electron Gun (CFEG) and a spherical aberration corrector providing a spatial resolution of 0.6 Å was used for the acquisition of HR-TEM images. SEM was performed using a field emission ZEISS SUPRA VP 55 microscope equipped with an INCA-Oxford windowless detector for energy dispersive X-ray spectroscopy (EDS). Samples were deposited onto a pure Si wafer and analysed without further treatments.UV/Vis absorption and photoluminescence spectra were recorded in air-equilibrated colloidal dispersions in ultrapure water. The UV/Vis spectrophotometer was a Jasco V-560 (Jasco Co., Tokyo, Japan). Fluorescence steady-state spectrofluorometer was a Horiba Jobin–Yvon FluoroMax-P (mod. F-111) (Horiba Ltd, Kyoto, Japan). Time-resolved photoluminescence decays were measured on an Edinburgh OB900 time-correlated single-photon-counting (Edinburgh Instruments Ltd, Livingston, UK) spectrometer equipped with Hamamatsu PL2 408 nm laser diode (pulse width: 59 ps) (Hamamatsu Photonics K.K., Hamamatsu city, Japan). A bi-exponential reconvolution fitting was applied to estimate the luminescence lifetimes. Alumina suspension in deionized water was used for the instrument response function evaluation.
FT-IR analysis was performed on Si/SiO2 drop-casted wafers using the transmission technique on a Jasco FTIR 4600 LE spectrometer (Jasco Co., Tokyo, Japan) in the spectral range of 560–4000 cm−1, 4 cm−1 resolution, and 64 scans per sample. Raman spectra were acquired with a Horiba Jobin–Yvon (Horiba Ltd, Kyoto, Japan) LabRAM HR800 micro-Raman spectrometer equipped with 1800 lines per mm grating and a Peltier cooled CCD detector (Horiba, Synapse model). A 3 mW 514.5 nm Ar+ laser (Spectra-Physics 2060, Newport Corp., CA – USA) was focused onto 1 μm2 of the samples by a 100× (N.A. = 0.9) objective (Olympus BX41 microscope – Olympus Co., Tokyo, Japan). X-ray photoelectron spectroscopy (XPS) analysis was performed on silicon-deposited samples by means of a PHI 5600 ESCA-Auger spectrometer (Physical Electronics Inc., Chanhassen, MN, USA), with a standard Mg-Kα (1253.6 eV) X-ray source. The XPS binding energy (BE) scale was calibrated on the C 1s peak of adventitious carbon at 285.0 eV.
The zeta (ζ) potential of the colloidal dispersion samples was estimated thanks to the dynamic light scattering (DLS) technique. Each measurement was carried out in triplicate on freshly prepared ultrapure water dispersion at 25 ± 1 °C with a Malvern Nano ZS (Malvern PANalytical Plc., Malvern, UK) equipped with a He–Ne laser (λ = 633 nm, 4 mW) using the NIBS (173 degrees) configuration.
2.6 Electrochemical characterizations
For the electrochemical characterizations, the modified electrodes were fabricated by drop-casting (50 μL) of the synthesized CDs samples on the SPCE platform (DropSens, Spain). Cyclic voltammetry (CV), square wave voltammetry (SWV), and electrochemical impedance spectroscopy (EIS) analyses were performed using a DropSens Stat 400 potentiostat and a potentiostat galvanostat, respectively. The instrument is empowered by the Dropview 8400 software for data acquisition. Electrochemical tests were performed in 1 M phosphate buffer (PBS) at a scan rate of 50 mV s−1. All experiments were performed at room temperature.3. Results and discussion
3.1 Synthesis and characterization of CDs and CD-ethylenediamine
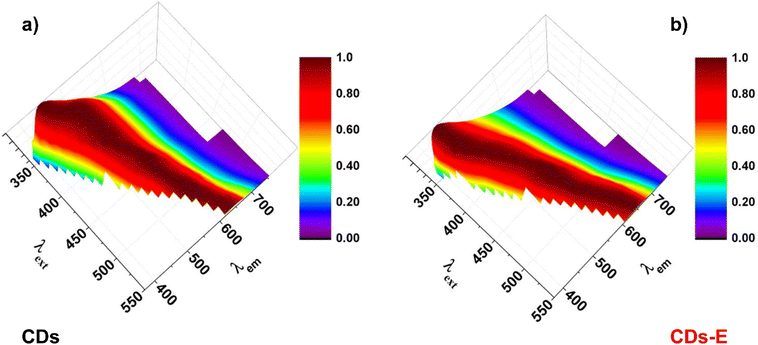
Carbon dots (CDs) were prepared by recycling the biomass waste of olive oil production. Olive solid waste was pyrolyzed and ground until a fine carbonaceous powder was obtained. CDs were produced with a modified hydrothermal method35 using hydrogen peroxide as the oxidizing agent, a recognized green chemical whose byproduct is water.7,36 H2O2 addition enables CDs surface functionalization with polar groups, such as hydroxyls (–OH) and carboxyls/carboxylates (–COOH/–COO−),35 which confer aqueous dispersibility and hence stability to the colloidal dispersion. Exploiting the carboxylic moieties and the EDC coupling reaction, it was possible to further functionalize the surface of CDs with amine and amide groups via ethylenediamine anchoring. Typically, hydroxyls on the surface of CDs are efficient anchoring groups to gold nanoparticles; nevertheless, we found that amine and amide groups are pivotal for the efficiency of the reduction and the final nanohybrid stability.Both the samples present excitation wavelength-dependent luminescence, in the excitation wavelength range of 250–550 nm (Fig. 3), as typical for these nanosystems, and this behaviour can be attributed to the particle size or to the surface functional groups or to defects in the structure, even if the reason of CDs luminescence dependence by light excitation still remains unclear.
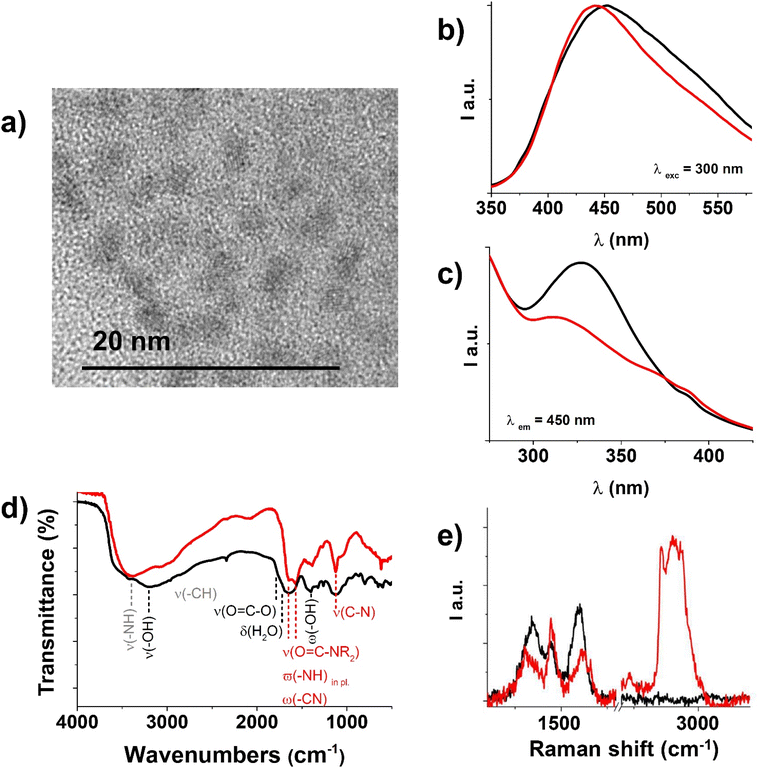
In Fig. 4b, the emission spectra of CDs and CD-E at λexcitation = 300 nm are reported, where it is visible that CD-E emission maximum is slightly shifted to higher energies and is different in shape compared to CDs. Fig. 4c illustrates the excitation spectra (λemission = 450 nm) where two bands are visible, matching the bands in the absorption spectra of CD-E and CDs. For the complete steady-state luminescence spectroscopy characterizations, see E.S.I. Fig. S1, S2 and S4, S5.† In an aerated solution, the time-resolved luminescence decays (vide E. S.I. Table S1 and Fig. S6†) biexponentially with two lifetimes of 2 ns and 8 ns, keeping in mind that a wide range of nanoparticles of different sizes contribute to these values.
FT-IR spectra in Fig. 4d clarify the extent of ethylenediamine functionalization of CDs. In the CD-E spectrum, the peaks at 3405 cm−1, 3000–2900 cm−1, and 1130 cm−1 are evident and can be attributed respectively to –NH stretching,40 –CH stretching,41 and amine –C–N stretching41 introduced by ethylenediamine; while in the spectrum of CDs, the peaks at 3200 and 1400 cm−1 of –OH stretching41 and deformation42 appear intense. Ethylenediamine covalent anchoring is recognizable by the presence of a doublet band from 1650 to 1550 cm−1 related to the overlap of the secondary amide carbonyl stretching, –NH in-plane vibrations, and –C–N vibration absorptions.41,43 Instead, the carbonyl absorption band in CDs is broad and covered by the intense –OH bending vibrations from adsorbed water at 1645 cm−1.44 A small band at around 1760 cm−1 is attributable to the C![[double bond, length as m-dash]](https://www.rsc.org/images/entities/char_e001.gif) O stretching vibration of carboxylic/carboxylate moieties.41
O stretching vibration of carboxylic/carboxylate moieties.41
The Raman spectrum of CD-E (red line in Fig. 4e) further confirms their functionalization with ethylenediamine. The intense band within the 2700–3200 cm−1 range, not detectable in the CDs spectrum (depicted by the black line), is indeed attributed to the –CH2 stretching vibrations introduced by ethylenediamine.45,46 Additionally, the characteristic peak associated with the scissoring mode of CH2, centered around 1450 cm−1, overlaps with the two prominent D (1350 cm−1) and G bands (1600 cm−1) typical of carbon atom vibrations in CDs, and with the minor band at around 1450 cm−1, which occurs in carbon materials when a degree of amorphization is present.47,48
3.2 Synthesis and characterization of CD–Au nanohybrids
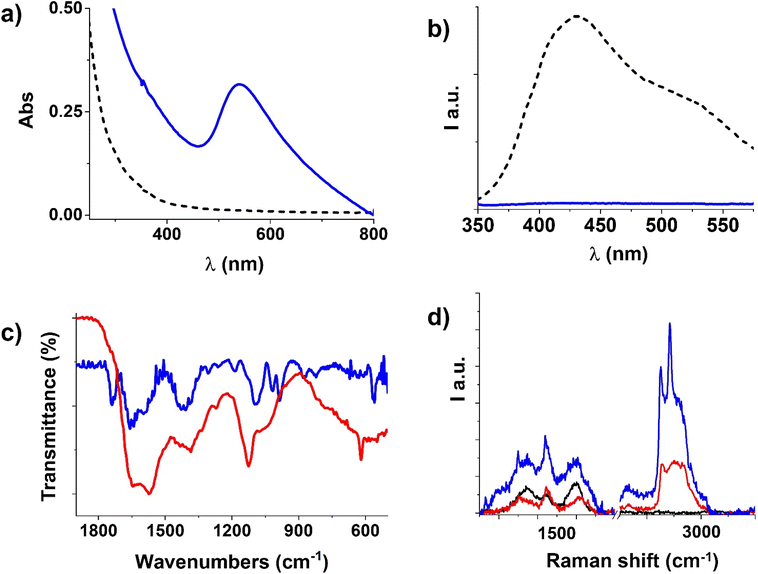
Carbon dots–gold (CD–Au) nanohybrids were produced via visible light-triggered reduction using ethylenediamine functionalized carbon dots (CD-E) as a reducing and capping agent.Irradiation of CD-E in the presence of HAuCl4 (420–430 nm blue LED) resulted in the formation of the characteristic localized surface plasmon resonance (LSPR) band of gold nanoparticles centred at 543 nm, reaching a plateau after around 310 min (Fig. 5a). The reaction occurred in water with CD-E and HAuCl4 as the only reactants without adding any reducing agent, taking advantage of the photoexcitation of CD-E at 420–430 nm (vide E.S.I. Fig. S8a†).
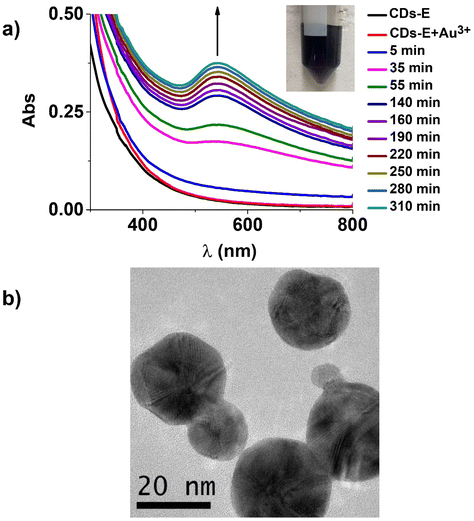 | ||
| Fig. 5 (a) Absorption spectral changes upon 420–430 nm irradiation, CD–Au nanohybrid formation; (b) TEM image of the CD–Au nanohybrid. | ||
A check-out experiment executed in darkness (shown in the E.S.I. Fig. S8b†) demonstrated that light irradiation is crucial for Au(III) reduction, and no LSPR band is detectable for up to 150 min. This evidence suggests that CD-E excited states, populated by blue light irradiation, acted both as electron donors for Au(III) reduction to Au(0) and acceptors for the counterpart. Transmission electron microscopy (TEM) analysis (Fig. 5b and E.S.I. Fig. S10†) revealed that CD–Au nanohybrids had a quasi-spherical shape and a mean diameter of 22 ± 6 nm. The value of ζ-potential for CD–Au aqueous dispersion was −34 ± 1 mV. As reported in the literature,49 the LSPR band maximum of citrate-capped (Turkevich method50) gold nanoparticles is size-dependent, and in particular, for 21 nm nanoparticles, the LSPR is reported to be 521 nm. It is known that this effect is also capping layer dependent,51 and our experimental results (22 nm size, 543 nm LSPR maximum) are not far from the values indicated in the literature, suggesting the influence of CD-E in the produced nanohybrid. Moreover, CD–Au before and after purification (TEM imaging before and after centrifugation are reported in E.S.I. Fig. S10†) were well dispersible and stable for up to 2 months in ultrapure water. Based on these results, it is reasonable to assume that CD-E worked as a capping layer in the synthetic process.
Control experiments substituting CD-E with CDs as reducing and capping agents were performed (vide E.S.I. Fig. S9a†), showing that 1 min of blue light irradiation (420–430 nm LED) triggered a rapid and intense reduction of the gold salt. In the UV/Vis absorption spectrum (vide E.S.I. Fig. S9a†), two LSPR bands were detected: the first one, centred at around 528 nm, is attributable to spherical nanoparticles, and the second one in the NIR region is attributable to complex nanostructures as nanoprisms or nanoflowers.52,53 After a few hours, the system collapsed to insoluble gold aggregates. The quasi-instantaneous reduction was probably not sustained by a powerful capping agent able to make nanoparticles soluble in water, which is an index of the pivotal role of ethylenediamine functionalization of carbon dots. Indeed, amine and amide groups are known for Au(III) complexing ability54 and amine to bind the AuNPs surface.55 A control experiment with CDs in darkness was performed too (vide E.S.I. Fig. S9b†), demonstrating that the reduction process was slower than in the light irradiated sample, and a fine blush pink precipitate was formed, and after two hours almost disappeared. This means that no insoluble gold aggregates were produced because redox processes were in equilibrium and probably controlled by hydroxyl groups on the CDs surface,30 so no stable gold nanoparticles were prepared.
The chemical nature of the CD–Au nanohybrid has also been confirmed by energy-dispersive X-Ray spectroscopy (EDS) analysis coupled with scanning electron microscopy (SEM). EDS analysis showed the presence of carbon, oxygen, gold, and silicon. In particular, the sample average composition indicates a C![[thin space (1/6-em)]](https://www.rsc.org/images/entities/char_2009.gif) :
:![[thin space (1/6-em)]](https://www.rsc.org/images/entities/char_2009.gif) Au ratio equal to 1.25. The atomic percentage of the two elements is comparable, as expected for a sample with these characteristics. To perform the EDX analysis, the sample was placed on a silicon substrate. This explains why the amount of silicon is significantly higher than that of the other elements. Finally, the amount of oxygen, equal to about 2.5 atomic%, is attributable to the oxidized components on the silicon substrate and the surface of the carbon dots. The SEM micrograph and the element atomic percentage distribution from EDS analysis are reported in E.S.I. Fig. S11.† FT-IR characterization (Fig. 6c) shows the presence of CD-E absorption pattern in CD–Au. According to the literature, the doublet band from 1650 to 1550 cm−1 is a relevant indication of amino groups binding the surface of AuNPs. By comparing CD-E and CD–Au spectra in this area, slight shifts and alterations in the intensity ratio were found, suggesting the interaction between CD-E and nanostructured gold.56 Raman characterization (Fig. 6d) reveals the presence of the CD-E pattern in the CD–Au spectrum (Fig. 6d, blue line). The amplification of the signal, reasonably due to the SERS (Surface-Enhanced Raman Spectroscopy) effect, highlights the intimate contact, or the nanohybridization, between nanostructured gold and CD-E. As further confirmation of the bonding between CD-E and gold, the CDs luminescence is quenched after reaction with gold. According to the dynamics of luminescence quenching and considering the short emission lifetime of CDs (2 ns and 8 ns), the quenching cannot occur via a dynamic – collisional – mechanism, but it is expected to happen following a static mechanism, which means that the CD-E and Au are physically bonded.56
Au ratio equal to 1.25. The atomic percentage of the two elements is comparable, as expected for a sample with these characteristics. To perform the EDX analysis, the sample was placed on a silicon substrate. This explains why the amount of silicon is significantly higher than that of the other elements. Finally, the amount of oxygen, equal to about 2.5 atomic%, is attributable to the oxidized components on the silicon substrate and the surface of the carbon dots. The SEM micrograph and the element atomic percentage distribution from EDS analysis are reported in E.S.I. Fig. S11.† FT-IR characterization (Fig. 6c) shows the presence of CD-E absorption pattern in CD–Au. According to the literature, the doublet band from 1650 to 1550 cm−1 is a relevant indication of amino groups binding the surface of AuNPs. By comparing CD-E and CD–Au spectra in this area, slight shifts and alterations in the intensity ratio were found, suggesting the interaction between CD-E and nanostructured gold.56 Raman characterization (Fig. 6d) reveals the presence of the CD-E pattern in the CD–Au spectrum (Fig. 6d, blue line). The amplification of the signal, reasonably due to the SERS (Surface-Enhanced Raman Spectroscopy) effect, highlights the intimate contact, or the nanohybridization, between nanostructured gold and CD-E. As further confirmation of the bonding between CD-E and gold, the CDs luminescence is quenched after reaction with gold. According to the dynamics of luminescence quenching and considering the short emission lifetime of CDs (2 ns and 8 ns), the quenching cannot occur via a dynamic – collisional – mechanism, but it is expected to happen following a static mechanism, which means that the CD-E and Au are physically bonded.56
4. Electrochemical properties
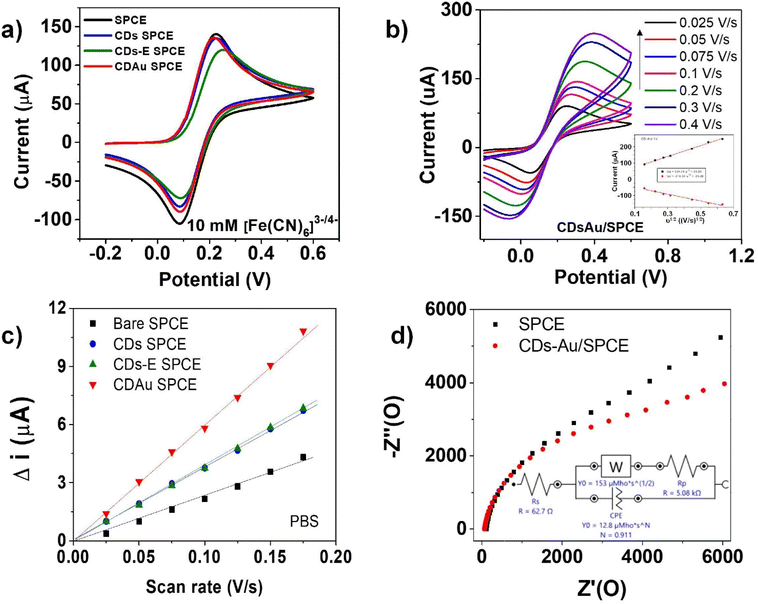
To assess the electrocatalytic performance of the as-prepared CD-Au/SPCE sensor, cyclic voltammetry, square wave voltammetry, and electrochemical impedance spectroscopy analyses were conducted. For comparison, the bare SPCE and modified CDs/SPCE, CD-E/SPCE, and CD-Au/SPCE sensors were also investigated under the same conditions (see Fig. 7a). The CV measurements were performed in 1 M PB (pH 7.4) solution containing 10 mM [Fe(CN)6]3−/4− solution between −0.30 V and +0.60 V at a scan rate of 50 mV s−1. Well-defined oxidation/reduction peaks corresponding to the redox couple of [Fe(CN)6]3−/4− have been observed on all sensors. With the CD-E/SPCE sensor, the peak currents were lower than the peak currents produced by the other sensors, indicating that the presence of a covalently anchored ethylenediamine layer on the CDs surface can hinder the diffusion of ions in the redox probe solution toward the electrode surface.The effect of scan rate (v) on the CV curves is reported in Fig. 7b. In the inset, the observed highly linear relationship with the square root of scan rates (v1/2) for both the anodic and cathodic peak currents (Ip) suggests that the investigated electrochemical process is under diffusional control. From the slopes of the Ip–ν curves shown in Fig. 7c, the increase of the electrochemically active surface area (ECSA) of the sensors after the electrode modification can be clearly noted. The CD-Au/SPCE sensor shows a significantly higher (approximately 2.5 times) ECSA with respect to the bare SPCE electrode; this finding has also been observed in comparison with the electrodes modified with the CDs and CD-E layers. We explain what is observed to be due to an effective nanohybridization of AuNPs and CDs, leading to a high increase of the electrochemical active sites.
Fig. 7d reports a comparison between the Nyquist plots produced by EIS analyses, which is a useful way for probing the electrochemical properties of surface-modified electrodes. The Nyquist plots of bare SPCE and CD–Au/SPCE suggest a higher electron transfer for the latter due to the high conductivity of the CD–Au modifier.
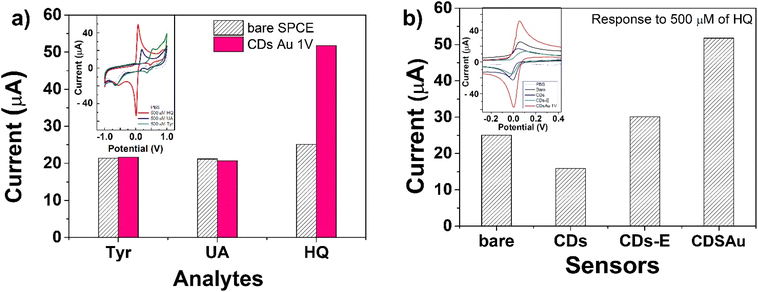
The electrocatalytic performance of the as-prepared CD–Au nanocomposite towards some organic analytes was also assessed by conducting CV analyses. Both the bare SPCE and CD–Au/SPCE sensors were tested under the same conditions for comparison. The electrochemical measurements were performed in 1 M PB (pH 7.4) solution containing 0.5 mM of some representative analytes. Fig. 8 shows the anodic peak intensity values obtained for hydroquinone (HQ), uric acid (UA), and tyrosine (Tyr) on both sensors. The modified sensor resulted in the most effective with enhanced performance for HQ, showing an impressively higher peak intensity with respect to other analytes (see inset in Fig. 8 for the original CV tests) and bare SPCE. It is noteworthy that this behavior was instead not noted for UA and Tyr.
This is because the CD–Au nanohybrid not only increases the number of active sites (consistent with the results of ECSA) but also enhances the inherent electrocatalytic activity of AuNPs for some specific analytes, i.e., HQ.
Based on the latest test, the electrochemical quantification of hydroquinone was conducted using the SWV technique. Fig. 9a displays the SWV responses of the CD–Au/SPCE sensor at different concentrations of HQ in 1 M PBS.
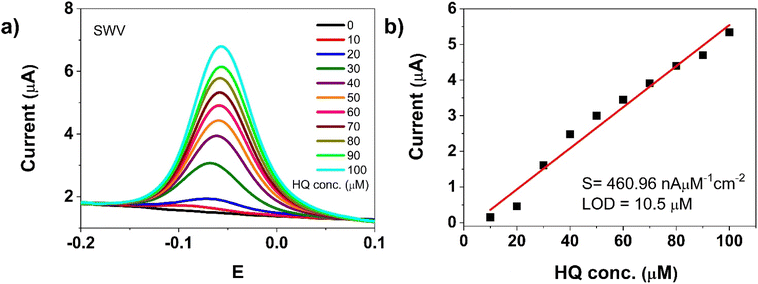 | ||
| Fig. 9 (a) SWVs on CD–Au/SPCE at various concentrations of HQ (0–100 μM) in 1 M PBS; (b) calibration curve from SWV of CD–Au at different HQ concentrations. | ||
Under the adopted conditions, the oxidation peak current of HQ increased linearly with concentration in the detection range from 0 to 100 μM. Calibration curve for CD–Au/SPCE at different HQ concentrations is obtained by plotting the current variation vs. the concentration of the analyte (see Fig. 9b). The linear regression equation for the anodic peak current in this range is: Ipa (μA) = 0.057 [HQ] − 0.22, with a correlation coefficient R2 = 0.97. The sensitivity was computed to be 460.96 nA mM−1 cm−2 and the low detection limit (LOD) at S/N = 3 was 10.5 μM. The detection test of HQ has been repeated after about one week with the same sensor. The calibration curves were elaborated and compared (vide E.S.I. Fig. S12†). The two sets of data points can be fitted well by a linear relationship, indicating furthermore that the response of the CD–Au/SPCE sensor to HQ after this period is about 90% of the initial response. These findings validate the successful performances of the CD–Au/SPCE sensor for HQ detection, including good stability.
The electroanalytical performances of the proposed CD–Au/SPCE sensor have been compared with some hydroquinone electrochemical sensors reported in the recent literature. The performances of the CD–Au/SPCE sensor are comparable with the state-of-the-art previous electrochemical HQ sensors based on AuNPs and other relevant electrode materials, with the advantage of using an easy synthesis procedure and simple sensor fabrication based on a screen-printed platform (Table 1).
| Electrode | Method | Linear range (μM) | LOD (μM) | Ref. |
|---|---|---|---|---|
| Au-gC3N4-MOF-CPE | DPV | 0.005–5 | 1 × 10⁻³ | 57 |
| ERGO-pEBT/AuNPs/GCE | DPV | 0.52–31.4 | 15 × 10−3 | 58 |
| AuNPs-MPS/CPE | SWV | 10–1000 | 1.2 | 59 |
| Cu complex | SWV | 60–2500 | 3 × 10⁻¹ | 60 |
| CuS nanocrystals | CV | 4.5–4500 | 1.5 | 61 |
| GR/GCE | DPV | 1–10 | 1.5 × 10⁻² | 62 |
| dsDNA/PANI/CTS/GCE | DPV | 1.25–340 | 9.65 × 10⁻¹ | 63 |
| LDHf/GCE | DPV | 12–800 | 9 | 64 |
| CDsAu/SPCE | SWV | 10–100 | 10.5 | This work |
5. Conclusions
Carbon dots (CDs) have been prepared from olive solid wastes and functionalized with ethylenediamine (CD-E). Both pure and functionalized versions of CDs have been characterized via UV/Vis, photoluminescence, IR and Raman spectroscopies, TEM, SEM, and quantitative XPS analyses.CDs and CD-E are photoactive materials, displaying an excitation-dependent luminescence, as typical for these nanosystems. Taking advantage of their photochemical properties, CD-E have been used in the photo-activated synthesis of gold nanoparticles (AuNPs), where the CD-E, once photoexcited, reduce Au(III) to Au(0) and at the same time act as a capping layer on the AuNPs, thanks to the amine anchoring groups present on their surface. The so-obtained CD–Au nanohybrids exhibit excellent stability in water dispersion, and they have been characterized using UV/Vis spectroscopy, electronic microscopy techniques, and electrochemical measurements. The electrocatalytic performance of CD–Au has been investigated with some organic analytes, and hydroquinone (HQ) provided the best results.
The proposed synthetic method for CD–Au nanohybrid provides a facile procedure for the modification of the screen-printed electrode surface, which allows the development of an electrochemical sensor for the determination of HQ. The synergistic effects between AuNPs and CDs and the intrinsic electrocatalytic activity of AuNPs resulted in an electrochemical sensor for HQ detection with good electrochemical performances.
Author contributions
L. Pulvirenti: XPS, IR, SEM/EDS analysis, investigations. G. Nicotra, C. Bongiorno: TEM investigations. A. Arrigo, F. Nastasi: preparing the manuscript. R. Zribi, M. Chelly, G. Neri: electrochemical characterizations and sensing studies. G. Nocito: writing, CDs synthesis, CD–Au nanohybrids synthesis, UV/Vis absorption, and photoluminescence investigations. B. Fazio: Raman spectroscopy investigations. G. Neri, S. Conoci, F. Nastasi: investigation, conceptualization, editing, and writing.Conflicts of interest
There are no conflicts of interest to declare.Acknowledgements
This work was funded by the European Union (NextGeneration EU) through the MUR-PNRR project SAMOTHRACE (ECS00000022).References
- K. Saha, S. S. Agasti, C. Kim, X. Li and V. M. Rotello, Chem. Rev., 2012, 112, 2739–2779 CrossRef CAS PubMed.
- C. Ziegler and A. Eychmüller, J. Phys. Chem. C, 2011, 115, 4502–4506 CrossRef CAS.
- V. Amendola, R. Pilot, M. Frasconi, O. M. Maragò and M. A. Iatì, J. Phys.: Condens. Matter, 2017, 29, 203002 CrossRef PubMed.
- K. H. Su, Q. H. Wei, X. Zhang, J. J. Mock, D. R. Smith and S. Schultz, Nano Lett., 2003, 3, 1087–1090 CrossRef CAS.
- Z. Lu, L. W. Giles, B. M. Teo and R. F. Tabor, Colloid Interface Sci. Commun., 2022, 46, 100571 CrossRef CAS.
- P. Raveendran, J. Fu and S. L. Wallen, J. Am. Chem. Soc., 2003, 125, 13940–13941 CrossRef CAS PubMed.
- P. Anastas and N. Eghbali, Chem. Soc. Rev., 2010, 39, 301–312 RSC.
- S. Chelly, M. Chelly, R. Zribi, R. Gdoura, H. Bouaziz-Ketata and G. Neri, ACS Omega, 2021, 6, 23666–23675 CrossRef CAS PubMed.
- W. D. Wang, Z. T. Zhao, Q. Lei, W. L. Zhang, P. W. Li, W. D. Zhang, S. Zhuiykov and J. Hu, Appl. Surf. Sci., 2021, 542, 148539 CrossRef CAS.
- Y. Wang, Z. Zeng, J. Qiao, S. Dong, Q. Liang and S. Shao, Talanta, 2021, 221, 121605 CrossRef CAS PubMed.
- Y. Zhang, X. Du, J. Mao, S. He and Z. Cao, Mater. Chem. Phys., 2024, 311, 128526 CrossRef CAS.
- Z. Hassanvand, F. Jalali, M. Nazari, F. Parnianchi and C. Santoro, ChemElectroChem, 2020, 8, 15–35 CrossRef.
- G. Nocito, G. Calabrese, S. Forte, S. Petralia, C. Puglisi, M. Campolo, E. Esposito and S. Conoci, Cancers, 2021, 13, 1991 CrossRef CAS PubMed.
- X. Xu, R. Ray, Y. Gu, H. J. Ploehn, L. Gearheart, K. Raker and W. A. Scrivens, J. Am. Chem. Soc., 2004, 126, 12736–12737 CrossRef CAS PubMed.
- F. Arcudi, L. Đorđević and M. Prato, Acc. Chem. Res., 2019, 52, 2070–2079 CrossRef CAS PubMed.
- X. T. Zheng, A. Ananthanarayanan, K. Q. Luo and P. Chen, Small, 2015, 11, 1620–1636 CrossRef CAS PubMed.
- S. Crispi, G. Nocito, F. Nastasi, G. Condorelli, A. G. Ricciardulli, P. Samorì, S. Conoci and G. Neri, Sens. Actuators, B, 2023, 390, 133957 CrossRef CAS.
- G. Nocito, F. Puntoriero, S. Conoci, M. Galletta and F. Nastasi, Sensors and Microsystems AISEM 2021 Lecture Notes in Electrical Engineering, 2023, 918.
- S. Sawalha, K. Moulaee, G. Nocito, A. Silvestri, S. Petralia, M. Prato, S. Bettini, L. Valli, S. Conoci and G. Neri, Carbon Trends, 2021, 5, 100105 CrossRef CAS.
- E. C. Dreaden, A. M. Alkilany, X. Huang, C. J. Murphy and M. A. El-Sayed, Chem. Soc. Rev., 2012, 41, 2740–2779 RSC.
- G. Nocito, E. L. Sciuto, D. Franco, F. Nastasi, L. Pulvirenti, S. Petralia, C. Spinella, G. Calabrese, S. Guglielmino and S. Conoci, Nanomaterials, 2022, 12, 885 CrossRef CAS PubMed.
- A. Arrigo, A. M. Cancelliere, M. Galletta, A. Burtone, G. Lanteri, F. Nastasi and F. Puntoriero, Mater. Adv., 2023, 4, 5200–5205 RSC.
- G. A. M. Hutton, B. C. M. Martindale and E. Reisner, Chem. Soc. Rev., 2017, 46, 6111–6123 RSC.
- E. A. Stepanidenko, E. V. Ushakova, A. V. Fedorov and A. L. Rogach, Nanomaterials, 2021, 11, 364 CrossRef CAS PubMed.
- G. Calabrese, G. De Luca, G. Nocito, M. G. Rizzo, S. P. Lombardo, G. Chisari, S. Forte, E. L. Sciuto and S. Conoci, Int. J. Mol. Sci., 2021, 22, 11783 CrossRef CAS PubMed.
- V. Amendola, R. Pilot, M. Frasconi, O. M. Marago and M. A. Iati, J. Phys.: Condens. Matter, 2017, 29, 203002 CrossRef PubMed.
- P. F. Liu, L. Wang, K. R. Zhao, Z. J. Liu, H. X. Cao, S. Y. Ye and G. X. Liang, Sens. Actuators, B, 2020, 316, 128131 CrossRef CAS.
- Q. Lu, J. Deng, Y. Hou, H. Wang, H. Li, Y. Zhang and S. Yao, Chem. Commun., 2015, 51, 7164–7167 RSC.
- A. Mehta, D. Pooja, A. Thakur and S. Basu, New J. Chem., 2017, 41, 4573–4581 RSC.
- X. L. Wang, Y. J. Long, Q. L. Wang, H. J. Zhang, X. X. Huang, R. Zhu, P. Teng, L. P. Liang and H. Z. Zheng, Carbon, 2013, 64, 499–506 CrossRef CAS.
- N. Jara, N. S. Milán, A. Rahman, L. Mouheb, D. C. Boffito, C. Jeffryes and S. A. Dahoumane, Molecules, 2021, 26, 4585 CrossRef CAS.
- M. L. Marin, K. L. McGilvray and J. C. Scaiano, J. Am. Chem. Soc., 2008, 130, 16572–16584 CrossRef CAS PubMed.
- F. Masing, A. Mardyukov, C. Doerenkamp, H. Eckert, U. Malkus, H. Nusse, J. Klingauf and A. Studer, Angew. Chem., Int. Ed., 2015, 54, 12612–12617 CrossRef PubMed.
- Y. Zhang, G. M. Zeng, L. Tang, D. L. Huang, X. Y. Jiang and Y. N. Chen, Biosens. Bioelectron., 2007, 22, 2121–2126 CrossRef CAS PubMed.
- S. Sawalha, A. Silvestri, A. Criado, S. Bettini, M. Prato and L. Valli, Carbon, 2020, 167, 696–708 CrossRef CAS.
- B. Martin, J. Sedelmeier, A. Bouisseau, P. Fernandez-Rodriguez, J. Haber, F. Kleinbeck, S. Kamptmann, F. Susanne, P. Hoehn, M. Lanz, L. Pellegatti, F. Venturoni, J. Robertson, M. C. Willis and B. Schenkel, Green Chem., 2017, 19, 1439–1448 RSC.
- J. D. Stachowska, A. Murphy, C. Mellor, D. Fernandes, E. N. Gibbons, M. J. Krysmann, A. Kelarakis, E. Burgaz, J. Moore and S. G. Yeates, Sci. Rep., 2021, 11, 10554 CrossRef CAS PubMed.
- M. Sudolská, M. Dubecky, S. Sarkar, C. J. Reckmeier, R. Zboril, A. L. Rogach and M. Otyepka, J. Phys. Chem. C, 2015, 119, 13369–13373 CrossRef.
- S. Zhu, Q. Meng, L. Wang, J. Zhang, Y. Song, H. Jin, K. Zhang, H. Sun, H. Wang and B. Yang, Angew. Chem., Int. Ed., 2013, 52, 3953–3957 CrossRef CAS.
- Y. Ji, X. Yang, Z. Ji, L. Zhu, N. Ma, D. Chen, X. Jia, J. Tang and Y. Cao, ACS Omega, 2020, 5, 8572–8578 CrossRef CAS PubMed.
- D. L. Pavia, G. M. Lampman, G. S. Kriz and J. R. Vyvyan, Introduction to spectroscopy, Fourth edition, Brooks/Cole Cengage learning, 2009 Search PubMed.
- D. N. He, Z. Peng, W. Gong, Y. Y. Luo, P. F. Zhao and L. X. Kong, RSC Adv., 2015, 5, 11966–11972 RSC.
- Z. S. S. Júnior, S. B. Botta, P. A. Ana, C. M. França, K. P. S. Fernandes, R. A. Mesquita-Ferrari, A. Deana and S. K. Bussadori, Sci. Rep., 2015, 5, 11448 CrossRef PubMed.
- L. Chuntonov, R. Kumar and D. G. Kuroda, Phys. Chem. Chem. Phys., 2014, 16, 13172–13181 RSC.
- M. G. Giorgini, M. R. Pelletti, G. Paliani and R. S. Cataliotti, J. Raman Spectrosc., 1983, 14, 16–21 CrossRef CAS.
- K. Krishnan and R. A. Plane, Inorg. Chem., 1966, 5, 852–857 CrossRef CAS.
- A. C. Ferrari and J. Robertson, Phys. Rev. B: Condens. Matter Mater. Phys., 2000, 61, 14095–14107 CrossRef CAS.
- A. V. Vostrikova, E. S. Prikhozhdenko, O. A. Mayorova, I. Y. Goryacheva, N. V. Tarakina, G. B. Sukhorukov and A. V. Sapelkin, Sci. Rep., 2018, 8, 9394 CrossRef.
- S. Link and M. A. El-Sayed, J. Phys. Chem. B, 1999, 103, 4212–4217 CrossRef CAS.
- B. V. Enustun and J. Turkevich, J. Am. Chem. Soc., 1963, 85, 3317–3328 CrossRef CAS.
- C. Wang and D. Astruc, Chem. Soc. Rev., 2014, 43, 7188–7216 RSC.
- J. E. Millstone, S. Park, K. L. Shuford, L. Qin, G. C. Schatz and C. A. Mirkin, J. Am. Chem. Soc., 2005, 127, 5312–5313 CrossRef CAS PubMed.
- G. Nocito, S. Petralia, M. Malanga, S. Béni, G. Calabrese, R. Parenti, S. Conoci and S. Sortino, ACS Appl. Nano Mater., 2019, 2, 7916–7923 CrossRef CAS.
- L. Cao, M. C. Jennings and R. J. Puddephatt, Inorg. Chem., 2007, 46, 1361–1368 CrossRef CAS.
- X. Rao, M. Tatoulian, C. Guyon, S. Ognier, C. Chu and A. Abou Hassan, Nanomaterials, 2019, 9, 1034 CrossRef CAS PubMed.
- (a) E. Dulkeith, A. C. Morteani, T. Niedereichholz, T. A. Klar, J. Feldmann, S. A. Levi, F. C. van Veggel, D. N. Reinhoudt, M. Moller and D. I. Gittins, Phys. Rev. Lett., 2002, 89, 203002 CrossRef CAS PubMed; (b) S. Devi, B. Singh, A. K. Paula and S. Tyagi, Anal. Methods, 2016, 8, 4398–4405 RSC; (c) A. Tsalsabila, Y. Herbani and Y. W. Sari, J. Phys.: Conf. Ser., 2022, 2243012102 Search PubMed; (d) J. Bi, C. Tian, G.-L. Zhang, H. Hao and H.-M. Hou, Food, 2020, 9, 316 CrossRef CAS PubMed.
- M. H. Mashhadizadeh, S. M. Kalantarian and A. Azhdeh, Electroanalysis, 2021, 33, 160–169 CrossRef CAS.
- N. M. Modawe Alshik Edris, J. Abdullah, S. Kamaruzaman and Y. Sulaiman, Microchim. Acta, 2019, 186, 261 CrossRef PubMed.
- J. Tashkhourian, M. Daneshi, F. Nami-Ana, M. Behbahani and A. Bagheri, J. Hazard. Mater., 2016, 318, 117–124 CrossRef CAS PubMed.
- I. R. W. Z. de Oliveira, R. E. H. M. de Barros Osório, A. Neves and I. Cruz Vieira, Sens. Actuators, B, 2007, 122(1), 89–94 CrossRef CAS.
- J. Zou, J. Ma, Y. Zhang, L. Huang and Q. Wan, J. Chem. Technol., 2014, 89, 259–264 CAS.
- H. Du, J. Ye, J. Zhang, X. Huang and C. Yu, J. Electroanal. Chem., 2011, 650, 209–213 CrossRef CAS.
- W. Tang, M. Zhang, W. Li and X. Zeng, Talanta, 2014, 127, 262–268 CrossRef CAS PubMed.
- M. Li, F. Ni, Y. Wang, S. Xu, D. Zhang, S. Chen and L. Wang, Electroanalysis, 2009, 21(13), 1521–1526 CrossRef CAS.
Footnotes |
| † Electronic supplementary information (ESI) available. See DOI: https://doi.org/10.1039/d3nr05897b |
| ‡ Present address: Consiglio Nazionale delle Ricerche, Istituto per lo Studio dei Materiali Nanostrutturati (CNR-ISMN) URT of Messina at Department of Chemical, Biological and Environmental Sciences, University of Messina, Viale Ferdinando Stagno d'Alcontres, 31, 98168 Messina, Italy. |
| This journal is © The Royal Society of Chemistry 2024 |


