Highly efficient and stable tandem luminescent solar concentrators based on carbon dots and CuInSe2−xSx/ZnS quantum dots†
Lianju
Wang
a,
Yiqing
Chen
a,
Yueling
Lai
a,
Xianglong
Zhao
a,
Kanghui
Zheng
a,
Ruilin
Wang
ab and
Yufeng
Zhou
 *a
*a
aCollege of Materials Science and Engineering, Sichuan University, Chengdu 610065, P. R. China. E-mail: yfzhou@scu.edu.cn
bEngineering Research Center of Alternative Energy Materials & Devices, Ministry of Education, Chengdu 610065, P. R. China
First published on 17th November 2023
Abstract
Semi-transparent large-area luminescent solar concentrators (LSCs) have been considered an essential part of zero-energy or low-energy consuming buildings in the future. Inorganic colloidal quantum dots (QDs) are promising candidates for LSCs due to the advantages of a tunable bandgap, engineered large Stokes shift, and relatively high photoluminescence (PL) quantum yield. However, LSCs that are fabricated using colloidal quantum dots exhibited an inferior stability under long-term illumination, demanding great efforts to explore the highly stable LSCs. Herein, we fabricated large-area (∼100 cm2) tandem LSCs based on highly stable carbon dots (CDs) and highly luminescent near-infrared emitting CuInSe2−xSx/ZnS (CuInSeS/ZnS) QDs. Coupled with a Si diode as a reference, the power conversion efficiency of the corresponding tandem (dimensions: 10 × 10 × 0.5 cm3) and single LSCs (dimensions: 10 × 10 × 0.3 cm3) based on CuInSeS/ZnS QDs under one sun illumination are 0.46% and 0.5%, respectively. For single CuInSeS/ZnS QD based LSCs at a low concentration (0.039 wt%), external and internal quantum efficiencies reach up to 2.87% and 36.37%, respectively. After UV illumination for 8 h, bottom LSCs based on CuInSeS/ZnS QDs retain 93.22% of the initial PL emission, which is higher than that of LSCs (∼80%) without the CD protection. The highly efficient and stable tandem LSCs employing green CDs and NIR CuInSeS/ZnS QDs as PL emitters pave the way for the realization of large area building-integrated photovoltaic (BIPV) devices.
Introduction
With the economic development, rapid population growth, and increasing energy demand, the imbalance in the land supply and the demand for land in cities has become increasingly prominent.1,2 Building-integrated photovoltaics (BIPVs) were proposed to solve the problems of incompatibility between photovoltaic systems and urban buildings,3,4 and to provide an idea for realizing the goal of zero-energy or low-energy buildings.5 However, conventional silicon-based PV systems suffer from drawbacks, such as bulky modules, insufficient flexibility, and expensive additional costs.6 Moreover, it is difficult to achieve a high transparency and beautiful appearance while maintaining a high efficiency in traditional silicon-based photovoltaic modules.7Luminescent solar concentrators (LSCs) hold great potential for BIPVs, since they serve the purposes of both power generation and aesthetic needs.8 LSCs are composed of luminescent materials doped in optical waveguide media. Upon illumination, fluorophores doped in a polymer matrix absorb photons and re-emit them at longer wavelengths.9 Due to the total internal reflection, partially emitted light travels in the polymer matrix and is concentrated through the edges of LSCs.10 Attached with PV cells at these edges, LSCs convert the light into electrical energy.
In early days, the fluorescent substances mainly utilized in LSCs were organic dyes, such as perylene11 and Red305.12 Although organic dyes have a high photoluminescence quantum yield (PL QY), the relatively small Stokes shift and severe reabsorption limit their optical conversion performance.13 In recent decades, the rapid development of wet chemical synthesis for colloidal semiconductor nanocrystals has provided new ideas and directions for efficient LSCs. Compared to organic dyes, inorganic colloidal quantum dots (QDs) exhibit a tunable band gap,14 engineered Stokes shift,15 relatively high PL QYs and photo/chemical stabiliy.16 A series of colloidal QDs, including CdSe/CdS QDs,17,18 Mn-doped CsPbCl3 QDs,19 PbS/CdS QDs,20 carbon dots (CDs),21 and CuInS(Se)/ZnS QDs,22,23 have been widely explored for highly efficient LSC fabrication. Among them, heavy-metal-free CuInS(Se)/ZnS QDs serve as excellent PL emitters for LSCs. This is due to their intrinsic hole-related large Stokes shift, broad absorption over ultraviolet (UV)-visible-near infrared (NIR) range, PL QYs up to 80–90% and perfect PL emission spectra range similar to that of the crystalline Si solar cells.23
However, when QDs are exposed to high temperatures, high humidity, and UV light, surface defects will act as nonradiative recombination centres to accelerate the oxidation of QDs, resulting in a decrease in the stability of LSCs.24 Although QDs are hermetically isolated from moisture and air, they still undergo photodegradation under sunlight, which reduces the PL intensity of QDs and thus the duration of LSC.7,25 Moreover, aggregations of QDs at high concentrations often occur between the phase transfer from solution to polymer mainly due to the very tiny size of the QDs (2–10 nm), which also largely decreases the long-term photo/chemical stability of QDs.
Thus, the tandem architecture of LSCs becomes an effective way to enhance both the power conversion efficiency (PCE) and photo/chemical stability of LSCs. Up to now, many types of tandem or multilayer LSCs based on CDs,26 inorganic perovskites QDs,27 CDs/inorganic perovskites QDs,28 and CDs/CdSe/CdS QDs18 have been illustrated. Generally, LSCs based on highly stable CDs are selected as the protective layer to enhance the stability of the underlying LSC.18,28,29 Compared with inorganic colloidal QDs, CDs exhibit excellent photostability under UV light.30 Haiguang Zhao et al.28 used CDs and CsPb(ClxBr1−x)3 QDs to prepare tandem LSCs. CDs-based LSCs were used as the top layer, and the CsPb(ClxBr1−x)3 QDs-based LSCs were used as the bottom layer. With UV illumination absorbed by the CDs-based LSC layer, the underlying CsPb(ClxBr1−x)3 QDs-based LSCs can absorb the re-emitted visible and incident visible light, which exhibit high optical conversion efficiency and photostability. Similar results have been obtained in the case of tandem LSCs based on CDs and CdSe/CdS QDs.18 Under the protection of carbon dots, the PL intensity of the CdSe/CdS QDs-based LSCs remained at 75% after 70 h of UV light irradiation, which was 1.8 times higher than that of the single-layer CdSe/CdS QDs-based LSCs. In most cases, tandem LSCs are mainly active in the visible range. Only a few studies have reported LSCs fabricated using NIR emitting QDs.
In this work, we demonstrate the fabrication of large-area (∼100 cm2) tandem LSCs using highly stable CDs and CuInSe2−xSx/ZnS (CuInSeS/ZnS) QDs. Both PL emitters have been synthesized via wet chemical methods. The absorption range of the CDs is in the range of 300–400 nm, while the corresponding PL emission peak is at ∼440 nm with a large Stokes shift of 580 meV and PL QYs of 54%. The absorption range of CuInSeS/ZnS is in the range of 300–800 nm, while the PL emission peak is at 878 nm with a Stokes shift of 530 meV and PL QYs of 61%. Tandem LSCs were fabricated by incorporating CDs into a PVP thin film and CuInSeS/ZnS QDs into a copolymer prepared using lauryl methacrylate and ethylene glycol dimethacrylate (PLMA-co-EGDM) thin film, respectively (details included in ESI†). Employing the Si diode as a reference, the PCEs of tandem LSCs and single layer CuInSe2−xSx/ZnS QDs-based LSCs under one sun illumination are 0.46% and 0.5%, respectively. Single LSCs at low concentration (0.039 wt%) exhibit high external quantum efficiency (ηext) of 2.87% and internal quantum efficiency (ηint) of 36.37%. After UV illumination for 8 h, the bottom LSCs based on CuInSeS/ZnS QDs retained 93.2% of the initial PL emission, demonstrating more photostability than that of LSCs without CDs protection.
Results and discussion
Colloidal CDs were prepared via solvothermal method using diethylenetriamine as the nitrogen source and trans-aconitic acid as the carbon source (details included in ESI†). As shown in Fig. 1a, CDs exhibit a spherical shape and are uniformly monodispersed, with an average size of 11.9 ± 2.4 nm (Fig. 1c). In the high-resolution TEM (HRTEM) image (Fig. 1b), a calculated lattice spacing of 0.21 nm corresponding to the (100) crystal plane of graphite is observed in the CDs sample.31 The XRD pattern (Fig. S1a†) indicates a broad peak of 20°–30°, which coincides with the (002) facet of the amorphous carbon.32 Such broad peaks appear in XRD due to the amorphous nature and small size of the as-synthesized carbon dots.33 These results are consistent with the literature.32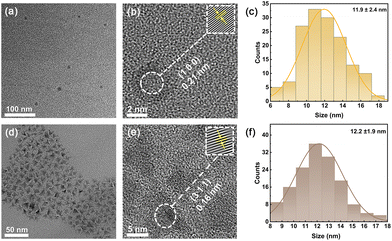 | ||
| Fig. 1 The typical TEM and HRTEM images of CDs (a and b) and CuInSe2−xSx/ZnS QDs (d and e). The size distributions of CDs (c) and CuInSe2−xSx/ZnS QDs (f). | ||
To determine the chemical structure of the CDs, Fourier transform infrared spectrogram (FTIR) analysis was carried out (Fig. S1b†). C![[double bond, length as m-dash]](https://www.rsc.org/images/entities/char_e001.gif) O (1634 cm−1), C
O (1634 cm−1), C![[double bond, length as m-dash]](https://www.rsc.org/images/entities/char_e001.gif) C (1473 cm−1), C
C (1473 cm−1), C![[double bond, length as m-dash]](https://www.rsc.org/images/entities/char_e001.gif) N (1634 cm−1), C–O (1025 cm−1), C–N (1220 cm−1), and N–H (3200–3500 cm−1) infrared absorption peaks are observed accordingly.32 To further demonstrate the chemical states of the CDs, X-ray photoelectron spectroscopy (XPS) analysis was performed (Fig. S2†). The XPS survey spectrum (Fig. S2a†) indicates the presence of the C, N and O elements, corresponding to the positions of binding energies of 284 eV, 401 eV, and 531 eV, separately. The deconvoluted high-resolution XPS spectra further identified the presence of C–C, C
N (1634 cm−1), C–O (1025 cm−1), C–N (1220 cm−1), and N–H (3200–3500 cm−1) infrared absorption peaks are observed accordingly.32 To further demonstrate the chemical states of the CDs, X-ray photoelectron spectroscopy (XPS) analysis was performed (Fig. S2†). The XPS survey spectrum (Fig. S2a†) indicates the presence of the C, N and O elements, corresponding to the positions of binding energies of 284 eV, 401 eV, and 531 eV, separately. The deconvoluted high-resolution XPS spectra further identified the presence of C–C, C![[double bond, length as m-dash]](https://www.rsc.org/images/entities/char_e001.gif) O, C–N, N–H, and C–O groups in CDs (Fig. S2b–d†), confirming the preparation of N-doped CDs, which is in agreement with the literature.34,35
O, C–N, N–H, and C–O groups in CDs (Fig. S2b–d†), confirming the preparation of N-doped CDs, which is in agreement with the literature.34,35
For CuInSeS/ZnS QDs, CuInSeS QDs were first prepared via a heating-up method.36 Then, CuInSeS/ZnS QDs were synthesized by introducing the ZnS shell with additional Zn and S precursors.37 Fig. S3a† shows the TEM image of the CuInSeS QDs, which indicates that the QDs have a uniformly dispersed pyramid shape with a side length of about 9.2 ± 1.4 nm (Fig. S3c†). Compared with the CuInSeS QDs, CuInSeS/ZnS QDs (Fig. 1d) exhibit a larger particle size (around 12 ± 1.9 nm, Fig. 1f).38 Based on the corresponding ICP-OES results for the core-only and core/shell QDs samples, after shell coating, the core size of the CuInSeS QDs were shrunk a bit, while the shell thickness is 1.4 nm, which is equal to 5 monolayers of ZnS. Fig. 1e and S3b† show the HRTEM images of the CuInSeS QDs with crystalline spacing of 0.16 nm (corresponding to the (311) of ZnS with zinc blende phase) and 0.33 nm (corresponding to the (112) of alloyed CuInSe2 with chalcopyrite phase), respectively,36,37 which are consistent with the XRD results (Fig. S4†).
In order to determine the elemental composition and chemical valence of CuInSeS QDs and CuInSeS/ZnS QDs, XPS analysis was performed (Fig. S5 and S6†). As shown in Fig. S5b and S6b,† high-resolution Cu 2p spectra were decomposed into the Cu 2p1/2 (951.6 eV) peak and the Cu 2p3/2 (931.8 eV) peak, which confirms that the valence state of the Cu ion is +1.39 High-resolution In 3d spectra in Fig. S5c and S6c† were divided into two peaks: the binding energy of 451.9 eV corresponds to 3d3/2, and 444.3 eV corresponds to 3d5/2, demonstrating the presence of In3+.39 The presence of Se (54.3 eV, 3d3/2; 53.5 eV, 3d5/2) and S (162.7 eV, 2p1/2; 161.3 eV, 2p3/2) was confirmed from the XPS analysis, which is attributed to the interaction of Se and S with the coordination of Cu and Se.39
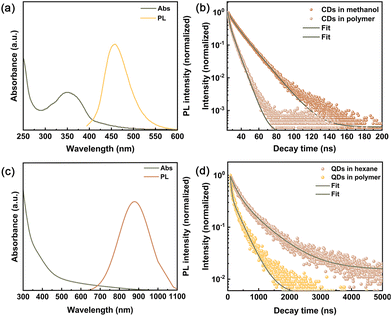
As shown in Fig. 2a, the absorption of CDs dispersed in methanol is in the range of 300–400 nm. Meanwhile, the corresponding PL emission peak is at ∼440 nm, with a Stokes shift of 580 meV and high PL QYs of 54%, in agreement with the literature.32 In Fig. S7,† the as-synthesized CuInSeS QDs dispersed in hexane exhibit a broad absorption over 300–800 nm, indicating a bandgap of 1.81 eV. Due to the presence of intrinsic holes-related states, a broad PL emission was observed with a peak position of ∼990 nm and full-width-at-half maximum (FWHM) of 288 meV. After ZnS shell coating, a slight blue shift of the absorption of the CuInSeS/ZnS QDs sample was seen (Fig. 2c). Accordingly, the PL peak position of the CuInSeS/ZnS QDs is blue-shifted (∼878 nm) with respect to the core-only QDs, which perfectly matches the external quantum efficiency (EQE) of the Si PVs. These results suggest the decreased size of the core, which is also consistent with the observations in TEM measurements.36 CuInSeS/ZnS QDs exhibit a large Stokes shift of 530 meV calculated from the corresponding Tauc plot and PL peak position (as shown in Fig. 2c and S8†) and a high PL QYs of 61%, which is promising for LSCs fabrication.
For the large-area LSC fabrications, CDs-based LSCs were embedded into polyvinylpyrrolidone (PVP) on a glass substrate via spin-coating method,40 while CuInSeS/ZnS QDs-based LSCs were fabricated via UV polymerization method.23 Details are provided in ESI.† As illustrated in Fig. 2 and S9,† the absorption and emission spectra of the CDs and CuInSeS/ZnS QDs in the polymer were almost the same with respect to those in liquid phase. Furthermore, the absorption of tandem LSCs lies in the UV-visible and NIR range, shown in Fig. S10.† In addition, the PL decay curves for the CDs and CuInSeS/ZnS QDs in the polymer samples are shown in Fig. 2b and d. The decay curves were fitted using the bi-exponential function. All of the fitting parameters and calculations of the PL lifetimes are summarized in Table S1.† The average PL lifetimes of CDs in methanol and PVP were 12.8 ns and 7.2 ns, respectively. The decrease in PL lifetime is usually ascribed to the possible aggregation of CDs when embedding into the PVP polymer, consistent with observations in the literature.41 Similarly, the PL lifetime of the CuInSeS/ZnS QDs (510 ns) in the polymer is shorter than that in hexane (831 ns), which indicates the increased non-radiative recombination and decreased PL QYs.27,42
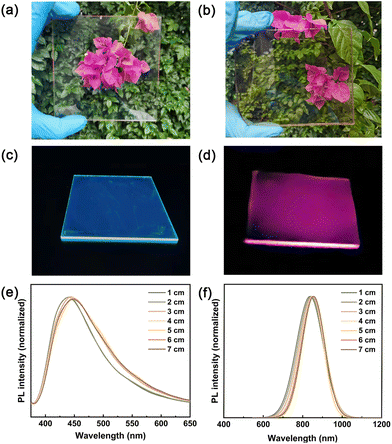
As shown in Fig. 3a, b, and S11,† both CDs (0.4 wt%) and CuInSeS/ZnS QDs (0.039 wt%) based LSCs exhibit very good visible transmittance under ambient illumination. No visible cracks or scratches in LSCs have been observed, indicating that very little scattering originated from the aggregation of QDs. Upon UV illumination, shown in Fig. 3c, a blueish/greenish color was observed through the edges of the CDs-based LSC, while a red color was seen clearly from the edges of the CuInSeS/ZnS QDs-based LSC (Fig. 3d). In addition, the reabsorption loss of LSCs under illumination was evaluated by measuring the PL spectra versus the optical paths for the LSCs based on CDs and CuInSeS/ZnS QDs (experimental setup was shown in Fig. S12†). In Fig. 3e, f, and S13,† upon increasing the optical path from 1 cm to 7 cm, the PL emission spectra collected from the edge of both CDs-based LSCs (dimensions: 7 × 1 × 0.2 cm3) and CuInSeS/ZnS QDs-based LSCs (dimensions: 7 × 1 × 0.3 cm3) exhibit slight red shifts, while the PL intensity experiences a gradual decrease. The corresponding PL peak positions and FWHM ratios remained almost the same for both LSCs samples, indicating that the LSCs undergo less reabsorption loss due to the large Stokes shifts and high photostability.41
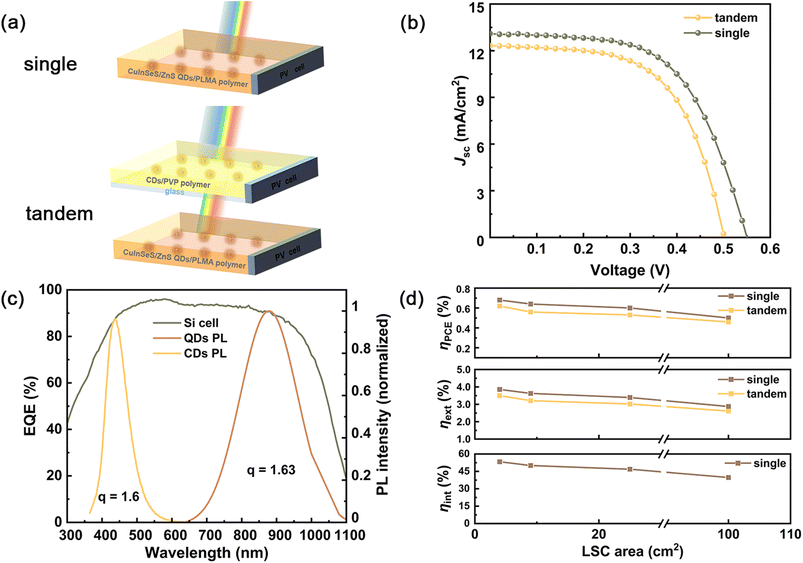
To evaluate the optical performance of the single and tandem LSCs system, we coupled a commercial Si solar cell (Shanghai Suiying Photovoltaic Technology Co., Ltd) with the LSCs. The J–V curve of the Si solar cell (10 × 0.3 cm2) under one sun illumination is shown in Fig. S14,† in which the corresponding power conversion efficiency is ∼10.92%, lower than that of the large area commercial Si solar cell. To evaluate the opto-electronic performance of the LSC–PV systems, the Si cell was tightly attached to one edge of the LSC, and the remaining edges are covered with black tapes.43 The details of the setup for measurements are shown in Fig. S15.† The system was placed under AM 1.5G solar radiation (100 mW cm−2) for all measurements. Thus, this LSC–PV system can be regarded as an integrated PV device, such as conventional solar cells. The power conversion efficiency (denoted as PCE or ηLSC,PV) of the LSC–PV system can be calculated based on the following eqn (1):
 | (1) |
To further evaluate the external quantum efficiency (ηext) of the LSCs (the ratio between edge emitted photons and incident solar photons), we introduced several definitions and corresponding equations for calculations as follows:
| HLSC,PV = ηext × ηPV × q | (2) |
 | (3) |
| ηext = ηabs × ηint | (4) |
 | (5) |
In Fig. 4d and Table S2,† the single CuInSeS/ZnS QDs-based LSC–PV system exhibits a PCE of 0.5%, which is only ∼23% of PCE for the best reported CuInS2/ZnS QDs-based LSC–PV system.45 However, the absorptance of our LSC is also only ∼22% of the value for the CuInS2/ZnS QDs-based LSC, indicating that the optical conversion performance of our LSC is comparable to one of the best LSCs based on CuInSe(S)/ZnS QDs with similar dimensions. Then, we further measured ηext and ηint of the single LSCs with various dimensions (Fig. 4d). For the tandem LSC–PV system, as shown in Table 1, the tandem LSCs (dimensions: 10 × 10 × 0.5 cm3) exhibit ηext of 2.54%, which is higher than that of the multilayers LSC based on CDs and CdSe/CdS QDs (1.4%) and three types of CDs (2.3%) with similar dimensions. Since it is challenging to calculate the exact number of lost photons due to the air gap and escape cone, we only focused on the calculation of the internal quantum efficiency of the single LSC based on the CuInSeS/ZnS QDs. For the dimensions of 2 × 2 × 0.3 cm3 LSCs, ηint is about 48.8%, which is slightly lower than that of QDs in hexane, suggesting that the incorporation of QDs in the polymer largely did not drop their PL QYs.
| Types of QDs | Absorption range (nm) | LSC size (L × W × H) cm × cm × cm | PCE (%) | η ext (%) | Ref. |
|---|---|---|---|---|---|
| CDs + CuInSe2−xSx/ZnS | 300–800 | 10 × 10 × 0.5 | 0.46 | 2.54 | This work |
| 5 × 5 × 0.5 | 0.58 | 3.3 | |||
| 3 × 3 × 0.5 | 0.62 | 3.53 | |||
| 2 × 2 × 0.5 | 0.67 | 3.82 | |||
| CDs + CdSe/CdS | 300–520 | 10 × 10 × 0.4 | — | 1.40 | 18 |
| CsPbClBr2 + CsPbBr0.6I2.4 | 300–650 | 5 × 5 × 0.7 | 0.31 | — | 27 |
| CdxZn1−xS/ZnS + CuInSe2/ZnS | 300–700 | 15.2 × 15.2 × 0.16 | 3.1 | 6.40 | 42 |
| CDs and AIE molecules | 300–550 | 2.5 × 2 × 0.5 | — | 4.05 | 46 |
| CDs + CDs + CDs | 300–610 | 8 × 8 × 0.8 | — | 2.30 | 26 |
Furthermore, a comparison of the photostability for both single and tandem LSCs was also carried out. As shown in Fig. 5a, under UV illumination (395 nm light emitting device with the power of UV lamp is 50 W), the PL peak positions of both LSCs remain almost the same, indicating that no trap emissions have been found. Fig. 5b shows the PL intensity area ratios as a function of the UV illumination time for LSCs. After 4 h of UV illumination, the PL intensity decreased by 13.8% for the single LSCs and 5.3% for the tandem LSCs. When the illumination time extends to 8 h, the tandem LSCs still preserve 93.2% PL intensity. Meanwhile, the PL intensity for the single LSC decreased by 21%, the photostability of which is higher than that of the tandem LSCs based on inorganic AgInS2/ZnS QDs and CuGaS2/ZnS QDs.47 It shows that the presence of the CDs-based LSCs at the top layer absorbs the incident UV light and reduces further photo-corrosion of bottom CuInSeS/ZnS QDs in the polymer matrix, effectively enhancing the photo/chemical stability of the CuInSeS/ZnS QDs-based LSCs.
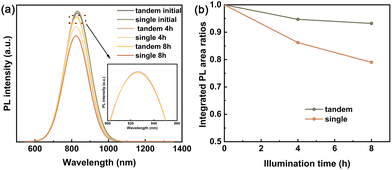 | ||
| Fig. 5 (a) PL spectra of the single LSCs and tandem LSCs as a function of UV illumination time. (b) PL integrated area ratios of single and tandem LSCs as a function of illumination time. | ||
Conclusions
In conclusion, we prepared highly efficient and stable large-area tandem LSCs based on heavy-metal-free CDs and CuInSeS/ZnS QDs. The PL emitters have large Stokes shifts, and high PL QYs of 54% for UV active CDs and 61% for NIR-emitting CuInSeS/ZnS QDs. The semi-transparent large-area LSC–PV system using CuInSeS/ZnS QDs exhibits a high PCE (0.5%) and ηext (2.87%), which is comparable to those of the best LSC based on CuInSe(S) QDs. With the top layer LSC based on CDs, the corresponding tandem LSC–PV system exhibited a high PCE (0.46%) and ηext (2.57%) among the green, environmentally friendly LSCs. Since CDs have excellent photostability and strong UV light absorption ability, it can effectively reduce the intensity of UV light reaching the bottom LSCs based on CuInSeS/ZnS QDs. After UV illumination for 8 h, the bottom LSCs based on CuInSeS/ZnS QDs retained 93.2% of the initial PL emission, which was much higher than those of LSCs without CDs protection. Tandem LSCs using “green” CDs and NIR CuInSeS/ZnS QDs as PL emitters provide new ideas for the preparation of large-area, non-toxic, highly efficient and stable LSCs.Author contributions
Lianju Wang: conceptualization, data curation, and writing – original draft. Yiqing Chen: data curation and methodology. Yueling Lai: data curation and validation. Xianglong Zhao: conceptualization and validation. Kanghui Zheng: conceptualization. Ruilin Wang: conceptualization. Yufeng Zhou: writing – review & editing, funding acquisition and project supervision.Conflicts of interest
There are no conflicts to declare.Acknowledgements
We acknowledge Dr. Wenwu Wang and Dr. Jie Zhang for helps in the PL and XRD measurements, and sincerely thank the following funds for financial support: the National Natural Science Foundation of China (Grant No. 22105134), Fundamental Research Funds for the Central Universities.Notes and references
- N. Kannan and D. Vakeesan, Renewable Sustainable Energy Rev., 2016, 62, 1092–1105 CrossRef.
- F. Meinardi, F. Bruni and S. Brovelli, Nat. Rev. Mater., 2017, 2, 17072–17081 CrossRef CAS.
- T. E. Kuhn, C. Erban, M. Heinrich, J. Eisenlohr, F. Ensslen and D. H. Neuhaus, Energy Build., 2021, 231, 110381–110407 CrossRef.
- M. K. Assadi, H. Hanaei, N. M. Mohamed, R. Saidur, S. Bakhoda, R. Bashiri and M. Moayedfar, Appl. Phys. A, 2016, 122, 821–833 CrossRef.
- E. Kabir, P. Kumar, S. Kumar, A. A. Adelodun and K.-H. Kim, Renewable Sustainable Energy Rev., 2018, 82, 894–900 CrossRef.
- M. J. Currie, J. K. Mapel, T. D. Heidel, S. Goffri and M. A. Baldo, Science, 2008, 321, 226–228 CrossRef CAS.
- M. G. Debije and P. P. C. Verbunt, Adv. Energy Mater., 2012, 2, 12–35 CrossRef CAS.
- G. Yu, H. Yang, D. Luo, X. Cheng and M. K. Ansah, Renewable Sustainable Energy Rev., 2021, 149, 111355–111379 CrossRef.
- P. Moraitis, R. E. I. Schropp and W. G. J. H. M. van Sark, Opt. Mater., 2018, 84, 636–645 CrossRef CAS.
- W. H. Weber and J. Lambe, Appl. Opt., 1976, 15, 2299–2300 CrossRef CAS.
- G. Griffini, L. Brambilla, M. Levi, M. Del Zoppo and S. Turri, Sol. Energy Mater. Sol. Cells, 2013, 111, 41–48 CrossRef CAS.
- L. H. Slooff, E. E. Bende, A. R. Burgers, T. Budel, M. Pravettoni, R. P. Kenny, E. D. Dunlop and A. Büchtemann, Energy Procedia, 2014, 60, 173–180 CrossRef.
- B. S. Richards and I. A. Howard, Energy Environ. Sci., 2023, 16, 3214–3239 RSC.
- X. Liu, B. Luo, J. Liu, D. Jing, D. Benetti and F. Rosei, J. Mater. Chem. A, 2020, 8, 1787–1798 RSC.
- H. Zhao, D. Benetti, L. Jin, Y. Zhou, F. Rosei and A. Vomiero, Small, 2016, 12, 5354–5365 CrossRef CAS.
- X. Gong, S. Zheng, X. Zhao and A. Vomiero, Nano Energy, 2022, 101, 107617–107625 CrossRef CAS.
- I. Coropceanu and M. G. Bawendi, Nano Lett., 2014, 14, 4097–4101 CrossRef CAS PubMed.
- G. Liu, H. Zhao, F. Diao, Z. Ling and Y. Wang, J. Mater. Chem. C, 2018, 6, 10059–10066 RSC.
- G. Gu, Z. Zheng, H. Zhang, Y. Zhang, Z. Gan, R. Huang and X. Zhang, J. Lumin., 2022, 248, 118963–118971 CrossRef CAS.
- L. Tan, Y. Zhou, F. Ren, D. Benetti, F. Yang, H. Zhao, F. Rosei, M. Chaker and D. Ma, J. Mater. Chem. A, 2017, 5, 10250–10260 RSC.
- Y. Zhou, D. Benetti, X. Tong, L. Jin, Z. M. Wang, D. Ma, H. Zhao and F. Rosei, Nano Energy, 2018, 44, 378–387 CrossRef CAS.
- C. Li, W. Chen, D. Wu, D. Quan, Z. Zhou, J. Hao, J. Qin, Y. Li, Z. He and K. Wang, Sci. Rep., 2015, 5, 17777–17786 CrossRef CAS PubMed.
- F. Meinardi, H. McDaniel, F. Carulli, A. Colombo, K. A. Velizhanin, N. S. Makarov, R. Simonutti, V. I. Klimov and S. Brovelli, Nat. Nanotechnol., 2015, 10, 878–885 CrossRef CAS.
- H. Zhao, D. Wang, T. Zhang, M. Chaker and D. Ma, Chem. Commun., 2010, 46, 5301–5303 RSC.
- H. Li, K. Wu, J. Lim, H.-J. Song and V. I. Klimov, Nat. Energy, 2016, 1, 16157–16166 CrossRef CAS.
- L. Zdražil, S. Kalytchuk, K. Holá, M. Petr, O. Zmeškal, Š. Kment, A. L. Rogach and R. Zbořil, Nanoscale, 2020, 12, 6664–6672 RSC.
- X. Liu, D. Benetti, J. Liu, L. Jin and F. Rosei, Nano Energy, 2023, 111, 108438–108448 CrossRef CAS.
- H. Zhao, D. Benetti, X. Tong, H. Zhang, Y. Zhou, G. Liu, D. Ma, S. Sun, Z. M. Wang, Y. Wang and F. Rosei, Nano Energy, 2018, 50, 756–765 CrossRef CAS.
- G. Liu, R. Mazzaro, Y. Wang, H. Zhao and A. Vomiero, Nano Energy, 2019, 60, 119–126 CrossRef CAS.
- J. Liu, R. Li and B. Yang, ACS Cent. Sci., 2020, 6, 2179–2195 CrossRef CAS PubMed.
- X. Miao, D. Qu, D. Yang, B. Nie, Y. Zhao, H. Fan and Z. Sun, Adv. Mater., 2018, 30, 1704740–1704748 CrossRef PubMed.
- Z. Yi, X. Li, H. Zhang, X. Ji, W. Sun, Y. Yu, Y. Liu, J. Huang, Z. Sarshar and M. Sain, Talanta, 2021, 222, 121663–121673 CrossRef CAS.
- Z. Gao, X. Wang, J. Chang, D. Wu, L. Wang, X. Liu, F. Xu, Y. Guo and K. Jiang, RSC Adv., 2015, 5, 48665–48674 RSC.
- K. Holá, M. Sudolská, S. Kalytchuk, D. Nachtigallová, A. L. Rogach, M. Otyepka and R. Zbořil, ACS Nano, 2017, 11, 12402–12410 CrossRef.
- A. Saravanan, M. Maruthapandi, P. Das, J. H. T. Luong and A. Gedanken, Nanomaterials, 2021, 11, 369–380 CrossRef CAS.
- X. Tong, X.-T. Kong, C. Wang, Y. Zhou, F. Navarro-Pardo, D. Barba, D. Ma, S. Sun, A. O. Govorov, H. Zhao, Z. M. Wang and F. Rosei, Adv. Sci., 2018, 5, 1800656–1800667 CrossRef.
- H. Zang, H. Li, N. S. Makarov, K. A. Velizhanin, K. Wu, Y.-S. Park and V. I. Klimov, Nano Lett., 2017, 17, 1787–1795 CrossRef CAS.
- L. Li, A. Pandey, D. J. Werder, B. P. Khanal, J. M. Pietryga and V. I. Klimov, J. Am. Chem. Soc., 2011, 133, 1176–1179 CrossRef CAS PubMed.
- S. S. Chetty, S. Praneetha, S. Basu, C. Sachidanandan and A. V. Murugan, Sci. Rep., 2016, 6, 26078–26092 CrossRef CAS.
- J. Li, H. Zhao, X. Zhao and X. Gong, Nanoscale, 2021, 13, 9561–9569 RSC.
- J. Chen, H. Zhao, Z. Li, X. Zhao and X. Gong, Energy Environ. Sci., 2022, 15, 799–805 RSC.
- K. Wu, H. Li and V. I. Klimov, Nat. Photonics, 2018, 12, 105–110 CrossRef CAS.
- C. Yang, H. A. Atwater, M. A. Baldo, D. Baran, C. J. Barile, M. C. Barr, M. Bates, M. G. Bawendi, M. R. Bergren, B. Borhan, C. J. Brabec, S. Brovelli, V. Bulović, P. Ceroni, M. G. Debije, J.-M. Delgado-Sanchez, W.-J. Dong, P. M. Duxbury, R. C. Evans, S. R. Forrest, D. R. Gamelin, N. C. Giebink, X. Gong, G. Griffini, F. Guo, C. K. Herrera, A. W. Y. Ho-Baillie, R. J. Holmes, S.-K. Hong, T. Kirchartz, B. G. Levine, H. Li, Y. Li, D. Liu, M. A. Loi, C. K. Luscombe, N. S. Makarov, F. Mateen, R. Mazzaro, H. McDaniel, M. D. McGehee, F. Meinardi, A. Menéndez-Velázquez, J. Min, D. B. Mitzi, M. Moemeni, J. H. Moon, A. Nattestad, M. K. Nazeeruddin, A. F. Nogueira, U. W. Paetzold, D. L. Patrick, A. Pucci, B. P. Rand, E. Reichmanis, B. S. Richards, J. Roncali, F. Rosei, T. W. Schmidt, F. So, C.-C. Tu, A. Vahdani, W. G. J. H. M. van Sark, R. Verduzco, A. Vomiero, W. W. H. Wong, K. Wu, H.-L. Yip, X. Zhang, H. Zhao and R. R. Lunt, Joule, 2022, 6, 8–15 CrossRef.
- L. R. Bradshaw, K. E. Knowles, S. McDowall and D. R. Gamelin, Nano Lett., 2015, 15, 1315–1323 CrossRef CAS.
- M. R. Bergren, N. S. Makarov, K. Ramasamy, A. Jackson, R. Guglielmetti and H. McDaniel, ACS Energy Lett., 2018, 3, 520–525 CrossRef CAS.
- W. Ma, W. Li, R. Liu, M. Cao, X. Zhao and X. Gong, Chem. Commun., 2019, 55, 7486–7489 RSC.
- L. Jin, E. Hamzehpoor, J. Liu, X. Liu, D. Benetti, G. Selopal, D. Perepichka, Z. M. Wang and F. Rosei, J. Mater. Chem. A, 2023, 11, 23821–23828 RSC.
Footnote |
| † Electronic supplementary information (ESI) available. See DOI: https://doi.org/10.1039/d3nr05471c |
| This journal is © The Royal Society of Chemistry 2024 |

