Insight into the hydration friction of lipid bilayers†
Xiaoxue
Qin
a,
Mingdong
Dong
 *b and
Qiang
Li
 *a
*a
aKey Laboratory of Colloid and Interface Chemistry of the Ministry of Education, School of Chemistry and Chemical Engineering, Shandong University, Jinan 250100, China. E-mail: qiang@sdu.edu.cn
bInterdisciplinary Nanoscience Center (iNANO), Aarhus University, Aarhus C, DK 8000, Denmark. E-mail: dong@inano.au.dk
First published on 2nd January 2024
Abstract
Hydration layers formed on charged sites play crucial roles in many hydration lubrication systems in aqueous media. However, the underlying molecular mechanism is not well understood. Herein, we explored the hydration friction of lipid bilayers with different charged headgroups at the nanoscale through a combination of frequency-modulation atomic force microscopy and friction force microscopy. The nanoscale friction experiments showed that the hydration friction coefficient and frictional energy dissipation of a cationic lipid (DPTAP) were much lower than those of zwitterionic (DPPE) and anionic (DPPG) lipids. The hydration layer probing at the surfaces of different lipid bilayers clearly revealed the relationship between the charged lipid headgroups and hydration layer structures. Our detailed analysis demonstrated that the cationic lipid had the largest hydration force in comparison with zwitterionic and anionic lipids. These friction and hydration force results indicated that the difference of the lipid headgroup charge resulted in different hydration strengths which led to the difference of hydration friction behaviors. The findings in this study provide molecular insights into the hydration friction of lipid bilayers, which has potential implications for the development of efficient hydration lubrication systems with boundary lipid bilayers in aqueous media.
Introduction
Ultralow friction in aqueous media has received extensive research attention due to their relevance to many aqueous boundary lubrication systems and biological lubrication processes.1–3 Over the past few decades, extremely low sliding friction in aqueous environments has been designed and achieved through coating surfaces with surfactants, polymer brushes or lipids.4–8 The mechanisms underlying this observed extremely low sliding friction are very different from those of the classic friction. The concept of hydration lubrication then has been proposed and invoked to explain the striking reduction of sliding friction between charged surfaces in aqueous media.9–13 According to the hydration lubrication mechanism, hydration layer structures formed by water molecules are strongly bound to the charges they surround, and so can withstand large normal pressures without being squeezed out while retaining high rapid relaxation and thus respond to shear in a fluid manner.10 However, there is little molecular-scale understanding of this mechanism, particularly the frictional energy dissipation within the subnanometer hydration layer structures. This is because the information obtained from the conventional techniques is not enough to establish a relationship between the hydration layer structures and their associated friction characteristics. Recently, frequency-modulation atomic force microscopy (FM-AFM) has been successfully employed to investigate the hydration layer structures on charged surfaces at atomic scale.14–19 In addition, friction force microscopy (FFM) has been demonstrated to be a powerful technique to measure the friction with pico-Newton resolution in liquids.20–25 Therefore, the combination of these two techniques might be helpful in exploring the role of hydration layer structures in the hydration lubrication process.In recent years, many friction experiments have been carried out on hydration lubrication systems composed of lipids whose highly hydrated headgroups may reduce the friction.3 However, most studies have been performed on the lubrication of zwitterionic lipids such as phosphatidylcholine lipids26–31 and, to a lesser extent, on the lubrication of cationic lipids and anionic lipids. Therefore, in order to explore the effect of surface charges on the hydration friction behaviors and further understand the hydration lubrication mechanism involved, this work studied the hydration friction behaviors of three lipids with different charged headgroups (a cationic lipid, a zwitterionic lipid and an anionic lipid) through a combination of FM-AFM and FFM. On the basis of the experimental results, we performed detailed analysis and discussed the relationships among the hydration friction, headgroup charge, and hydration structure. The results demonstrated that the surface charge of the lipid bilayers could affect the structures of the hydration layer, giving rise to different hydration friction behaviors. Our findings not only shed light on the role of surface charge in hydration lubrication, but also provide molecular insights into the origins of hydration lubrication.
Results and discussion
To explore the effect of the surface charge of lipid bilayers on their hydration friction behaviors, three lipids, a cationic, a zwitterionic and an anionic lipid, were selected to represent the different charges of lipids, but with minimal variation in other properties. The three lipids are 1,2-dipalmitoyl-3-trimethylammonium-propane (DPTAP), 1,2-dipalmitoyl-sn-glycero-3-phosphoethanolamine (DPPE) and 1,2-dipalmitoyl-sn-glycero-3-phospho-(1′-rac-glycerol) (DPPG), which share a common hydrophobic tail consisting of two alkyl chains and all have a relatively small hydrophilic headgroup (Fig. 1a, d and g). In aqueous media, the lipid molecules could form a bilayer with the hydrophobic tails separated from water and the hydrophilic headgroups adjacent to water. Lipid bilayers supported on mica were prepared by the method of spontaneous vesicle fusion.32 For the anionic lipid, the cationic Ca2+ in the incubation buffer solution promoted the adsorption by electrostatically bridging the anionic lipid and mica.33 The as-prepared lipid bilayers were firstly characterized using AFM in a liquid (Fig. S1†). Fig. 1b presents a typical AFM image of DPTAP structures formed on mica, and flat island-like plateaus were observed. The measured height of a single DPTAP bilayer was ∼4.9 nm (Fig. 1c). The same imaging procedure was applied to DPPE (Fig. 1e) and DPPG (Fig. 1h) samples, and the heights of single bilayers were ∼5.8 nm for DPPE and ∼6.3 nm for DPPG (Fig. 1f and i). These measured heights of single lipid bilayers around 5 nm were consistent with previous reports.32,34The successful preparation of lipid bilayers supported on mica allows us to study the hydration friction behaviors of lipid bilayers with different surface charges. We first characterized the friction of the three lipid bilayers under different normal loads using FFM in liquids. Fig. 2a shows the friction versus normal load curves for DPTAP, DPPE and DPPG bilayers. As indicated in Fig. 2a, for a given normal load, the DPTAP bilayer has the lowest friction among these three lipid bilayers and DPPG has the highest, which is in agreement with the previously reported experimental results that cationic systems have lower friction.4 Besides, the friction of all lipid bilayers increases linearly with the increases of the normal load. Through linearly fitting the friction as a function of the normal load, the effective coefficient of friction (COF) for the lipid bilayers could be obtained. As presented in Fig. 2b, the COF of DPTAP is only ∼0.04, which is much smaller than those of the DPPE and DPPG bilayers, and also smaller than that of bare mica (Fig. S2†).
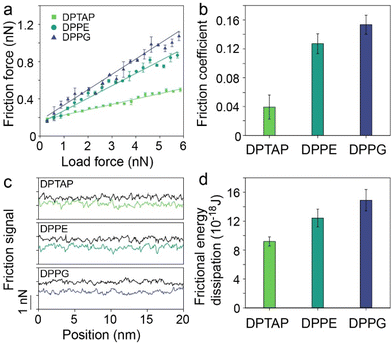 | ||
| Fig. 2 (a) Friction versus normal load curves, (b) effective coefficient of friction, (c) friction loops, and (d) frictional energy dissipation of DPTAP, DPPE and DPPG bilayers. | ||
To further investigate the effect of surface charge on the hydration friction of the lipid bilayers, we then extracted the friction loops composed of trace and retrace force signals from the friction measurements of the three lipid bilayers (Fig. 2c and Fig. S3†). In comparison with DPTAP and DPPE bilayers, the difference between the trace and retrace force signals of the DPPG bilayer is the largest, which indicates the need to overcome greater resistance when sliding on the surface of the bilayer, resulting in higher energy dissipation. It is worth noting that AFM height imaging was performed before and after friction testing to confirm that the lipid bilayer was not destroyed during friction measurements (Fig. S4†). To quantify the differences, the frictional energy dissipation was calculated and is plotted in Fig. 2d. It can be clearly seen that the energy dissipation of the lipid bilayer follows the order DPTAP < DPPE < DPPG. This trend of energy dissipation is consistent with the trend of friction.
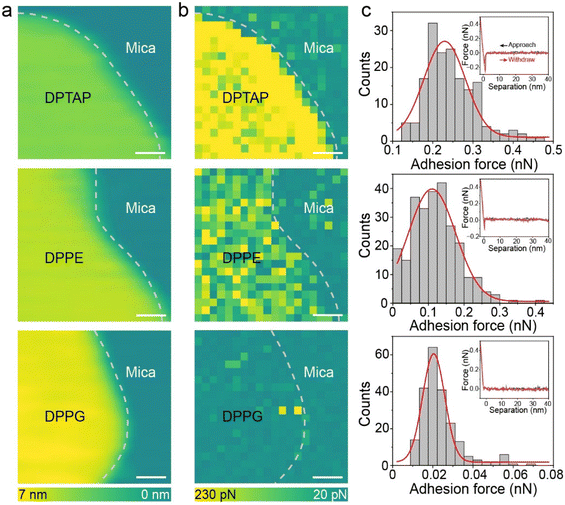
Since the friction could be affected by the adhesion force between two surfaces,35,36 the change in adhesion force was first analyzed to explore the causes of different friction. We quantified the adhesion force by performing adhesion mapping which showed multiple force–distance curves. To ensure the accuracy of the adhesion mapping results, an area with both the lipid bilayer and mica was chosen as shown in Fig. 3a. The adhesion mapping clearly showed that the adhesion at the blank mica was almost the same and only differed in the lipid bilayer area (Fig. 3b). The brighter contrast in the adhesion map indicates higher adhesion force. As shown in Fig. 3c and Fig. S5,† the adhesion forces of DPTAP, DPPE and DPPG bilayers obtained by statistics are 0.23 ± 0.05 nN, 0.11 ± 0.06 nN and 0.02 ± 0.006 nN, respectively. The trend of adhesion force is opposite to the measured friction trend. We attempted to explain this phenomenon and the relationship between adhesion and friction using the Bowden–Tabor adhesion model. According to the Bowden–Tabor model, the friction is an additive contribution of adhesion force (Fa) and ploughing force (Fp). The adhesion force derives from the shear strength of two surfaces in contact under a normal force and can be obtained by multiplying the shear strength (τ) with the area of contact (A), whereas Fp results from the deformation of the soft surface when the tip slides across a soft surface. The friction force (Ff) then can be written as:
| Ff = Fa + Fp = τA + Fp | (1) |
Thus, the changes in τ, A and Fp can cause changes in Ff. Since τ is proportional to the measured adhesion force, τ on the DPTAP bilayer should be the largest. However, this variation could be counterbalanced or even overcompensated by a decrease in A or Fp. Here, we ensured the same test conditions such as tip geometry, normal load and similar physical properties of the lipids; thus the effect of A on friction force can be ignored. In addition, if Fp contains the force required for the tip to slide across the hydration layer at the lipid bilayer interface, the change in friction may also depend on the density distribution of the interfacial water or the arrangement of water molecules near the interface of the lipid bilayer.
Therefore, to gain more insights into the hydration friction at the lipid interface, FM-AFM was employed to measure the quantitative force profiles within the short-range attractive interaction regime at the interface of lipid bilayers supported on mica. In FM-AFM, the vertical tip position was modulated by frequency in the form of a sine wave and the tip–sample interaction force was determined by recording the shift of the cantilever resonance frequency (Δf) induced by the force. For the force–distance curve measurements, the Δf values were recorded as a function of tip–sample separation by changing the vertical position of the tip at a constant speed. As shown in Fig. 4a–c and Fig. S6,† the Δf curves display a slow increase with oscillatory peaks, which indicate the existence of a repulsive long-range force and an oscillatory short-range force. An exponential function (as marked by a red dashed line) was used to fit the measured Δf curves to obtain the short-range force curves. In liquids, the electrostatic and van der Waals interactions are greatly suppressed, whereas the contribution of the hydration force becomes prominent. The Δf curves were then converted to force–distance curves through the formula proposed by Sader and Jarvis as follows:37
 | (2) |
 | (3) |
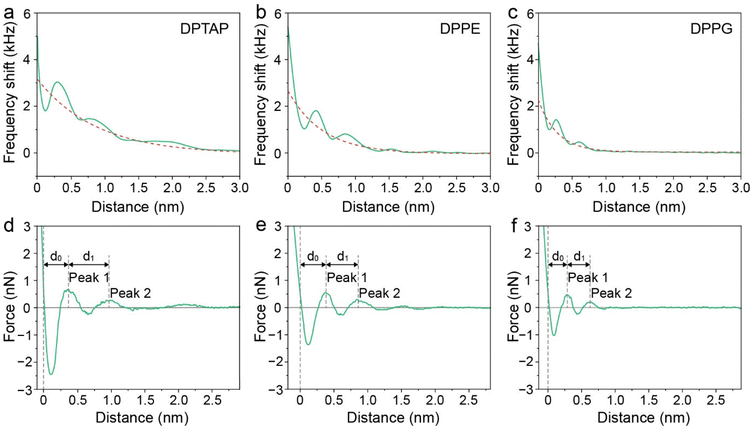 | ||
| Fig. 4 (a–c) Averaged Δf versus distance curves for DPTAP, DPPE and DPPG bilayers. (d–f) Force versus distance curves for DPTAP, DPPE and DPPG bilayers converted from Δf curves. | ||
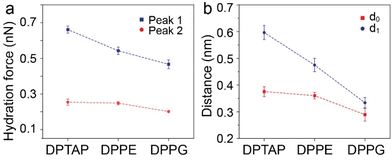 | ||
| Fig. 5 (a) Peak hydration force and (b) relevant distance at the lipid bilayer interface extracted from the force–distance curves. | ||
We then analyzed the distances between the peak hydration forces from the force–distance curves. The distance, labeled as d0 and d1, reflecting the distance of the first and second hydration layers were extracted and are summarized in Fig. 5b and Table S1.† It can be seen that the d0 and d1 of the cationic DPTAP lipid are larger than those of the zwitterionic DPPE lipid and anionic DPPG lipid, owing to greater hydration strength and a larger hydrated headgroup radius. It is worth noting that the values of d1 for the DPTAP lipid and DPPE lipid are larger than the diameter of a water molecule, which may be due to the charge effects.38 In addition, the molecular fluctuation of the lipids may also lead to larger spacing between hydration layers.16 The three lipid bilayers have very similar physical properties and differ only in their headgroup charge, which indicates that the sign of the charge plays an important role in the formation of hydration layers. Therefore, it seems that the mechanical properties and structure of the hydration layers strongly depend on the charge of lipid headgroups, which, in turn, affects their hydration friction properties.
Based on the friction and hydration layer testing, we further drew a schematic illustration of the interaction between the tip and the lipid bilayer to discuss the relationship among the hydration friction, headgroup charge, and hydration structure during the hydration friction process in our experiment. As shown in Fig. 6, for all the three lipid bilayers, water molecules near the lipid bilayers formed hydration layer structures and were held strongly by the lipid headgroup but are nonetheless very fluid on experiencing shear, and so the highly hydrated headgroup arrays of the lipid bilayers could provide efficient lubrication. It is widely accepted that cationic ions have stronger hydration strength than anionic ions.10 Therefore, the DPTAP lipid with a positively charged headgroup could provide considerably better lubrication than the anionic DPPG lipid and neutral DPPE lipid due to the higher hydration ability. In addition, the fluctuation of the lipid headgroups could also affect the hydration structures and hydration force.16 The small lipid headgroup of DPTAP in comparison with the headgroups of DPPE and DPPG, which give rise to a stable hydration structure and high hydration strength, leads to lower hydration friction.
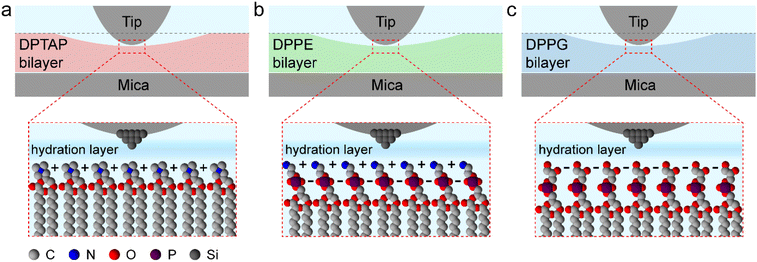 | ||
| Fig. 6 Schematic illustration of the relationship between the tip and lipid bilayer supported on mica during the hydration friction process. (a) DPTAP bilayer. (b) DPPE bilayer. (c) DPPG bilayer. | ||
Conclusions
In summary, we explored the hydration friction behaviors of lipid bilayers with different surface charges at the nanoscale through a combination of FM-AFM and FFM. The friction coefficient and energy dissipation of the cationic DPTAP bilayer were found to be much lower than those of the zwitterionic DPPG bilayer and anionic DPPE bilayer, while the peak hydration force of DPTAP was larger than those of DPPG and DPPE. Our nanoscale friction combined with hydration force measurements revealed that the surface charge of the lipid bilayers could affect the structure of the hydration layer which gives rise to different hydration friction behaviors. These findings provide a mighty framework for controlling and designing hydration lubrication processes in aqueous media and hold great promise for biological lubrication.Experimental
Preparation of lipid bilayers
DPTAP, DPPE and DPPG in powder forms (Avanti Polar Lipids, USA) were dissolved in chloroform to form a concentration of 1 mg mL−1. Aliquots of lipid solution in glass vials were dried in a vacuum desiccator overnight forming lipid thin films. The incubation buffer solution (10 mM HEPES, 150 mM NaCl, 5 mM CaCl2, pH 7.3) was added to the vial to resuspend the lipid films to a final concentration of 0.5 mg mL−1 and the vial was sonicated in a bath sonicator for 0.5 h at room temperature. Then, 10 μL of the vesicle solution was deposited onto a freshly cleaved mica plate with a diameter of 15 mm. The lipid sample was incubated for 0.5 h above the phase transition temperature, cooled to room temperature and rinsed with the imaging buffer solution (10 mM HEPES, 150 mM NaCl, pH 7.0). Finally, the prepared samples were preserved using imaging buffer solution to prevent drying before AFM measurements.Friction measurements
The nanoscale friction measurements were carried out using friction force microscopy mode on a Cypher ES AFM (Asylum Research, USA). All measurements were performed in the imaging buffer using silicon cantilevers (ECONO-ESP-Au, Asylum Research) with a spring constant of ∼0.2 N m−1 and a resonance frequency of ∼13 kHz. During friction testing, the cantilever scanning direction was perpendicular to the main axis, and the scan size was 20 nm × 20 nm with a scan rate of ∼10 Hz. The lateral spring constant of the cantilever was calibrated before each measurement by the non-contact thermal noise-based method.39 External factors were kept the same to avoid any effect on friction.Hydration layer measurements
Hydration layer imaging was performed in frequency modulation mode also on the Cypher ES AFM. Silicon cantilevers (PPP-NCHAuD, Nanoworld) with a spring constant of ∼40 N m−1 and a resonance frequency of ∼145 kHz were employed. Immediately prior to each experiment, the cantilevers were sequentially washed with water, isopropanol, and water, and then treated with a UV-Ozone cleaner for 1 hour to remove organic contaminants and make the cantilevers hydrophilic. During the hydration layer measurements, the frequency and amplitude of z modulation were kept at 1 Hz and 5 nm, respectively. The tip–sample interaction force was detected by recording the shift of the cantilever resonance frequency caused by the force. For the force–distance curve measurements, the frequency shift values were recorded as a function of tip–sample separation by changing the vertical tip position at a constant speed. The above AFM measurements were performed at room temperature (25 °C), which is below the phase transition temperature of lipids.Author contributions
Q. L. and M. D. conceived and designed the experiments. X. Q. conducted the experiments and performed data analysis. X. Q. and Q. L. wrote the manuscript with contribution from all authors.Conflicts of interest
The authors declare no competing financial interests.Acknowledgements
This work was financially supported by the Natural Science Foundation of Shandong Province (No. ZR2020MB042), the Grant for Taishan Scholar Advantage Characteristic Discipline of Shandong Province, the Start-up Grant for QiLu Young Scholars of Shandong University, the Grant from Danish Council for Independent Research (9040-00219B), and the EU H2020RISE 2016-MNR4S Cell project.References
- W. Lin and J. Klein, Adv. Mater., 2021, 33, 2005513 CrossRef CAS PubMed.
- W. Lin and J. Klein, Acc. Mater. Res., 2022, 3, 213–223 CrossRef CAS PubMed.
- Y. Cao and J. Klein, Curr. Opin. Colloid Interface Sci., 2022, 58, 101559 CrossRef CAS.
- U. Raviv, S. Giasson, N. Kampf, J.-F. Gohy, R. Jérôme and J. Klein, Nature, 2003, 425, 163–165 CrossRef CAS PubMed.
- W. H. Briscoe, S. Titmuss, F. Tiberg, R. K. Thomas, D. J. McGillivray and J. Klein, Nature, 2006, 444, 191–194 CrossRef CAS PubMed.
- S. Lee and N. D. Spencer, Science, 2008, 319, 575–576 CrossRef CAS PubMed.
- M. Chen, W. H. Briscoe, S. P. Armes and J. Klein, Science, 2009, 323, 1698–1701 CrossRef CAS PubMed.
- N. Dhopatkar, A. P. Defante and A. Dhinojwala, Sci. Adv., 2016, 2, e1600763 CrossRef PubMed.
- U. Raviv and J. Klein, Science, 2002, 297, 1540–1543 CrossRef CAS PubMed.
- J. Klein, Friction, 2013, 1, 1–23 CrossRef CAS.
- L. Ma, A. Gaisinskaya-Kipnis, N. Kampf and J. Klein, Nat. Commun., 2015, 6, 6060 CrossRef CAS PubMed.
- W. Lin, M. Kluzek, N. Iuster, E. Shimoni, N. Kampf, R. Goldberg and J. Klein, Science, 2020, 370, 335–338 CrossRef CAS PubMed.
- T. Han, W. Cao, Z. Xu, V. Adibnia, M. Olgiati, M. Valtiner, L. Ma, C. Zhang, M. Ma, J. Luo and X. Banquy, Sci. Adv., 2023, 9, eadf3902 CrossRef CAS PubMed.
- T. Fukuma, M. J. Higgins and S. P. Jarvis, Biophys. J., 2007, 92, 3603–3609 CrossRef CAS PubMed.
- T. Fukuma, Y. Ueda, S. Yoshioka and H. Asakawa, Phys. Rev. Lett., 2010, 104, 016101 CrossRef PubMed.
- H. Asakawa, S. Yoshioka, K.-i. Nishimura and T. Fukuma, ACS Nano, 2012, 6, 9013–9020 CrossRef CAS PubMed.
- D. Martin-Jimenez, E. Chacon, P. Tarazona and R. Garcia, Nat. Commun., 2016, 7, 12164 CrossRef CAS PubMed.
- K. Umeda, L. Zivanovic, K. Kobayashi, J. Ritala, H. Kominami, P. Spijker, A. S. Foster and H. Yamada, Nat. Commun., 2017, 8, 2111 CrossRef PubMed.
- T. Fukuma and R. Garcia, ACS Nano, 2018, 12, 11785–11797 CrossRef CAS PubMed.
- R. Bennewitz, Mater. Today, 2005, 8, 42–48 CrossRef CAS.
- Y. Zhang, D. Zhang, Y. Wang, Q. Liu, Q. Li and M. Dong, ACS Appl. Nano Mater., 2021, 4, 9932–9937 CrossRef CAS.
- Z. Li, Q. Liu, D. Zhang, Y. Wang, Y. Zhang, Q. Li and M. Dong, Nanoscale Horiz., 2022, 7, 368–375 RSC.
- Z. Li, Q. Liu, Q. Li and M. Dong, Nano Res., 2022, 16, 1096–1100 CrossRef.
- D. Zhang, M. Huang, L. H. Klausen, Q. Li, S. Li and M. Dong, ACS Appl. Mater. Interfaces, 2023, 15, 21595–21601 CrossRef CAS PubMed.
- Y. Hong, D. Zhang, Z. Gao, Y. Zhang, Q. Li and M. Dong, Nano Res., 2023, 16, 9977–9982 CrossRef CAS.
- R. Goldberg, A. Schroeder, G. Silbert, K. Turjeman, Y. Barenholz and J. Klein, Adv. Mater., 2011, 23, 3517–3521 CrossRef CAS PubMed.
- R. Sorkin, N. Kampf, Y. Dror, E. Shimoni and J. Klein, Biomaterials, 2013, 34, 5465–5475 CrossRef CAS PubMed.
- R. Sorkin, N. Kampf, L. Zhu and J. Klein, Soft Matter, 2016, 12, 2773–2784 RSC.
- R. Sorkin, N. Kampf and J. Klein, Langmuir, 2017, 33, 7459–7467 CrossRef CAS PubMed.
- J. Li, W. Cao, Z. Wang, M. Ma and J. Luo, Nanoscale, 2018, 10, 16887–16894 RSC.
- Y. Dong, N. Kampf, Y. Schilt, W. Cao, U. Raviv and J. Klein, Nanoscale, 2022, 14, 18241–18252 RSC.
- M.-P. Mingeot-Leclercq, M. Deleu, R. Brasseur and Y. F. Dufrêne, Nat. Protoc., 2008, 3, 1654–1659 CrossRef PubMed.
- Y. Cao, N. Kampf, W. Lin and J. Klein, Soft Matter, 2020, 16, 3973–3980 RSC.
- L. H. Klausen, T. Fuhs and M. Dong, Nat. Commun., 2016, 7, 12247 CrossRef PubMed.
- M. Munz, C. E. Giusca, R. L. Myers-Ward, D. K. Gaskill and O. Kazakova, ACS Nano, 2015, 9, 8401–8411 CrossRef CAS PubMed.
- D. Zhang, Y. Zhang, Q. Li and M. Dong, Friction, 2022, 10, 573–582 CrossRef CAS.
- J. E. Sader and S. P. Jarvis, Appl. Phys. Lett., 2004, 84, 1801–1803 CrossRef CAS.
- S. Benaglia, M. R. Uhlig, J. Hernández-Muñoz, E. Chacón, P. Tarazona and R. Garcia, Phys. Rev. Lett., 2021, 127, 196101 CrossRef CAS PubMed.
- N. Mullin and J. K. Hobbs, Rev. Sci. Instrum., 2014, 85, 113703 CrossRef PubMed.
Footnote |
| † Electronic supplementary information (ESI) available. See DOI: https://doi.org/10.1039/d3nr05517e |
| This journal is © The Royal Society of Chemistry 2024 |


