 Open Access Article
Creative Commons Attribution 3.0 Unported Licence
Clonogenic assay and computational modeling using real cell images to study physical enhancement and cellular sensitization induced by metal nanoparticles under MV and kV X-ray irradiation
Rodrigo
Hernández Millares†
a,
Chaewon
Bae†
b,
Seok-Jin
Kim
c,
Taewan
Kim
c,
So-Yeon
Park
de,
Kangwon
Lee
 *cf and
Sung-Joon
Ye
 *cfg
*cfg
aProgram in Biomedical Radiation Sciences, Department of Transdisciplinary Studies, Graduate School of Convergence Science and Technology, Seoul National University, Seoul, 08826, Republic of Korea
bProgram in Nanoscience and Technology, Graduate School of Convergence Science and Technology, Seoul National University, Seoul, 08826, Republic of Korea
cDepartment of Applied Bioengineering, Graduate School of Convergence Science and Technology, Seoul National University, Seoul, 08826, Republic of Korea. E-mail: kangwonlee@snu.ac.kr; sye@snu.ac.kr
dDepartment of Radiation Oncology, Veterans Health Service Medical Center, Seoul, 05368, Republic of Korea
eInstitute of Radiation Medicine, Seoul National University Medical Research Center, Seoul, 03080, Republic of Korea
fResearch Institute for Convergence Science, Seoul National University, Seoul, 08826, Republic of Korea
gAdvanced Institute of Convergence Technology, Seoul National University, Suwon 16229, Korea
First published on 19th March 2024
Abstract
This study was initiated due to the physically unexplainable tumor controls resulting from metal nanoparticle (MNP) experiments even under MV X-ray irradiation. A more accurate explanation of the mechanism of radiosensitization induced by MNP is warranted, considering both its physical dose enhancement and biological sensitization, as related research is lacking. Thus, we aimed to examine the intricate dynamics involved in MNP-induced radiosensitization. We conducted specifically designed clonogenic assays for the A549 lung cancer cell line with MNP irradiated by 6 MV and 300 kVp X-rays. Two types of MNP were employed: one based on iron oxide, promoting ferroptosis, and the other on gold nanoparticles known for inducing a significant dose enhancement, particularly at low-energy X-rays. We introduced the lethality enhancement factor (LEF) as the fraction in the cell killing attributed to biological sensitization. Subsequently, Monte Carlo simulations were conducted to evaluate the radial dose profiles for each MNP, corresponding to the physical enhancement. Finally, the local effect model was applied to the clonogenic assay results on real cell images. The LEF and the dose enhancement in the cytoplasm were incorporated to increase the accuracy in the average lethal events and, consequently, in the survival fraction. The results reveal an increased cell killing for both of the MNP under MV and kV X-ray irradiation. In both types of MNP, the LEF reveals a biological sensitization evident. The sensitizer enhancement ratio, derived from the calculations, exhibited only 3% and 1% relative differences compared to the conventional linear-quadratic model for gold and ferroptosis inducer nanoparticles, respectively. These findings indicate that MNPs sensitize cells via radiation through mechanisms akin to ferroptosis inducers, not exclusively relying on a physical dose enhancement. Their own contributions to survival fractions were successfully integrated into computational modeling.
Introduction
Radiotherapy is a cornerstone of cancer therapy. Presently, approximately 50% of cancer patients undergo radiotherapy at some point postdiagnosis.1 Despite advances in modern modalities such as intensity-modulated radiotherapy, stereotactic body radiation therapy, and proton radiotherapy, collateral damage to adjacent normal tissues remains a primary limitation.2 Radiosensitizers, agents enhancing therapeutic efficiency when combined with ionizing radiation, have garnered attention in mitigating radioresistance and minimizing damage to healthy tissues.3,4Radiosensitizers are commonly stratified into three different classes: small molecules, macromolecules, and nanomaterials.5 Small molecules and macromolecules sensitize cells via signaling pathway alterations; however, they do not possess their own physical radioenhancement properties. Conversely, nanomaterials own excellent properties such as, biocompatibility, ease of coating, large cross-section for low-energy X-rays, fabrication of different sizes and shapes, and enhanced tumor permeability, for which they can act as radiosensitizers and radioenhancers.6,7 Among several nanomaterials, high-Z nanomaterials, such as gold, silver, hafnium, and gadolinium, had been underscored due to their outstanding radioenhancing properties. However, the efficacy of such metal nanoparticles (MNP) is intricately linked to X-ray energy, posing as a challenge for clinical applications.8 Despite theoretical limitations, experimental studies, particularly with gold nanoparticles (GNP), have shown an enhanced therapeutic efficiency even under high-energy MV X-rays.9–11 In previous reports in which GNPs and even iron oxide nanoparticles were irradiated under 6 MV photons, an increase in the sensitizer enhancement ratio (SER) has been observed.12 These reports strongly indicate that MNP does not act only as radioenhancers but also as radiosensitizers, although the exact mechanisms remain poorly elucidated. Thus, the observed radiosensitization in high-Z nanoparticles under high-energy 6 MV prompts a closer examination of the underlying mechanisms.
In recent years, ferroptosis, known as an iron-dependent type of regulated cell death, has been found to have a tight link between ionizing radiation and membrane disruption following lipid peroxidation.13 Radiotherapy increases lipid peroxidation and some of the ferroptosis markers through several pathways, indicating that ferroptosis is as vital as other types of cell deaths.14 Reports indicate that a synergistic effect can be achieved by inducing ferroptosis, thereby diminishing radiation resistance.15–17 Nevertheless, ferroptosis regulators, including SLCA7A11, GPX4, and GSH, play a major role in preventing ferroptosis subsequent to radiation exposure through the modulation of lipid peroxide levels induced by the heightened presence of reactive oxygen species (ROS). For this reason, ferroptosis-inducing nanoparticles have been proposed as a novel type of radiosensitizers. Different nanoplatforms based on iron, cobalt, gadolinium, bismuth, and gold have already been established as effective radiosensitizers and synergize with radiotherapy.18–25
Computational modeling of radioenhancement has actively been conducted to predict nanoparticle therapy outcome. To correctly explain the increase in biological efficacy, several models have been developed.26–28 Accordingly, the local effect model (LEM) has been adapted for nanoparticle therapy, based on the increased local dose depositions in the critical targets (nucleus and mitochondria) due to the radiation interaction with nanoparticles.29–35 However, the nanoparticle-associated radiosensitization has not been considered. Furthermore, computational models typically employ overly simplified cell geometries. Hence, tailoring computational models to encompass not only the enhanced dose deposition resulting from MNP but also their influence on the cellular response is imperative. MNP behavior bears resemblance to ferroptosis inducer nanomaterials, whose radiosensitization is linked to an enhanced radiation lethality. Inherently, the incorporation of radiosensitization effects into computational models is essential, yet there is a paucity of studies addressing this aspect.
This study aims to further investigate and analyze the actual cellular survival influenced by two types of nanoparticles: GNPs and ferroptosis-inducing nanoparticles composed of iron and FDA-approved hyaluronic acid (FHA NP). We consider the comprehensive cellular radiosensitization arising from the combined effects of (1) the physical dose enhancement caused by the nanoparticle and (2) the biological sensitization induced by the nanoparticle, which alters signaling pathways, thereby enhancing the efficacy of radiation. Using kV and MV X-rays, a series of clonogenic assays for human lung cancer cells were conducted. The conventional LEM was modified to reflect cellular response from the physical dose enhancement and the biological radiosensitization. Additionally, we employed real cellular images for precise cellular geometries and nanoparticle distribution.
Results and discussion
Clonogenic assay
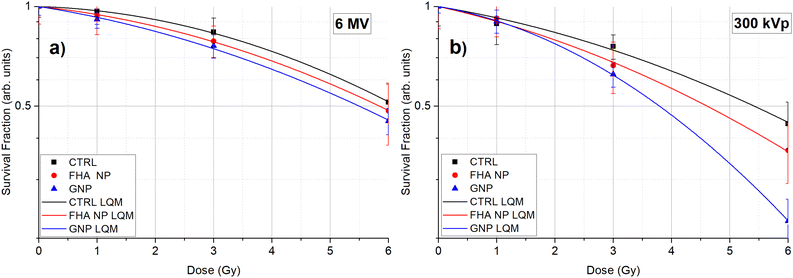
The experimental cell survival data was fitted to the linear quadratic model (LQM), and the resulting curves for both energies (6 MV and 300 kVp) and nanoparticles (FHA NPs and GNPs) are illustrated in Fig. 1a and b. The LQM parameters, including α, β, SER, and α/β, are listed in Table 1.| X-ray energy | Nanoparticle | α | β | α/β | SER |
|---|---|---|---|---|---|
| 6 MV | Control | 0.013 | 0.016 | 0.813 | — |
| FHA NP | 0.043 | 0.012 | 3.349 | 1.048 | |
| GNP | 0.063 | 0.011 | 5.672 | 1.089 | |
| 300 kVp | Control | 0.067 | 0.011 | 6.152 | — |
| FHA NP | 0.090 | 0.012 | 6.969 | 1.078 | |
| GNP | 0.070 | 0.029 | 2.36 | 1.183 | |
Under 6 MV irradiation, at all tested doses (1, 3, and 6 Gy), the survival fraction of A549 cells treated with FHA NPs and GNPs was consistently lower than that of the control (CTRL) group, affirming the presence of a radiosensitization effect due to the nanoparticles. The SER showed approximately 4% and 8% increased radiosensitization compared to the control group. The α parameter is typically associated with direct radiation-induced damage, whereas the β parameter is linked to indirect damage.36Table 1 provides insight into how the alpha parameter shows the most significant alteration during the 6 MV irradiation, while the beta parameter remains largely unchanged.
Conversely, under 300 kVp irradiation, at equivalent doses, the survival fraction of cells treated with FHA NPs displayed outcomes comparable to those observed in the 6 MV irradiation scenario, with a SER of approximately 7%. The primary influence was noted in the α parameter, which can be attributed to the heightened linear energy transfer (LET), resulting in a more pronounced direct radiation-induced damage. However, when GNPs were employed, the SER showed a maximum value of 18% as expected due to the nanoparticle radioenhancement properties. In the β parameter, the primary impact was noticeable, which could be linked to the substantial increase in dose deposition within the cytoplasmic region leading to a significant increase in indirect radiation damage.
Optical diffraction tomography (ODT) images and cellular uptake
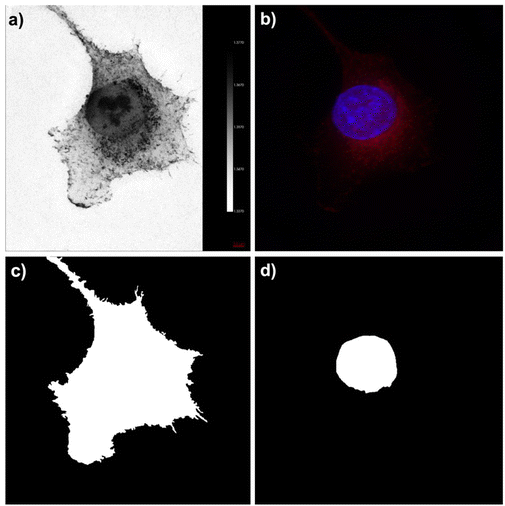
ODT images were obtained for the A549 cancer cell line. In Fig. 2a, the mean intensity pixel (MPI) displays refractive index (RI) images of the A549 individual cell. The RI from the A549 cell line ranged between 1.34 and 1.37. The scale bar in the image corresponds to the cellular RI and aligns with prior findings related to cellular ODT. Fig. 2b reveals the fluorescent MPI of the cell. The blue color represents the nucleus, which has been stained with 4′,6-diamidino-2-phenylindole (DAPI), while the red color corresponds to the mitochondria, stained with MitoTracker.The cellular membrane and nucleus segmentation was conducted through manual delineation, with ODT and fluorescence image guidance, as illustrated in Fig. 2c and d. The methodology procedure was replicated across eight distinct cells. Quantification of cellular uptake of nanoparticles was analyzed using inductively coupled plasma atomic emission spectroscopy (ICP-AES). Table 2 shows the intracellular concentration of the nanoparticle element (Fe or Au) within the sample (μg mL−1), as well as the calculated quantity of intracellular nanoparticles. The differences in the intracellular nanoparticle content can be attributed to a combination of factors. First, the culturing medium variations play a crucial role, where FHA NPs were exposed to a concentration 10-fold higher than that of GNPs, leading to a significant difference in intracellular uptake. Moreover, the distinct coating on FHA NPs renders them more easily captured by cancer cells, further influencing the amount of nanoparticles within the cells. Furthermore, variations in the atomic composition of the nanoparticles contribute to these differences. The calculated average number of intracellular nanoparticles was 12![[thin space (1/6-em)]](https://www.rsc.org/images/entities/char_2009.gif) 811 for FHA NPs and 1886 for GNPs, respectively.
811 for FHA NPs and 1886 for GNPs, respectively.
| Nanoparticle | Diameter (nm) | Nanoparticle concentration in culturing medium (μg mL−1) | ICP-AES (μg mL−1) | Average number of nanoparticles in a cell |
|---|---|---|---|---|
| GNP | 100 | 20 | 7.34 | 1886 |
| FHA NP | 100 | 200 | 47.9 | 12![[thin space (1/6-em)]](https://www.rsc.org/images/entities/char_2009.gif) 811 811 |
Monte Carlo simulations and radial dose distributions
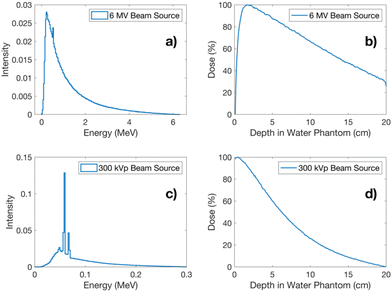
Fig. 3a and c present the energy spectra for 6 MV X-rays and 300 kVp X-rays employed in the Monte Carlo simulations. The depth dose profiles (DDP) resulting from each of these energy sources are presented in Fig. 3b and d.Table 3 presents the recorded number of histories at each phase space file (PHSP). This table delineates the number of histories subsequently utilized as a beam source. Furthermore, it provides the calculated number of particles “N1Gy” required to deliver 1 Gy in a water phantom for each studied energy.
| Beam energy | 6 MV | 300 kVp | ||
|---|---|---|---|---|
| N 1Gy (particles) | 3.99 × 10¹² | 4.18 × 10¹³ | ||
| Nanoparticle | FHA NP | GNP | FHA NP | GNP |
| PHSP1′ beam source | 1 × 10⁶ | 1 × 10⁶ | 1 × 10⁷ | 1 × 10⁷ |
| PHSP2 scored histories | 116![[thin space (1/6-em)]](https://www.rsc.org/images/entities/char_2009.gif) 309 309 |
116![[thin space (1/6-em)]](https://www.rsc.org/images/entities/char_2009.gif) 309 309 |
1![[thin space (1/6-em)]](https://www.rsc.org/images/entities/char_2009.gif) 378 378![[thin space (1/6-em)]](https://www.rsc.org/images/entities/char_2009.gif) 426 426 |
1![[thin space (1/6-em)]](https://www.rsc.org/images/entities/char_2009.gif) 378 378![[thin space (1/6-em)]](https://www.rsc.org/images/entities/char_2009.gif) 426 426 |
| PHSP2′ beam source | 1 × 10⁷ | 1 × 10⁷ | 1 × 10⁷ | 1 × 10⁷ |
| PHSP3 scored histories | 366 | 1720 | 284 | 7784 |
| PHSP3′ beam source | 5 × 10⁵ | 5 × 10⁵ | 5 × 10⁵ | 5 × 10⁵ |
Fig. 4a depicts the radial dose profiles originating from the surface of each nanoparticle under different irradiations. Both simulated nanoparticles deposit a substantial dose, reaching up to approximately 100 Gy, within the immediate vicinity of the nanoparticle surface.
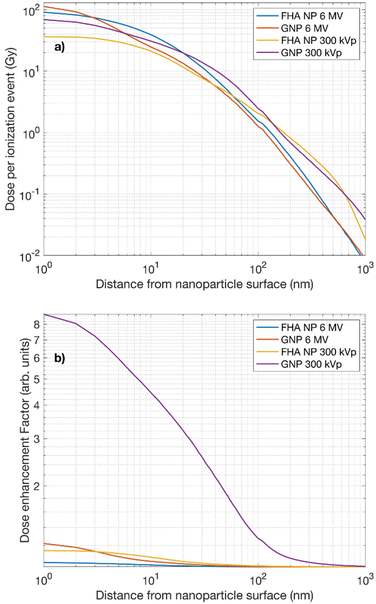 | ||
| Fig. 4 (a) Radial dose profiles and (b) dose enhancement factor from the immediate surface of FHA NP and GNP irradiated by 6 MV and 300 kVp X-rays. | ||
The uncertainties associated with the Monte Carlo radial doses were found to be <1% within the first μm and <2% for subsequent scoring shells extending up to 10 μm for both type of energies and nanoparticles. The radial dose profile aligns with previously reported radial dose profiles of GNPs.8,32 Beyond this region, the dose contribution from secondary electrons generated by ionizing events within the nanoparticle volume experiences a rapid decline over the next nanometers. It is noteworthy that the radial dose distribution resulting from the 300 kVp irradiation extends over a longer range than the one induced by 6 MV irradiation, reaching beyond 100 nm. This highlights the significance of the nanoparticle's precise localization relative to the cellular nucleus. In the case of the 300 kVp irradiation, regardless of the type of nanoparticle material, the dose deposition is likely to have a more substantial influence throughout the cellular volume. In fact, the dose distribution patterns produced by both the FHA NP and the GNP in their radial dose profiles reveal a close resemblance; therefore, the interaction probability is a key factor when estimating dose deposition from each individual particle. Table 4 provides the interaction probabilities per delivered Gy for the FHA NPs and GNPs when exposed to 6 MV and 300 kVp X-rays. It is noticeable that, for the 6 MV X-rays, the interaction probability yields a very low value, in line with expectations due to the lower cross section. Conversely, in the case of the 300 kVp irradiation, the interaction probability increases, particularly for GNPs.
| Energy | FHA NP | GNP |
|---|---|---|
| 6 MV | 0.0004 | 0.0019 |
| 300 kVp | 0.0040 | 0.1121 |
Fig. 4b depicts the dose enhancement factor (DEF) as a function of the range of the nanoparticle surface. Consistent with theoretical calculations, the highest DEF is observed in the case of GNPs irradiated under 300 kVp where the dose enhancement was up to ∼9-fold in the first nm. Notably, for FHA NPs irradiated under 300 kVp or 6 MV and GNPs irradiated under 6 MV, the DEF yields an enhancement of approximately 10%. This finding underscores the significant influence of nanoparticle quantity on the overall enhancement effect.
Lethality enhancement factor (LEF)
The LEF calculation was based on the presumption that an increased number of lethal events would occur due to the signaling pathway alterations (diminished repair kinetics or inactivation of defense system pathways) influenced by the presence of nanoparticles within the cellular volume. Consequently, the experimental results from the 6 MV clonogenic assay were employed as the reference parameter to compute the LEF for the 300 kVp irradiation. Fig. 5 illustrates the LEF values for FHA NPs and GNPs irradiated using the 300 kVp and 6 MV X-rays. A significant increase in the average lethal events by the LEF can be observed. The lethality demonstrates a heightened impact, reaching up to three- to fourfold in the case of the 6 MV exposure for both nanoparticles. As the dose escalates, the lethality tends to decay, approaching unity for both GNPs and FHA NPs, albeit with a more pronounced enhancement observed with GNPs. In the case of the 300 kVp exposure, a similar trend is noted; however, the LEF is consistently lower across all doses and for both studied nanoparticles which can be attributed to the higher LET from the 300 kVp beam. The findings imply that the presence of nanoparticles remarkably influences the biological sensitivity at lower doses, while the impact diminishes as the dose increases. The observed outcomes underscore the biological implications of both nanoparticles. As previously noted, FHA NPs act as ferroptosis inducers, depleting GSH and elevating ROS levels, functioning more as radiosensitizers than radioenhancers, as also indicated by the interaction probability. The increase in lethal events can be mainly attributed to biological factors. A comparable pattern is noted with GNPs; while predominantly studied for their radioenhancement properties, the results emphasize that sensitization in the presence of GNPs may share a similar mechanism to ferroptosis inducers.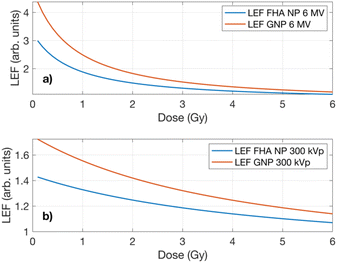 | ||
| Fig. 5 LEF as a function of dose in the A549 cell line exposed to (a) 6 MV and (b) 300 kVp X-rays in the presence of FHA NPs and GNPs. | ||
Modified LEM
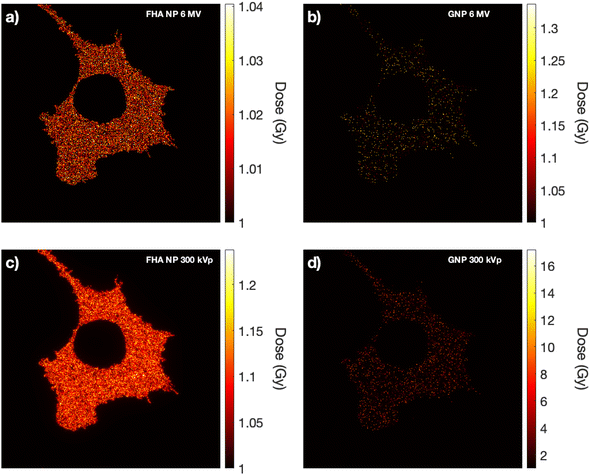
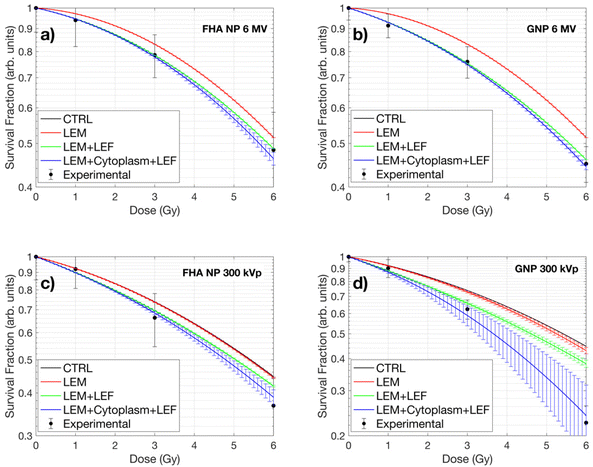
Within the framework of the nanoparticle-LEM, cellular images obtained via ODT imaging served as input data. To emulate a realistic scenario, the 100 nm diameter nanoparticles were randomly dispersed throughout the cell cytoplasm, as their size precludes entry into the cell nucleus.37Fig. 6 illustrates the intracellular dose distribution for a 1 Gy delivered dose. Notably, at higher photon energies (6 MV), the dose enhancement is minimal regardless of the nanoparticle type (Fig. 6a and b). Under 300 kVp irradiation, a minimal increase in dose deposition for FHA NPs was observed due to its higher cross section compared to 6 MV (Fig. 6c). Conversely, for 300 kVp GNPs, a substantially elevated dose deposition is noted in local points proximal to the nanoparticle placement (Fig. 6d). Despite the presence of high local dose peaks (nanometers away from the nanoparticle surface), only a small fraction manages to reach the cellular nucleus. The nucleus, as the critical target in the LEM, exhibits minimal influence from the increased nanoparticle-induced dose across all nanoparticle types.The resultant survival curves of the LEM and LEM-LEF are presented in Fig. 7. The solid black line represents the LQM for the CTRL scenario, while a red line depicts the outcome when the LEM is employed without any additional modifications. Notably, for all nanoparticle cases, the LEM closely aligns with the CTRL case due to the minimal increase in dose deposition within the nucleus. A subtle deviation in the survival curve is only observed in the scenario of GNPs under 300 kVp, highlighting the significance of local doses in the nucleus for this case. The green solid line portrays the LEM after the incorporation of the previously calculated LEF. In the case of 6 MV, the curve aligns, as expected, since the LEF was derived using 6 MV as a reference (Fig. 7a and b). However, in the case of 300 kVp, the curves for FHA NPs and GNPs (Fig. 7c and d) draw closer to the experimental values. Finally, the inclusion of the dose in the cytoplasm (solid blue line) results in further assimilation of the curve to the experimental outcomes. These findings underscore the significance of nanoparticle-associated radiosensitivity, as the LEM alone fails to adequately explain the experimental results. Moreover, the results indicate that although the nucleus is the primary target for radiation damage, doses in the cytoplasm pose a major impact as they can lead to lethal effects through alternative pathways, such as lipid peroxidation.
Table 5 illustrates the percentage increase in cell killing relative to the control LQM for various processes investigated in this study. The term “LEM” denotes the augmented cell killing resulting from elevated doses in the cellular nucleus due to radiation emitted by the nanoparticle. Meanwhile, “LEF” signifies the heightened cell killing attributed to altered signaling pathways induced by nanoparticle presence, thereby enhancing radiation efficacy. Lastly, “Dose in the Cytoplasm” represents the increased cell killing resulting from dose enhancement occurring within the cytoplasm. It is evident that, across both types of nanoparticles and irradiation energies, the contribution from additional physical dose in the critical target (nucleus) is minimal. This is attributed to the limited range of secondary particles, resulting in negligible additional dose deposition in the nucleus. Conversely, the LEF exhibits a significant contribution in all cases, suggesting its potential to surpass the enhanced radiation effects in the nucleus, particularly in scenarios involving large nanoparticles that cannot penetrate the nucleus membrane.
| 6 MV | 300 kVp | |||||||||||
|---|---|---|---|---|---|---|---|---|---|---|---|---|
| FHA NP (%) | GNP (%) | FHA NP (%) | GNP (%) | |||||||||
| Dose (Gy) | LEM | LEF | Dose cytoplasm | LEM | LEF | Dose cytoplasm | LEM | LEF | Dose cytoplasm | LEM | LEF | Dose cytoplasm |
| 1 | 0.00 | 2.56 | 0.06 | 0.00 | 4.29 | 0.05 | 0.05 | 2.58 | 0.10 | 0.28 | 4.43 | 0.81 |
| 3 | 0.01 | 5.50 | 0.81 | 0.00 | 9.28 | 0.60 | 0.24 | 5.53 | 1.24 | 1.29 | 9.53 | 8.03 |
| 6 | 0.02 | 5.51 | 4.67 | 0.02 | 10.65 | 3.20 | 0.72 | 5.52 | 6.07 | 3.77 | 10.71 | 28.06 |
Furthermore, the dose in the cytoplasm exerts a notable impact only in the case of GNPs irradiated under 300 kVp. This specific scenario demonstrates markedly high dose levels in the cytoplasm, indicative of its potential to exert a significant influence on cellular killing.
Table 6 shows the SER values derived from the application of the LQM to experimental data. Furthermore, it includes the SER values obtained via the LEM with the incorporated LEF and macroscopic dose in the cytoplasm, encompassing both energy modalities examined (6 MV and 300 kVp) and both nanoparticles (FHA NPs and GNPs). The SER values for the 6 MV align closely with the LQM model predictions, showing no significant impact from the increase in cytoplasmic dose. In the case of 300 kVp, the SER closely corresponds to the experimental conditions, with a maximum relative difference of 3.2%.
| X-ray energy | Nanoparticle | Computational model | SER (arb. units) | Relative difference (%) |
|---|---|---|---|---|
| 6 MV | FHA NP | LQM | 1.048 | 0.90 |
| LEM_LEF | 1.057 | |||
| GNP | LQM | 1.089 | 0.04 | |
| LEM_LEF | 1.090 | |||
| 300 kVp | FHA NP | LQM | 1.078 | 1.16 |
| LEM_LEF | 1.066 | |||
| GNP | LQM | 1.183 | 3.21 | |
| LEM_LEF | 1.221 | |||
Experimental
Nanoparticles
FHA NPs with a mean diameter of 105 ± 2 nm are Fe3O4-based nanoparticles coated with hyaluronic acid. A detailed explanation related to the preparation process and FHA NP characterization may be found elsewhere.38 GNPs with a mean diameter of 106 ± 8 nm were purchased from Sigma-Aldrich (St. Louis, MO, USA).Cell culture and nanoparticle exposure
Human lung carcinoma (A549) cells were purchased from the Cell Line Bank (Seoul, Korea) and cultured in RPMI 1640 containing 1% penicillin/streptomycin and 10% fetal bovine serum. Prior to irradiation, nanoparticles were dispersed in the culture medium at concentrations of 200 μg mL−1 and 20 μg mL−1 for FHA NPs and GNPs, respectively. The concentration of FHA NPs was chosen according to our earlier papers on FHA nanoparticles, while the concentration of GNPs was chosen from the literature regarding GNP uptake.17,38–41 Thereafter, cells were kept in an incubator for 12 h for cellular uptake.Cell irradiation
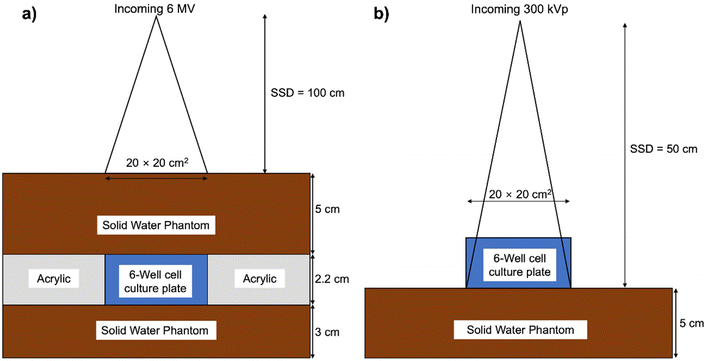
Using a linear accelerator (model TrueBeam STx, Varian Medical Systems, Palo Alto, CA), high-energy X-ray (6 MV) irradiation was performed. The irradiation adhered to the procedures outlined by the AAPM TG-51 protocol for absorbed dose calibration.42 A 3 cm solid water phantom was positioned beneath the 6-well cell culture plate to account for backscatter, while custom-manufactured acrylic holders were strategically placed on all sides of the cell plate for lateral scattering. Moreover, a 5 cm solid water phantom was positioned atop the cell plate to address radiation build-up. The source-to-surface distance (SSD) was set at 100 cm, placing the isocenter at the dish's position with a field size of 20 × 20 cm and a dose rate of 600 MU min−1 (Fig. 8a). For low-energy photon (300 kVp) irradiation, an X-RAD 320 (Precision X-ray Inc., North Branford, CT) was employed. The irradiation was conducted according to the in-air method procedure established by the AAPM TG-61 protocol for radiotherapy and radiobiology.43 Low-energy X-ray irradiation utilized a 20 × 20 field size with a 50 cm SSD, a 2 mm aluminum filter, and a dose rate of 47 mGy s−1 (Fig. 8b). The cells, preincubated with FHA NPs and GNPs, underwent irradiation with doses of 1, 3, and 6 Gy for both 6 MV and 300 kVp X-rays.Clonogenic assay
A549 cells were seeded in a 6-well plate, treated with FHA NPs and GNPs, respectively, and then irradiated with X-rays. Cells from the control group and those treated with FHA NPs and GNPs were subjected to a 2-week incubation period after irradiation. Subsequently, the colonies were fixed using a fixation solution (4% paraformaldehyde for 30 min) and subsequently stained with 0.05% crystal violet. The survival fraction for the control, FHA NP, and GNP group was calculated by counting the colony formation relative to non-irradiated cells.44 The survival fractions were fitted to the LQM SF(D) = e−(αD+βD2) (where D = dose delivered to the cells, α and β = fitting parameters). The SER was determined by calculating the ratio of the area under the survival curve for the control group and that for the group treated with nanoparticles up to 6 Gy.Cellular uptake quantification
Cell culture was performed under previously specified conditions mentioned above. The amount of intracellular iron and gold by FHA NPs and GNPs was quantified using ICP-AES (Optima 8300; PerkinElmer, USA). The average nanoparticle number was determined using the method described earlier for GNPs.45ODT
ODT images of the A549 cancer cell control group were acquired using Tomocube (Ht-1H; Tomocube Inc., Daejeon, Korea). DAPI staining was used to accurately localize the nucleus, and mitochondria were stained using MitoTracker Deep Red FM. Thereafter, the MPI images were exported to an in-house algorithm created in MATLAB® version 2022a (MathWorks® Inc., Natick, MA) for manual segmentation of the membrane and the nucleus. The cell membrane and nucleus segmentation were used as input parameters for the LEM. A total of eight ODT cellular images (n = 8) were used for later calculations.Monte Carlo simulations
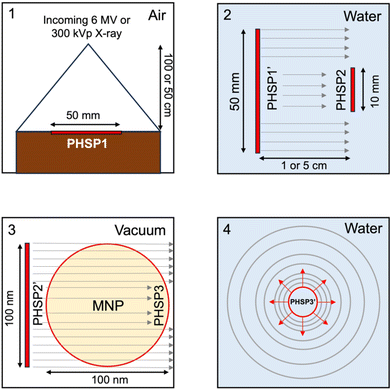
Monte Carlo simulations were performed for the FHA NP and GNP radial dose distribution as previously reported elsewhere.32 The simulations were performed using TOPAS 3.8.1, built on GEANT4 10.07.p03.46,47 Monte Carlo simulations employing discrete models can provide a valuable single-event electron transport, allowing precise tracking of electrons down to the nanoscale, thus rendering them highly desirable for such applications.48–53 However, as of now, TOPAS supports discrete models for liquid water only.54 Consequently, we chose to utilize the condensed history models, specifically the PENELOPE model, for simulating gold and iron oxide. PENELOPE has been well-regarded for its accuracy in nanodosimetry, particularly at low energies, thus offering a reliable alternative to our study.55 Moreover, we employed track-structure simulations for scoring dose deposition in liquid water with the Geant4-DNA model. FHA NP was simulated as a Fe3O4 material nanoparticle without considering any surface coating. For the 6 MV beam, the initial beam source utilized a PHSP obtained from the IAEA website, corresponding to the Varian TrueBeam. The 300 kVp beam source was acquired from the SpekCalc software.56 The Monte Carlo simulation comprised four sequential steps. Initially, the simulation followed the previously described irradiation setup. Consequently, a 50 mm PHSP1 was recorded at distances of 5 cm or 1 cm away from the cell plate dish for the 6 MV and 300 kVp beams, respectively. Following this, PHSP1 served as a beam source, and a 10 mm-radius PHSP2 was positioned at the cell plate location to consider scattering through water. Furthermore, the recorded PHSP2 was rescaled to a 100 nm diameter and employed as a beam source incident directly on the FHA NP or GNP. A third PHSP3, placed at the nanoparticle surface, recorded the secondary electrons escaping from the nanoparticle volume. In the final simulation, PHSP3 was used as a beam source in a 2.5 × 2.5 × 2.5 μm3 water phantom. The radial dose per ionization event was scored using spherical shells with thicknesses ranging from 1 to 100 nm, 10 nm to 1 μm, and 100 nm to 10 μm. Penelope physics were employed throughout all simulations, except for dose scoring in water, where Geant4-DNA physics were used to score radial dose distributions.57–60 Electron tracking was conducted down to 100 eV, and the production threshold was set to 1 nm. In all simulations, fluorescence, Auger electron emission, and Auger cascades were activated. Fig. 9 shows the diagram of the geometries used at each step of the Monte Carlo simulations. The simulations were conducted for individual nanoparticles, with subsequent extrapolation to the total nanoparticle population within the cell. However, potential clustering effects were not accounted for.The interaction probability per Gy for the FHA NP and the GNP was calculated as follows:
 | (1) |
The DEF was computed by dividing the additional dose deposited by a single nanoparticle by the dose when no nanoparticle was present, under the assumption of a homogeneous dose distribution of 1 Gy, as follows:
 | (2) |
LEF
The presence of nanoparticles within the cell, referred to as radiosensitization, was considered as a factor that enhances lethality, denoted as the LEF. Using the LQM parameters α and β, the mean number of lethal events “![[N with combining macron]](https://www.rsc.org/images/entities/i_char_004e_0304.gif) ” for various incident energies is described as follows:
” for various incident energies is described as follows:![[N with combining macron]](https://www.rsc.org/images/entities/i_char_004e_0304.gif) = αD + βD2. = αD + βD2. | (3) |
In this research, we assumed that the 6 MV X-rays would induce an almost negligible physical enhancement, as indicated by theoretical predictions.8,10,32,61 Consequently, we attributed the observed rise in cell lethality exclusively to modifications in signaling pathways secondary to the presence of FHA NPs and GNPs. We calculated the LEF using the LQM based on data from the 6 MV clonogenic assays with and without FHA NPs and GNPs to quantify the enhancement in the number of lethal events. The increase in cell killing as a function of dose for 6 MV X-rays, associated with the presence of nanoparticles, was computed as follows:
 | (4) |
The increase in cell death from the 6 MV was incorporated into the LQM analysis for the control group exposed to a specific energy E (6 MV and 300 kVp X-rays for this study) as in:
 | (5) |
Consequently, the mean lethal occurrences for the E under investigation in the presence of nanoparticles can be determined as follows:
 | (6) |
Ultimately, the LEF under E irradiation in the presence of nanoparticles can be computed according to the following:
 | (7) |
Finally, the following equation outlines how the expected survival curve for cells exposed to E = 300 kVp X-rays in the presence of MNP can be obtained by multiplying the average lethal events noted in the control group by the calculated LEF, excluding the NP radioenhancement as follows:
 | (8) |
Modification of the LEM
The LEM computes the biological impacts of the charged particle radiation by considering their unique microscopic energy deposition patterns in the cell nucleus, which contrast with those of photon radiation.27,28 Cell survival was determined through the utilization of the GNP-LEM, as previously detailed elsewhere.29,32 Previously segmented ODT cellular images were utilized for the random dispersion of FHA NPs and GNPs within the intracellular cytoplasm. The number of particles for each nanoparticle case was previously calculated using ICP-AES. The LEM delineates the concept of lethal events, denoted as “lethal events (N)” as a function of the radiation dose (D). For this study, the overall macroscopic survival rate in the presence of FHA NPs and GNPs can be expressed in terms of the average lethal events occurring in the nucleus multiplied by the previously calculated LEF as previously described in eqn (8).The intracellular (nucleus and cytoplasm) spatial distribution of the dose can be characterized as the sum of two components: the uniformly delivered dose and the supplementary dose arising from interactions with FHA NPs and GNPs. This supplementary dose is calculated by adding up the nanoparticle's radial dose multiplied by the interaction probability for each delivered dose. The lethal events in the nucleus for each local dose were calculated as follows:
 | (9) |
To obtain the survival fraction in the function of the dose, the mean lethal events within the cell nucleus, determined via the LEM, were multiplied by the previously derived LEF.
Ultimately, due to the potential for increased lethal events in the cytoplasmic region resulting from dose increments, which might not be linked to direct or indirect DNA damage but rather to lipid peroxidation (as in ferroptosis) caused by ROS generation, we introduced a fraction of the lethal events that would be increased by the macroscopic dose enhancement within the cytoplasmic area, resulting from the deposition of nanoparticle dose in the cytoplasm as in:
 | (10) |
 is the relative biological efficacy, as previously described for the biological effective dose, and Dc is the macroscopic dose in the cytoplasm, where Dc,NP denotes the cytoplasmic dose in the presence of nanoparticles, and Dc,delivered represents the cytoplasmic dose in the absence of nanoparticles.62
Conclusions
We explored the intricate dynamics of nanoparticle-induced radiosensitization by conducting specially designed clonogenic assays and employing real cell images. The study considered the impact of two different types of nanoparticles, namely FHA NPs and GNPs, under 6 MV and 300 kVp X-rays. Experimental findings, as illustrated in the clonogenic assay results and survival curves, underscored the nuanced effects of nanoparticle-induced radiosensitivity. Moreover, the physical dose enhancement contributions and the biological sensitization by MNP were separated as their own factors in a new computational survival model. The new computational model on real cell images, LEM incorporating the LEF, was developed to examine the intricate interplay between nanoparticle characteristics, radiation modalities, and cellular response. Notably, the results emphasized the significance of accounting for nanoparticle-induced radiosensitivity, as observed in the pronounced impact on survival curves. The study limitation is its reliance on the clonogenic assay and the LQM parameters of the cell line used for both 6 MV scenarios with and without nanoparticles, serving as input for the LEF calculation. Thus, additional investigations are warranted to understand the dependence of the LEF on cell lines, X-ray energies (over 6 MV), and intracellular concentrations of MNP. Due to these, the model may display significant sensitivity to variations in the LQM parameters. However, this study provided valuable insight into the advent of nanoparticle-enhanced radiotherapy, emphasizing the necessity of tailored computational models to capture the intricacies of cellular responses to nanoparticle induced-biosensitization and dose enhancement.Author contributions
Rodrigo Hernández Millares: conceptualization, data curation, investigation, methodology, visualization, writing – original draft, writing – review & editing. Chaewon Bae: conceptualization, data curation, investigation, methodology, visualization, writing – original draft, writing – review & editing. Seok-Jin Kim: methodology, investigation, writing – reviewing. Taewan Kim: methodology, investigation, writing – reviewing. So-Yeon Park: resources, investigation, writing – reviewing. Kangwon Lee: supervision, conceptualization, validation, writing – reviewing and editing, funding acquisition, project administration. Sung-Joon Ye: supervision, conceptualization, validation, writing – reviewing and editing, funding acquisition, project administration.Conflicts of interest
There are no conflicts to declare.Acknowledgements
This work was supported by the National Research Foundation of Korea (NRF) grant funded by the Korea government (MSIT) (RS-2023-00237149) and Basic Science Research Program through the National Research Foundation of Korea (NRF) funded by the Ministry of Education (NRF-2022R1A6A1A03063039). This research was supported by a grant of Ministry of Trade, Industry and Energy, Republic of Korea (no. 20018522) and a grant from the Korea Health Technology R&D Project through the Korea Health Industry Development Institute (KHIDI), funded by the Ministry of Health & Welfare, Republic of Korea (no. HI22C139400). Furthermore, this work was in part supported by the Research Institute for Convergence Science.Notes and references
- R. A. Chandra, F. K. Keane, F. E. Voncken and C. R. Thomas, Lancet, 2021, 398, 171–184 CrossRef PubMed.
- B. Lin, F. Gao, Y. Yang, D. Wu, Y. Zhang, G. Feng, T. Dai and X. Du, Front. Oncol., 2021, 11, 644400 CrossRef CAS PubMed.
- M. Varzandeh, L. Sabouri, V. Mansouri, M. Gharibshahian, N. Beheshtizadeh, M. R. Hamblin and N. Rezaei, Bioeng. Transl. Med., 2023, 8, e10498 CrossRef CAS PubMed.
- L. R. Gerken, M. E. Gerdes, M. Pruschy and I. K. Herrmann, Mater. Horiz., 2023, 10, 4059–4082 RSC.
- L. Gong, Y. Zhang, C. Liu, M. Zhang and S. Han, Int. J. Nanomed., 2021, 16, 1083–1102 CrossRef PubMed.
- J. F. Hainfeld, D. N. Slatkin and H. M. Smilowitz, Phys. Med. Biol., 2004, 49, N309 CrossRef CAS PubMed.
- K. Cheng, M. Sano, C. H. Jenkins, G. Zhang, D. Vernekohl, W. Zhao, C. Wei, Y. Zhang, Z. Zhang and Y. Liu, ACS Nano, 2018, 12, 4946–4958 CrossRef CAS PubMed.
- J. Schuemann, R. Berbeco, D. B. Chithrani, S. H. Cho, R. Kumar, S. J. McMahon, S. Sridhar and S. Krishnan, Int. J. Radiat. Oncol., Biol., Phys., 2016, 94, 189–205 CrossRef PubMed.
- S. Rosa, C. Connolly, G. Schettino, K. T. Butterworth and K. M. Prise, Cancer Nanotechnol., 2017, 8, 2 CrossRef PubMed.
- S. Jain, J. A. Coulter, A. R. Hounsell, K. T. Butterworth, S. J. McMahon, W. B. Hyland, M. F. Muir, G. R. Dickson, K. M. Prise, F. J. Currell, J. M. O'Sullivan and D. G. Hirst, Int. J. Radiat. Oncol., Biol., Phys., 2011, 79, 531–539 CrossRef CAS PubMed.
- S. Her, D. A. Jaffray and C. Allen, Adv. Drug Delivery Rev., 2017, 109, 84–101 CrossRef CAS PubMed.
- D. B. Guerra, E. M. N. Oliveira, A. R. Sonntag, P. Sbaraine, A. P. Fay, F. B. Morrone and R. M. Papaléo, Sci. Rep., 2022, 12, 9602 CrossRef CAS PubMed.
- G. Lei, C. Mao, Y. Yan, L. Zhuang and B. Gan, Protein Cell, 2021, 12, 836–857 CrossRef CAS PubMed.
- G. Lei, Y. Zhang, P. Koppula, X. Liu, J. Zhang, S. H. Lin, J. A. Ajani, Q. Xiao, Z. Liao, H. Wang and B. Gan, Cell Res., 2020, 30, 146–162 CrossRef CAS PubMed.
- J. Cai, X. Xu and P. E. Saw, Sci. China: Life Sci., 2024, 67, 19–40 CrossRef CAS PubMed.
- J. Su, Q. Zhao, Z. Zheng, H. Wang, C. Bian, L. Meng, Y. Xin and X. Jiang, Antioxidants, 2022, 11, 921 CrossRef CAS PubMed.
- C. Bae, R. Hernández Millares, S. Ryu, H. Moon, D. Kim, G. Lee, Z. Jiang, M. H. Park, K. H. Kim, W. S. Koom, S.-J. Ye and K. Lee, Small, 2024, 2310873 CrossRef PubMed.
- G. L. Beretta and N. Zaffaroni, Front. Mol. Biosci., 2023, 10, 1216733 CrossRef CAS PubMed.
- Y. Lin, X. Chen, C. Yu, G. Xu, X. Nie, Y. Cheng, Y. Luan and Q. Song, Acta Biomater., 2023, 159, 300–311 CrossRef CAS PubMed.
- Y. K. Hou, Z. J. Zhang, R. T. Li, J. Peng, S. Y. Chen, Y. R. Yue, W. H. Zhang, B. Sun, J. X. Chen and Q. Zhou, ACS Appl. Mater. Interfaces, 2023, 15, 2602–2616 CrossRef CAS PubMed.
- W. Jiang, L. Wei, B. Chen, X. Luo, P. Xu, J. Cai and Y. Hu, J. Nanobiotechnol., 2022, 20, 129 CrossRef CAS PubMed.
- H. Sun, H. Cai, C. Xu, H. Zhai, F. Lux, Y. Xie, L. Feng, L. Du, Y. Liu, X. Sun, Q. Wang, H. Song, N. He, M. Zhang, K. Ji, J. Wang, Y. Gu, G. Leduc, T. Doussineau, Y. Wang, Q. Liu and O. Tillement, J. Nanobiotechnol., 2022, 20, 449 CrossRef CAS PubMed.
- Z. Yang, S. Huang, Y. Liu, X. Chang, Y. Liang, X. Li, Z. Xu, S. Wang, Y. Lu, Y. Liu and W. Liu, J. Med. Chem., 2022, 65, 8401–8415 CrossRef CAS PubMed.
- M. Laprise-Pelletier, Y. Ma, J. Lagueux, M. F. Côté, L. Beaulieu and M. A. Fortin, ACS Nano, 2018, 12, 2482–2497 CrossRef CAS PubMed.
- M. Laprise-Pelletier, J. Lagueux, M. F. Côté, T. LaGrange and M. A. Fortin, Adv. Healthc. Mater., 2017, 6, 1601120 CrossRef PubMed.
- H. Kim, W. Sung and S. J. Ye, Radiat. Res., 2021, 195, 293–300 CAS.
- M. Scholz and G. Kraft, Adv. Space Res., 1996, 18, 5–14 CrossRef CAS PubMed.
- M. Scholz and G. Kraft, Radiat. Res., 2004, 161, 612–620 CrossRef CAS PubMed.
- Y. Lin, S. J. McMahon, H. Paganetti and J. Schuemann, Phys. Med. Biol., 2015, 60, 4149–4168 CrossRef PubMed.
- W. Sung, Y. Jeong, H. Kim, H. Jeong, C. Grassberger, S. Jung, G. O. Ahn, I. H. Kim, J. Schuemann, K. Lee and S. J. Ye, Radiat. Res., 2018, 190, 558–564 CAS.
- W. Sung and J. Schuemann, Phys. Med. Biol., 2018, 63, 135001 CrossRef PubMed.
- W. Sung, S.-J. Ye, A. L. McNamara, S. J. McMahon, J. Hainfeld, J. Shin, H. M. Smilowitz, H. Paganetti and J. Schuemann, Nanoscale, 2017, 9, 5843–5853 RSC.
- R. M. Schmidt, D. Hara, J. D. Vega, M. B. Abuhaija, W. Tao, N. Dogan, A. Pollack, J. C. Ford and J. Shi, Pharmaceutics, 2022, 14, 2205 CrossRef CAS PubMed.
- S. McMahon, A. McNamara, J. Schuemann, K. Prise and H. Paganetti, J. Phys.: Conf. Ser., 2017, 777, 012008 CrossRef.
- S. J. McMahon, W. B. Hyland, M. F. Muir, J. A. Coulter, S. Jain, K. T. Butterworth, G. Schettino, G. R. Dickson, A. R. Hounsell, J. M. O'Sullivan, K. M. Prise, D. G. Hirst and F. J. Currell, Radiother. Oncol., 2011, 100, 412–416 CrossRef CAS PubMed.
- S. J. McMahon, Phys. Med. Biol., 2018, 64, 01tr01 CrossRef PubMed.
- C. Boyoglu, Q. He, G. Willing, S. Boyoglu-Barnum, V. A. Dennis, S. Pillai and S. R. Singh, ISRN Nanotechnol., 2013, 2013, 123838 Search PubMed.
- C. Bae, H. Kim, Y. M. Kook, C. Lee, C. Kim, C. Yang, M. H. Park, Y. Piao, W. G. Koh and K. Lee, Mater. Today Bio, 2022, 17, 100457 CrossRef CAS PubMed.
- X. Xie, J. Liao, X. Shao, Q. Li and Y. Lin, Sci. Rep., 2017, 7, 3827 CrossRef PubMed.
- C. Krishnaraj, P. Muthukumaran, R. Ramachandran, M. Balakumaran and P. Kalaichelvan, Biotechnol. Rep., 2014, 4, 42–49 CrossRef CAS PubMed.
- E. Rodríguez-León, B. E. Rodríguez-Vázquez, A. Martínez-Higuera, C. Rodríguez-Beas, E. Larios-Rodríguez, R. E. Navarro, R. López-Esparza and R. A. Iñiguez-Palomares, Nanoscale Res. Lett., 2019, 14, 1–16 CrossRef PubMed.
- P. R. Almond, P. J. Biggs, B. M. Coursey, W. F. Hanson, M. S. Huq, R. Nath and D. W. Rogers, Med. Phys., 1999, 26, 1847–1870 CrossRef CAS PubMed.
- C.-M. Ma, C. W. Coffey, L. A. DeWerd, C. Liu, R. Nath, S. M. Seltzer and J. P. Seuntjens, Med. Phys., 2001, 28, 868–893 CrossRef CAS PubMed.
- N. A. Franken, H. M. Rodermond, J. Stap, J. Haveman and C. van Bree, Nat. Protoc., 2006, 1, 2315–2319 CrossRef CAS PubMed.
- J. A. Coulter, S. Jain, K. T. Butterworth, L. E. Taggart, G. R. Dickson, S. J. McMahon, W. B. Hyland, M. F. Muir, C. Trainor, A. R. Hounsell, J. M. O'Sullivan, G. Schettino, F. J. Currell, D. G. Hirst and K. M. Prise, Int. J. Nanomed., 2012, 7, 2673–2685 CrossRef CAS PubMed.
- B. Faddegon, J. Ramos-Méndez, J. Schuemann, A. McNamara, J. Shin, J. Perl and H. Paganetti, Phys. Med., 2020, 72, 114–121 CrossRef PubMed.
- J. Perl, J. Shin, J. Schumann, B. Faddegon and H. Paganetti, Med. Phys., 2012, 39, 6818–6837 CrossRef CAS PubMed.
- D. Sakata, S. Incerti, M. C. Bordage, N. Lampe, S. Okada, D. Emfietzoglou, I. Kyriakou, K. Murakami, T. Sasaki, H. Tran, S. Guatelli and V. N. Ivantchenko, J. Appl. Phys., 2016, 120(24), 244901 CrossRef.
- D. Sakata, I. Kyriakou, S. Okada, H. N. Tran, N. Lampe, S. Guatelli, M.-C. Bordage, V. Ivanchenko, K. Murakami, T. Sasaki, D. Emfietzoglou and S. Incerti, Med. Phys., 2018, 45, 2230–2242 CrossRef CAS PubMed.
- D. Sakata, I. Kyriakou, H. N. Tran, M.-C. Bordage, A. Rosenfeld, V. Ivanchenko, S. Incerti, D. Emfietzoglou and S. Guatelli, Phys. Med., 2019, 63, 98–104 CrossRef PubMed.
- E. Engels, S. Bakr, D. Bolst, D. Sakata, N. Li, P. Lazarakis, S. J. McMahon, V. Ivanchenko, A. B. Rosenfeld and S. Incerti, Phys. Med. Biol., 2020, 65, 225017 CrossRef CAS PubMed.
- I. Kyriakou, D. Emfietzoglou, V. Ivanchenko, M. Bordage, S. Guatelli, P. Lazarakis, H. Tran and S. Incerti, J. Appl. Phys., 2017, 122(2), 024303 CrossRef.
- I. Kyriakou, V. Ivanchenko, D. Sakata, M. Bordage, S. Guatelli, S. Incerti and D. Emfietzoglou, Phys. Med., 2019, 58, 149–154 CrossRef CAS PubMed.
- J. Schuemann, A. L. McNamara, J. Ramos-Méndez, J. Perl, K. D. Held, H. Paganetti, S. Incerti and B. Faddegon, Radiat. Res., 2019, 191, 125–138 CAS.
- Y. Lin, S. J. McMahon, M. Scarpelli, H. Paganetti and J. Schuemann, Phys. Med. Biol., 2014, 59, 7675 CrossRef PubMed.
- G. Poludniowski, G. Landry, F. DeBlois, P. M. Evans and F. Verhaegen, Phys. Med. Biol., 2009, 54, N433–N438 CrossRef CAS PubMed.
- S. Incerti, G. Baldacchino, M. Bernal, R. Capra, C. Champion, Z. Francis, P. Guèye, A. Mantero, B. Mascialino, P. Moretto, P. Nieminen, C. Villagrasa and C. Zacharatou, Int. J. Model. Simul. Sci. Comput., 2010, 01, 157–178 CrossRef.
- S. Incerti, A. Ivanchenko, M. Karamitros, A. Mantero, P. Moretto, H. N. Tran, B. Mascialino, C. Champion, V. N. Ivanchenko, M. A. Bernal, Z. Francis, C. Villagrasa, G. Baldacchin, P. Guèye, R. Capra, P. Nieminen and C. Zacharatou, Med. Phys., 2010, 37, 4692–4708 CrossRef CAS PubMed.
- M. A. Bernal, M. C. Bordage, J. M. C. Brown, M. Davídková, E. Delage, Z. El Bitar, S. A. Enger, Z. Francis, S. Guatelli, V. N. Ivanchenko, M. Karamitros, I. Kyriakou, L. Maigne, S. Meylan, K. Murakami, S. Okada, H. Payno, Y. Perrot, I. Petrovic, Q. T. Pham, A. Ristic-Fira, T. Sasaki, V. Štěpán, H. N. Tran, C. Villagrasa and S. Incerti, Phys. Med., 2015, 31, 861–874 CrossRef CAS PubMed.
- S. Incerti, I. Kyriakou, M. A. Bernal, M. C. Bordage, Z. Francis, S. Guatelli, V. Ivanchenko, M. Karamitros, N. Lampe, S. B. Lee, S. Meylan, C. H. Min, W. G. Shin, P. Nieminen, D. Sakata, N. Tang, C. Villagrasa, H. N. Tran and J. M. C. Brown, Med. Phys., 2018, 45, e722–e739 CrossRef CAS PubMed.
- J. A. Mirza, K. Choi, W. Sung, S. Jung and S. J. Ye, Phys. Med., 2019, 68, 1–9 CrossRef PubMed.
- J. F. Fowler, Br. J. Radiol., 2010, 83, 554–568 CrossRef CAS PubMed.
Footnote |
| † These authors contributed equally. |
| This journal is © The Royal Society of Chemistry 2024 |

