
DNA-modified Prussian blue nanozymes for enhanced electrochemical biosensing†
Lin-Hui
Huang
a,
Yu-Yu
Hsieh
a,
Fu-An
Yang
a and
Wei-Ching
Liao
 *ab
*ab
aInstitute of Biochemistry and Molecular Biology, National Yang Ming Chiao Tung University, Taipei 112, Taiwan. E-mail: wcliao@nycu.edu.tw
bMedical Device Innovation and Translation Center, National Yang Ming Chiao Tung University, Taipei 112, Taiwan
First published on 10th April 2024
Abstract
Prussian blue nanoparticles exhibit the potential to be employed in bioanalytical applications due to their robust stability, peroxidase-like catalytic functionality, straightforward synthesis, and biocompatibility. An efficient approach is presented for the synthesis of nucleic acid-modified Prussian blue nanoparticles (DNA–PBNPs), utilizing nanoparticle porosity to adsorb nucleic acids (polyT). This strategic adsorption leads to the exposure of nucleic acid sequences on the particle surface while retaining catalytic activity. DNA–PBNPs further couple with functional nucleic acid sequences and aptamers through complementary base pairing to act as transducers in biosensors and amplify signal acquisition. Subsequently, we integrated a copper ion-dependent DNAzyme (Cu2+–DNAzyme) and a vascular endothelial growth factor aptamer (VEGF aptamer) onto screen-printed electrodes to serve as recognition elements for analytes. Significantly, our approach leverages DNA–PBNPs as a superior alternative to traditional enzyme-linked antibodies in electrochemical biosensors, thereby enhancing both the efficiency and adaptability of these devices. Our study conclusively demonstrates the application of DNA–PBNPs in two different biosensing paradigms: the sensitive detection of copper ions and vascular endothelial growth factor (VEGF). These results indicate the promising potential of DNA-modified Prussian blue nanoparticles in advancing bioanalytical sensing technologies.
1. Introduction
In recent years, due to the development of nanoscience, many researchers have devoted themselves to the development of supramolecular complexes or inorganic nanomaterials that mimic the catalytic activity of enzymes, leading to the successful synthesis of nanomaterials of various compositions and shapes.1–6 The catalytic activity of nanomaterials has attracted the attention of many scientists. These artificial nanomaterials with catalytic activity are called nanozymes,7–10 which not only have catalytic mechanisms similar to those of natural enzymes, but also can catalyze reactions in a near-physiological environment, are easier to synthesize and prepare than natural enzymes, and have higher long-term stability suitable for their preservation. The catalytic activity can be adjusted according to their composition and size,11–13 so they have the potential to replace natural enzymes in the field of biomedical sensing or drug therapy.14–21One noteworthy candidate in this field is Prussian blue, originally utilized as a pigment due to its deep blue color. This mixed-valence compound is composed of trivalent ferric ions (Fe3+) and divalent ferrous ions (Fe2+). It forms a coordination polymer with the chemical formula FeIII4[FeII(CN)6]3·nH2O, typically synthesized through the reaction of ferric chloride (FeCl3) with octahedral ferrocyanide [Fe(CN)6]2+.22,23 With the ferrous ion at the center, it coordinates with six carbon atoms of cyanide (CN−), and the nitrogen atom on the cyanide bridges and coordinates with the iron ion to form a face-centered cubic porous crystal structure.24–28 It has unique magnetic, optical and electrochemical properties and is therefore widely used in batteries and sensors.29,30 Prussian blue nanoparticles offer biomedical advantages with low cytotoxicity, metabolism, and minimal immunogenicity.31,32 Their porous nature provides adsorption properties similar to those of other mesoporous materials,33 facilitating the targeted delivery of therapeutic agents34,35 and offering solutions for issues like heavy-metal poisoning and radiation exposure.36,37 These attributes highlight their biocompatibility and potential in precise therapies and diagnostics, making them versatile tools in biomedicine. Beyond traditional applications, Prussian blue nanoparticles and their analogues have also been found to mimic the activities of peroxidase, catalase and superoxide dismutase.38–41 Notably, they are particularly adept at simulating peroxidase reactions with various substrates, including dopamine, luminol and nicotinamide adenine dinucleotide (NADH).39 Horseradish peroxidase (HRP) serves as a catalytic indicator frequently employed in enzyme-linked immunosorbent assay (ELISA) utilized for biosensing purposes. The reliability of the test can be readily influenced by the endurance of protein enzymes and antibodies. The Prussian blue nanozyme exhibits peroxidase-like catalytic attributes along with enhanced stability. This makes it a viable alternative to native enzymes, thereby enhancing the precision of outcomes.42–44
The encoded information within nucleic acid sequences offers versatile tools for recognizing molecules. Nucleic acid molecules (DNA or RNA) that go beyond their traditional roles in storing and transferring genetic information and instead perform specific functions are referred to as functional nucleic acids.45,46 Notably, aptamers consist of short sequences of RNA or DNA that are specific to certain targets and selectively bind to ligands. These interactions result in ligand–aptamer complexes that exhibit greater thermal stability compared to protein antibodies.46–50 With the advancement of the systematic evolution of ligands by exponential enrichment (SELEX),51,52 an increasing number of nucleic acid aptamers are available to replace protein antibodies for analyte identification. They can identify a wide range of small-molecule compounds,24,53,54 proteins,55–57 viruses,58,59 bacteria,60,61 and cells.62,63 In addition, DNAzymes (catalytic nucleic acids) are single-stranded DNA sequences that, in the presence of cofactors such as copper ions,64,65 lead ions,66,67 and histidine,68 are capable of catalyzing the cleavage or ligation of nucleic acid substrates similar to ribozymes.69–71 Presently, DNAzymes have not been found in nature; however, similar to aptamers, they can be produced on a large scale.
This study aims to develop a universal method for connecting Prussian blue nanozymes with nucleic acid sequences, enabling the Prussian blue nanozymes to present prominent or exposed nucleic acid sequences on their surface. Current research on combining nucleic acids with Prussian blue nanozymes as catalytic markers or for similar applications is extremely limited. Lu et al. have investigated the effect of using DNA as a template on the morphology of Prussian blue nanoparticles.72 Various studies have explored covalently bonding DNA to the functional groups on the surface of PBNPs for biosensing applications, necessitating additional steps for functional group modification.73,74 Meanwhile, due to the porous nature of PBNPs and their being widely used as adsorbents, their adsorptive properties have also been harnessed to carry nucleic acids or drugs.75 Another study has developed the in situ synthesis of Prussian blue nanoparticles on magnetic particles as a catalytic label in enzyme-linked immunosorbent assays for mycotoxin detection.76 However, this method still relies on antibodies for analyte recognition, thus retaining the instability of proteins. Therefore, our research focuses on combining Prussian blue nanozymes with functional nucleic acids to create a versatile DNA-modified Prussian blue nanozyme catalytic marker. Our previous experiments have demonstrated that DNA, when covalently modified, tends to adsorb onto the surface of Prussian blue nanoparticles (PBNPs). This raises questions about the functional attachment of DNA to PBNPs via functional groups, thereby reducing the efficiency of DNA in recognizing analytes. Therefore, in this study, we propose directly adsorbing onto PBNPs a saturation amount of polyT DNA to synthesize DNA–PBNPs, aiming to achieve the following objectives: (1) simplified synthesis that avoids the need for additional functional group modifications on PBNPs, thus streamlining the synthesis process compared to covalent bonding methods; (2) optimal DNA orientation, wherein saturation adsorption ensures a sufficient amount of DNA protrudes outwards, maximizing its ability to recognize and bind target analytes; (3) a universal linker where the polyT DNA sequence acts as a versatile linker, requiring only a complementary polyA sequence at the end of the aptamer for efficient capture by the DNA–PBNPs; and (4) enhanced anti-fouling achieved by surface saturation with DNA, where non-specific binding is potentially minimized, leading to improved sensor performance. To the best of our knowledge, we are the first to design polyT DNA adsorbed on the surface of PBNPs to form DNA–PBNPs used as a universal signal reporter. By employing DNA-modified Prussian blue nanozymes, we have successfully demonstrated two distinct electrochemical sensing platforms: one using a copper ion-dependent DNAzyme (Cu2+–DNAzyme) for environmental copper ion detection, and the other employing a vascular endothelial growth factor (VEGF) aptamer for precise detection of the protein biomarker VEGF.
2. Materials and methods
2.1. Reagents and materials
Acetone was sourced from Merck (Ward Hill, MA, USA), while various chemicals such as bovine serum albumin (BSA), casein, citric acid, ethanol, iron(III) chloride (FeCl3), reduced L-glutathione, potassium hexacyanoferrate(II) trihydrate (K4Fe(CN)6·3H2O), and 3,3′,5,5′-tetramethylbenzidine (TMB) were procured from Sigma-Aldrich (St Louis, MO, USA). The enhanced K-blue TMB substrate, essential for the biosensor's output signal, was purchased from Neogen (Lansing, MI, USA). VEGF A165 was sourced from GenScript (Piscataway, NJ, USA). The screen-printed gold electrode (AuSPE, model AUTE100AgCl) used in the experiments was obtained from Zensor R&D (Taichung, Taiwan). Deionized water with a purity of 18.2 MΩ·cm, obtained from the Milli-Q® direct water purification system, was used to prepare all aqueous solutions throughout the study.The oligonucleotides of DNA employed in this research for the purpose of target identification included a thiol-modified, copper ion-dependent DNAzyme,77,78 specifically the sequence 5′-/5ThioMC6-D/GGTTCCTCAGCATC![[T with combining low line]](https://www.rsc.org/images/entities/char_0054_0332.gif)
![[C with combining low line]](https://www.rsc.org/images/entities/char_0043_0332.gif)
![[A with combining low line]](https://www.rsc.org/images/entities/char_0041_0332.gif)
![[G with combining low line]](https://www.rsc.org/images/entities/char_0047_0332.gif) -3′. Additionally, two VEGF aptamers were used for the construction of a sandwich-type biosensor:79,80 the thiol-modified VEGF aptamer1 (VEap121),81 with the sequence 5′-/5ThioMC6-D/ATGACTAG-3′, and the VEGF aptamer2 (SL2-B),82,83 with the sequence 5′-AAAAAAAAAAAAAAAAAAAA-3′. Sequences essential for target recognition are underlined. All DNA oligonucleotides, along with their sequences as listed in Table S1,† were obtained from Integrated DNA Technologies (Coralville, IA, USA).
-3′. Additionally, two VEGF aptamers were used for the construction of a sandwich-type biosensor:79,80 the thiol-modified VEGF aptamer1 (VEap121),81 with the sequence 5′-/5ThioMC6-D/ATGACTAG-3′, and the VEGF aptamer2 (SL2-B),82,83 with the sequence 5′-AAAAAAAAAAAAAAAAAAAA-3′. Sequences essential for target recognition are underlined. All DNA oligonucleotides, along with their sequences as listed in Table S1,† were obtained from Integrated DNA Technologies (Coralville, IA, USA).
2.2. Synthesis of Prussian blue nanoparticles (PBNPs) and DNA-modified Prussian blue nanoparticles (DNA–PBNPs)
To generate PBNPs, a solution containing 1 mM K4[Fe(CN)6] and 25 mM citric acid was mixed with a solution of 1 mM FeCl3 and 25 mM citric acid dropwise while stirring at 60 °C for 5 minutes.84 The solution's color transformed from pale yellow to royal blue during the mixing and was then cooled to room temperature. Then, an equal volume of acetone was added to the solution and centrifuged at 20![[thin space (1/6-em)]](https://www.rsc.org/images/entities/char_2009.gif) 000 rcf for 10 minutes. The resulting pellets were washed once with ethanol and three more times with ultrapure water. The obtained pellets were freeze-dried overnight to produce PBNPs.
000 rcf for 10 minutes. The resulting pellets were washed once with ethanol and three more times with ultrapure water. The obtained pellets were freeze-dried overnight to produce PBNPs.
For the synthesis of DNA–PBNPs, a PBNP solution was combined with polyT DNA, and then vortexed at 1500 rpm for 3 hours at room temperature. After centrifugation at 15000 rcf for 10 minutes, the mixture was washed three times with ultrapure water. The concentration of the DNA–PBNPs solution was then adjusted using a UV-visible spectrophotometer. The prepared DNA–PBNPs were stored at 4 °C until needed for use.
2.3. Characterization of PBNPs and DNA–PBNPs
Various methods are employed to assess the properties of the nanoparticles. Transmission electron microscopy (TEM) images were captured using a JEM-1400 PLUS microscope (JEOL USA, Inc.) with an accelerating voltage of 100 kV, while scanning electron microscopy (SEM) images were obtained using a JSM-7600F microscope (JEOL USA, Inc.) with an accelerating voltage of 5 kV. The absorption characteristic peaks of both PBNPs and DNA–PBNPs were analyzed through a UV-1800 UV-visible spectrophotometer (Shimadzu, Kyoto, Japan), covering a wavelength range of 200 to 1000 nm. Furthermore, the zeta potential of PBNPs was determined utilizing a Zetasizer Nano ZS90 instrument (Malvern, Worcestershire, UK).2.4. The peroxidase-like activity of PBNPs and DNA–PBNPs
The peroxidase-like capabilities of both PBNPs and DNA–PBNPs were evaluated. The activity assay involved using TMB as the substrate along with H2O2 in a 0.2 M HAc–NaAc buffer (pH 5.0). The absorbance of the color reaction, observed at 652 nm for TMBox, was measured using a microplate multi-mode reader (Synergy™ H1, BioTek, USA) at a fixed reaction time.2.5. Preparation of DNA-modified electrodes
The DNA immobilization solution consisted of 1 μM thiolated ssDNA (Cu2+–DNAzyme or VEGF aptamer1), 10 μM TCEP, 10 mM Tris (pH 8.0), and 0.3 M NaCl. This solution was allowed to react at room temperature for one hour. Subsequently, 10 μL of this solution was applied to the working electrode of a screen-printed gold electrode (AuSPE). This assembly was then left at room temperature for another hour. The assembly was subsequently stored overnight at 4 °C. It was then washed with a 5 mM Tris-HCl buffer (pH 7.4, containing 10 mM NaCl). To block unspecific sites, 1 mM 6-mercaptohexanol (dissolved in 50 mM Tris-HCl buffer, pH 7.0, with 0.3 M NaCl) was introduced and allowed to interact for 15 minutes at room temperature. The final procedure was to rinse the DNA-modified AuSPE with a 5 mM Tris-HCl buffer (pH 7.4, with 10 mM NaCl).2.6. Detection of Cu2+ using a DNA–PBNP-based biosensor
The reaction mixture, consisting of appropriate concentrations of Cu2+ ions, 10 μM GSH, 0.3 M NaCl, and 50 mM Tris-HCl (pH 7.0), was applied to the DNAzyme-modified AuSPE working electrode and incubated at room temperature for 40 minutes. The AuSPE was then rinsed using 50 mM Tris-HCl buffer (pH 7.0) with 0.3 M NaCl and dried with nitrogen gas. Then, a solution containing 1 μM capture DNA was applied to the AuSPE working electrode and incubated for 1 hour at room temperature. Following this incubation, the AuSPE was rinsed and dried once more using nitrogen gas. Subsequently, a solution containing DNA–PBNPs (0.1 mg mL−1) was applied to the AuSPE working electrode and incubated for 40 minutes at room temperature. After re-rinsing and nitrogen drying, K-Blue TMB substrate solution (Neogen) was introduced to cover the three electrodes of AuSPE and incubated for 2 minutes. The resulting current was measured using an electrochemical analyzer (CH Instruments, CHI 6211E) as the output signal in response to a −0.1 V potential.2.7. Detection of VEGF using a DNA–PBNP-based biosensor
The reaction solution, containing an appropriate concentration of VEGF, along with 0.3 M NaCl, and 50 mM Tris-HCl (pH 7.4), was applied to the AuSPE working electrode previously modified with aptamer1, and incubated at room temperature for 40 minutes. The AuSPE was washed with 50 mM Tris-HCl buffer at pH 7.0, containing 0.3 M NaCl, and dried using nitrogen gas. Following this, a solution containing 1 μM aptamer2 was introduced to the AuSPE working electrode and allowed to incubate for 1 hour at room temperature. After rinsing and drying, a DNA–PBNP solution (0.2 mg mL−1) was deposited onto the AuSPE working electrode followed by a 40-minute incubation at room temperature. Subsequently, the solution was removed from the AuSPE. Finally, the K-Blue TMB substrate solution (Neogen) was applied to cover the three electrodes of the AuSPE and incubated for 2 minutes. The resulting current, representing the output signal in response to a potential of −0.1 V, was measured using an electrochemical analyzer.2.8. Gel electrophoresis for the self-cleavage reaction of Cu2+–DNAzyme
The catalytic assay of Cu2+–DNAzyme was conducted using a 20 μL reaction mixture containing 0.5 μM Cu2+–DNAzyme, 50 μM various metal ions (Mg2+, K+, Ca2+, Fe3+, Ni2+, Zn2+, and Cu2+), along with 50 μM GSH, 0.3 M NaCl, and 50 mM Tris-HCl (pH 7.0). This mixture was incubated at room temperature for 1 hour. Subsequently, the reaction sample was mixed with DNA loading dye in a 6:1 volume ratio and loaded onto a denaturing 12% acrylamide gel. Electrophoresis was carried out at 120 V for 50 minutes. Following electrophoresis, the gel was stained with SYBR™ gold dye for 20 minutes and visualized using blue-light trans-illumination.
3. Results and discussion
3.1. Preparation and characterization of the DNA–PBNPs
The preparation of DNA-modified Prussian blue nanoparticles (DNA–PBNPs) involved a one-step synthesis of PBNPs through the combination of FeCl3 and K4[Fe(CN)6] solutions. DNA–PBNPs were generated by adsorbing DNA onto the porous surface of PBNPs (Fig. S1A†). The synthesis of DNA–PBNPs encompassed different concentration ratios of PBNPs and polyT DNA, as shown in Fig. S1B.† Morphological analysis using scanning electron microscopy (SEM) revealed notable aggregation under synthesis conditions I and II (Fig. S1C†). In contrast, synthesis condition III demonstrated clear dispersion of DNA–PBNPs. Consequently, condition III was selected for the subsequent DNA–PBNP synthesis. Transmission electron microscopy (TEM) images indicated cubic shapes for both PBNPs and DNA–PBNPs, with the latter displaying a softer edge, indicating the influence of DNA wrapping (Fig. 1A and B). The average diameters, determined from the statistical analysis of 470 PBNPs and 400 DNA–PBNPs, were 42.3 ± 7.5 nm and 48.7 ± 7.9 nm, respectively (Fig. 1C). UV-visible absorption spectra showed that the absorption peak shifted from 706 to 714 nm after DNA modification of PBNPs, demonstrating the interaction between DNA and PBNPs85,86 (Fig. 1D). Zeta potential analysis disclosed values of −29.2 ± 0.34 mV for PBNPs and −32.6 ± 0.61 mV for DNA–PBNPs (Fig. 1E). This change was attributed to the negatively charged phosphate groups in DNA, indicating successful DNA modification on the surfaces of DNA–PBNPs. Additionally, we utilized Cy5-labeled DNA to fabricate DNA–PBNPs. The supernatant, containing Cy5–DNA not bound to PBNPs, was collected post-centrifugation. By referencing the fluorescence signal of Cy5, we deduced that approximately 39.22 ± 1.50 μM Cy5–DNA was adsorbed by 1 mg mL−1 of PBNPs. Following the removal of unattached DNA, a fluorescence emission signal peaking at 667 nm was directly detected from the Cy5–DNA–PBNPs (Fig. 1F). Despite the fluorescence quenching properties of PBNPs,72 the observation of the Cy5–DNA signal, especially after PBNPs were saturated with Cy5–DNA, further confirms that DNA was adsorbed onto PBNPs.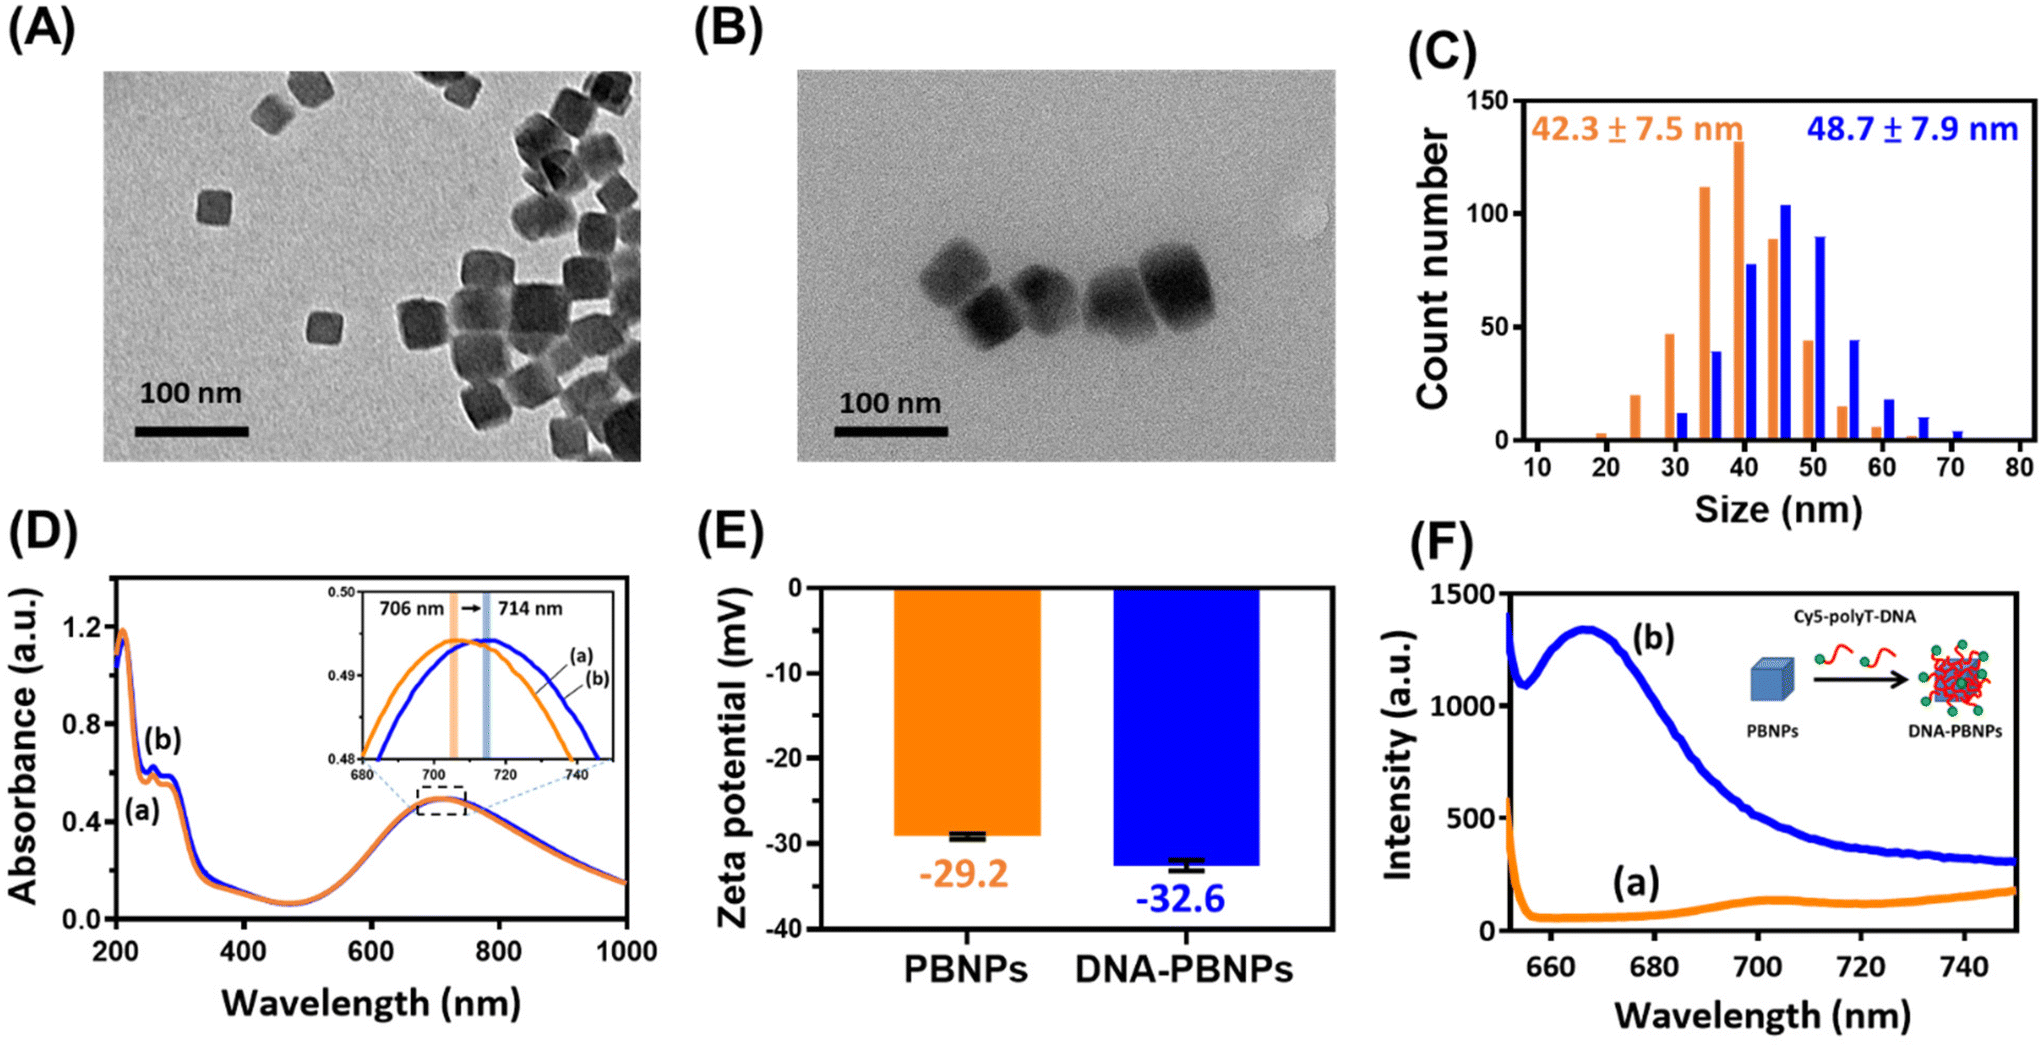 | ||
| Fig. 1 Characterization of the PBNPs and DNA–PBNPs. TEM images of (A) PBNPs and (B) DNA–PBNPs. Scale bar: 100 nm. (C) Size distribution analysis of the PBNPs (orange) and DNA–PBNPs (blue) using TEM images: 42.3 ± 7.5 nm (N = 470) and 48.7 ± 7.9 nm (N = 400). (D) Absorption spectra of PBNPs (a) and DNA–PBNPs (b). DNA modification shifts the absorption peak from 706 to 714 nm (inset). (E) The zeta potentials of (a) PBNPs: −29.2 ± 0.34 mV and (b) DNA–PBNPs: −32.6 ± 0.61 mV. (F) Fluorescence spectra of PBNPs before (a) and after (b) Cy5–DNA modification. | ||
Prussian blue nanoparticles (PBNPs) have extensive potential for biomedical applications due to their various advantages including good biocompatibility and nanozyme properties, which include peroxidase-like catalytic activity. After successfully modifying DNA on PBNPs, the peroxidase-like activity of the DNA–PBNPs was investigated by observing the oxidation of TMBred to TMBox in the presence of H2O2. The results showed that the oxidation rate of TMB catalyzed by DNA–PBNPs was comparable to that catalyzed by bare PBNPs (Fig. 2 and Table 1). Additionally, the stability of DNA–PBNPs was assessed by measuring the catalytic activity of different synthesized batches, which showed consistent and steady results (Fig. S2†). These findings demonstrate that even with DNA modification, PBNPs retain an excellent and stable peroxidase-like ability. When comparing the catalytic activities of Prussian blue nanoparticles (PBNPs) and the peroxidase-active horseradish peroxidase (HRP) across different environmental temperatures (Fig. S3†), it was noted that the activity of HRP starts to decline when the temperature exceeds 50 °C. In contrast, PBNPs maintain a good level of activity under these conditions. Therefore, using PBNPs to signal catalysis is likely to lead to them having a wider range of applications, demonstrating their robustness and effectiveness, particularly in environments where traditional enzymes like HRP may be less effective.
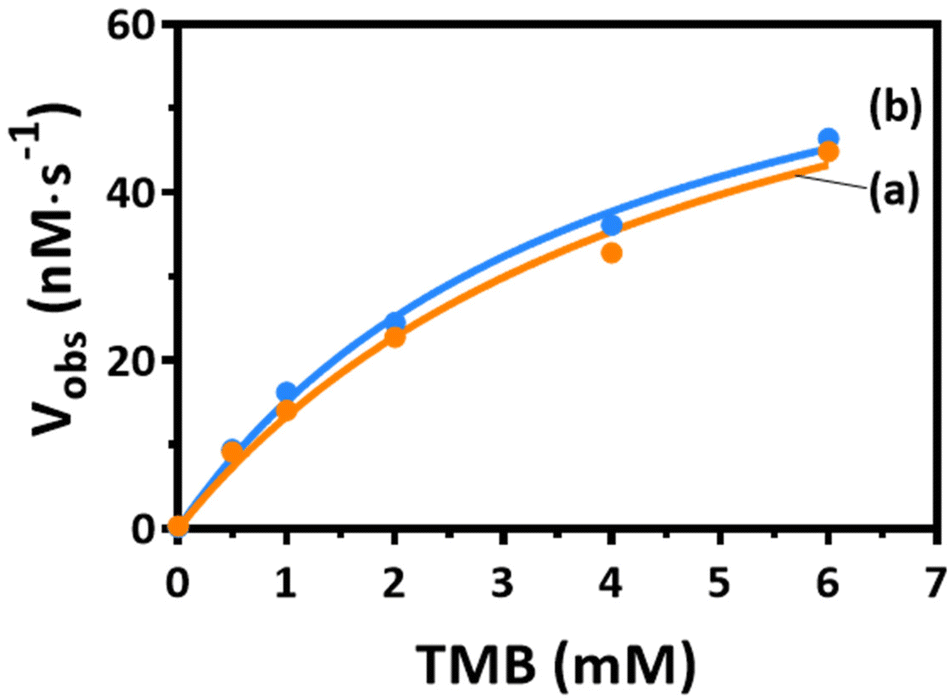 | ||
| Fig. 2 The catalytic activity of the PBNPs and DNA–PBNPs revealed by the rates of oxidation of TMBred to TMBox by PBNPs (a) and DNA–PBNPs (b) in the presence of H2O2. [H2O2] = 2 mM, [PBNP] or [DNA–PBNPs] = 10 μg mL−1. | ||
| Enzyme [E] (10 μg mL−1) | PBNPs | DNA–PBNPs |
|---|---|---|
| K m (mM) | 4.86 | 3.96 |
| V max (nM s−1) | 78.36 | 75.04 |
| k cat (nM mL s−1 μg−1) | 7.836 | 7.504 |
| k cat/Km (mL s−1 μg−1) | 1.61 × 10⁻⁶ | 1.89 × 10⁻⁶ |
3.2. Principle of the DNA–PBNP-based electrochemical biosensor for Cu2+ detection
Copper ions play a vital role in physiological processes87,88 and serve as essential catalytic cofactors for various metalloenzymes.89 An imbalance of copper ions in the body can result in serious illnesses such as neurodegenerative conditions like Alzheimer's,90 Parkinson's,91 and Huntington's disease.92 Consequently, the strict regulation of copper ions in the dietary environment becomes necessary. According to the World Health Organization's (WHO) guidelines for drinking water, the safety limit for copper ions is 2 ppm (ca. 32 μM).93 Therefore, our objective is to develop an electrochemical biosensor capable of detecting copper ions. This will be achieved by applying the distinct properties of functional DNA for target recognition, coupled with the catalytic capabilities of PBNPs to amplify the signal. Fig. 3 shows the biosensor designed for Cu2+ detection. The Cu2+-dependent DNAzyme is capable of initiating a self-cleavage reaction in the presence of Cu2+ ions. This DNAzyme, which adopts a pistol-like conformation,78 is anchored to the working electrode of the screen-printed gold electrode (AuSPE) through an Au–S bond, functioning as the sensor's recognition element. According to Wang et al., the presence of glutathione (GSH) markedly boosts the self-cleavage activity of the DNAzyme in the presence of Cu2+.77 This particular DNAzyme is characterized by its strong specificity for Cu2+, showing no similar behavior with other divalent metal ions. Consequently, to enhance the effectiveness of copper ion detection, a predetermined amount of GSH is incorporated into the solution. When Cu2+ ions are present, they trigger the self-cleavage reaction of the Cu2+-dependent DNAzyme, leading to the hybridization of capture-DNA with the remaining sequence on the electrode. Subsequently, the polyT of DNA–PBNPs hybridize with the polyA of the capture DNA, resulting in the formation of a DNA–PBNP-covered working electrode. Finally, 3,3′,5,5′-tetramethylbenzidine (TMB) and H2O2 are introduced to react with the PBNPs. After incubation for 120 s, the current response generated at a potential of −0.1 V is measured using an electrochemical analyzer.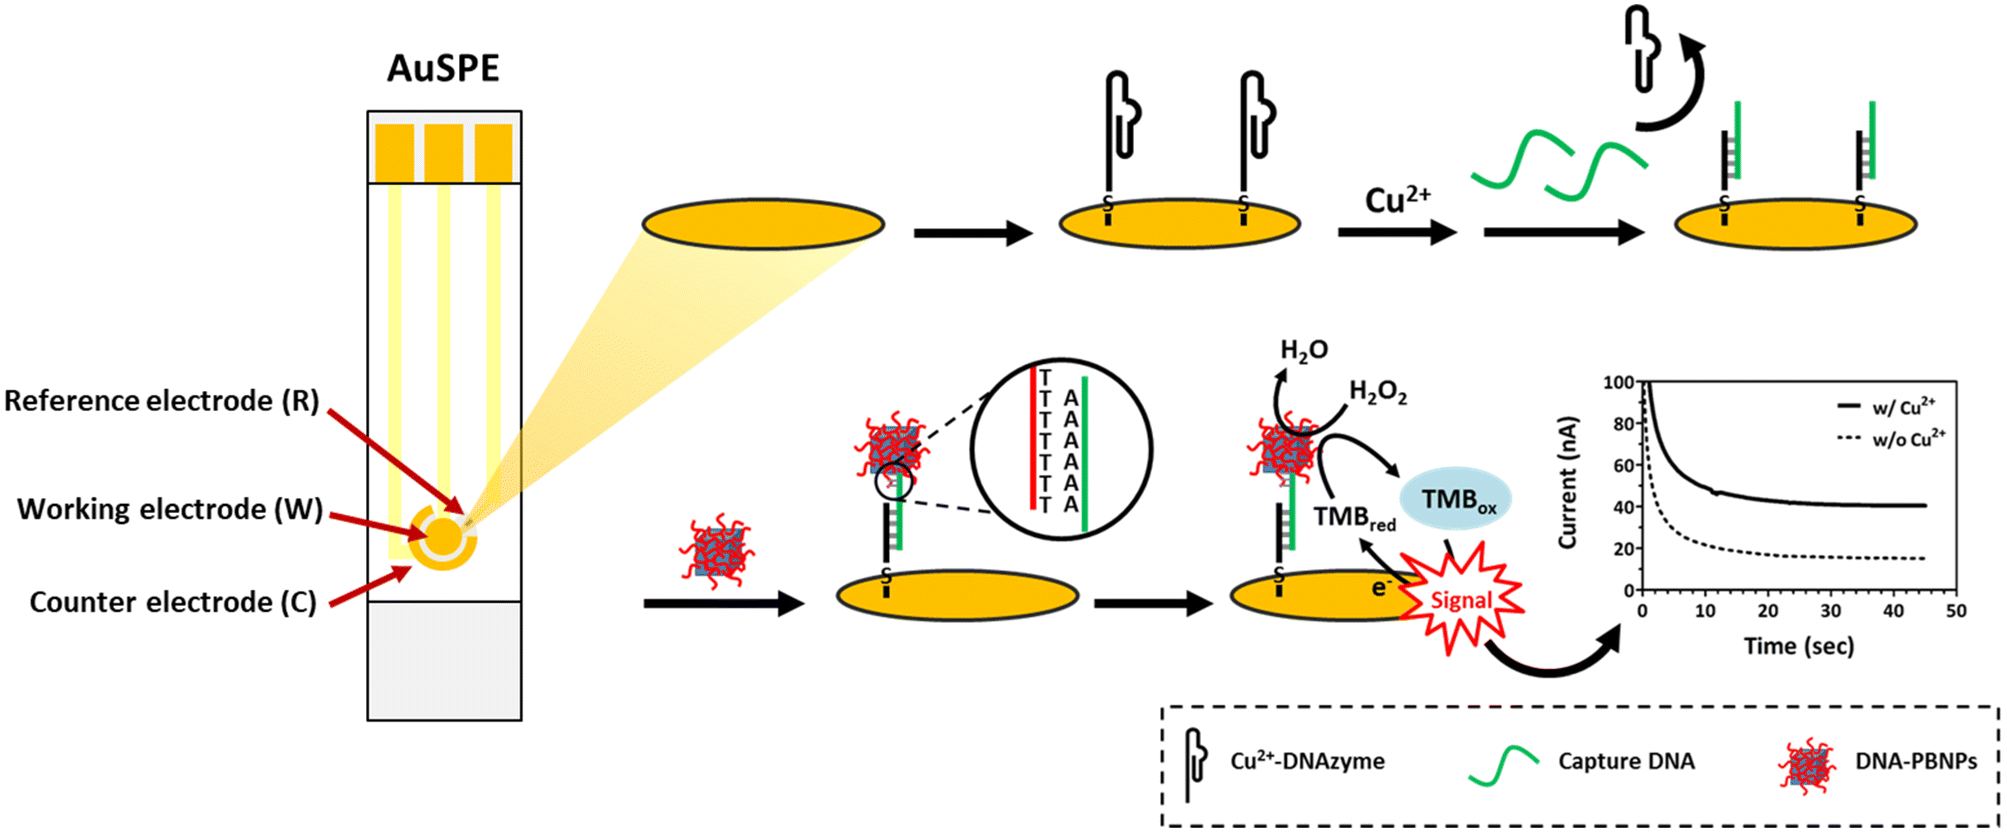 | ||
| Fig. 3 Schematic illustration of the principle of the DNA–PBNP-based electrochemical biosensor for Cu2+ detection. Screen-printed gold electrodes (AuSPEs) were modified with Cu2+–DNAzyme via the Au–S bond. Cu2+ in the sample solution initiated the self-cleavage reaction of Cu2+–DNAzyme, followed by the hybridization of capture DNA with the residual sequence on the electrode. PolyT of DNA–PBNPs further hybridized with polyA of capture DNA, forming a DNA–PBNP-covered working electrode. Finally, substrate (TMB) and H2O2 were introduced to initiate a reaction with the PBNPs, and the resulting current signals were measured. | ||
3.3. Feasibility and optimization of utilizing Cu2+–DNAzyme within the DNA–PBNP-based electrochemical biosensor for Cu2+ detection
Previous studies have shown that Cu2+–DNAzyme undergoes a self-cleavage reaction triggered by glutathione (GSH) and Cu2+ ions.77 Before evaluating the feasibility of using DNAzyme within the DNA–PBNP-based biosensor, we initially validated the function of DNAzyme. Through DNA electrophoresis, we observed the effect of glutathione (GSH) on the self-cleavage reaction of Cu2+–DNAzyme (Fig. S4†). The results confirmed that both copper ions and glutathione (GSH) are essential for activating the catalytic ability of DNAzymes. We further confirmed the ion specificity of Cu2+–DNAzyme, where only Cu2+ was able to induce a self-cleavage reaction of Cu2+–DNAzyme in the presence of GSH to yield two cleavage products, while other metal ions (Mg2+, K+, Ca2+, Fe3+, Ni2+, and Zn2+) had no effect (Fig. S5†). Additionally, we investigated the effect of varying reaction times on the self-cleavage reaction of Cu2+–DNAzyme. The result showed that the combination of Cu2+ and GSH promptly initiates the self-cleavage reaction, becoming evident within the first minute. Furthermore, prolonging the reaction time intensifies the production of cleavage products (Fig. S6†).In order to achieve the best biosensor performance, a series of optimization experiments was carried out on the AuSPE. The optimization of the self-cleavage reaction time of Cu2+–DNAzyme (Fig. 4A) revealed a prolonged reaction duration compared to that of homogeneous systems, which may be due to the immobilization of DNAzyme on introducing the electrode into a heterogeneous environment. This could influence reaction rates by affecting molecular collision frequencies. The 40-minute condition displayed a higher signal-to-background ratio and was therefore selected as the designated reaction time for self-cleavage. Fig. 4B shows the effect of reporter DNA concentration, where the current values gradually increase as the reporter DNA concentration increases. Background signals across different concentration groups displayed similarities. The optimal signal-to-background ratio was observed at a reporter DNA concentration of 1 μM. Additionally, it was important to optimize the concentration of DNA–PBNPs, as PBNPs in the biosensor serve as the output source. As shown in Fig. 4C, the 0.1 mg mL−1 DNA–PBNP condition produced the highest signal and signal-to-background ratio. Taking into account the outcomes of these optimization experiments, the optimal self-cleavage reaction time for Cu2+–DNAzyme was determined to be 40 minutes, the optimal reporter DNA concentration was 1 μM, and the optimal DNA–PBNP concentration was 0.1 mg mL−1.
 | ||
| Fig. 4 Optimization of the DNA–PBNP-based biosensor for Cu2+ detection. The effect on output signal of the reaction time of Cu2+–DNAzyme self-cleavage (A), the concentration of reporter DNA (B) and the concentration of DNA–PBNPs (C). N = 3, mean ± SD. | ||
3.4. The performance of the DNA–PBNP-based electrochemical biosensor for Cu2+ detection
Under the optimal conditions, the performance of the DNA–PBNP-based electrochemical biosensor was evaluated. The current generated by TMB at variable concentrations of Cu2+ was measured by an electrochemical analyzer (Fig. 5A). The current exhibited an increase corresponding to increasing concentrations of copper ions from 0 to 200 nM. A linear relationship was observed between the current and Cu2+ concentration within the range of 30 to 100 nM, as illustrated by the regression equation y = 0.3748x + 1.611 and a high correlation coefficient (R2) of 0.9894 (Fig. 5A inset). The limit of detection (LOD) of this assay was calculated as 57.65 nM Cu2+, significantly below the WHO-regulated safety limit for drinking water (ca. 32 μM), highlighting the exceptional sensitivity of the DNA–PBNP-based electrochemical biosensor. Moreover, to examine the selectivity of the DNA–PBNP-based biosensor for detecting Cu2+, various common metal ions (such as Ca2+, Mg2+, and K+) were introduced into the assay. As shown in Fig. 5B, samples containing Cu2+ exhibited a notably distinctive output signal through the DNA–PBNP biosensor. In contrast, the current response resembled the background signal when the sample contained alternative ions excluding Cu2+. This result strongly suggests that the DNA–PBNP biosensor demonstrates excellent selectivity specifically for detecting Cu2+. Subsequently, we evaluated the sensor's applicability to real samples through recovery analyses involving ultrapure water, tap water, and spring water. Table 2 presents a comparison between samples lacking spiked Cu2+ and those containing a 0.1 μM Cu2+ spike, resulting in recoveries of 98.05%, 96.02%, and 92.62% for ultrapure water, tap water, and spring water, respectively. Slight discrepancies in recovery rates may be attributed to minor substrate interferences present in the samples. These findings emphasize the reliable accuracy of the DNA–PBNP-based biosensor for Cu2+ detection.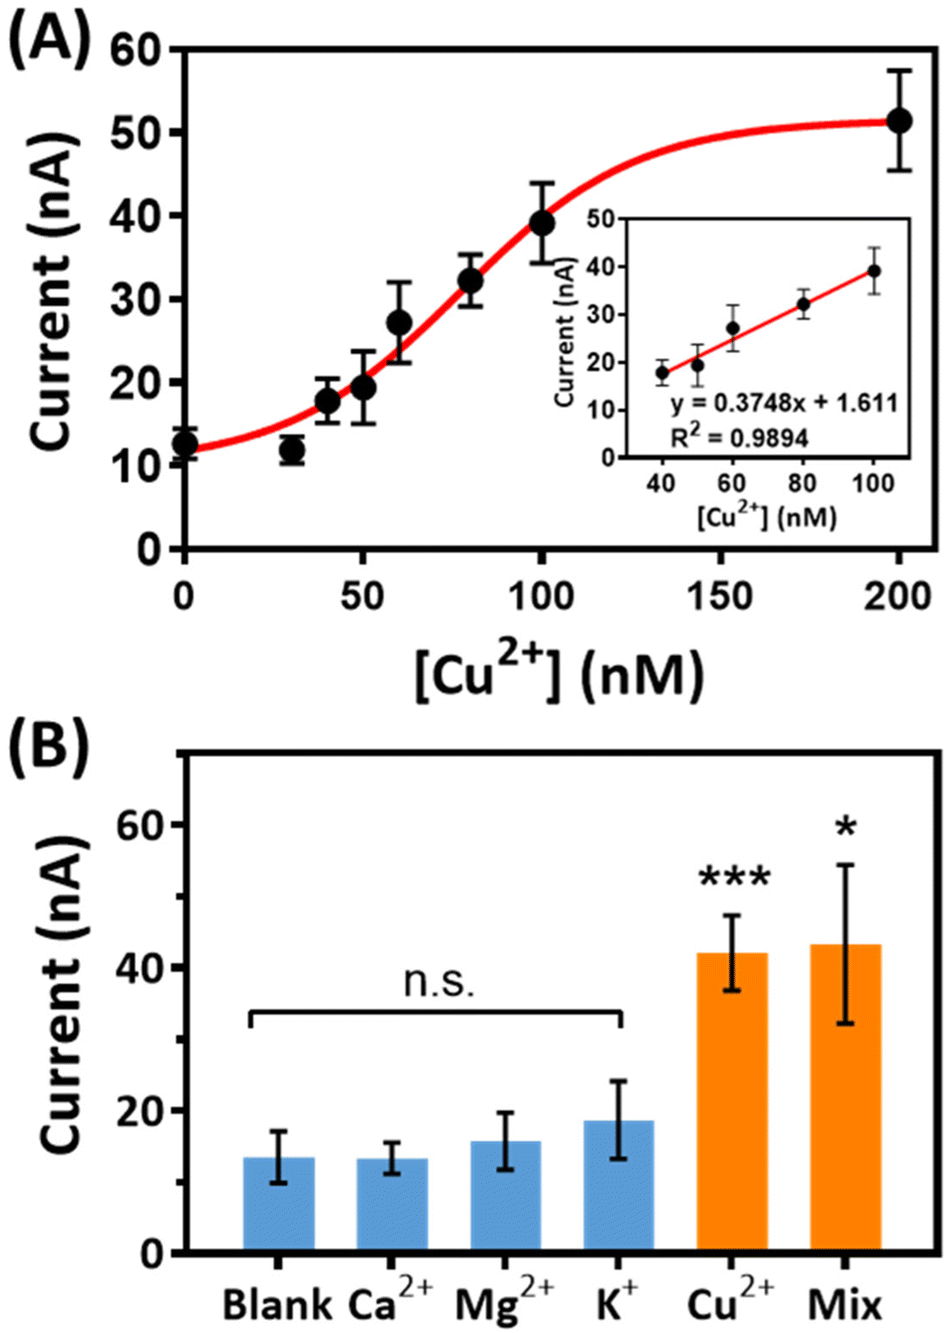 | ||
| Fig. 5 Dose–response curve for copper ions and specificity assessment of the DNA–PBNP biosensor. (A) The relationship between current and Cu2+ concentration using the DNA–PBNP-based biosensor. Cu2+ concentrations range from 0 to 200 nM. Inset: Linear calibration curve for [Cu2+] in the range from 40 to 100 nM. (B) Specificity of the DNA–PBNP-based biosensor. All ion concentrations are 100 nM, [mix]: mixture of Cu2+, Ca2+, Mg2+, and K+. (n.s.: not significant, *: p < 0.05, **: p < 0.01, and ***: p < 0.001). | ||
| Matrix | Current (nA) | Δ Current (nA) | Measured concentration (μM) | Recovery | |
|---|---|---|---|---|---|
| Not spiked | 0.1 μM Cu2+ spiked | ||||
| Ultrapure water | 12.91 | 38.21 | 25.30 | 0.09805 | 98.05% |
| Tap water | 50.88 | 75.44 | 24.56 | 0.09602 | 96.02% |
| Spring water | 17.23 | 40.55 | 23.32 | 0.09262 | 92.62% |
3.5. The working principle and performance of the DNA–PBNP-based electrochemical biosensor for VEGF detection
The adaptability of the biosensor was further established by adapting it for the detection of vascular endothelial growth factor (VEGF), an essential protein in tumor microenvironments. VEGF is crucial for promoting blood vessel growth, which leads to angiogenesis, counteracts tumor hypoxia, and aids in tumor spread. Using a setup similar to the Cu2+ sensor, DNA–PBNP-based biosensors can be modified for VEGF detection by simply changing the nucleic acid sequence. To enhance the specificity in VEGF detection, a dual-aptamer sandwich-type biosensor was utilized. VEGF165 consists of a heparin-binding structural domain (HBD) and a receptor-binding structural domain (RBD). Prior studies have shown that the aptamer VEap121 has significant affinity for the RBD,81 and the core sequence SL2-B in the VEa5 aptamer binds well with the HBD of VEGF165.82 These aptamers are specifically designed to target VEGF's RBD and HBD, respectively. The concurrent binding of these two unique aptamers to VEGF has been confirmed through biolayer interferometry, as reported by Shan et al.79 In the initial step, the VEGF aptamer (aptamer1), which binds effectively to VEGF's RBD, was attached to the working electrode of the AuSPE via an Au–S bond. If VEGF is present in the sample, it becomes captured by aptamer1 and anchored to the electrode. Then, another aptamer (aptamer2), specific for the heparin-binding structural domain (HBD) of VEGF, is introduced, creating a sandwiched hybrid complex. This structure allows the polyT of the DNA–PBNP to hybridize with the polyA at the 5′ end of aptamer2, leading to a DNA–PBNP-coated working electrode. This configuration facilitates the detection of VEGF by forming a complex that effectively binds the target molecule between the two aptamers. The introduction of TMB and H2O2 as substrates initiated a reaction with the PBNPs, generating a current response measured at a potential of −0.1 V using an electrochemical analyzer (Fig. 6A). | ||
| Fig. 6 The DNA–PBNP-based biosensor for VEGF detection. (A) Schematic illustration of the principle of the DNA–PBNP-based electrochemical biosensor for VEGF detection. (B) The relationship between the current and VEGF concentration under the DNA–PBNP-based biosensor. The ranges of VEGF concentration are from 0 to 10 ng mL−1. Inset: The linear calibration curve for VEGF in the range from 1 to 5 ng mL−1. (C) The specificity results of the DNA–PBNP-based biosensor. Concentrations of all proteins are 10 ng mL−1. (n.s.: not significant, ****: P < 0.0001). | ||
To ensure the optimal performance of the biosensor, a series of optimization experiments was conducted. The initial study focused on the incubation time of the assay for VEGF. Fig. S7A† shows that the output current tends to increase with increasing incubation time of VEGF and aptamer1 and stabilizes at 40 minutes. Thus, 40 minutes was considered as an ideal duration to facilitate the formation of the analyte–receptor complex. Subsequently, the response to TMB in relation to aptamer2 concentration was observed to stabilize at 1 μM. Balancing the robust recognition of vascular endothelial growth factor with cost-effectiveness, subsequent experiments used 1 μM aptamer2 as the optimal concentration (Fig. S7B†). The concentration of DNA–PBNPs, a crucial factor influencing the final output signal, was then optimized. Fig. S7C† shows the variation in TMB response with different DNA–PBNP concentrations, stabilizing above 0.2 mg mL−1. Thus, 0.2 mg mL−1 of DNA–PBNPs was selected for subsequent experiments.
Following these optimization steps, the biosensor's performance for detecting VEGF was analyzed. Various concentrations of VEGF, ranging from 0 to 10 ng mL−1, were tested. The results shown in Fig. 6B demonstrate a gradual initial increase in the current value, followed by a rapid rise in mid-range concentrations, ultimately plateauing at 5 ng mL−1 of VEGF. A linear relationship was observed between the current and VEGF concentration within the range of 1 to 5 ng mL−1 (Fig. 6B inset). The linear calibration equation for VEGF concentration was y = 1.882x − 1.510 with a correlation coefficient (R2) of 0.9464. The limit of detection (LOD) of this assay was calculated as 1.49 ng mL−1 of VEGF. To assess the specificity of the DNA–PBNP-based biosensor for VEGF detection, various proteins were tested under optimized conditions. The signals generated by these proteins were nearly indistinguishable from the background signal, affirming the remarkable specificity of the DNA–PBNP-based platform designed for VEGF assays. Further investigation was carried out to assess the biosensor's performance in detecting vascular endothelial growth factor in serum samples, and the results demonstrated the biosensor's capability to successfully conduct the assay (Fig. S8†).
4. Conclusions
This study developed a universal approach for creating DNA-modified Prussian blue nanozymes (DNA–PBNPs) by leveraging the adsorption capabilities of Prussian blue nanoparticles to anchor DNA sequences. These nanostructures, endowed with nucleic acid sequences, can engage in base pairing for external hybridization connections while also possessing enzymatic activity for catalytic signal amplification with substrates. The DNA–PBNPs were efficiently synthesized, demonstrating remarkable stability. Importantly, the modification with nucleic acids did not impair the catalytic abilities of the nanozymes. Traditionally, bioanalytical sensing has heavily relied on protein enzymes, which often struggle with stability and batch-to-batch consistency. Our DNA–PBNPs outshine in these critical aspects, offering a potent alternative. These findings establish DNA–PBNPs as promising substitutes for protein enzymes in various biomedical sensing applications.Furthermore, this research extended the application of DNA–PBNPs to electrochemical biosensing platforms, a relatively unexplored domain in the existing literature. By anchoring functional nucleic acids on electrodes and employing DNA–PBNPs as signal amplifiers, we successfully detected copper ions and VEGF, showing the adaptability and potential of this method for various molecular targets. The proposed strategy not only broadens the toolkit for sensitive detection but also lays a solid foundation for the future development of biosensing technologies.
Author contributions
Lin-Hui Huang: investigation, methodology, validation, and writing – original draft. Yu-Yu Hsieh: investigation and validation. Fu-An Yang: writing – original draft. Wei-Ching Liao: conceptualization, project administration, funding acquisition, supervision, and writing – review & editing.Conflicts of interest
There are no conflicts to declare.Acknowledgements
The authors thank Dr Ting-Yang Kuo for fruitful discussion. The authors are grateful to the staff of the Electron Microscopy Facility, National Yang Ming Chiao Tung University for the assistance in SEM and TEM measurements. This work was supported by the National Science and Technology Council, Taiwan [NSTC 109-2113-M-010-006-MY3 and 112-2113-M-A49-027].References
- R. Ragg, M. N. Tahir and W. Tremel, Eur. J. Inorg. Chem., 2016, 2016, 1906–1915 CrossRef CAS.
- Y. Lin, J. Ren and X. Qu, Acc. Chem. Res., 2014, 47, 1097–1105 CrossRef CAS PubMed.
- S. Lv, H. Wang, Y. Zhou, D. Tang and S. Bi, Coord. Chem. Rev., 2023, 478, 214976 CrossRef CAS.
- Y. Sun, B. Xu, X. Pan, H. Wang, Q. Wu, S. Li, B. Jiang and H. Liu, Coord. Chem. Rev., 2023, 475, 214896 CrossRef CAS.
- W. Zhu, Z. Chen, Y. Pan, R. Dai, Y. Wu, Z. Zhuang, D. Wang, Q. Peng, C. Chen and Y. Li, Adv. Mater., 2019, 31, 1800426 CrossRef PubMed.
- L. Tian, Z. Huang, W. Na, Y. Liu, S. Wang, Y. He, W. Cheng, T. Huang, Z. Li and T. Li, Nanoscale, 2022, 14, 15340–15347 RSC.
- J. Wu, X. Wang, Q. Wang, Z. Lou, S. Li, Y. Zhu, L. Qin and H. Wei, Chem. Soc. Rev., 2019, 48, 1004–1076 RSC.
- H. Wang, K. Wan and X. Shi, Adv. Mater., 2019, 31, 1805368 CrossRef CAS PubMed.
- M. Liang and X. Yan, Acc. Chem. Res., 2019, 52, 2190–2200 CrossRef CAS PubMed.
- H. Wei, L. Gao, K. Fan, J. Liu, J. He, X. Qu, S. Dong, E. Wang and X. Yan, Nano Today, 2021, 40, 101269 CrossRef CAS.
- R. Zhang, X. Yan and K. Fan, Acc. Mater. Res., 2021, 2, 534–547 CrossRef CAS.
- C. Xie, Z. Niu, D. Kim, M. Li and P. Yang, Chem. Rev., 2020, 120, 1184–1249 CrossRef CAS PubMed.
- F. Fiévet, S. Ammar-Merah, R. Brayner, F. Chau, M. Giraud, F. Mammeri, J. Peron, J. Y. Piquemal, L. Sicard and G. Viau, Chem. Soc. Rev., 2018, 47, 5187–5233 RSC.
- Y. Zhang, F. Wang, C. Liu, Z. Wang, L. Kang, Y. Huang, K. Dong, J. Ren and X. Qu, ACS Nano, 2018, 12, 651–661 CrossRef CAS PubMed.
- C. Ge, G. Fang, X. Shen, Y. Chong, W. G. Wamer, X. Gao, Z. Chai, C. Chen and J.-J. Yin, ACS Nano, 2016, 10, 10436–10445 CrossRef CAS PubMed.
- T. Kang, Y. G. Kim, D. Kim and T. Hyeon, Coord. Chem. Rev., 2020, 403, 213092 CrossRef CAS.
- X. Hu, Y. Lu, X. Shi, T. Yao, C. Dong and S. Shi, Chem. Commun., 2019, 55, 14785–14788 RSC.
- D. Wang, D. Jana and Y. Zhao, Acc. Chem. Res., 2020, 53, 1389–1400 CrossRef CAS PubMed.
- F. Meng, P. Zhu, L. Yang, L. Xia and H. Liu, Chem. Eng. J., 2023, 452, 139411 CrossRef CAS.
- C. Cao, N. Yang, X. Wang, J. Shao, X. Song, C. Liang, W. Wang and X. Dong, Coord. Chem. Rev., 2023, 491, 215245 CrossRef CAS.
- Y. Zhang, W. Yu, M. Chen, B. Zhang, L. Zhang and P. Li, Nanoscale, 2023, 15, 12137–12156 RSC.
- M. B. Zakaria and T. Chikyow, Coord. Chem. Rev., 2017, 352, 328–345 CrossRef CAS.
- Y. Zhao, W. Zhang and M. Hu, ChemNanoMat, 2017, 3, 780–789 CrossRef CAS.
- J. F. Keggin and F. D. Miles, Nature, 1936, 137, 577–578 CrossRef CAS.
- F. Herren, P. Fischer, A. Ludi and W. Haelg, Inorg. Chem., 1980, 19, 956–959 CrossRef CAS.
- S. S. Kaye and J. R. Long, J. Am. Chem. Soc., 2005, 127, 6506–6507 CrossRef CAS PubMed.
- S. S. Kaye and J. R. Long, Catal. Today, 2007, 120, 311–316 CrossRef CAS.
- H. Ming, N. L. K. Torad, Y.-D. Chiang, K. C. W. Wu and Y. Yamauchi, CrystEngComm, 2012, 14, 3387–3396 RSC.
- K. Itaya, I. Uchida and V. D. Neff, Acc. Chem. Res., 1986, 19, 162–168 CrossRef CAS.
- F. Ricci, A. Amine, G. Palleschi and D. Moscone, Biosens. Bioelectron., 2003, 18, 165–174 CrossRef CAS PubMed.
- Z. Qin, Y. Li and N. Gu, Adv. Healthcare Mater., 2018, 7, 1800347 CrossRef PubMed.
- Y. Y. Su, Z. Teng, H. Yao, S. J. Wang, Y. Tian, Y. L. Zhang, W. F. Liu, W. Tian, L. J. Zheng, N. Lu, Q. Q. Ni, X. D. Su, Y. X. Tang, J. Sun, Y. Liu, J. Wu, G. F. Yang, G. M. Lu and L. J. Zhang, ACS Appl. Mater. Interfaces, 2016, 8, 17038–17046 CrossRef CAS PubMed.
- J. Wang, Q. Ma, Y. Wang, Z. Li, Z. Li and Q. Yuan, Chem. Soc. Rev., 2018, 47, 8766–8803 RSC.
- X.-D. Li, X.-L. Liang, F. Ma, L.-J. Jing, L. Lin, Y.-B. Yang, S.-S. Feng, G.-L. Fu, X.-L. Yue and Z.-F. Dai, Colloids Surf., B, 2014, 123, 629–638 CrossRef CAS PubMed.
- D. Wang, J. Zhou, R. Chen, R. Shi, G. Zhao, G. Xia, R. Li, Z. Liu, J. Tian, H. Wang, Z. Guo, H. Wang and Q. Chen, Biomaterials, 2016, 100, 27–40 CrossRef CAS PubMed.
- J. Qian, J. Xu, L. Kuang and D. Hua, ChemPlusChem, 2017, 82, 888–895 CrossRef CAS PubMed.
- B. Dresow, P. Nielsen, R. Fischer, A. A. Pfau and H. H. Heinrich, J. Toxicol., Clin. Toxicol., 1993, 31, 563–569 CrossRef CAS PubMed.
- W. Zhang, S. Hu, J.-J. Yin, W. He, W. Lu, M. Ma, N. Gu and Y. Zhang, J. Am. Chem. Soc., 2016, 138, 5860–5865 CrossRef CAS PubMed.
- M. Vázquez-González, R. M. Torrente-Rodríguez, A. Kozell, W.-C. Liao, A. Cecconello, S. Campuzano, J. M. Pingarrón and I. Willner, Nano Lett., 2017, 17, 4958–4963 CrossRef PubMed.
- J. Zhao, X. Cai, W. Gao, L. Zhang, D. Zou, Y. Zheng, Z. Li and H. Chen, ACS Appl. Mater. Interfaces, 2018, 10, 26108–26117 CrossRef CAS PubMed.
- R. Zhou, P. Wang, Y. Guo, X. Dai, S. Xiao, Z. Fang, R. Speight, E. W. Thompson, P. J. Cullen and K. Ostrikov, Nanoscale, 2019, 11, 19497–19505 RSC.
- Z. Farka, V. Čunderlová, V. Horáčková, M. Pastucha, Z. Mikušová, A. Hlaváček and P. Skládal, Anal. Chem., 2018, 90, 2348–2354 CrossRef CAS PubMed.
- T. Wang, Y. Fu, L. Chai, L. Chao, L. Bu, Y. Meng, C. Chen, M. Ma, Q. Xie and S. Yao, Chem. – Eur. J., 2014, 20, 2623–2630 CrossRef CAS PubMed.
- F. Cui, Q. Deng and L. Sun, RSC Adv., 2015, 5, 98215–98221 RSC.
- C. Teller and I. Willner, Curr. Opin. Biotechnol., 2010, 21, 376–391 CrossRef CAS PubMed.
- J. Liu, Z. Cao and Y. Lu, Chem. Rev., 2009, 109, 1948–1998 CrossRef CAS PubMed.
- S. Tombelli, M. Minunni and M. Mascini, Biosens. Bioelectron., 2005, 20, 2424–2434 CrossRef CAS PubMed.
- I. Willner and M. Zayats, Angew. Chem., Int. Ed., 2007, 46, 6408–6418 CrossRef CAS PubMed.
- T. Mairal, V. C. Özalp, P. L. Sánchez, M. Mir, I. Katakis and C. K. O'Sullivan, Anal. Bioanal. Chem., 2008, 390, 989–1007 CrossRef CAS PubMed.
- S. Qi, N. Duan, I. M. Khan, X. Dong, Y. Zhang, S. Wu and Z. Wang, Biotechnol. Adv., 2022, 55, 107902 CrossRef CAS PubMed.
- A. D. Ellington and J. W. Szostak, Nature, 1990, 346, 818–822 CrossRef CAS PubMed.
- C. Tuerk and L. Gold, Science, 1990, 249, 505–510 CrossRef CAS PubMed.
- M. N. Stojanovic, P. de Prada and D. W. Landry, J. Am. Chem. Soc., 2001, 123, 4928–4931 CrossRef CAS PubMed.
- Z. Huang, W. Wang, Y. Wang, H. Wang, Y. Pang, Q. Yuan, J. Tan and W. Tan, Anal. Chem., 2023, 95, 16668–16676 CrossRef CAS PubMed.
- R. F. Macaya, P. Schultze, F. W. Smith, J. A. Roe and J. Feigon, Proc. Natl. Acad. Sci. U. S. A., 1993, 90, 3745–3749 CrossRef CAS PubMed.
- A. S. R. Potty, K. Kourentzi, H. Fang, G. W. Jackson, X. Zhang, G. B. Legge and R. C. Willson, Biopolymers, 2009, 91, 145–156 CrossRef CAS PubMed.
- Y. Yang, X. Yang, Y. Yang and Q. Yuan, Carbon, 2018, 129, 380–395 CrossRef CAS.
- Y. Song, J. Song, X. Wei, M. Huang, M. Sun, L. Zhu, B. Lin, H. Shen, Z. Zhu and C. Yang, Anal. Chem., 2020, 92, 9895–9900 CrossRef CAS PubMed.
- H.-C. Lai, C.-H. Wang, T.-M. Liou and G.-B. Lee, Lab Chip, 2014, 14, 2002–2013 RSC.
- M. Amraee, M. Oloomi, A. Yavari and S. Bouzari, Anal. Biochem., 2017, 536, 36–44 CrossRef CAS PubMed.
- W. G. Purschke, F. Radtke, F. Kleinjung and S. Klussmann, Nucleic Acids Res., 2003, 31, 3027–3032 CrossRef CAS PubMed.
- D. Shangguan, L. Meng, Z. C. Cao, Z. Xiao, X. Fang, Y. Li, D. Cardona, R. P. Witek, C. Liu and W. Tan, Anal. Chem., 2008, 80, 721–728 CrossRef CAS PubMed.
- W.-M. Li, T. Bing, J.-Y. Wei, Z.-Z. Chen, D.-H. Shangguan and J. Fang, Biomaterials, 2014, 35, 6998–7007 CrossRef CAS PubMed.
- N. Carmi, S. R. Balkhi and R. R. Breaker, Proc. Natl. Acad. Sci. U. S. A., 1998, 95, 2233–2237 CrossRef CAS PubMed.
- N. Carmi, L. A. Shultz and R. R. Breaker, Chem. Biol., 1996, 3, 1039–1046 CrossRef CAS PubMed.
- T. Pan and O. C. Uhlenbeck, Nature, 1992, 358, 560–563 CrossRef CAS PubMed.
- R. R. Breaker and G. F. Joyce, Chem. Biol., 1994, 1, 223–229 CrossRef CAS PubMed.
- A. Roth and R. R. Breaker, Proc. Natl. Acad. Sci. U. S. A., 1998, 95, 6027–6031 CrossRef CAS PubMed.
- M. Famulok, J. S. Hartig and G. Mayer, Chem. Rev., 2007, 107, 3715–3743 CrossRef CAS PubMed.
- I. Willner, B. Shlyahovsky, M. Zayats and B. Willner, Chem. Soc. Rev., 2008, 37, 1153–1165 RSC.
- G. F. Joyce, Annu. Rev. Biochem., 2004, 73, 791–836 CrossRef CAS PubMed.
- D. Lu, H. Jiang, W. Gao, S. G. Liu, Q. Zhao and X. Shi, Adv. Funct. Mater., 2023, 33, 2208897 CrossRef CAS.
- B. Zhang, H. Ding, Q. Chen, T. Wang and K. Zhang, Analyst, 2019, 144, 4858–4864 RSC.
- M. A. Komkova, V. A. Shavokshina, A. A. Zarochintsev, D. M. Melnik, I. O. Aparin, T. S. Zatsepin and A. A. Karyakin, Talanta, 2023, 257, 124337 CrossRef CAS PubMed.
- Q. Zeng, X. Jiang, M. Chen, C. Deng, D. Li and H. Wu, Bioorg. Chem., 2024, 143, 106981 CrossRef CAS PubMed.
- D. Lu, H. Jiang, G. Zhang, Q. Luo, Q. Zhao and X. Shi, ACS Appl. Mater. Interfaces, 2021, 13, 25738–25747 CrossRef CAS PubMed.
- S. Wang, C. Liu, G. Li, Y. Sheng, Y. Sun, H. Rui, J. Zhang, J. Xu and D. Jiang, ACS Sens., 2017, 2, 364–370 CrossRef CAS PubMed.
- N. Carmi and R. R. Breaker, Bioorg. Med. Chem., 2001, 9, 2589–2600 CrossRef CAS PubMed.
- S. Shan, Z. He, S. Mao, M. Jie, L. Yi and J.-M. Lin, Talanta, 2017, 171, 197–203 CrossRef CAS PubMed.
- H. Chen, Y. Hou, F. Qi, J. Zhang, K. Koh, Z. Shen and G. Li, Biosens. Bioelectron., 2014, 61, 83–87 CrossRef CAS PubMed.
- Y. Nonaka, W. Yoshida, K. Abe, S. Ferri, H. Schulze, T. T. Bachmann and K. Ikebukuro, Anal. Chem., 2013, 85, 1132–1137 CrossRef CAS PubMed.
- H. Kaur and L.-Y. L. Yung, PLoS One, 2012, 7, e31196 CrossRef CAS PubMed.
- H. Hasegawa, K. Sode and K. Ikebukuro, Biotechnol. Lett., 2008, 30, 829–834 CrossRef CAS PubMed.
- M. Shokouhimehr, E. S. Soehnlen, J. Hao, M. Griswold, C. Flask, X. Fan, J. P. Basilion, S. Basu and S. D. Huang, J. Mater. Chem., 2010, 20, 5251–5259 RSC.
- Y. Wang, X. Pang, J. Wang, Y. Cheng, Y. Song, Q. Sun, Q. You, F. Tan, J. Li and N. Li, J. Mater. Chem. B, 2018, 6, 2460–2473 RSC.
- Z. Li, Y. Zeng, D. Zhang, M. Wu, L. Wu, A. Huang, H. Yang, X. Liu and J. Liu, J. Mater. Chem. B, 2014, 2, 3686–3696 RSC.
- M. M. O. Peña, J. Lee and D. J. Thiele, J. Nutr., 1999, 129, 1251–1260 CrossRef PubMed.
- E. Madsen and J. D. Gitlin, Annu. Rev. Neurosci., 2007, 30, 317–337 CrossRef CAS PubMed.
- L. R. McDowell, Minerals in Animal and Human Nutrition, Academic Press Inc., 1992 Search PubMed.
- S. Ayton, P. Lei and A. I. Bush, Free Radical Biol. Med., 2013, 62, 76–89 CrossRef CAS PubMed.
- E. Gaggelli, H. Kozlowski, D. Valensin and G. Valensin, Chem. Rev., 2006, 106, 1995–2044 CrossRef CAS PubMed.
- G. Xiao, Q. Fan, X. Wang and B. Zhou, Proc. Natl. Acad. Sci. U. S. A., 2013, 110, 14995–15000 CrossRef CAS PubMed.
- World Health Organization, Guidelines for Drinking-Water Quality: Fourth edition incorporating the first and second addenda, World Health Organization, Geneva, 2022 Search PubMed.
Footnote |
| † Electronic supplementary information (ESI) available: List of DNA sequences used in the study; SEM images of DNA-PBNPs synthesized by the different ratios of PBNPs and polyT DNA; catalytic activity of DNA-PBNPs with different synthesized batches; comparative analysis of catalytic activity between PBNPs and horseradish peroxidase (HRP) at various temperatures; the influence of glutathione on the self-cleavage reaction of Cu2+-DNAzyme; the influence of metal ions on the self-cleavage reaction of Cu2+-DNAzyme; the influence of reaction time on the self-cleavage of the reaction of Cu2+-DNAzyme; optimization of the DNA-PBNP-based biosensor for VEGF detection; and matrix effect of the DNA-PBNP-based biosensor for VEGF detection. See DOI: https://doi.org/10.1039/d4nr00387j |
| This journal is © The Royal Society of Chemistry 2024 |