
Atomically thin iridium nanosheets for oxygen evolution electrocatalysis†
Hyeongbin
Jo‡
 a,
Younghyun
Wy‡
a,
Hojin
Ahn
a,
Yonghyeon
Kim
a,
Bon Seung
Goo
a,
Yongmin
Kwon
a,
Jin Hong
Kim
b,
Jin Sik
Choi
b and
Sang Woo
Han
*a
a,
Younghyun
Wy‡
a,
Hojin
Ahn
a,
Yonghyeon
Kim
a,
Bon Seung
Goo
a,
Yongmin
Kwon
a,
Jin Hong
Kim
b,
Jin Sik
Choi
b and
Sang Woo
Han
*a
aCenter for Nanotectonics, Department of Chemistry and KI for the NanoCentury, KAIST, Daejeon 34141, Korea. E-mail: sangwoohan@kaist.ac.kr
bDepartment of Physics, Konkuk University, Seoul 05029, Korea
First published on 27th May 2024
Abstract
2D nanostructures of noble metals hold great potential for developing efficient electrocatalysts due to their high atom efficiency associated with their large specific surface area and abundant active sites. Here, we introduce a one-pot solvothermal synthesis method that can enable the fabrication of freestanding atomically thin Ir nanosheets. The thermal decomposition of a complex of Ir and a long-chain amine, which could readily be formed with the assistance of a strong base, under CO flow conditions successfully yielded Ir nanosheets consisting of 2–4 atomic layers. The prepared Ir nanosheets showed prominent activity and stability toward oxygen evolution electrocatalysis in acidic conditions, which can be attributed to their ultrathin 2D structure.
Noble metal nanomaterials with 2D structures, such as ultrathin nanosheets, have shown great potential in the field of catalysis due to their large specific surface area, rich active sites, and fast electron transport.1–4 In addition, the formation of 2D nanostructures of noble metals holds great promise for maximizing the utilization of precious metals in catalysis.1,5 However, the production of freestanding 2D nanostructures of nonlayer-structured materials, like noble metals, is a formidable task as their anisotropic growth to form 2D structures with high surface energy rather than 3D close-packed structures is a thermodynamically unfavorable process.6,7 Accordingly, an anisotropy should be introduced to the growth of noble metal nanostructures to generate 2D structures.3 To this end, CO that has facet-selective strong binding affinity toward metal surfaces has been widely employed to induce the 2D anisotropic growth of noble metal materials.7–11
For sustainable electrochemical water splitting to produce hydrogen, the development of efficient electrocatalysts for the oxygen evolution reaction (OER) in acidic media is quite demanding. In this context, Ir-based nanomaterials have been explored to find high-performance OER catalysts because Ir metal has proved to have high activity and stability under acidic OER conditions.12 The high OER activity of Ir-based materials has also been supported by numerous theoretical studies on the OER mechanism of Ir-based materials.13–15 Constructing a 2D nanostructure of Ir can be a promising strategy to attain an effective OER electrocatalyst with enhanced mass activity and cost efficiency. However, given the difficulty in the reduction of Ir precursors to metallic Ir, controlling the structure of Ir-based nanomaterials is challenging compared to those of other noble metal elements.16,17 Furthermore, reduced Ir metal tends to nucleate homogeneously rather than attach to growing nuclei, making it difficult to obtain 2D structures.18 As such, only a few successes in the formation of Ir nanomaterials with 2D nanosheet structures have been reported.2,19–24 Nevertheless, the reported Ir nanosheets are thicker than 5 nm (ref. 19–21) or in the form of large superstructures.22–24 The fabrication of freestanding ultrathin Ir 2D structures with atomic thickness has rarely been achieved.
Herein, we report a one-pot solvothermal synthesis route to prepare ultrathin Ir nanosheets with atomic thickness and their electrocatalytic performance toward the OER in acidic conditions. To realize the 2D Ir nanostructure, CO-mediated structure control was combined with metal–amine complex formation using a long-chain amine solvent, di-n-octylamine. This CO + amine combination has been used to form nanostructures with well-controlled surfaces.25 A strong base, i.e., n-butyllithium, was also employed to facilitate the formation of the Ir–amine complex.26 Indeed, heating the Ir–amine complex under a CO environment successfully yielded freestanding ultrathin Ir nanosheets. Notably, the formed Ir nanosheets consist only of 2–4 atomic layers. Due to this structural advantage, the prepared Ir nanosheets showed efficient electrocatalytic performance toward the OER in acidic media.
The ultrathin Ir nanosheets with atomic thickness were synthesized using a simple solvothermal approach (see the Experimental details†). In a typical preparation of Ir nanosheets, a mixture of IrCl4, n-butyllithium, and di-n-octylamine was heated to 290 °C and kept at that temperature for 4 h under CO flow conditions. The transmission electron microscopy (TEM) image of the product demonstrates the successful formation of Ir nanosheets (Fig. 1a). Indeed, most of the produced nanostructures had 2D nanosheet structures. The average lateral size of the prepared Ir nanosheets was 11.5 ± 1.3 nm (Fig. S1†). X-ray photoelectron spectroscopy (XPS) measurements on the Ir 4f core level of the Ir nanosheets indicated that the synthesized Ir nanosheets are primarily composed of metallic Ir (Fig. 1b). Notably, the relative intensities of the XPS peaks associated with the metallic Ir of the Ir nanosheets were much higher than those of a commercial Ir black (Fig. S2†), implying the more metallic surface of the prepared Ir nanosheets compared to that of the Ir black. The X-ray diffraction (XRD) pattern of the Ir nanosheets also confirms their face-centered cubic (fcc) metallic structure (Fig. S3†).
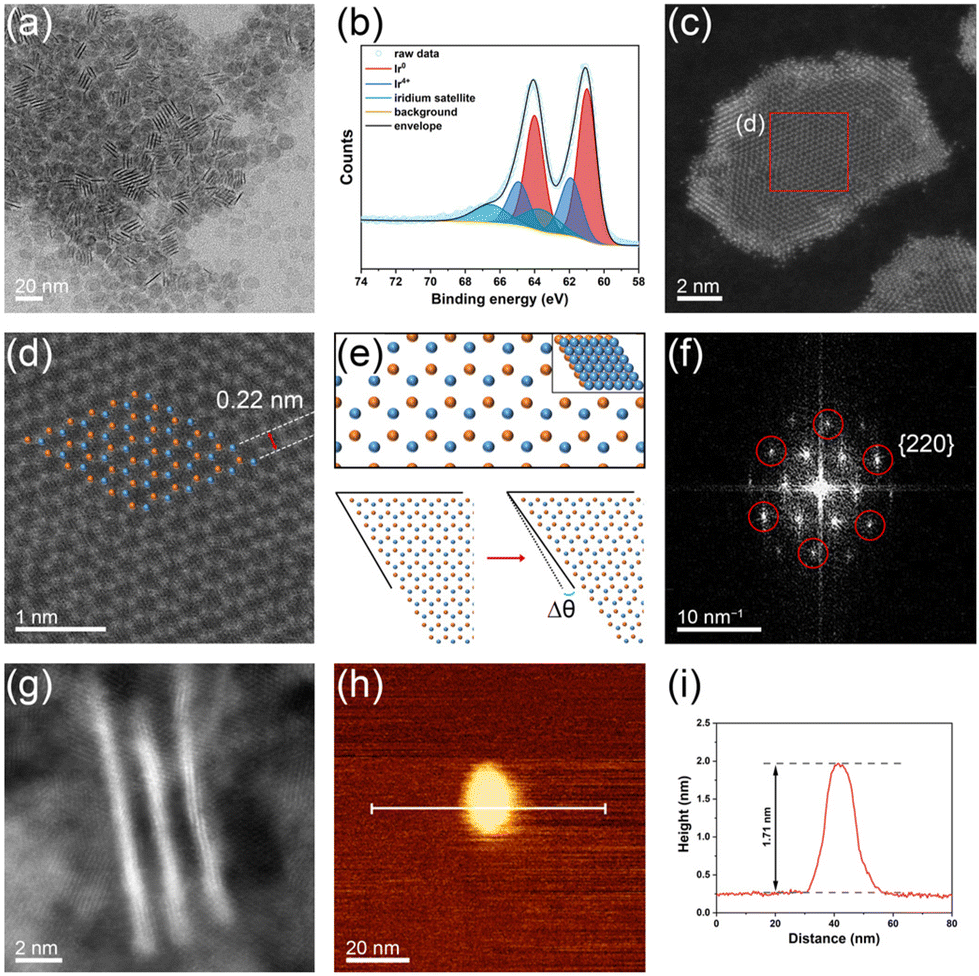 | ||
| Fig. 1 (a) TEM image of Ir nanosheets. (b) Ir 4f core-level XPS spectrum of Ir nanosheets. The main peaks appearing at binding energies of 64.0 and 60.9 eV correspond to metallic Ir 4f5/2 and Ir 4f7/2, respectively. The appearance of minor peaks associated with the Ir(IV) state at 61.9 and 64.9 eV implies the presence of some oxidized Ir on the sample surface. (c) HAADF–STEM image of an Ir nanosheet. (d) Magnified HAADF–STEM image of the red square region in part (c). (e) Atomic arrangement of an fcc structure with two slabs (top) and distortion of the two-layered fcc structure with a distortion angle of Δθ (bottom). Atoms in each layer are denoted with different colors. (f) FFT pattern obtained from the HAADF–STEM image shown in part (d) (zone axis: [111]). (g) HAADF–STEM image of vertically aligned Ir nanosheets. (h) AFM image and (i) corresponding height profile of an Ir nanosheet. | ||
To examine the fine structural characteristics of the Ir nanosheets, high-angle annular dark-field–scanning TEM (HAADF–STEM) analyses were conducted. The HAADF–STEM image of an Ir nanosheet is shown in Fig. 1c (see also the HAADF–STEM images of other Ir nanosheets shown in Fig. S4b–f†). The low contrast of the HAADF–STEM image of the nanosheet indeed reveals the ultrathin nature of the prepared nanosheets. Notably, the inner region of the nanosheet is darker than the edge region, indicating that the inner region of the nanosheet is thinner than the edge region. Interestingly, the magnified HAADF–STEM image of the inner region shows a hexagonal atomic arrangement (Fig. 1d), which is different from what is commonly observed in HAADF–STEM images of the (111) surface of fcc crystal structures. Such an atomic arrangement can typically be found in the HAADF–STEM images of hexagonal close-packed (hcp) structures viewed along the [0001] direction.27,28 In contrast, the HAADF–STEM image of the edge region of the nanosheet demonstrates an atomic arrangement typical of that of the fcc (111) surface (Fig. S5†). Given the 4 atomic layer thickness of the edge region of the Ir nanosheets (vide infra), the hcp-like atomic arrangement discerned in the inner region of the nanosheet could be the result of the two atomic layer structure of the inner region, as simulated in Fig. 1e (top). As there is no C layer of the ABC-layered structure of the fcc crystal in the two atomic layer structure, its atomic arrangement is not different from that of the hcp crystal structure. As shown in Fig. 1e (bottom), a simulated atomic arrangement that exactly matches that observed in the HAADF–STEM image could readily be obtained by slightly distorting the ideal close-packed two atomic layers with a distortion angle of Δθ. Based on the HAADF–STEM images of various Ir nanosheets, the average distortion angle (|Δθ|) was determined to be 1.65 ± 1.24° (Fig. S4†). Such a distortion from the ideal lattice can be found in ultrathin 2D nanostructures due to in-plane strain imposed by surface defects.29 From Fig. 1d, the interatomic distance and lattice spacing values were measured to be 0.27 and 0.22 nm, respectively, which are in good accordance with those estimated from the reported lattice parameter of the Ir fcc crystal structure, 0.38 nm.30Fig. 1f shows the fast Fourier transform (FFT) pattern obtained from the HAADF–STEM image shown in Fig. 1d. The points marked with red circles in Fig. 1f are at a distance of 7.49 nm−1 from the center, which corresponds to 0.134 nm (half of the interatomic distance). Accordingly, these points can be indexed to the {220} planes. This pattern of {220} planes can be found in the diffraction pattern of the fcc crystal structure viewed along the [111] direction. Inside the {220} pattern, there are more points associated with {112} planes containing the (11![[2 with combining macron]](https://www.rsc.org/images/entities/char_0032_0304.gif) ) plane, which typically cannot be found in the fcc crystal structure due to the systematic absence. This abnormal FFT pattern is consistent with the simulated diffraction pattern of an ultrathin fcc structure with two atomic layers.31
) plane, which typically cannot be found in the fcc crystal structure due to the systematic absence. This abnormal FFT pattern is consistent with the simulated diffraction pattern of an ultrathin fcc structure with two atomic layers.31
To further confirm the ultrathin structure of the prepared Ir nanosheets, the HAADF–STEM image of vertically aligned Ir nanosheets was also obtained (Fig. 1g). The average thickness of the nanosheets was measured to be 0.88 nm, which is equivalent to the thickness of 4 atomic layers. Considering the abovementioned structural features of the Ir nanosheets, the measured average thickness corresponds to that of the edge region of the nanosheets. The results of the HAADF–STEM measurements collectively verify that the formed Ir nanosheets consist of 2–4 atomic layers. To further evaluate the structure of the Ir nanosheets, atomic force microscopy (AFM) analysis was performed. Fig. 1h and i show the AFM image and corresponding height profile of an Ir nanosheet deposited on a Si substrate, respectively. Although the resolution of the AFM image is not comparable to those of the TEM images due to the small size of the nanosheets, the AFM results also revealed the ultrathin nature of the prepared Ir nanosheets. The AFM-measured thickness of the Ir nanosheet was 1.71 nm (Fig. 1i). The larger thickness value obtained by the AFM height profile analysis than that obtained with the HAADF–STEM measurement can be attributed to the presence of residual di-n-octylamine adsorbates, of which the octyl chain length is 1.2 nm,32 between the Ir nanosheet and Si substrate.
To investigate the structural evolution of the Ir nanosheets, TEM images of samples collected at different reaction times were obtained (Fig. 2a–i). The TEM-determined lateral sizes of growing nanosheets are summarized in Fig. 2j. As shown in Fig. 2a, small nanostructures were observed until the temperature of the reaction solution reached 290 °C. As the reaction proceeded, intermediate nanostructures exhibited anisotropic features and grew in size to form the 2D nanosheet structure (Fig. 2b–e and j). The growth of nanosheets ceased when the reaction time reached about 4 h, at which point the average size of the nanosheets became about 10 nm. There was no noticeable structural evolution after 4 h (Fig. 2e–i and j).
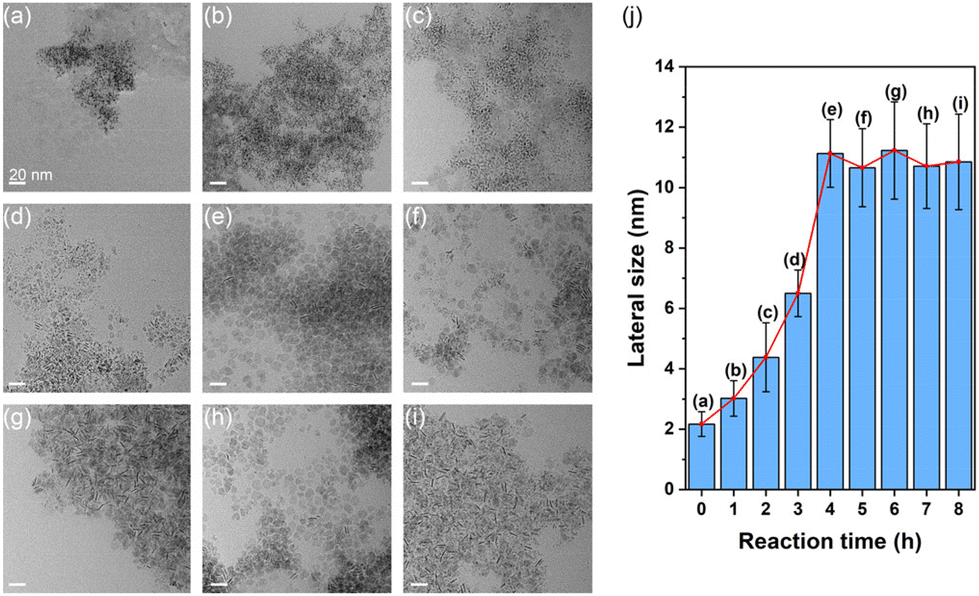 | ||
| Fig. 2 TEM images of samples collected (a) right after the reaction solution reached 290 °C and (b–i) after 1 to 8 h of reaction with 1 h intervals. Scale bars indicate 20 nm. (j) The average lateral sizes of growing nanosheets estimated from the TEM images shown in parts (a–i). | ||
To clarify the role of n-butyllithium and CO in the formation of the Ir nanosheets, a series of control experiments were performed. Since n-butyllithium, a strong base, can readily deprotonate di-n-octylamine and, thus, promote the formation of the Ir–amine complex,26 the Ir–amine complex can be generated right after the injection of n-butyllithium into the reaction solution containing the Ir precursors and di-n-octylamine solvent. This can be evidenced by the distinct color change of the reaction solution immediately after the addition of n-butyllithium (Fig. S6†). The formed complex can then be thermally decomposed during the progress of the reaction under the CO flow conditions, leading to the growth of the nanosheet structure. Indeed, the anisotropic growth of nanostructures did not occur without n-butyllithium or CO in the synthesis (Fig. S7a and S8†). Other control experiments further corroborated that the prompt Ir–amine complex formation enabled by n-butyllithium is critical to nanosheet formation. For instance, the injection of n-butyllithium into the reaction solution right after starting the CO flow still gave nanosheet structures but with a notably decreased yield (Fig. S7b and e†). On the other hand, the lateral size of the formed nanosheets decreased when n-butyllithium was injected into the reaction solution after the reaction temperature reached 160 °C (Fig. S7c and e†). Notably, nanosheet structures were not produced when n-butyllithium was added to the reaction solution after the reaction temperature reached 290 °C (Fig. S7d and e†). The results of control experiments suggest that controlled nucleation/growth of nanostructures through the Ir–amine complex formation is the key to the successful synthesis of the Ir nanosheets. On the other hand, the high reaction temperature, 290 °C, is also critical to the formation of the Ir nanosheets. Small isotropic particles were produced at 210, 230, and 250 °C (Fig. S9a–c†). Nanostructures with 2D structures started to appear at 270 °C but with a significantly decreased yield compared to the standard synthesis (Fig. S9d†). Taken together, the formation mechanism of the Ir nanosheets is schematically shown in Fig. 3.
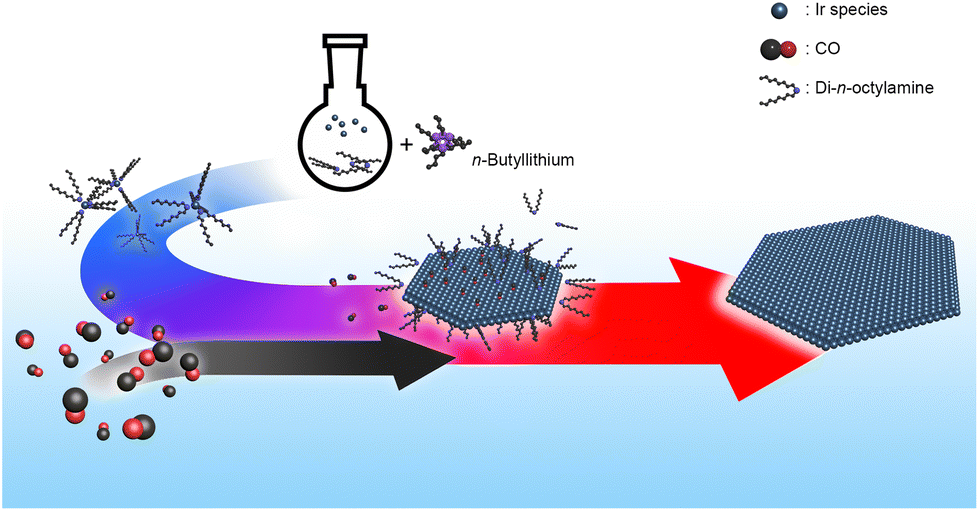 | ||
| Fig. 3 Schematic illustration of the formation mechanism of Ir nanosheets. | ||
Our synthesis approach to fabricate freestanding ultrathin Ir nanosheets is not limited to the Ir precursor and amine solvent used in this synthesis, i.e., IrCl4 and di-n-octylamine, respectively. In fact, other halide-based Ir precursors, like IrBr4 and IrI4, were also capable of yielding nanosheet structures (Fig. S10a and b†). In addition, when oleylamine was used as an amine solvent instead of di-n-octylamine, Ir nanosheets were also produced (Fig. S10c†). However, the homogeneity in the morphology of the Ir nanosheets prepared with the other Ir precursors and amine solvent was inferior to that of the Ir nanosheets synthesized by using IrCl4 and di-n-octylamine, signifying that the IrCl4 + di-n-octylamine combination is optimal for the high-yield production of well-defined Ir nanosheets. Notably, nanosheet structures could not be obtained with trioctylamine solvent (Fig. S10d†). This might be because trioctylamine, a tertiary amine, has no nitrogen-attached hydrogen atom that can be removed by n-butyllithium. As a result, the formation of Ir–amine complexes and subsequent nanosheet growth cannot readily proceed compared to the reaction with the other amine solvents.
To evaluate the OER performance of the prepared Ir nanosheets, they were loaded onto a carbon black support (Vulcan XC-72R). The TEM image of the supported Ir nanosheets reveals that their 2D nanostructure was well preserved (Fig. S11a†). A commercial Ir black catalyst supported on Vulcan XC-72R was also prepared for comparison (Fig. S11b†). The OER polarization curves of the catalysts obtained from linear sweep voltammetry (LSV) measurements in O2-saturated 0.5 M H2SO4 at a scan rate of 5 mV s−1 are shown in Fig. 4a (potentials are reported relative to the reversible hydrogen electrode (RHE)). The corresponding overpotentials to drive a current density of 10 mA cm−2 (η@10 mA cm−2) and mass activities estimated by normalizing current values at 1.53 V vs. RHE to the Ir mass of the catalysts are summarized in Fig. 4b. Indeed, the Ir nanosheets exhibited a higher OER activity compared to the Ir black. The η@10 mA cm−2 was 272.2 mV for the Ir nanosheets, which is lower by more than 30 mV compared to the Ir black with a η@10 mA cm−2 of 305.5 mV. The mass activity of the Ir nanosheets was 476.8 A g−1. This is about three times higher than that of the Ir black, 163.4 A g−1. From the Tafel plots of the catalysts, the Tafel slopes of the Ir nanosheets and Ir black were estimated to be 54.5 and 56.5 mV dec−1, respectively (Fig. 4c). The insignificant difference in the Tafel slopes of the catalysts implies that the catalysts have almost identical OER kinetics. The electrochemically active surface areas (ECSAs) of the Ir nanosheets and Ir black were determined to be 99.6 and 20.0 m2 gIr−1, respectively, based on the results of CO stripping voltammetry measurements (Fig. 4d). The significantly higher ECSA value of the Ir nanosheets than that of the Ir black confirms that the superb OER activity of the Ir nanosheets could be due to their large surface area and resultant abundant active sites for catalysis. In fact, the Ir nanosheets prepared in this work have a lower overpotential and higher mass activity for the OER than reported Ir nanoparticle- and Ir oxide-based catalysts (Table S1†).33–35 Furthermore, our Ir nanosheets showed higher OER mass activity than those of amorphous and partially hydroxylated Ir nanosheets (Table S1†).21,23 However, recently developed Ir-based catalysts with a form of alloy36–38 or heterostructure39,40 with other elements exhibited higher OER activity compared to the present Ir nanosheets (Table S1†), suggesting that further improvement of the OER performance of the Ir nanosheets will be possible by incorporating other elements into the nanosheets with the preservation of their ultrathin 2D structure. We will aim to investigate this topic in our future research.
 | ||
| Fig. 4 (a) OER polarization curves of catalysts obtained by LSV in O2-saturated 0.5 M H2SO4 at a scan rate of 5 mV s−1. (b) Overpotentials to drive a current density of 10 mA cm−2 (η@10 mA cm−2) and Ir mass activities at 1.53 V vs. RHE of the catalysts. (c) Tafel plots of the catalysts obtained from the polarization curves shown in part (a). (d) CO stripping voltammetry curves of the catalysts obtained in 0.5 M H2SO4 at a scan rate of 20 mV s−1. (e) Chronopotentiometry curves of the catalysts in O2-saturated 0.5 M H2SO4 at a constant current density of 10 mA cm−2. (f) OER polarization curves of the catalysts in O2-saturated 0.5 M H2SO4 at a scan rate of 5 mV s−1 before (dotted lines) and after (solid lines) the ADT. The inset shows the increases in the η@10 mA cm−2 of the catalysts after the ADT. | ||
Finally, the long-term durability test of the catalysts via chronopotentiometry at a constant current density of 10 mA cm−2 further revealed that the Ir nanosheets maintained their η@10 mA cm−2 for a longer time compared to the Ir black (Fig. 4e). The same trend was also observed in the accelerated durability test (ADT) of the catalysts performed by repeated potential cycling between 1.2 and 1.6 V vs. RHE in O2-saturated 0.5 M H2SO4 at a scan rate of 100 mV s−1. As shown in Fig. 4f, after 2000 cycles of the ADT, the Ir nanosheets showed a smaller increase in the η@10 mA cm−2 compared to the Ir black. Both tests explicitly demonstrate the better OER stability of the Ir nanosheets compared to the Ir black. Based on inductively coupled plasma–optical emission spectroscopy (ICP–OES) and TEM measurements after the long-term durability test, the major cause of the decrease in the OER activities of the catalysts after the test can be supposed to be the degradation of the catalysts, as reported in previous studies.41–43 The ICP–OES-determined Ir contents in the electrolyte solutions after the long-term durability test for the Ir nanosheet and Ir black catalysts were, respectively, 41.8 and 26.5% of the corresponding original Ir contents, showing that non-negligible amounts of Ir were dissolved out into the electrolyte solution during the test. The TEM images of the Ir nanosheet and Ir black catalysts after the test exhibit the deformation in their structures, which can indeed be attributed to the dissolution of Ir (Fig. S12†). We expect that the electrocatalytic stability of the Ir nanosheets can be improved by enhancing their resistance against the Ir dissolution through the incorporation of other elements into the nanosheets38,39 and the increase in the Ir nanosheet–support interaction.44,45
Conclusions
We have developed a one-pot solvothermal approach to synthesize freestanding ultrathin Ir nanosheets with atomic thickness. Ir nanosheets consisting of 2–4 atomic layers could be prepared by heating a mixture of Ir precursor, n-butyllithium, and di-n-octylamine to 290 °C under CO flow conditions. We found that the synergistic combination of the CO-assisted 2D structure control and control over the nucleation/growth of nanostructures through the Ir–amine complex formation with the assistance of n-butyllithium is the key to the successful fabrication of the Ir nanosheets. The atomically thin 2D structure of the prepared Ir nanosheets led to the highly enhanced OER performance in acidic conditions compared to a commercial Ir black catalyst as well as reported Ir nanoparticle-, Ir oxide-, and Ir nanosheet-based catalysts. We envision that the proposed strategy will contribute to the development of 2D materials with unprecedented morphologies and functions.Conflicts of interest
There are no conflicts to declare.Acknowledgements
This work was supported by the Basic Science Research Program (2015R1A3A2033469 and 2018R1A5A1025208) through the National Research Foundation of Korea (NRF) funded by the Ministry of Science and ICT.References
- B. Jiang, Y. Guo, F. Sun, S. Wang, Y. Kang, X. Xu, J. Zhao, J. You, M. Eguchi, Y. Yamauchi and H. Li, ACS Nano, 2023, 17, 13017–13043 CrossRef CAS PubMed.
- H. Yu, J. Ke and Q. Shao, Small, 2023, 19, e2304307 CrossRef PubMed.
- Y. Chen, Z. Fan, Z. Zhang, W. Niu, C. Li, N. Yang, B. Chen and H. Zhang, Chem. Rev., 2018, 118, 6409–6455 CrossRef CAS PubMed.
- S. Yu, C. Zhang and H. Yang, Chem. Rev., 2023, 123, 3443–3492 CrossRef CAS PubMed.
- P. Vesborg and T. Jaramillo, RSC Adv., 2012, 2, 7933–7947 RSC.
- Y. Shi, Z. Lyu, M. Zhao, R. Chen, Q. Nguyen and Y. Xia, Chem. Rev., 2021, 121, 649–735 CrossRef CAS PubMed.
- L. Zhao, C. Xu, H. Su, J. Liang, S. Lin, L. Gu, X. Wang, M. Chen and N. Zheng, Adv. Sci., 2015, 2, 1500100 CrossRef PubMed.
- C. He, J. Tao and P. Shen, ACS Catal., 2018, 8, 910–919 CrossRef CAS.
- J. Hong, Y. Kim, D. Wi, S. Lee, S. Lee, Y. Lee, S. Choi and S. Han, Angew. Chem., Int. Ed., 2016, 55, 2753–2758 CrossRef CAS PubMed.
- X. Huang, S. Tang, X. Mu, Y. Dai, G. Chen, Z. Zhou, F. Ruan, Z. Yang and N. Zheng, Nat. Nanotechnol., 2011, 6, 28–32 CrossRef CAS PubMed.
- X. Yang, B. Ouyang, L. Zhao, Q. Shen, G. Chen, Y. Sun, C. Li and K. Xu, J. Am. Chem. Soc., 2023, 145, 27010–27021 CrossRef CAS PubMed.
- Z. Lei, T. Wang, B. Zhao, W. Cai, Y. Liu, S. Jiao, Q. Li, R. Cao and M. Liu, Adv. Energy Mater., 2020, 10, 2000478 CrossRef CAS.
- Q. Dang, H. Lin, Z. Fan, L. Ma, Q. Shao, Y. Ji, F. Zheng, S. Geng, S. Yang, N. Kong, W. Zhu, Y. Li, F. Liao, X. Huang and M. Shao, Nat. Commun., 2021, 12, 6007 CrossRef CAS PubMed.
- F. Luo, L. Guo, Y. Xie, J. Xu, K. Qu and Z. Yang, Appl. Catal., B, 2020, 279, 119394 CrossRef CAS.
- V. Pfeifer, T. Jones, J. Vélez, C. Massué, R. Arrigo, D. Teschner, F. Girgsdies, M. Scherzer, M. Greiner, J. Allan, M. Hashagen, G. Weinberg, S. Piccinin, M. Hävecker, A. Knop-Gericke and R. Schlögl, Surf. Interface. Anal., 2016, 48, 261–273 CrossRef CAS.
- S. Kundu and H. Liang, J. Colloid Interface Sci., 2011, 354, 597–606 CrossRef CAS PubMed.
- P. Mayne, Polyhedron, 1984, 3, 1013–1015 CrossRef CAS.
- X. Xia, L. Figueroa-Cosme, J. Tao, H. Peng, G. Niu, Y. Zhu and Y. Xia, J. Am. Chem. Soc., 2014, 136, 10878–10881 CrossRef CAS PubMed.
- B. Jiang, Y. Guo, J. Kim, A. Whitten, K. Wood, K. Kani, A. Rowan, J. Henzie and Y. Yamauchi, J. Am. Chem. Soc., 2018, 140, 12434–12441 CrossRef CAS PubMed.
- S. Chatterjee, X. Peng, S. Intikhab, G. Zeng, N. Kariuki, D. Myers, N. Danilovic and J. Snyder, Adv. Energy Mater., 2021, 11, 2101438 CrossRef CAS.
- G. Wu, X. Zheng, P. Cui, H. Jiang, X. Wang, Y. Qu, W. Chen, Y. Lin, H. Li, X. Han, Y. Hu, P. Liu, Q. Zhang, J. Ge, Y. Yao, R. Sun, Y. Wu, L. Gu, X. Hong and Y. Li, Nat. Commun., 2019, 10, 4855 CrossRef PubMed.
- Y. Xie, X. Long, X. Li, C. Chang, K. Qu and Z. Yang, Chem. Commun., 2021, 57, 8620–8623 RSC.
- Z. Cheng, B. Huang, Y. Pi, L. Li, Q. Shao and X. Huang, Natl. Sci. Rev., 2020, 7, 1340–1348 CrossRef CAS PubMed.
- Y. Pi, N. Zhang, S. Guo, J. Guo and X. Huang, Nano Lett., 2016, 16, 4424–4430 CrossRef CAS PubMed.
- B. Wu, N. Zheng and G. Fu, Chem. Commun., 2011, 47, 1039–1041 RSC.
- M. He, L. Protesescu, R. Caputo, F. Krumeich and M. Kovalenko, Chem. Mater., 2015, 27, 635–647 CrossRef CAS.
- A. Leitherer, B. Yeo, C. Liebscher and L. Ghiringhelli, npj Comput. Mater., 2023, 9, 179 CrossRef CAS.
- Q. Zhang, K. Kusada, D. Wu, T. Yamamoto, T. Toriyama, S. Matsumura, S. Kawaguchi, Y. Kutoba and H. Kitagawa, Nat. Commun., 2018, 9, 510 CrossRef PubMed.
- Y. Zhao, Y. Zhao, G. Waterhouse, L. Zheng, X. Cao, F. Teng, L. Wu, C. Tung, D. O'Hare and T. Zhang, Adv. Mater., 2017, 29, 1703828 CrossRef PubMed.
- H. Sa'adi and B. Hamad, J. Phys. Chem. Solids, 2008, 69, 2457–2464 CrossRef.
- H. Duan, N. Yan, R. Yu, C. Chang, G. Zhou, H. Hu, H. Rong, Z. Niu, J. Mao, H. Asakura, T. Tanaka, P. Dyson, J. Li and Y. Li, Nat. Commun., 2014, 5, 3093 CrossRef PubMed.
- Y. Pang, M. Zhang, D. Chen, W. Chen, F. Wang, S. Anwar, M. Saunders, M. Rowles, L. Liu, S. Liu, A. Sitt, C. Li and G. Jia, J. Phys. Chem. Lett., 2019, 10, 3465–3471 CrossRef CAS PubMed.
- J. Zhang, G. Wang, Z. Liao, P. Zhang, F. Wang, X. Zhuang, E. Zschech and X. Feng, Nano Energy, 2017, 40, 27–33 CrossRef CAS.
- P. Lettenmeier, L. Wang, U. Golla-Schindler, P. Gazdzicki, N. Canas, M. Handl, R. Hiesgen, S. Hosseiny, A. Gago and K. Friedrich, Angew. Chem., Int. Ed., 2016, 55, 742–746 CrossRef CAS PubMed.
- J. Guan, D. Li, R. Si, S. Miao, F. Zhang and C. Li, ACS Catal., 2017, 7, 5983–5986 CrossRef CAS.
- D. Liu, Q. Lv, S. Lu, J. Fang, Y. Zhang, X. Wang, Y. Xue, W. Zhu and Z. Zhuang, Nano Lett., 2021, 21, 2809–2816 CrossRef CAS PubMed.
- F. Zhao, B. Wen, W. Niu, Z. Chen, C. Yan, A. Selloni, C. Tully, X. Yang and B. Koel, J. Am. Chem. Soc., 2021, 143, 15616–15623 CrossRef CAS PubMed.
- J. Zhu, Z. Chen, M. Xie, Z. Lyu, M. Chi, M. Mavrikakis, W. Jin and Y. Xia, Angew. Chem., Int. Ed., 2019, 58, 7244–7248 CrossRef CAS PubMed.
- M. Li, Z. Zhao, Z. Xia, M. Luo, Q. Zhang, Y. Qin, L. Tao, K. Yin, Y. Chao, L. Gu, W. Yang, Y. Yu, G. Lu and S. Guo, Angew. Chem., Int. Ed., 2021, 60, 8243–8250 CrossRef CAS PubMed.
- F. Xue, X. Guo, B. Min, Y. Si, H. Huang, J. Shi and M. Liu, ACS Catal., 2021, 11, 8239–8246 CrossRef CAS.
- P. Jovanovič, N. Hodnik, F. Ruiz-Zepada, I. Arčon, B. Jozinovič, M. Zorko, M. Bele, M. Šala, V. Šelih, S. Hočevar and M. Gaberšček, J. Am. Chem. Soc., 2017, 139, 12837–12846 CrossRef PubMed.
- O. Kasian, J. Grote, S. Geiger, S. Cherevko and K. Mayrhofer, Angew. Chem., Int. Ed., 2018, 57, 2488–2491 CrossRef CAS PubMed.
- H. Wu, Y. Wang, Z. Shi, X. Wang, J. Yang, M. Xiao, J. Ge, W. Xing and C. Liu, J. Mater. Chem. A, 2022, 10, 13170–13189 RSC.
- J. Shan, C. Ye, S. Chen, T. Sun, Y. Jiao, L. Liu, C. Zhu, L. Song, Y. Han, M. Jaroniec, Y. Zhu, Y. Zheng and S. Qiao, J. Am. Chem. Soc., 2021, 143, 5201–5211 CrossRef CAS PubMed.
- X. Zhang, C. Yang, C. Gong, M. Liu, W. Zhou, H. Su, F. Yu, F. Hu, Q. Liu and S. Wei, Angew. Chem., Int. Ed., 2023, 62, e202308082 CrossRef CAS PubMed.
Footnotes |
| † Electronic supplementary information (ESI) available: Experimental details and additional data (Fig. S1–S12 and Table S1). See DOI: https://doi.org/10.1039/d4nr01117a |
| ‡ These authors contributed equally to this work. |
| This journal is © The Royal Society of Chemistry 2024 |