DOI:
10.1039/D4NR02640C
(Paper)
Nanoscale, 2024,
16, 19006-19020
Unveiling efficient S-scheme charge carrier transfer in hierarchical BiOBr/TiO2 heterojunction photocatalysts†
Received
26th June 2024
, Accepted 28th August 2024
First published on 20th September 2024
Abstract
The construction of a potential heterojunction catalyst with proper interface alignment has become a hot topic in the scientific community to effectively utilize solar energy. In this work, a one-dimensional TiO2 nanofiber/BiOBr S-scheme heterojunction was synthesized, and charge carrier dynamics within the interface channel were explored. In addition, we incorporated mixed phase TiO2 with point defects and oxygen vacancies, which greatly promoted the initial band edge shift from the UV region. Upon the addition of BiOBr, absorption in the visible light region of the electromagnetic (EM) spectrum was observed with a decrease in the optical band gap value. The optimized BiOBr heterojunction (BTNF1.5) revealed a higher photocatalytic RhB dye degradation efficiency due to the efficient generation and separation of charge carriers upon light irradiation. The optimum sample BTNF1.5 showed a high degradation efficiency of 98.4% with a rate constant of 47.1 min−1 at 8 min of visible light irradiation, which is double than that of the pure TiO2. Electrochemical analysis, time-resolved photoluminescence and Kelvin probe measurement revealed an S-scheme charge-transfer mechanism within the BiOBr/TiO2 system. This work provides a strategy for the facile synthesis of heterojunction photocatalysts exhibiting exceptional catalytic performance.
1. Introduction
The excessive increase in environmental pollution and the lack of clean energy have been serious economic concerns. Therefore, the production of clean and renewable energy is highly essential.1–3 Photocatalysis, which mimics photosynthesis in the presence of efficient catalysts, has been found highly desirable to overcome energy and environmental-related issues. This technique has enabled the efficient conversion of solar energy into chemical energy through water splitting, dye degradation and various practical applications to procure sustainable clean energy and environment.4–9 In this regard, semiconductor materials, such as TiO2, ZnO, SrTiO3, BaTiO3, and SnO2![[thin space (1/6-em)]](https://www.rsc.org/images/entities/char_2009.gif) 10–16 have showcased remarkable responses for the above-mentioned real-life requirements. As per reports, the band gaps of these materials fall in the UV absorption region, which enables the superior rate of charge carrier generation; high stability, which causes less damage to the reactivity of the material; and high selectivity, which promotes specific reaction pathways; therefore, unwanted chemical reactions and formation of by-products are in control. Besides these advantages, the wide band gap shows some limitations, such as absorption in the visible range spectrum, which is highly necessary but leads to low efficiency. As discussed, although TiO2 can be regarded as a paradigm-catalytic material, it has attained tremendous attention owing to its low toxicity and photochemical stability with appropriate energy levels to enact redox reactions to degrade environmental pollutants. Based on the reported theoretical and experimental studies, the optical band gap value is 3.0–3.2 eV, which corresponds to various polymorphs of TiO2, i.e., anatase, rutile, and brookite with n-type semiconducting properties. However, due to the broad band gap, the absorption is limited to the UV region and leads to a high possibility of obstruction in charge carrier dynamics.17–20 The presence of intrinsic defects, oxygen vacancies, and the formation of Ti3+ have been reported using various annealing techniques.21–26 However, expected results could not be achieved. In order to improve such limitations, researchers have tried a number of techniques, such as the attachment of metal nanoparticles, which forms a Schottky junction and enhances the absorption in the visible region to an extent due to localized surface plasmon resonance (LSPR).27–30 Another strategy introduced was to couple with another semiconductor material with less band gap, which does have the photo-induced charge carrier interaction at the visible region as well as with suitable band alignment. This selection to develop nano-heterojunctions will greatly enhance the generation, separation, and more productive redox reactions at active sites.31–34 Moreover, the band alignment for such p–n semiconductors is further classified as Type-II and Z-scheme heterojunction, which has been widely recognized where the former is chosen with n and p-type materials of staggered band alignment with short carrier diffusion distance and the latter, in most cases, requires some mediator to follow the Z-pathway of electrons generated.35–38 Wang et al. proposed a type-II heterojunction in the TiO2–BiVO4 nanocomposite, which has made a significant change in the recombination of electron–hole pairs to increase the visible light absorption and stability to degrade the RhB dye with solar photoelectron catalysis (SPEC) than photocatalysis (PC).39 Xiao et al. have reported a novel hexagonal TiO2 structure forming a van der Waals heterostructure with 2D MoS2 and WS2 components using computational methods. Here, the heterostructures showed a direct band gap with improved mobility and absorption towards visible light. The charge carrier migration created a built-in electric field with a type-II band alignment, hence making it suitable for energy and environment applications.40 Later, Jin et al. demonstrated a novel ternary TiO2/W18O49 with Ti3C2Tx-MXene as a cocatalyst with a Z-scheme heterostructure with effective charge transfer as well as reinforce the light absorption to promote the photocatalytic antibacterial studies on E. coli bacteria.41 Similarly, Liu et al. have also synthesized and reported an excellent 3D heterojunction with CQDs/TiO2/g-C3N4 composite. It was found to have spontaneous absorption, generation, and separation of charge carriers, which showed an ultimate response in the photocatalytic degradation rate for the RhB dye.42 Though the type-II and Z-scheme heterojunction provides a spatial charge separation, it is found to have less redox ability due to the conduction and valence band position. Also, at a certain point, the SCs attain the electron and hole-rich stage, which generates high electrostatic repulsion, eventually hindering the overall efficiency. This has led to finding new ways to control the charge transfer path to integrate the performance and led to the S-scheme strategy with a different charge transfer route where the material chosen should exhibit high reduction and oxidation potentials with n-type semiconductor properties.43 Xu et al. have investigated the TiO2/CsPbBr3 (perovskite) heterostructure synthesised utilizing an electrostatic-driven self-assembly approach for CO2 reduction. A suitable S-scheme pathway with effective charge carrier separation and transport was elucidated with appropriate experimental and theoretical studies, introducing an effective internal electric field in the system. The light absorbance was enhanced from UV to visible range with an enhanced CO2 reduction rate of 9.02 μmol g−1 h−1.44 Similarly, Wang et al. proposed a novel photocatalyst of CdS/TiO2 hollow microspheres and revealed the S-scheme mechanism with effective redox capability for CO2 reduction activity.45
10–16 have showcased remarkable responses for the above-mentioned real-life requirements. As per reports, the band gaps of these materials fall in the UV absorption region, which enables the superior rate of charge carrier generation; high stability, which causes less damage to the reactivity of the material; and high selectivity, which promotes specific reaction pathways; therefore, unwanted chemical reactions and formation of by-products are in control. Besides these advantages, the wide band gap shows some limitations, such as absorption in the visible range spectrum, which is highly necessary but leads to low efficiency. As discussed, although TiO2 can be regarded as a paradigm-catalytic material, it has attained tremendous attention owing to its low toxicity and photochemical stability with appropriate energy levels to enact redox reactions to degrade environmental pollutants. Based on the reported theoretical and experimental studies, the optical band gap value is 3.0–3.2 eV, which corresponds to various polymorphs of TiO2, i.e., anatase, rutile, and brookite with n-type semiconducting properties. However, due to the broad band gap, the absorption is limited to the UV region and leads to a high possibility of obstruction in charge carrier dynamics.17–20 The presence of intrinsic defects, oxygen vacancies, and the formation of Ti3+ have been reported using various annealing techniques.21–26 However, expected results could not be achieved. In order to improve such limitations, researchers have tried a number of techniques, such as the attachment of metal nanoparticles, which forms a Schottky junction and enhances the absorption in the visible region to an extent due to localized surface plasmon resonance (LSPR).27–30 Another strategy introduced was to couple with another semiconductor material with less band gap, which does have the photo-induced charge carrier interaction at the visible region as well as with suitable band alignment. This selection to develop nano-heterojunctions will greatly enhance the generation, separation, and more productive redox reactions at active sites.31–34 Moreover, the band alignment for such p–n semiconductors is further classified as Type-II and Z-scheme heterojunction, which has been widely recognized where the former is chosen with n and p-type materials of staggered band alignment with short carrier diffusion distance and the latter, in most cases, requires some mediator to follow the Z-pathway of electrons generated.35–38 Wang et al. proposed a type-II heterojunction in the TiO2–BiVO4 nanocomposite, which has made a significant change in the recombination of electron–hole pairs to increase the visible light absorption and stability to degrade the RhB dye with solar photoelectron catalysis (SPEC) than photocatalysis (PC).39 Xiao et al. have reported a novel hexagonal TiO2 structure forming a van der Waals heterostructure with 2D MoS2 and WS2 components using computational methods. Here, the heterostructures showed a direct band gap with improved mobility and absorption towards visible light. The charge carrier migration created a built-in electric field with a type-II band alignment, hence making it suitable for energy and environment applications.40 Later, Jin et al. demonstrated a novel ternary TiO2/W18O49 with Ti3C2Tx-MXene as a cocatalyst with a Z-scheme heterostructure with effective charge transfer as well as reinforce the light absorption to promote the photocatalytic antibacterial studies on E. coli bacteria.41 Similarly, Liu et al. have also synthesized and reported an excellent 3D heterojunction with CQDs/TiO2/g-C3N4 composite. It was found to have spontaneous absorption, generation, and separation of charge carriers, which showed an ultimate response in the photocatalytic degradation rate for the RhB dye.42 Though the type-II and Z-scheme heterojunction provides a spatial charge separation, it is found to have less redox ability due to the conduction and valence band position. Also, at a certain point, the SCs attain the electron and hole-rich stage, which generates high electrostatic repulsion, eventually hindering the overall efficiency. This has led to finding new ways to control the charge transfer path to integrate the performance and led to the S-scheme strategy with a different charge transfer route where the material chosen should exhibit high reduction and oxidation potentials with n-type semiconductor properties.43 Xu et al. have investigated the TiO2/CsPbBr3 (perovskite) heterostructure synthesised utilizing an electrostatic-driven self-assembly approach for CO2 reduction. A suitable S-scheme pathway with effective charge carrier separation and transport was elucidated with appropriate experimental and theoretical studies, introducing an effective internal electric field in the system. The light absorbance was enhanced from UV to visible range with an enhanced CO2 reduction rate of 9.02 μmol g−1 h−1.44 Similarly, Wang et al. proposed a novel photocatalyst of CdS/TiO2 hollow microspheres and revealed the S-scheme mechanism with effective redox capability for CO2 reduction activity.45
Based on the literature survey, in this work, we have chosen a bismuth-based oxyhalide material, BiOBr, which exists as a Sillén-Aurivillius structure with visible light absorption capability and is expected to be the best candidate for improving the absorption spectra of the TiO2 material. The unique alternating configuration with [Bi2O2]2+ and intergrown with a double halide layer of atoms assisting the generation of a static electric field in BiOBr allows the separation of charge carriers with good optical and mechanical properties.46–50 This layered structure inhibits n-type behaviour with an indirect semiconductor property that can be preferred to restrict charge carrier recombination. Hence, tailoring the BiOBr/TiO2 heterojunction would be highly desirable for obtaining good photocatalysts.
Herein, for the fabrication of a hierarchical BiOBr/TiO2 system, we have chosen one-dimensional TiO2 morphology using the versatile electrospinning method. The main advantage of using nanofibers is their high aspect ratio, good absorption and separation capability, stability/reusability, and essentially more branches of functional groups along the axis, which can allow the incorporation of other semiconductor materials of various dimensions. Here, BiOBr ultra-thin nanosheets were tailored, and the density over the nanofiber was controlled by tuning an equal ratio of Bi[NO3]3·5H2O and KBr source. Using these n-type semiconductors with staggered band position alignment and appropriate redox potential, a facile heterojunction was constructed. Unveiling the special charge carrier separation and migration with systematic characterization studies and revealing the effective photocatalytic RhB dye degradation under visible light irradiation is the main motive of this work. Based on the experimental studies, we have proposed and discussed the appropriate mechanism.
2. Experimental details
2.1. Materials and methods
All the chemicals used were analytical grade and purchased from Sigma Aldrich, Alfa-Aeasar, and Hayman Group Ltd and used without any further purification.
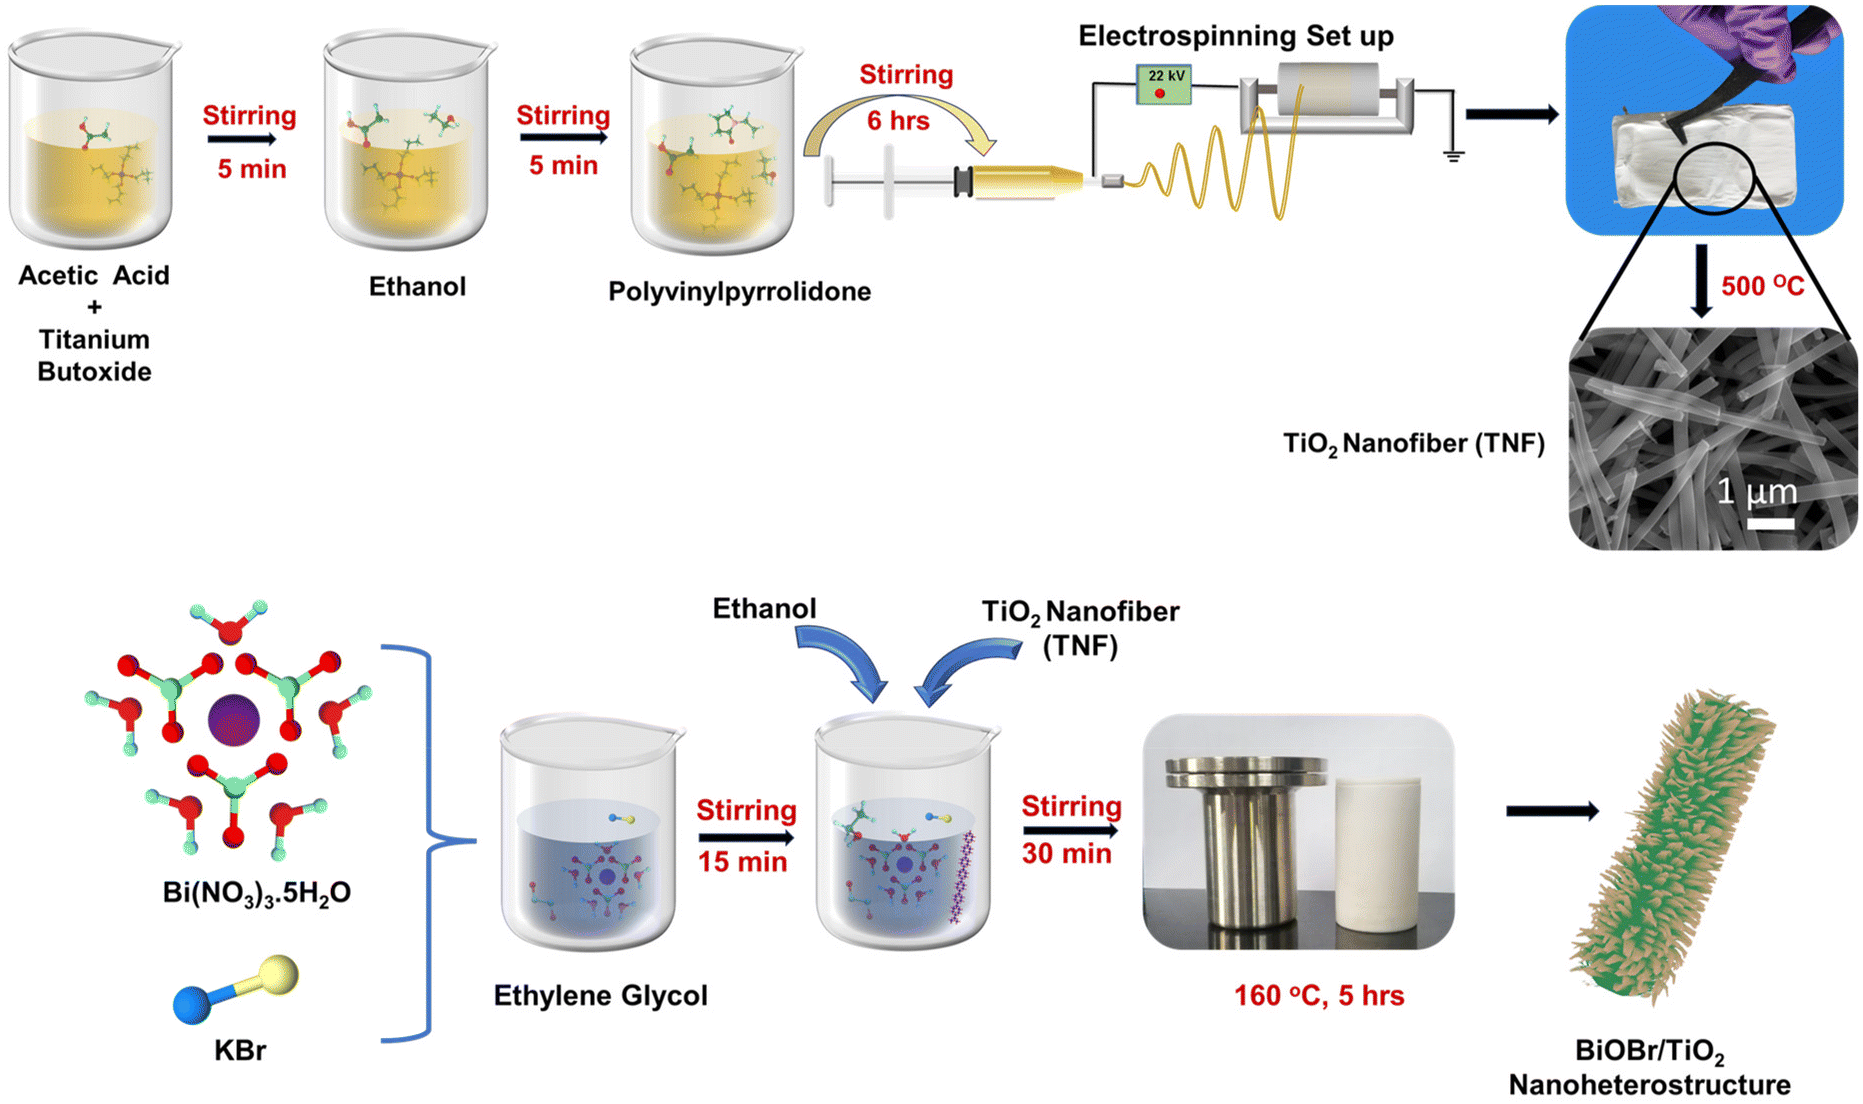
The titanium dioxide nanofibers (TNF) mats were synthesized using the electrospinning technique with a positive bias built at the nozzle tip. Titanium(IV) butoxide was used as a TiO2 precursor; in addition to obtaining the required homogenous precursor electrospinning solution, acetic acid and ethanol were chosen as the solvents. Hereafter, PVP was mixed to attain the visco-elastic nature with elongation in uniaxial nature. Briefly, 4 mL each of titanium precursor and acetic acid were stirred in which 10 mL of ethanol was poured and allowed to stir for some time; then, 7 wt% of PVP was added and was stirred vigorously for 6–8 h at room temperature. The conductivity of the TiO2 precursor solution is measured and recorded as 64 μS cm−1. The transparent viscous precursor was transferred to a 10 mL plastic syringe. The electrospinning parameters were maintained with a flow rate of 2.5 mL h−1, nozzle to collector distance of 10 cm, and applied voltage of 20–22 kV, along with controlled temperature and humidity of around 20 °C and 55%, respectively. The sample was further annealed at 500 °C. The precursor ratio, electrospinning parameters, and annealing temperature were fixed based on our previous study.51
The BiOBr/TiO2 samples were synthesised via a facile solvothermal process, and the detailed process is depicted in Scheme 1. For this, 10 mL of ethylene glycol was taken, in which an equal ratio of bismuth nitrate pentahydrate [Bi(NO3)3·5H2O] and potassium bromide [KBr] was added and stirred for 15 min, followed by the addition of 60 mL of ethanol and allowed to stir for another 30 min. Then, 50 mg of TNF sample was introduced with very slow stirring to obtain a homogeneous solution. The solution color turned to milky white. The solvothermal synthesis was performed in a 100 mL Teflon-lined autoclave. The temperature was set to 150 °C for 5 h. The ratio of Bi(NO3)3·5H2O and KBr was varied as 0.5, 1, 1.5, and 2 mM. The sample collected was washed with DI and ethanol, followed by drying. The obtained mixtures were named BTNF0.5, BTNF1, BTNF1.5, and BTNF2. The pristine BiOBr material synthesis also followed a similar route except for the addition of the TiO2 nanofiber.
 |
| | Scheme 1 Schematic of the synthesis process of TiO2 nanofiber and BiOBr/TiO2 nanoheterojunctions. | |
2.2. Characterizations
The morphology of the sample prepared was analysed using a high-resolution scanning electron microscope [HRSEM, Thermosceintific Apreo S]. The crystal structure analysis was confirmed using X-ray diffraction with Cu-Kα radiation [λ = 1.54 Å, BRUKER USA D8 Advance, Davinci]. High-resolution transmission electron microscope (TEM) images were obtained using a JEOL Japan, JEM-2100 Plus electron microscope with an accelerating voltage of 200 kV. X-ray photoelectron spectroscopy (XPS) was performed using an X-ray photoelectron spectrometer (XPS) PHI Versaprobe III with monochromatic Al Kα radiation (hυ = 1486 eV) under high vacuum 10−7 pascal chamber pressure. The C 1s peak revised all binding energies at 284.6 eV. The vibrational dynamics were confirmed with a confocal micro Raman spectrometer [HORIBA, LabRam HR Evolution]. Diffuse reflectance spectroscopy (DRS) was used to study the optical band gap of the materials over the range of 200–800 nm [Agilent, Cary 5000]. The work function values were calculated from the contact potential difference values, which were measured through a scanning kelvin probe (SKP) system with a gold tip vibrating at 78.3 Hz (SKP5050, KP Technologies Ltd, UK). Time-resolved photoluminescence (TRPL) decay spectra were obtained with a time-correlated single-photon counting (TCSPC) technique with a 273 nm excitation wavelength laser (FLS 980 spectrophotometer, Edinburgh Instruments Ltd).
2.3. Photocatalytic performance
For the photocatalytic dye degradation study, a setup with a 300 W visible lamp (Philips metal halide lamps (HPI-T 300 W) with wavelength (λ) of 350–650 nm) was used, and all the samples were evaluated for the model organic pollutant dye RhB. A typical phocatalytic test was estimated by taking 10−5 M of RhB dye in 40 mL of DI water. To this, 40 mg of the catalysts was dispersed and allowed to stir in the dark for 30 min. This helped the adsorption/desorption of the dye with the catalysts before the light irradiation process. While in dark stirring conditions, in 10 min intervals, 3 mL of aliquot was collected. After light irradiation at a given interval of time, required aliquots were collected and further filtered out to remove the residues present. The concentration of RhB, which exhibited an absorption wavelength of 550 nm, was recorded using the UV-Vis spectrometer.
2.4. Photoelectrochemical characterization
The electrochemical analysis was performed using a standard three-electrode system CH1760E bipotentiostat (CH Instrument, Inc., USA) in an alkaline medium of 0.1 M Na2SO4 at ambient temperature. In this study, Ag/AgCl (Sat. KCl) as a reference electrode and graphite rod as a counter electrode were used throughout the electrochemical measurements. According to the equation, E (RHE) = E (Ag/AgCl) + 0.998 V, the recorded potential against Ag/AgCl was finally converted with respect to a reversible hydrogen electrode (RHE). A glassy carbon (GC) electrode (0.0707 cm2) was used as a working electrode. Initially, the surface of the GC electrode was polished with 0.05 μm alumina slurry and thoroughly rinsed with Milli-Q water. For the preparation of the active catalysts, 2 mg of the catalyst was used and dissolved with 200 μL of IPA, 796 μL of deionized water, and 4 μL Nafion (5 wt%, Aldrich) and ultrasonicated in cold bath for 30 min to obtain a homogenous catalyst ink. From this, 4 μL of catalyst ink was drop-cast on the GC electrode and dried at a slow rate throughout the night. For the measurement of electrocatalytic activity of composite materials, N2 gas was purged to confirm the saturation. The EIS data were obtained in the frequency range of 1 MHz to 0.1 Hz, using a 0 V bias potential and an AC amplitude of 5 mV. A 35 W tungsten halogen lamp with a 320–1100 nm wavelength range was used to test the photocurrent response. The Mott–Schottky measurements were meticulously documented for both the pristine and heterojunction samples.
3. Results and discussion
3.1. Crystal structure and morphology
The crystallinity, orientation, and structure of the synthesised materials using different molar ratios of BiOBr sources were investigated and are shown in Fig. 1. The diffraction pattern of the BiOBr is in agreement as per the JCPDS card no. 98-007-8324; space group-P4/nmm. The peaks of BiOBr at 10.9°, 25.3°, 31.8°, 32.4°, 39.4°, 46.4°, and 57.3° correspond to the (001), (011), (012), (110), (112), (020) and (122) crystal faces, respectively. The synthesised pristine TiO2 nanofiber was found to have the dual phase of anatase and rutile, consistent with the previously reported peak positions. The typical anatase peak positions are at around 25.3°, 36.1°, 37.9°, 48.2°, 62.7°, 75.2°, 82.2°, corresponding to the JCPDS card no. 98-010-6857; space group-I41/amd. Likewise, the rutile peak positions at around 27.4°, 41.3°, 44.1°, 54.3°, 56.6°, 69.08°, 89.7° correspond to the card no. 98-006-2534; space group-P42/mnm. Both the chosen systems correspond to the high-purity tetragonal crystal structure. The addition of BiOBr on the TiO2 nanofiber surface has resulted in a shift towards the lower 2θ angle for the dominant peaks of TiO2 and BiOBr, which clearly indicates the increase in the lattice distance shown in Fig. 1b and c. It can be said that they extend the bond length and increase the ionic radius, hence augmenting the cell volume of the system.52 Also, we noticed a variation in the anatase-rutile weight fraction with the increment of the BiOBr molar ratio, which was calculated using Spurr-Myers equation (1):53| | 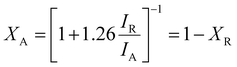 | (1) |
XA and XR represent the weight fraction of anatase and rutile in the TiO2 nanofiber sample, and IA and IR are the diffraction peak intensities of anatase and rutile.
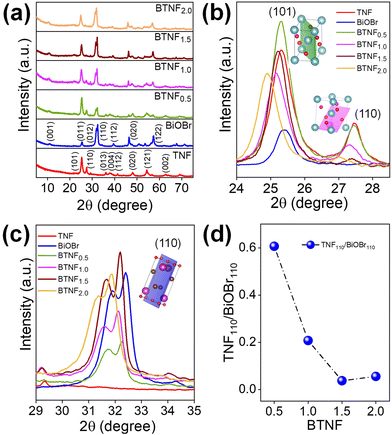 |
| | Fig. 1 (a) XRD diffraction patterns of pristine TiO2 nanofiber (TNF); BiOBr; and heterojunctions of BTNF0.5, BTNF1.0, BTNF1.5, and BTNF2.0. (b and c) Magnified portion of the spectra from 23–28° of TNF and 29–35° of BiOBr with an inset crystal structure with (101) and (110) planes, respectively, and (d) effect of the intensity ratio of TNF110/BiOBr110 with an increase in BiOBr content. | |
Based on the above equation, XA and XR are calculated and represented in Table S1,† and a plot of BTNF1.5 is shown in Fig. S1.† Interestingly, it was observed that the anatase phase weight fraction was accelerated with the increase in the BiOBr precursor content till the BTNF1.5 sample when compared with bare TiO2 nanofiber and a decrement in the rutile weight fraction was noticed. However, on a further increase in the BiOBr content, anatase% was suppressed with a good amount of shift towards a lower peak position, as shown in Fig. 1b. Additionally, it is observed that the intensity of the (110) facet of rutile TiO2 and the (110) facet of BiOBr showed variation over the heterojunctions. From Fig. 1d, there is a decrease in the intensity ratio of R110/BiOBr110, which was attributed to the increasing Bi(NO3)3·5H2O and KBr contents during the synthesis of heterojunctions. This increase promotes the growth of BiOBr along the [110] direction and inhibits the growth of rutile TiO2 along the [110] direction.
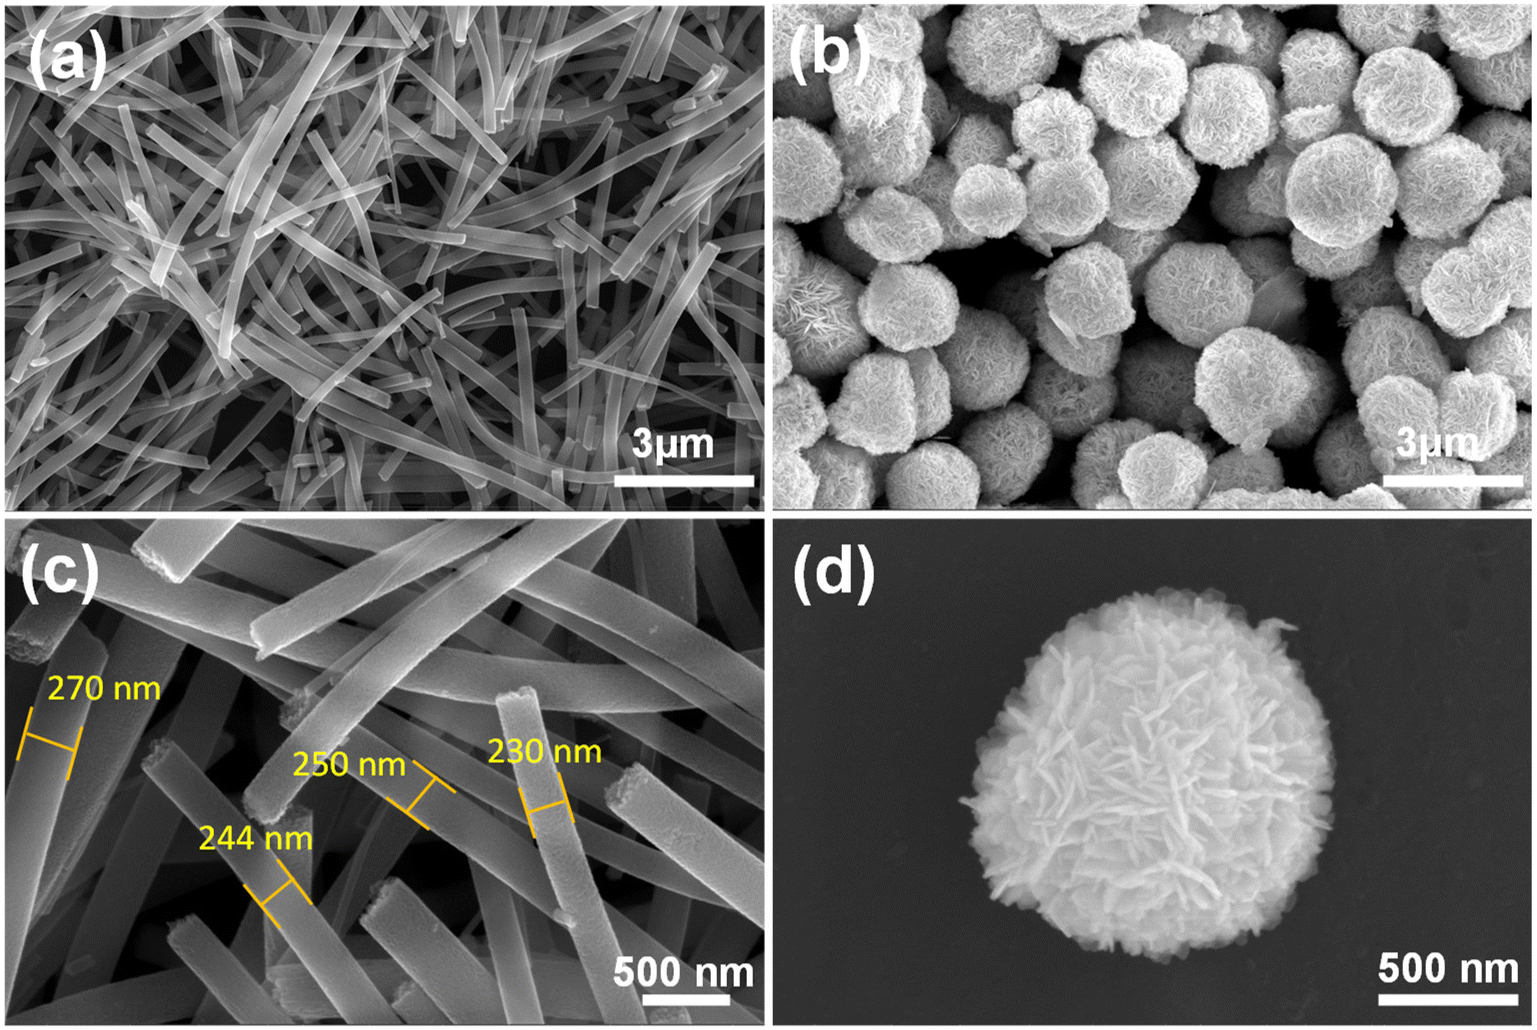
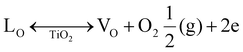
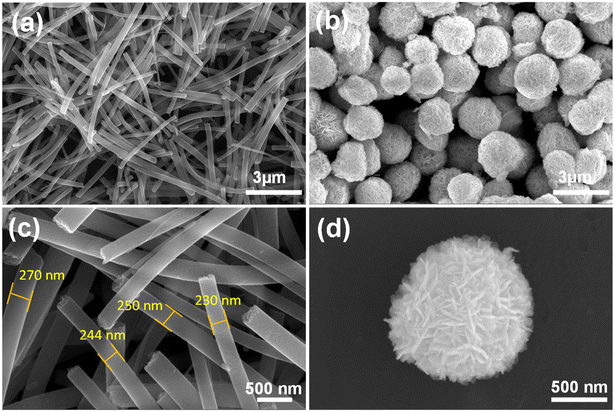
The morphology of the synthesised sample was evaluated using HRSEM, as displayed in Fig. 2 and 3. The morphology of the as-fabricated amorphous titanium dioxide nanofibers is displayed in Fig. S2.†Fig. 2a and b show low-resolution images of the randomly aligned annealed TiO2 nanofibers and BiOBr microflower structure grown using electrospinning and solvothermal techniques, respectively, and Fig. 2c and d represent the corresponding high-resolution images of the materials. The TiO2 nanofiber obtained after 500 °C calcination has an average diameter of 250 nm. The BiOBr morphology was similar to a dandelion-like structure, where a very thin sheet-like structure was grown to form a microflower structure. The sheets have a uniform width of around 500 nm and a thickness of 80 nm. Both the samples were grown with good uniformity, which is clear from the represented figure. Fig. 3a–h shows both low-resolution and high-resolution images of heterojunctions incorporating BiOBr of different molar ratios onto the surface of the TiO2 nanofiber; hence, TiO2 stands as a cornerstone in designing the hierarchical structure. After adding 0.5 mM of bismuth source, thin BiOBr nanosheets with 10–20 nm size started to form on the TiO2 surface (Fig. 3e). It was observed from the high-resolution SEM images (Fig. 3e–g) that a lower amount of BiOBr precursor does not allow growth; it had typical seeding behaviour, whereas the nucleation and growth of the BiOBr nanostructure on the TiO2 nanofiber surface gradually increased with the increase in the molar ratio of bismuth salt, and the fibers were densely covered with thin sheet-like structure. When the ratio of Bi(NO3)3·5H2O and KBr was increased to 1.5 mM, the TiO2 nanofibers were decorated with dense nanosheets of BiOBr and with further increase in Bi(NO3)3·5H2O and KBr molar ratio, excess Bi3+ and Br− ion started to form homonucleation, which increased the growth of the BiOBr nanoflower. Hence, the microflower structure of BiOBr seemed to be dismantled and gathered along the surface of nanofibers, forming a stable structure. The heterojunction between TiO2 and BiOBr can be controlled by the loading amount of BiOBr on the TiO2 surface. Fig. 4 shows the EDAX elemental mapping of the BTNF1.5 heterojunction sample. The elemental distribution of Bi and Br from BiOBr as well as Ti and O from TiO2, further confirms the firm attachment of BiOBr on TNF uniformly with a certain atomic weight%. The elemental mapping of BTNF0.5, BTNF1.0 and BTNF2.0, along with atomic% details, is shown in Fig. S3–S5.† With an increase in the BiOBr amount in the heterojunction, the total weight percentage of (Ti + Bi + Br) increased. On the other hand, the total oxygen weight percentage is decreased, as listed in Table S2.† The ratio of the total weight percentage of (Ti + Bi + Br) with oxygen is represented in Fig. S7.† Furthermore, the EDAX measurements of the TiO2 material unveiled the atomic percentage of Ti and O elements as 13.95% and 86.05%, respectively, as shown in Fig. S6.† This is likely due to the missing oxygen atoms from the lattice site, resulting in the transition from Ti4+ to the Ti3+ ionic state, causing the inclusion of oxygen vacancies (VO) in the system when annealed at 500 °C. The VO formation can be described using the Kroger-Vink notation at the equilibrium state54 according to eqn (2):
| |  | (2) |
 |
| | Fig. 2 (a and b) Low-magnification image and (c and d) corresponding high-magnification image of pristine TiO2 nanofiber and BiOBr microflower nanostructures. | |
 |
| | Fig. 3 (a–d) Low-resolution and (e and f) the corresponding high-resolution HRSEM images of BTNF0.5, BTNF1.0, BTNF1.5, and BTNF2.0. | |
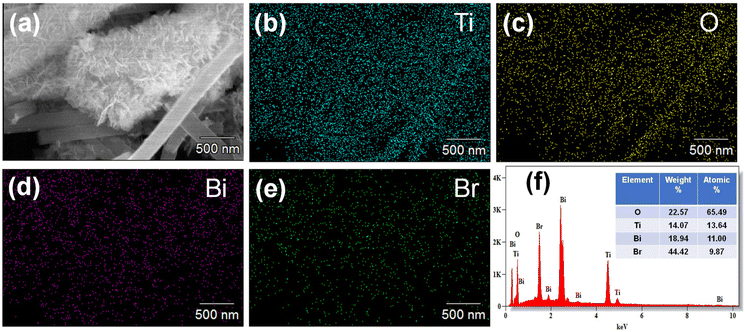 |
| | Fig. 4 (a–e) The elemental mapping images of the BTNF1.5 heterojunction, and (f) corresponding atomic% in the sample. | |
The equilibrium constant is represented as in eqn (3):
Hence, the concentration of oxygen vacancies can be denoted as in eqn (4):
Here, VO represents the oxygen vacancy, LO denotes the lattice oxygen, {Vo} denotes the concentration of oxygen vacancies and p(O2) represents the oxygen pressure during the vacancy formation. This illustrates that the oxygen vacancy is inversely related to the pressure during the ambient annealing condition, hence promoting vacancies in the TiO2 system.
Also, based on our previous studies, we have explored and confirmed the formation or the presence of defect states and oxygen vacancies in the mixed-phase annealed TiO2 using photoluminescence studies.53 Therefore, owing to the presence of defects or vacancy states in TiO2 as well as the uniformity and stability of the densely arranged BiOBr onto the TiO2 surface, it can be assumed to have enhanced active sites to carry out the redox reaction. This benefits photocatalytic applications.
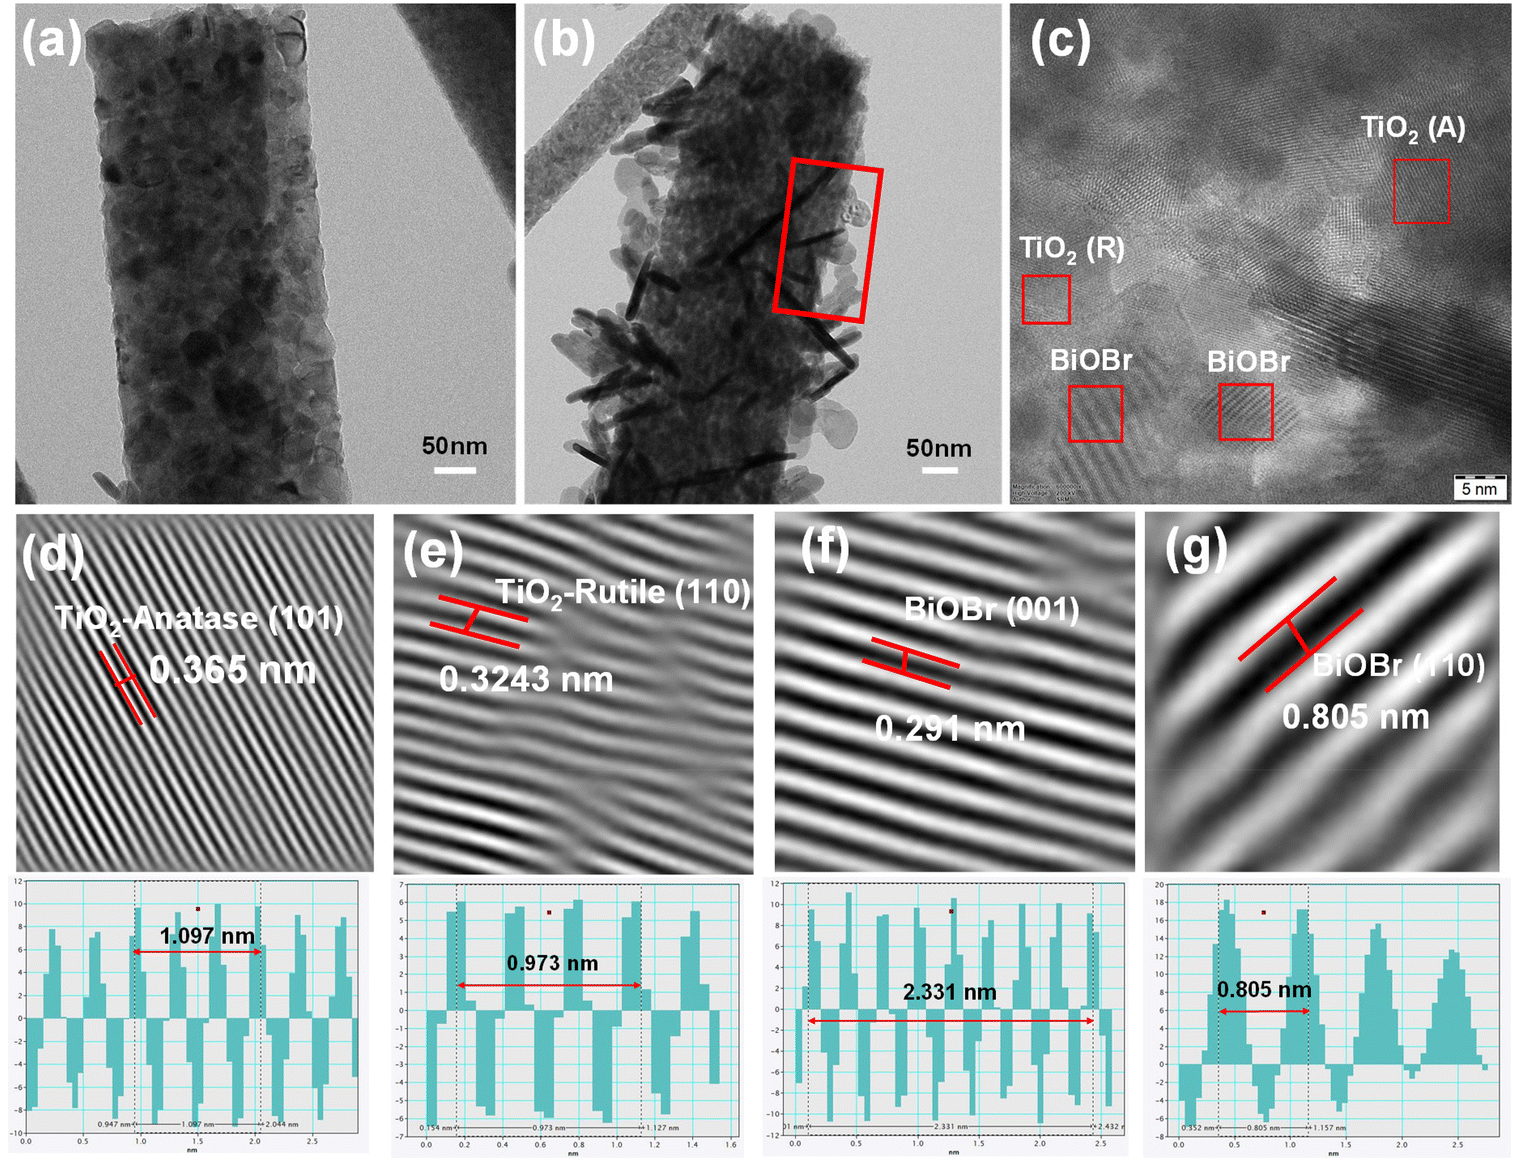
The successful formation of the heterojunction was further confirmed through HRTEM analysis. Prior to the HRTEM measurement, the sample was diluted in ethanol and sonicated for approximately 3 min. The morphology obtained for TNF and BTNF, as shown in Fig. 5a and b, was in agreement with the HRSEM analysis. The sample looked stable and was well attached to the TiO2 nanofiber surface even after subjecting it to ultrasonication. To understand the details of the heterojunction formation, a portion of Fig. 5b was focused on for the HRTEM study. Fig. 5c represents the HRTEM images, in which both the lattice fringes of TiO2: anatase (101) and rutile (110), as well as BiOBr with (110) and (001) tetragonal planes were clearly visible, depicting the good crystallinity in the formed crystal structure. These correspond to the lattice fringe spacing of 0.365 nm, 0.3243 nm, 0.291 nm, and 0.805 nm, respectively. The above analysis agrees with the XRD diffraction patterns observed in Fig. 1a, S1, and Table S1.†
 |
| | Fig. 5 (a and b) TEM images of TNF and BTNF1.5 and (c) HRTEM image of BTNF1.5. (d–g) Inverse Fourier-filtered images of TiO2-anatase, rutile, and BiOBr- (001) and (110) planes with their corresponding line profiles. | |
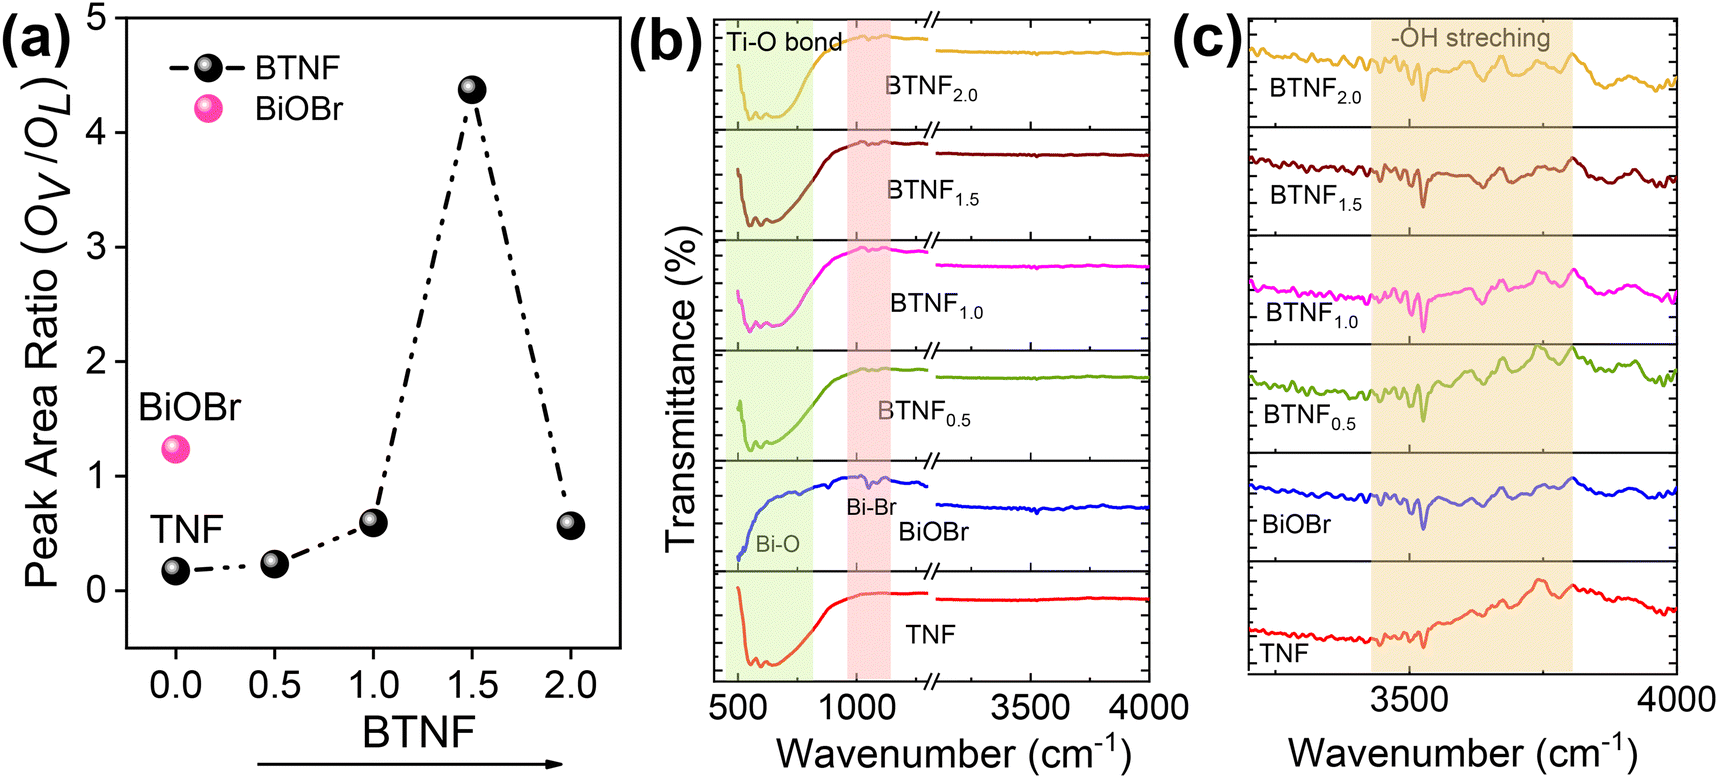
The chemical states and the surface interactions of TNF, BiOBr, and BTNF1.5 were investigated by XPS measurement. The survey spectrum of TiO2, BiOBr, and BTNF is shown in Fig. S8.† The BTNF-1.5 spectrum confirms the presence of five elements (Ti, O, Bi, Br, and C). The peaks of Ti 2p in TNF and BTNF, as shown in Fig. 6a, at 458.2 eV and 464.01 eV represent Ti 2p3/2 and Ti 2p1/2, respectively, with a peak splitting of ∼5.8 eV, confirming the presence of TiO2 with the Ti4+ state,55 whereas BTNF existed as two shoulder peaks at 457.7 and 463.8 eV, which indicates the partial reaction of Ti4+ to Ti3+, resulting in oxygen vacancies during the solvothermal reaction.56 The O 1s XPS spectrum for TNF and BiOBr (Fig. 6b) showed three peaks located at 529.3, 530.06, and 531.2 eV, for TiO2 and 529.4, 530.06, and 531.7 eV corresponds to BiOBr, which denotes the presence of lattice oxygen, oxygen vacancies, and surface hydroxyl radicals, respectively. Meanwhile, for BTNF, a very slight shift was observed towards lower binding energy, which can be due to the chemical interaction between TNF and BiOBr. The intensity of peaks apparently increased with more oxygen vacancies, leading to the effective heterojunction formation.57 Similarly, the existence of Bi 4f was examined in BiOBr and BTNF. The spectra of Bi 4f (Fig. 6c) indicate the peak at 164 eV and 158.9 eV for Bi-4f5/2 and Bi-4f7/2, respectively, which confirms the existence of Bi3+ along with a spin–orbit splitting at ∼5.2 eV. Moreover, the shoulder peaks in BiOBr at 159 and 165 eV correspond to Bi 5+ oxidation states as well as the Bi–O bonds.58 On the other hand, Bi in BTNF showed a shift towards lower binding energy, which again denotes the strong chemical bonding between BiOBr and TNF. Additionally, two less significant peaks can be explained by the trivial surface charging effect caused by the polarization shift in the crystal.59 The peaks at 68.8 eV and 69.9 eV attribute to 3d5/2 and 3d3/2 for Br 3d (Fig. 6) spectra in BiOBr and BTNF, along with an additional peak at 67.8, which is not properly understood and has not been reported yet in the literature. Peaks in the carbon components in TNF, BiOBr, and BTNF can be linked to the instrument. From the XPS spectra, we have found out that all the samples exhibited dominant lattice oxygen species (OL), along with two shoulders, due to surface oxygen vacancy (VO) and adsorbed oxygen (OA) called hydroxyl radicals. The ratio of oxygen vacancies to lattice oxygen was used to estimate the amount of oxygen defects in different samples. According to Fig. 7a, the BTNF1.5 sample has more surface oxygen defects compared to the bare and other heterojunction samples. A higher number of oxygen vacancies can offer more active sites on the surface for the adsorption of active oxygen species during catalytic reactions. The nature of other shoulder peaks was confirmed using Fourier transform infrared spectroscopy (FTIR), as shown in Fig. 7b. The presence of peaks at 550–700 cm−1 denotes the strong binding energy between Ti–O stretching as well as Ti–O–Ti bridging stretching modes,60 which is also reflected in other heterojunction samples. Meanwhile, in the BiOBr spectrum, the peak in the 500–530 cm−1 range denotes the Bi–O stretching vibrations. The peaks at 1050 cm−1 can be attributed to the Bi–Br bond.61 The broad peaks at around 3500–4000 cm−1, as represented in Fig. 7c, correspond to the O–H stretching vibrations of the absorbed water molecules, as confirmed by XPS. The hydroxyl groups on the catalytic surface may be attributed to a reaction of adsorbed water molecules. In the photoreaction, the presence of surface −OH groups plays a vital role in capturing photogenerated holes (h+) to form ˙OH radicals, which can attack almost all organic pollutants.61
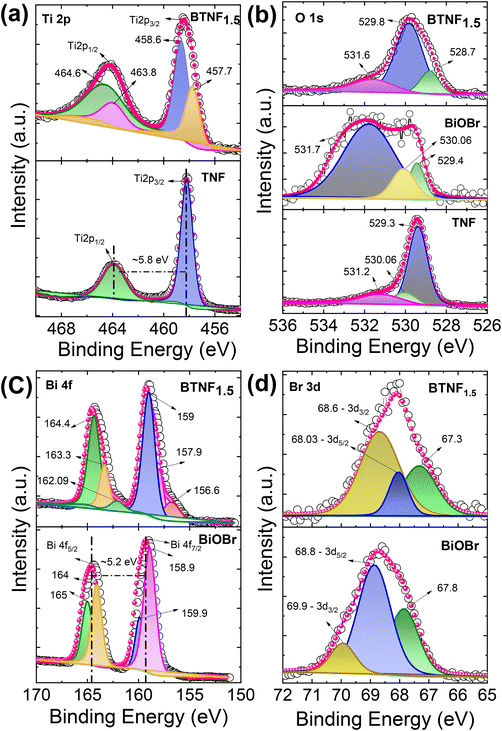 |
| | Fig. 6 High-resolution XPS spectra for elements (a) Ti 2p, (b) O 1s, (c) Bi 4f, and (d) Br 3d of BTNF1.5. | |
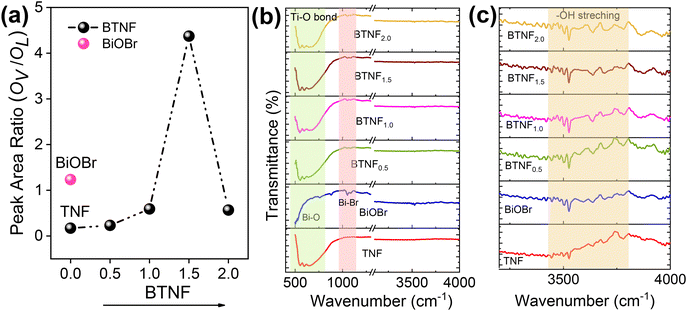 |
| | Fig. 7 (a) Peak area ratio of oxygen vacancies with lattice oxygen from XPS analysis, (b) FTIR spectrum, and (c) enlarged portion of the FTIR spectra in the 3000–4000 cm−1 range for all the photocatalysts. | |
3.2. Optical absorption and Raman analysis
The Raman analysis is another technique that clearly confirms the formation of TiO2 and BiOBr when compared to phase and purity along with the vibrational modes of the system. Fig. 8a depicts the band position at around 144, 397, 516, and 638 cm−1, corresponding to Eg, B1g, A1g, and Eg, respectively, for the Raman active mode of TiO2. For BiOBr, the band at positions 112 and 159 cm−1 can be assigned as A1g and E1g with the Bi–Br stretching mode. A very weak band around 470 cm−1 depicts the presence of Bi–O vibration modes. These sharp peaks confirm the good crystallinity, structural changes, and molecular level vibrations of the materials.
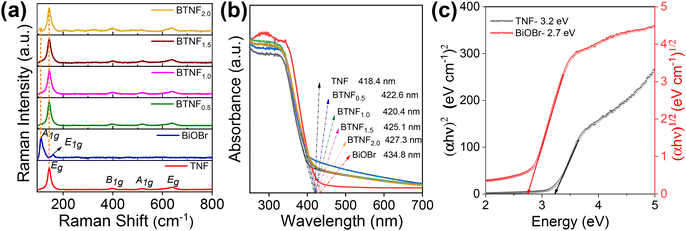 |
| | Fig. 8 (a) Raman spectroscopy analysis, (b) UV-vis diffuse reflectance spectra, and (c) corresponding band gap energy calculated using the Tauc plot of pristine TiO2 nanofiber (TNF); BiOBr; and heterojunctions of BTNF0.5, BTNF1.0, BTNF1.5, and BTNF2.0. | |
The optical properties of the synthesized materials were studied using the UV-Vis diffused reflectance spectrum. As depicted in Fig. 8b, the TiO2 material absorbs in the UV region with a wavelength around λ < 400 nm, whereas the pristine BiOBr sample absorption is indicated towards the visible region. On the other hand, when BiOBr with a different molar ratio is combined with TiO2, the optical band edge position red shifted towards the visible region, which showcases the integrity in light scattering within the interfacial reciprocity of the hierarchical BiOBr/TiO2 materials. The band gaps [Eg] are calculated for TiO2 and BiOBr samples using eqn (5) and represented in Fig. 8c.
Eg,
ν,
h,
α, and
A correspond to the optical band gap, light frequency, Planck constant, absorption coefficient, and a constant, respectively. Here,
n corresponds to 1 for direct transition and 4 for indirect transition. Herein, TiO
2 has a direct band gap
62 and BiOBr has an indirect band gap.
63 The band gap was estimated using the Tauc plot method. The TiO
2 nanofiber exhibited a direct band gap of 3.2 eV, whereas BiOBr had an indirect band gap of 2.7 eV.
3.3. Photocatalytic performance
The fabricated catalysts were subjected to photocatalytic dye degradation test under visible light irradiation as a function of time with Rhodamine B dye. RhB, being a very strong model pollutant with different functional groups attached, does not possess the ability of self-degradation. Therefore, semiconductor catalysts with suitable band gap energy, along with proper chemical structures and surface charges, are required to participate in the adsorption–desorption process. The whole dye degradation reaction occurs at the surface-active sites of the catalysts via strong chemical bonding and electrostatic interaction at different reaction rates.
Fig. S9† shows the efficiency of photodecomposition with different catalysts over the RhB dye at various time intervals. The samples were treated in the dark for 20 min to attain the adsorption–desorption equilibrium. Diffuse reflectance spectroscopy (DRS) was used to analyze the absorption of RhB on the catalyst surface over 20 minutes of dark stirring and the absorbed dye peak indicated the presence of the dye molecule. A controlled experiment was performed and from Fig. S9(a),† it was found that there was almost no degradation of RhB without the catalyst under 300 W visible light irradiation. A radical change was observed for all the BiOBr/TiO2 samples. Fig. 9a confirms that the addition of BiOBr on TiO2 nanofiber can greatly enhance the absorption towards the visible range spectrum as well, and the junction formed greatly promotes the interfacial charge carrier generation and efficient separation to have good activity. Therefore, the degradation efficiency of the samples was estimated with various dye concentrations for dark as well as light conditions using eqn (6):
| | | Photodegradation Efficiency (%) = [1 − Ct/C0] × 100 | (6) |
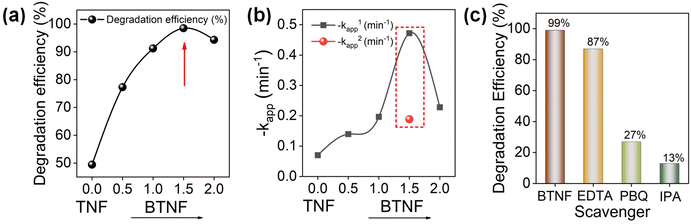 |
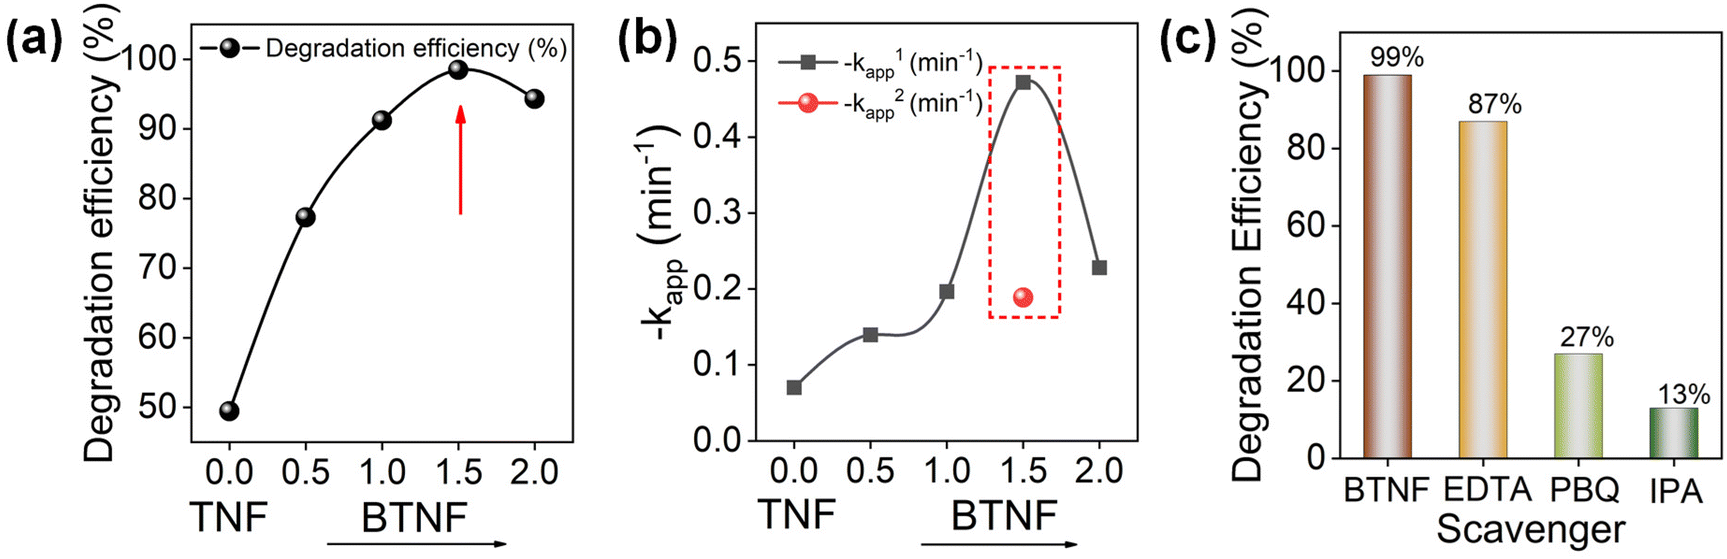
| | Fig. 9 (a) RhB photocatalytic degradation efficiency and (b) the relative rate constant variation with the addition of BiOBr; (c) degradation efficiency at 8 min with the addition of scavengers. | |
Here, C0 and Ct denote the initial and specific time intervals of the dye concentration, respectively. In Fig. 9a, the effect of BiOBr amount was first optimized for the degradation of RhB. The degradation increases with BiOBr/TiO2 hierarchical heterojunction amount with an efficiency of 98.4% at 8 min of light illumination for the BTNF1.5 sample. The plot shows that the increase in the BiOBr precursor (BTNF2) leads to a decrease in the degradation activity, which can be due to the excess coverage of BiOBr, thereby hindering the charge carrier interaction with TiO2, leading to the recombination centers. This explains better why the fabricated hierarchical structures with BTNF1.5 molar ratio are more appropriate for satisfying the catalytic activity properties. The kinetic study was carried out using the pseudo-first order model without the inclusion of the adsorption stage of the reaction. The degradation rate constant was calculated using eqn (7):
where
kapp represents the apparent degradation rate constant (min
−1).
Except for the BTNF1.5 heterojunction, all other samples show single-stage decay. The linearity of the ln(Ct/C0) vs. t curve for BTNF1.5 in two time stages indicates that the kinetics for the photocatalytic degradation follows a two-stage pseudo first-order rate. This two-stage kinetics comprised an initial rapid degradation stage up to 4 minutes, followed by a comparatively slow degradation stage until 20 minutes. Hence, the two rate constant values for BTNF1.5 are represented as k1app and k2app and are considered to evaluate the kinetic study. Based on the graph from Fig. S9b,† the calculated kapp is presented in Fig. 9b. For the BTNF1.5 sample, the first stage undergoes a rapid decomposition; however, the next stage attains a slow change with time. However, the apparent rate constant value for BTNF2 was found to decrease, which is consistent with the graph trend. Moreover, a detailed comparison of the photocatalytic performance of the reported BiOBr/semiconductors (e.g., TiO2, SnO2, In2O3, etc.) has been summarized in Table S3.† The photocatalytic performance of synthesized BiOBr/TiO2 catalysts in this work is relatively higher than the reported catalysts.
From XPS data analysis, we found that the BTNF1.5 sample has more surface oxygen defects. Oxygen vacancies play a crucial role in three key steps during photocatalytic activity: (i) improving the adsorption of semiconductor photocatalysts, (ii) inhibiting the recombination of electrons and holes, and (iii) capturing photogenerated holes (h+) to form ˙OH radicals. Oxygen vacancies can create an intermediate band between the valence band (VB) and conduction band (CB), promoting surface charge transfer and activating target dye molecules. To determine the photocatalytic mechanism involved, it is essential to identify the presence of predominant active species generated during the RhB dye degradation reaction. Therefore, free radical capture experiments were performed. For this, the performance of the sample was compared to samples containing ethylenediaminetetraacetic acid (EDTA), p-benzoquinone (PBQ), and isopropyl alcohol (IPA) to inhibit the activity of holes (h+), superoxide radical (O2˙−) and hydroxyl radical (˙OH), and the corresponding efficiency is represented in Fig. 9c. It was observed that the breakdown of RhB is slightly impeded by the addition of IPA to the photodegradation reaction system, suggesting a decreased participation of ˙OH active species in the photodegradation process. Nevertheless, the photodegradation efficiency of RhB dramatically drops from 98.4% to 13% at 8 minutes in the presence of EDTA, suggesting that holes are the primary active species in the RhB photodegradation process. Likewise, a clear decrease in photodegradation efficiency from 98.4% to 27% was seen with the addition of the PBQ agent, indicating that the photogenerated O2˙− active species had been captured. Therefore, it can be inferred from the studies that the photogenerated holes and superoxide radicals play a more significant role in degrading the RhB dye.
3.4. Investigations of photocatalytic performance and S-scheme mechanism
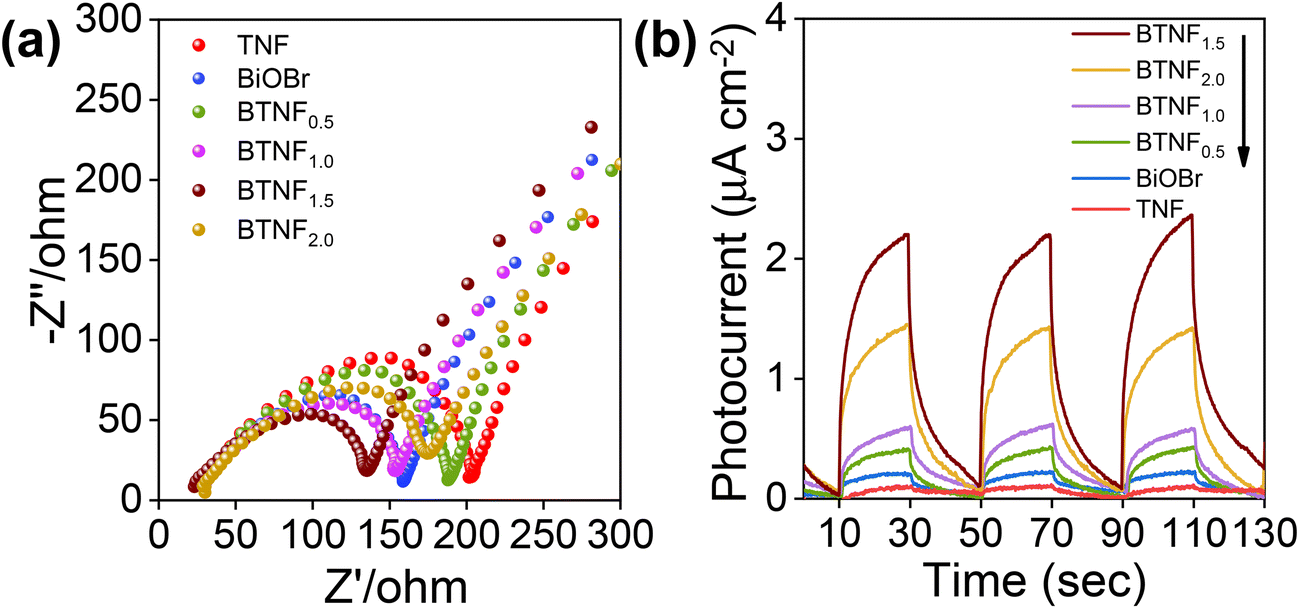
The effect of the improved RhB dye degradation with BTNF1.5 catalysts is due to the involvement of the simultaneous efficient charge carrier generation and separation. To further understand the charge carrier involvement during the photocatalytic reaction and to get a clear idea of the conduction band (CB) and valence band (VB) potential position, the photoelectrochemical analysis was carried out using electrochemical impedance spectroscopy (EIS), photocurrent response study as well as Mott–Schottky measurements. The Nyquist plot shown in Fig. 10a, obtained from the EIS measurements, reveals that all the plots exhibited a semi-circle arc and a linear slope at higher and lower frequency slopes, respectively. This is due to the synchronous effect of both the charge and mass transfer mechanism caused by the polarization potential induced at the electrode–electrolyte interface.64 Moreover, the diameter of the arc represents the charge transfer resistance involved in each electrode. Among the various electrodes used, BTNF1.5 was observed to have a smaller arc diameter, i.e., with low charge carrier transfer resistance owing to more active sites with optimum incorporation of BiOBr, whereas the pristine TiO2 nanofiber exhibited a much higher arc diameter. Fig. 10b represents the photocurrent response, i.e., i–t curves of all the samples obtained by repeated on–off cycles of light illumination. This strongly indicates the efficient charge carrier separation and migration of the samples. Here, the BTNF1.5 hierarchical heterostructure with intense photocurrent response with an average value of 2.25 μA cm−2 was observed compared to the TNF. It was noticed that, with the increased BiOBr molar ratio, the EIS and the photocurrent pattern were suppressed, which further clearly showcases the pivotal contribution of optimization while developing a heterojunction with a conducive interfacial contact. This accords well with the result obtained from photocatalytic activity.
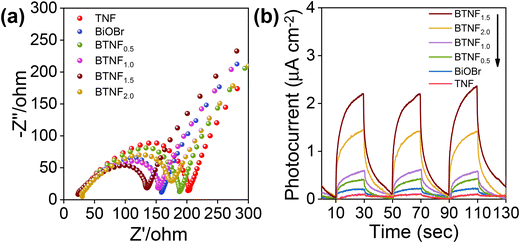 |
| | Fig. 10 (a) EIS Nyquist plot and (b) photocurrent response of pristine TiO2 nanofiber (TNF); BiOBr; and heterojunctions of BTNF0.5, BTNF1.0, BTNF1.5, and BTNF2.0. | |
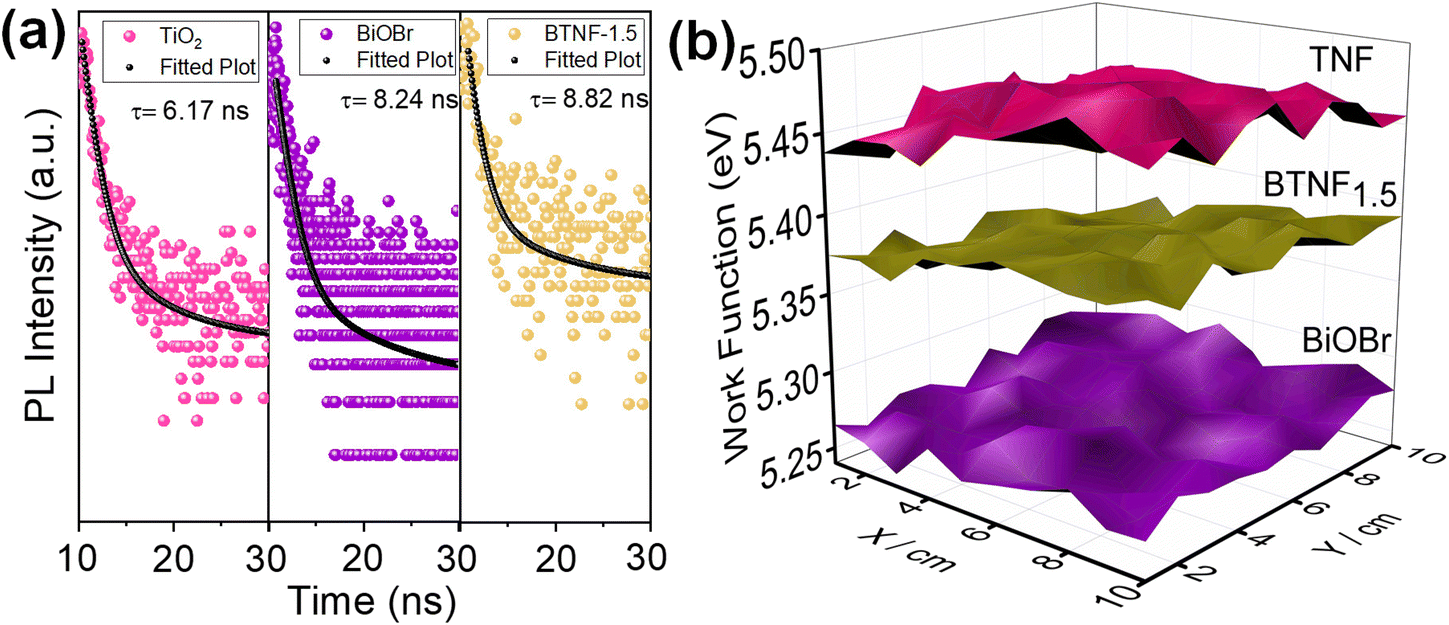
To further clarify the lifetime of the separated photogenerated charge carrier, time-resolved photoluminescence (TRPL) study was carried out with an excitation wavelength of 273 nm, as depicted in Fig. 11a. TRPL spectroscopy is a very efficient approach to analyse the dynamics of the radiative and non-radiative charge carrier amalgamation within the system obtained from the emission spectra of the sample. This is measured using time-correlated single photon counting (TCSPC), which involves the periodic excitation of a pulsed laser. The TRPL decay fitting is done using the bi-exponential decay eqn (8):
| |  | (8) |
 |
| | Fig. 11 (a) TCSPC kinetics and (b) SKP 3D-raster scan plot of TNF, BiOBr and BTNF1.5. | |
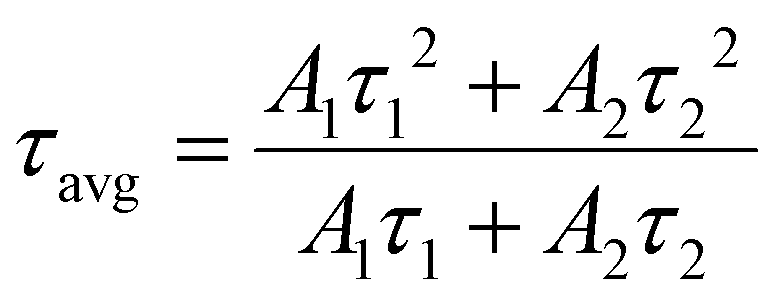
The average lifetime of the sample is summarized by the following eqn (9):
| |  | (9) |
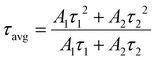
A1 and
A2 represent the amplitudes,
τ1 and
τ2 denote the major fast and minor slow lifetimes of the charge carriers where the former implies the trap-mediated recombination and the latter corresponds to the radiative recombination, and
τavg represents the average decay time. The
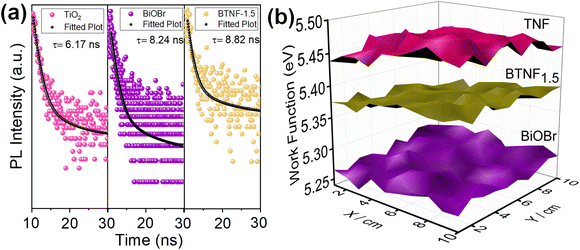
τavg values were estimated from the above-mentioned equations. TiO
2 nanofiber exhibited the lowest average lifetime of 6.17 ns, on which when visible light active material BiOBr was incorporated, the heterojunction sample BTNF
1.5 showed an average lifetime of 8.82 ns. These results clearly reflect the enhancement and the importance of heterojunction formation for the effective separation of electron–hole pairs, which is also a valid proof of the effective RhB dye degradation property of BTNF
1.5.
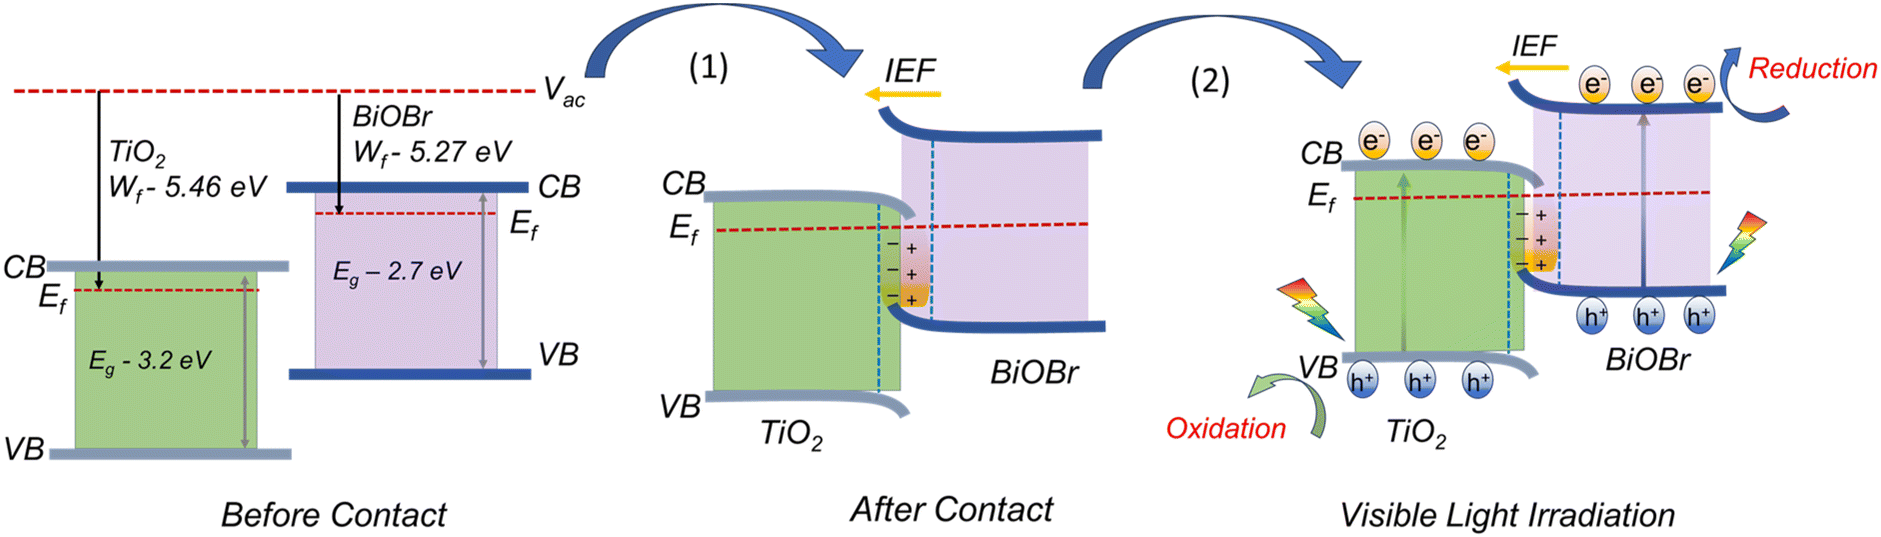
To better understand the charge transfer pathway in the BTNF heterojunction system, scanning Kelvin probe (SKP) measurements were employed to analyse the work function (wf). The operation of SKP involves the formation of a parallel plate capacitor between a perpendicularly vibrating conductive probe and the sample surface approaching its close proximity. A schematic illustration of the SKP setup is represented in Fig. S10.† The setup measures the contact potential difference (CPD) between a gold probe (tip diameter of 2 mm) and the sample surface.65–68 Prior to the actual measurements, the calibration was done with a reference gold sample. The CPD was measured by a 3D raster scan of the sample surface for 1 × 1 mm2 area. All the measurements were carried out at ambient conditions at room temperature (25 °C). The work function (wf) of the pristine and heterojunction material was determined from the CPD values using the following eqn (10):69
| | | Work function (wf) = (5100 − CPDAu + CPDS)/1000 eV | (10) |
CPD
Au and CPD
S denote the contact potential difference of the reference gold surface and the sample, respectively. The standard work function of gold is 5100 meV.
The obtained wf magnitude will give the corresponding value of Fermi energy Ef of the material, which is obtained using the equation:
The wf value of TiO2, BiOBr, and BTNF1.5 was estimated as 5.46 ± 0.02, 5.27 ± 0.01, and 5.37 ± 0.02 eV, respectively. Therefore, the fermi level values corresponding to each are −5.46 eV, −5.27 eV, and −5.37 eV. The 3D raster scan image of wf variation between the materials is represented in Fig. 11b. It evidences the surface homogeneity and surface charge stability of the materials. The obtained results clearly indicate here that, when heterojunction is formed, the electrons acquire the tendency to travel from a higher to lower work function state until the fermi levels of both systems equilibrate. When the fermi levels come closer, the interface formed attains an increase in density with the accumulation of charge carriers. Simultaneously, TiO2 becomes more negatively charged due to the presence of excess electrons, developing a downward band bending. On the other hand, BiOBr possesses an upward shift due to the reduction in electrons and a more positive charge at the interface state. As a result, an internal electric field is induced, directing from a positive to a negatively charged system. Upon light illumination, the charge carriers are generated, and the electrons are ejected from the valence band (VB) to the conduction band (CB) of TiO2 and BiOBr simultaneously. Due to the interface band bending, the electrons at the CB of TiO2 backflow towards the VB of BiOBr due to the coulombic force forming a recombination center. Hence, the electrons at the CB of BiOBr are effectively involved in the reduction process, and the holes at the VB of TiO2 take part in the oxidation reactions.70–72 A schematic illustration connecting the work function, band bending, and charge transfer is illustrated in Scheme 2 with a two-step process.
 |
| | Scheme 2 Illustration of the plausible charge transfer mechanism underlying band-bending leading to an efficient S-scheme mechanism. | |
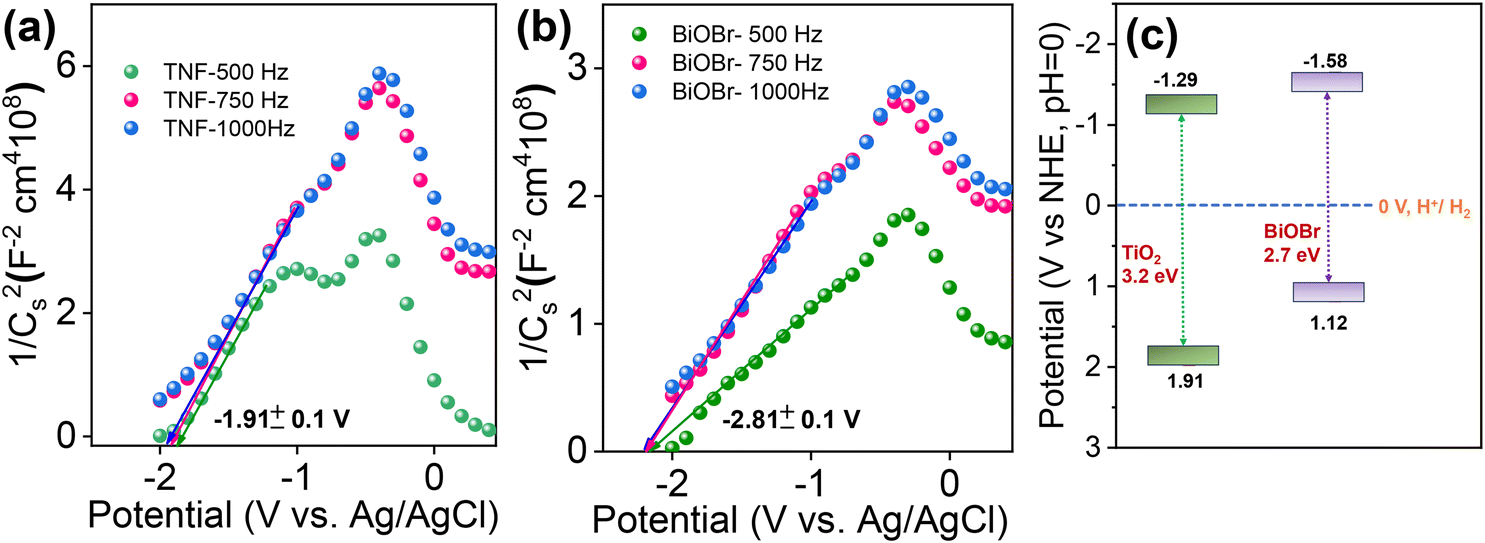
The photocatalytic reaction mechanism plays a vital role in the band structure and position of the chosen material. To further understand, the flat band potential of pure TiO2 and BiOBr was analysed using Mott–Schottky (M–S)73 measurements for selected potentials with three different frequencies of 500, 750, and 1000 Hz and plotted as 1/C2versus potential and is represented in Fig. 12a and b. Due to the lack of movement of charges at the flat band potential, the band bending property is suppressed, and the depletion capacitance at the interface of the electrode and electrolyte formed is estimated via M–S analysis. The M–S plots for BiOBr and TiO2 show a positive slope, indicating both the materials exhibit n-type semiconductor properties and the flat band potentials obtained were −1.91 and −2.18 V (versus RHE; pH = 0), respectively. In general, for n-type semiconductors, the fermi levels are located close to the CB potential; therefore, the flat band value obtained will provide the CB edge position of the corresponding materials. Based on the flat band value, the estimated CBE positions lie at around −1.29 and −1.58 eV, respectively. The schematic of the band structure is combined with the band gap, and CB and VB positions obtained are represented in Fig. 12c. Therefore, herein, we have investigated in detail the charge carrier transport in an n-type heterojunction structure and the reason behind the efficient generation and separation of charge carriers caused due to the effective S-scheme band alignment during illumination in the BiOBr/TiO2 hierarchical heterostructure for the removal of harmful RhB dye.
 |
| | Fig. 12 (a and b) Mott–Schottky plot of TNF and BiOBr samples at different frequencies of 500, 750 and 1000 Hz and (c) proposed band structure of TNF and BiOBr samples using M–S plot analysis. | |
4. Conclusion
A hierarchical nano structure of BiOBr/TiO2 heterojunction photocatalyst has been synthesized via electrospinning and solvothermal methods, and a detailed study of the charge carrier dynamics involved is presented. The TiO2 nanofiber chosen had defect states and oxygen vacancies and is believed to have an added advantage, on which BiOBr was grown with careful optimization. The TRPL data reveals a significant increase in the average lifetime (τavg) of the charge carrier TiO2 nanofiber was observed for the optimum heterostructure sample upon BiOBr growth from 6.17 to 8.82 ns. This resulted in the improved photocatalytic model dye RhB degradation for BTNF1.5 with a rate constant and degradation efficiency of 47.1 min−1 and 98.4%, respectively, at 8 min of visible light illumination. The charge transfer route in the S-scheme pathway, engineering appropriate interface of two materials at the atomic level, induced strong internal electric field, oxygen vacancies in TiO2 and the presence of active sites was found to truly drive the activity of the proposed stable redox heterostructure. This study provides an n–n type heterojunction of BiOBr with mixed phase TiO2 with new insight into the design of S-scheme photocatalysts.
Author contributions
Pooja P. Sarngan: conceptualization, methodology, validation, investigation, data curation, writing – original draft and editing. Sheethal Sasi: methodology, data curation. Prateekshita Mukherjee: data curation, Koushik Mitra: data curation. Yuvaraj Sivalingam: investigation, resources. Anita Swami: resources. Uttam Kumar Ghorai: investigation, resources. Debabrata Sarkar: writing – review & editing, validation, conceptualization, supervision.
Data availability
The authors confirm that the data supporting the findings of this study are available within the article and its ESI.† Raw data that support the findings of this study are available from the corresponding author upon reasonable request.
Conflicts of interest
There are no conflicts of Interest to declare.
Acknowledgements
This work was supported by the Science and Engineering Research Board (SERB), Department of Science and Technology (DST), Government of India, Grant No. CRG/2022/005094. We acknowledge the SRM Institute of Science and Technology for providing HR-SEM, HRTEM, UV-Vis-NIR spectrophotometer, XPS, and micro-Raman facilities. We acknowledge the XRD facility at SRMIST set up with support from MNRE (Project No. 31/03/2014-15/PVSE-R&D), the Government of India.
References
- A. Raza, Y. Habib and S. H. Hashmi, Environ. Sci. Pollut. Res., 2023, 30, 95376–95393 Search PubMed.
- C. Chen, W. Ma and J. Zhao, Chem. Soc. Rev., 2010, 39, 4206–4219 Search PubMed.
- F. Lu and D. Astruc, Coord. Chem. Rev., 2020, 408, 213180 Search PubMed.
- W.-J. Ong and K. P. Y. Shak, Sol. RRL, 2020, 4, 2000132 Search PubMed.
- M. A. Rauf and S. S. Ashraf, Chem. Eng. J., 2009, 151, 10–18 Search PubMed.
- L. Yang, D. Fan, Z. Li, Y. Cheng, X. Yang and T. Zhang, Adv. Sustainable Syst., 2022, 6, 2100477 Search PubMed.
- X. Wang, Z. Wang, Y. Li, J. Wang and G. Zhang, Appl. Catal., B, 2022, 319, 121895 Search PubMed.
- S. Gupta, Y. Kwak, R. P. Raj and P. Selvam, J. Mater. Chem. A, 2024, 12, 6906–6927 Search PubMed.
- M. Islam, S. Kumar, N. Saxena and A. Nafees, ChemistrySelect, 2023, 8(26), e202301048 Search PubMed.
- M. Nemiwal and D. Kumar, Sci. Total Environ., 2021, 767, 144896 Search PubMed.
- Y. Xie, X. Zhang, P. Ma, Z. Wu and L. Piao, Nano Res., 2015, 8, 2092–2101 Search PubMed.
- S. K. Ray, J. Cho and J. Hur, J. Environ. Manage., 2021, 290, 112679 Search PubMed.
- X. Dong, P. Yang, Y. Liu, C. Jia, D. Wang, J. Wang, L. Chen and Q. Che, Ceram. Int., 2016, 42, 518–526 Search PubMed.
- D. S. Kolokolov, A. A. Podurets, V. D. Nikonova, P. N. Vorontsov-Velyaminov, N. P. Bobrysheva, M. G. Osmolowsky, O. M. Osmolovskaya and M. A. Voznesenskiy, Appl. Surf. Sci., 2022, 599, 153943 Search PubMed.
- A. Vijay and S. Vaidya, ACS Appl. Nano Mater., 2021, 4, 3406–3415 Search PubMed.
- D. Sarkar, S. Mukherjee and K. K. Chattopadhyay, Phys. E, 2013, 50, 37–43 Search PubMed.
- Q. Guo, C. Zhou, Z. Ma and X. Yang, Adv. Mater., 2019, 31, 1901997 Search PubMed.
- S. Peiris, H. B. de Silva, K. N. Ranasinghe, S. V. Bandara and I. R. Perera, J. Chin. Chem. Soc., 2021, 68, 738–769 Search PubMed.
- J. P. Jeon, D. H. Kweon, B. J. Jang, M. J. Ju and J. B. Baek, Adv. Sustainable Syst., 2020, 4, 1–19 Search PubMed.
- M.-C. Wu, K.-C. Hsiao, Y.-H. Chang and K. Kordás, ACS Appl. Nano Mater., 2019, 2, 1970–1979 Search PubMed.
- Z. Li, S. Wang, J. Wu and W. Zhou, Renewable Sustainable Energy Rev., 2022, 156, 111980 Search PubMed.
-
J. Khan and L. Han, in Oxygen Vacancy in TiO2: Production Methods and Properties, ed. B. Bejaoui, IntechOpen, Rijeka, 2023, ch. 1 Search PubMed.
- L. Hou, M. Zhang, Z. Guan, Q. Li and J. Yang, Appl. Surf. Sci., 2018, 428, 640–647 Search PubMed.
- R. Li, T. Li and Q. Zhou, Catalysts, 2020, 10, 804 Search PubMed.
- S. Ghosh, G. G. Khan, K. Mandal, A. Samanta and P. M. G. Nambissan, J. Phys. Chem. C, 2013, 117, 8458–8467 Search PubMed.
- D. Sarkar, S. Ishchuk, D. H. Taffa, N. Kaynan, B. A. Berke, T. Bendikov and R. Yerushalmi, J. Phys. Chem. C, 2016, 120, 3853–3862 Search PubMed.
- S. Khanam and S. K. Rout, ACS Omega, 2022, 7, 25466–25475 Search PubMed.
- K. Y. Tang, J. X. Chen, E. D. R. Legaspi, C. Owh, M. Lin, I. S. Y. Tee, D. Kai, X. J. Loh, Z. Li, M. D. Regulacio and E. Ye, Chemosphere, 2021, 265, 129114 Search PubMed.
- J. Jin, W. Song, N. Zhang, L. Li, H. Liu, B. Yang and B. Zhao, RSC Adv., 2020, 10, 26639–26645 Search PubMed.
- A. Amirjani, N. B. Amlashi and Z. S. Ahmadiani, ACS Appl. Nano Mater., 2023, 6, 9085–9123 Search PubMed.
- W. Zhang, H. He, H. Li, L. Duan, L. Zu, Y. Zhai, W. Li, L. Wang, H. Fu and D. Zhao, Adv. Energy Mater., 2021, 11, 2003303 Search PubMed.
- H. Khan and M. U. H. Shah, J. Environ. Chem. Eng., 2023, 11, 111532 Search PubMed.
- R. Daghrir, P. Drogui and D. Robert, Ind. Eng. Chem. Res., 2013, 52, 3581–3599 Search PubMed.
- A. S. Morshedy, E. M. El-Fawal, T. Zaki, A. A. El-Zahhar, M. M. Alghamdi and A. M. A. El Naggar, Inorg. Chem. Commun., 2024, 163, 112307 Search PubMed.
- Y. Yuan, R. Guo, L. Hong, X. Ji, Z. Lin, Z. Li and W. Pan, Mater. Today Energy, 2021, 21, 100829 Search PubMed.
- X. Li, C. Garlisi, Q. Guan, S. Anwer, K. Al-Ali, G. Palmisano and L. Zheng, Mater. Today, 2021, 47, 75–107 Search PubMed.
- Y. Liu, Y. Zhou, S. Yu, Z. Xie, Y. Chen, K. Zheng, S. Mossin, W. Lin, J. Meng, T. Pullerits and K. Zheng, ACS Appl. Nano Mater., 2020, 3, 772–781 Search PubMed.
- D. Sarkar, C. K. Ghosh, S. Mukherjee and K. K. Chattopadhyay, ACS Appl. Mater. Interfaces, 2013, 5, 331–337 Search PubMed.
- Y. Wang, N. Lu, M. Luo, L. Fan, K. Zhao, J. Qu, J. Guan and X. Yuan, Appl. Surf. Sci., 2019, 463, 234–243 Search PubMed.
- W. Z. Xiao, L. Xu, Q. Y. Rong, X. Y. Dai, C. P. Cheng and L. L. Wang, Appl. Surf. Sci., 2020, 504, 1–7 Search PubMed.
- C. Jin, S. Rao, J. Xie, Z. Sun, J. Gao, Y. Li, B. Li, S. Liu, L. Liu, Q. Liu and J. Yang, Chem. Eng. J., 2022, 447, 137369 Search PubMed.
- W. Liu, Y. Wang, K. Qi, F. Wen and J. Wang, Langmuir, 2022, 38, 4839–4847 Search PubMed.
- Q. Xu, L. Zhang, B. Cheng, J. Fan and J. Yu, Chem, 2020, 6, 1543–1559 Search PubMed.
- F. Xu, K. Meng, B. Cheng, S. Wang, J. Xu and J. Yu, Nat. Commun., 2020, 11, 1–9 Search PubMed.
- Z. Wang, Y. Chen, L. Zhang, B. Cheng, J. Yu and J. Fan, J. Mater. Sci. Technol., 2020, 56, 143–150 Search PubMed.
- G. Q. Zhao, J. Hu, J. Zou, X. Long and F. P. Jiao, J. Environ. Chem. Eng., 2022, 10, 107226 Search PubMed.
- J. Meng, Y. Duan, S. Jing, J. Ma, K. Wang, K. Zhou, C. Ban, Y. Wang, B. Hu, D. Yu, L. Gan and X. Zhou, Nano Energy, 2022, 92, 106671 Search PubMed.
- M. M. Rana, K. M. Alam, N. Chaulagain, J. Garcia, N. Kumar, D. Vrushabendrakumar, H. Rajashekhar, G. M. Bernard, A. Meldrum, V. K. Michaelis and K. Shankar, ACS Appl. Nano Mater., 2024, 7, 6005–6019 Search PubMed.
- X. Cheng, X. Xiao, F. Wang, T. Lu and Y. Zhang, ACS Appl. Nano Mater., 2024, 7, 4413–4422 Search PubMed.
- Q. Chi, G. Zhu, D. Jia, W. Ye, Y. Wang, J. Wang, T. Tao, F. Xu, G. Jia, W. Li and P. Gao, Nanoscale, 2021, 13, 4496–4504 Search PubMed.
- P. P. Sarngan, A. Lakshmanan, A. Dutta and D. Sarkar, Colloids Surf., A, 2022, 654, 130182 Search PubMed.
- R. Bekkari, B. Jaber and L. Laânab, J. Mater. Sci.: Mater. Electron., 2022, 33, 12126–12136 Search PubMed.
- P. P. Sarngan, A. Lakshmanan and D. Sarkar, Chemosphere, 2022, 286, 131692 Search PubMed.
- D. K. Muthee and B. F. Dejene, Heliyon, 2021, 7, e07269 Search PubMed.
- K. Wang, Y. Zhang, L. Liu, N. Lu and Z. Zhang, J. Mater. Sci., 2019, 54, 8426–8435 Search PubMed.
- T. Y. Lee, C. Y. Lee and H. T. Chiu, ACS Omega, 2018, 3, 10225–10232 Search PubMed.
- S. Juntrapirom, D. Tantraviwat, O. Thongsook, S. Anuchai, S. Pornsuwan, D. Channei and B. Inceesungvorn, Appl. Surf. Sci., 2021, 545, 149015 Search PubMed.
- R. Ahmed, Y. Xu, M. G. Sales, Q. Lin, S. McDonnell and G. Zangari, J. Phys. Chem. C, 2018, 122, 12052–12060 Search PubMed.
- C. T. Haile, K. H. Ng, C. W. Chiu, N. Ahmad and C. F. J. Kuo, Mater. Today Phys., 2024, 42, 101352 Search PubMed.
- J. Yu, Y. Su, B. Cheng and M. Zhou, J. Mol. Catal. A: Chem., 2006, 258, 104–112 Search PubMed.
-
M. A. Oliva, J. Ortiz-bustos, M. Cruz-yusta, F. Martin and I. Hierro.
- Y. Nosaka and A. Y. Nosaka, J. Phys. Chem. Lett., 2016, 7, 431–434 Search PubMed.
- X. X. Wei, H. Cui, S. Guo, L. Zhao and W. Li, J. Hazard. Mater., 2013, 263, 650–658 Search PubMed.
- A. M. Demeku, D. M. Kabtamu, G.-C. Chen, Y.-T. Ou, Z.-J. Huang, T.-C. Chiang, H.-C. Huang and C.-H. Wang, ACS Appl. Mater. Interfaces, 2024, 16, 7047–7056 Search PubMed.
- D. Chidambaram, R. Kalidoss, K. Pushparaj, V. Jayaraman Surya and Y. Sivalingam, Mater. Sci. Eng., B, 2022, 280, 115694 Search PubMed.
- G. Marappan, A. K. Mia, K. Puspharaj, S. Vaidyanathan, Y. Kawazoe, Y. Sivalingam and V. J. Surya, Surf. Interfaces, 2024, 44, 103648 Search PubMed.
- R. S. Ghuge, M. D. Shinde, V. Hajeesh Kumar, S. S. Arbuj, V. J. Surya, S. B. Rane, C. Di Natale and Y. Sivalingam, Mater. Adv., 2023, 4, 6396–6406 Search PubMed.
- G. P. Kuppuswamy, M. S. S. Matada, G. Marappan, R. Manoharan, S. N. Megha, K. S. R. N. Mangalampalli, S. V. Jayaraman and Y. Sivalingam, Surf. Interfaces, 2023, 43, 103554 Search PubMed.
- H. K. Vikraman, J. George, R. P. Reji, G. P. Kuppuswamy, S. D. Sutar, A. Swami, S. Ramamoorthy, A. Sundaramurthy, S. Pramanik, S. Velappa Jayaraman, S. Perumal, Y. Sivalingam and S. R. N. K. Mangalampalli, Small, 2024, 20, 2305126 Search PubMed.
- L. Wang, B. Cheng, L. Zhang and J. Yu, Small, 2021, 17, 2103447 Search PubMed.
- H. Deng, X. Fei, Y. Yang, J. Fan, J. Yu, B. Cheng and L. Zhang, Chem. Eng. J., 2021, 409, 127377 Search PubMed.
- F. He, B. Zhu, B. Cheng, J. Yu, W. Ho and W. Macyk, Appl. Catal., B, 2020, 272, 119006 Search PubMed.
- B. Li, W. Peng, J. Zhang, J. C. Lian, T. Huang, N. Cheng, Z. Luo, W. Q. Huang, W. Hu, A. Pan, L. Jiang and G. F. Huang, Adv. Funct. Mater., 2021, 31, 1–12 Search PubMed.
|
| This journal is © The Royal Society of Chemistry 2024 |
Click here to see how this site uses Cookies. View our privacy policy here. 
 be,
Anita
Swami
be,
Anita
Swami