 Open Access Article
Optical dark-field spectroscopy of single plasmonic nanoparticles for molecular biosciences
Lucía
Labrador-Páez
*,
Alfredo
Casasnovas-Melián
,
Elena
Junquera
 ,
Andrés
Guerrero-Martínez
 and
Rubén
Ahijado-Guzmán
 *
*
Departamento de Química Física, Facultad de Ciencias Químicas, Universidad Complutense de Madrid, Avda Complutense s/n, 28040 Madrid, Spain. E-mail: lulabrad@ucm.es; ahijado@quim.ucm.es
First published on 26th September 2024
Abstract
An ideal sensor capable of quantifying analytes in minuscule sample volumes represents a significant technological advancement. Plasmonic nanoparticles integrated with optical dark-field spectroscopy have reached this capability, demonstrating versatility and expanding applicability across in vitro and in vivo subjects. This review underscores the applicability of optical dark-field spectroscopy with single plasmonic nanoparticles to elucidate a wide range of biomolecular characteristics, including binding constants, molecular dynamics, distances, and forces, as well as recording cell communication signals. Perspectives highlight the potential for the development of implantable nanosensors for metabolite detection in animal models, illustrating the technique's efficacy without the need for labeling molecules. In summary, this review aims to consolidate knowledge of this adaptable and robust technique for decoding molecular biological phenomena within the nano- and bio-scientific community.
Introduction
Interconnected networks of macromolecular interactions continuously occur in the complex cellular environment, enabling life. Biomolecular networking can be compared, in many aspects, to a society, where each molecule has a role and interacts with others to maintain cellular function.1 To understand and potentially influence these networks for biological and/or clinical purposes, scientists must explore the physicochemical properties of biomolecules and their interactions. Researchers often isolate biomolecules to study their individual properties or their interactions in controlled environments, simplifying the complex dynamics of the cellular media.2 There are numerous biochemical and biophysical techniques to measure these properties and interactions, but most rely on labelling molecules with tags to facilitate measurement or visualization, thereby providing indirect yet detailed insights into the molecular mechanisms at play. For this reason, the search for techniques that directly determine these biomolecular properties without the need for specific molecular labels has been a major field of study.3In the quest to discover new, more versatile techniques, the integration of spectroscopies and microscopies with plasmonic nanoparticles has revolutionized the field. Plasmon resonance, specifically localized surface plasmon resonance, refers to the collective oscillation of free electrons in noble metal nanoparticles induced by interaction with light. The resonance energy depends on the characteristics of nanoparticles and their surrounding environment, making plasmonic nanoparticles powerful sensing elements.4,5 Due to their small and tuneable size, they can monitor nanoscale events with stable optical signals and high scattering efficiency, providing a method free from bleaching and blinking.
Advances in optics and spectroscopy have enabled the precise measurement of the scattering spectra of single plasmonic nanoparticles, facilitating their use as sensors not only in biology but also in fields such as chemistry, physics, and materials science.6–11 Concurrently, nanoparticle synthesis and functionalization strategies have been nearly perfected.12,13 Combining advanced optical dark-field spectroscopy with surface functionalization has allowed precise studies of biomolecules and their interactions. These advancements suggest that single plasmonic nanoparticle optical dark-field spectroscopy may soon become a common technique in bioscience and clinical laboratories.
This review provides a comprehensive introduction to the methodology of dark-field spectroscopy, emphasizing the benefits and surface functionalization methodologies of plasmonic nanoparticles (see section “Experimental methods and theory”). In this regard, gold nanorods are often selected as the single-nanoparticle sensors due to their superior stability, high sensitivity, low polydispersity, adjustable plasmon resonance wavelength, minimal plasmon damping, and high scattering efficiency compared to other shapes and compositions.14 Consequently, this review primarily emphasizes the use of gold nanorods as plasmonic sensors in optical dark-field spectroscopy for molecular biosciences, although other nanoparticle shapes, such as nanospheres, are also analysed.
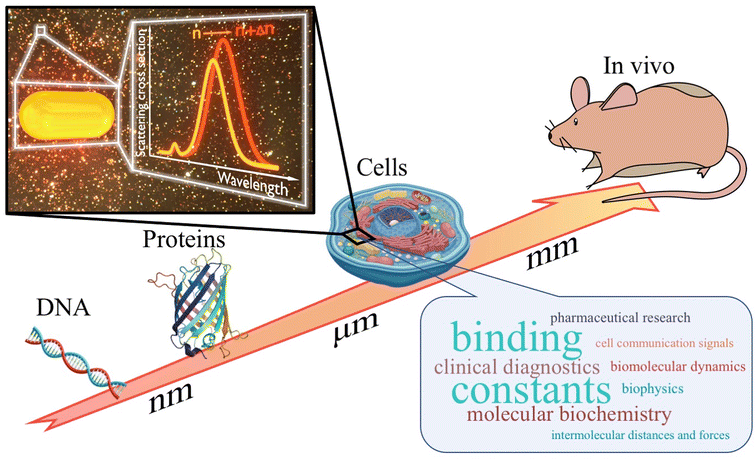
Following this, we will review significant studies utilizing plasmonic nanoparticles as biosensors using dark-field microscopy. These studies are categorized into four main sections based on the complexity of the systems under investigation (Fig. 1): DNA characterization, detection, and application as biosensor (see section “DNA interaction and detection”); exploration of protein interactions (see section “Protein interaction detection”); analysis of complex systems combining biomolecules (see section “Protein–lipid interactions”); and innovations in in vitro applications (see section “Biomolecular interactions in cellular environments”). Lastly, we will offer conclusions and our perspective on the future directions of this rapidly evolving field (see section “Conclusions and perspectives”).
Experimental methods and theory
Dark-field microscopy technique
The measurement principle relies on accurately detecting the light scattered by plasmonic nanoparticles. The plasmon resonance energy of these nanoparticles is remarkably sensitive to their surroundings, resulting in subtle shifts in spectral position and intensity. For a single plasmonic nanoparticle, these shifts occur due to physicochemical phenomena that happen within a few nanometres of the nanoparticle's surface, causing variations in the refractive index within that sensitive volume.4,5 Several techniques are available to monitor the scattering spectra of individual nanoparticles, with optical dark-field spectroscopy (including total internal reflection) being the most widely adopted and the primary focus of this review.6,15Dark-field microscopy captures scattered light from individual nanoparticles by either blocking, reflecting, or refracting incident light.6 Total internal reflection dark-field spectroscopy notably achieved the first measurements of single plasmonic nanoparticle scattering spectra in the year 2000. Since then, microscope configurations have advanced significantly to enable precise, high-resolution, and rapid acquisition of nanoparticle scattering spectra. These advancements incorporate sophisticated illumination techniques, sensitive detection methods, and precise wavelength scanning capabilities, enhancing the possibilities to study nanoparticle interactions with unprecedented detail and accuracy.6
In the literature, there are several methods for recording the complete scattering spectra of a large number of plasmonic nanoparticles. However, currently, two methods are receiving significant attention in biosciences applications. The first method involves recording the scattering spectra of nanoparticles ‘one-by-one’ within the microscope's field of view. The second method, known as ‘hyperspectral imaging’ or the ‘wavelength-scanning method’, captures the entire field of view at various wavelengths, allowing to reconstruct the scattering spectrum of each nanoparticle. Despite this, for basic biomolecular applications, obtaining the complete scattering spectrum is not strictly required. Therefore, the measurement setup can be simplified to record the scattering intensity at a single, appropriate wavelength, which increases data acquisition speed.16–18 Therefore, implementing this technique requires a straightforward basic configuration (Fig. 2), and most laboratories can access necessary hardware components such as an optical microscope, camera, and monochromatic LED light for illumination. This advantage enables the easy construction of this equipment and the widespread adoption of this versatile technique in laboratories focused on molecular biosciences.
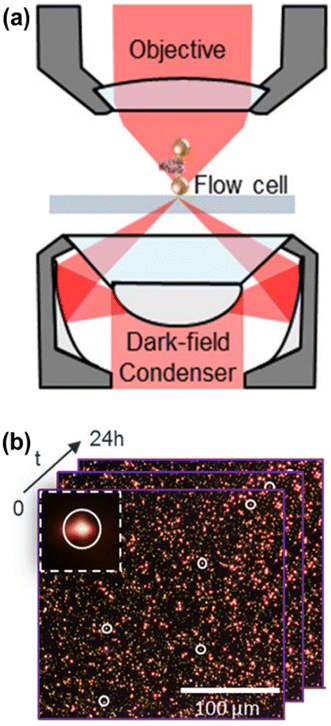 | ||
| Fig. 2 (a) Basic components of a dark-field microscope. The dark field condenser modulates the incident radiation (red) and focuses it in the sample holder (gray) to interact with the plasmonic nanoparticles (a plasmon ruler system in this illustration). The radiation scattered by the nanoparticles is collected by an objective lens and detected by some camera. (b) The light scattered by hundreds of individual deposited nanoparticles can be detected with high contrast and be monitored over long times by acquiring sequences of images. The inset shows the zoom of one of the scattering signals detected in the image. Reproduced with permission from ref. 19. Copyright 2019 American Chemical Society. | ||
Integration of dark-field microscopy with plasmonic nanosensors can compete with established bioscience techniques such as surface plasmon resonance biosensors, quartz crystal microbalance, thermophoresis, fluorescence microscopy, fluorescence correlation spectroscopy, fluorescence resonance energy transfer, and analytical ultracentrifugation.18–21 Plasmonic nanoparticles produce stable optical signals without requiring fluorescent labelling, although this methodology can be employed for control or combined detection methods. Moreover, experiments typically involve measurement of tens or hundreds of nanoparticles, enhancing statistical robustness compared to alternative methods. The compatibility of nanoparticles with molecular dimensions enables observation of single nanoscale events. Additionally, multiplexing experiments are feasible by modifying nanoparticle receptors to target specific molecules or adjusting the nanosensor characteristics to investigate physical properties such as distances, curvature, or molecular mechanisms in detail.22–24
Single nanoparticle sensor theory
Plasmonic nanosensors respond to local changes in their surrounding dielectric environment by shifting their resonance wavelength λres. As discussed in this review, these shifts can be quantified by measuring the scattering spectra of the nanoparticles used as sensors. The plasmon response of a nanoparticle denoted as Δλres, induced by a molecular layer with thickness l, can be approximated by:22| Δλres = SλΔn(1 − e−l/ds) | (1) |
Here, Sλ represents the resonance wavelength refractive index sensitivity, Δn denotes the change in refractive index within the nanoparticle environment, and ds is the sensing distance, which is directly related to the decay length of the plasmonic electric field. While the bulk refractive index sensitivity Sλ does not account for the dependency of sensitivity on distance from the nanoparticle surface, it serves as a useful approximation for comparing nanoparticles with similar ds. Therefore, based on this equation, the plasmon surface sensitivity to adsorbate layers, Şλ, can be defined as:16
 | (2) |
As described, plasmon resonance shifts are a more robust parameter for addressing experimental issues compared to changes in single-wavelength scattering intensity. However, single-wavelength detection schemes are gaining attention due to their simplicity and rapid data acquisition. For these single-wavelength intensity-based detection schemes, similar definitions can be applied to define the intensity surface sensitivity at a single wavelength, ŞI.
 | (3) |
In the last equation, SI, the intensity bulk sensitivity at a single wavelength, depends on the imaginary part of the particle's dielectric permittivity ε2, the refractive index n, and the plasmon resonance linewidth Γ, according to:16
 | (4) |
Therefore, the final expression accounts for four contributions from the plasmon shift, dielectric constant, Rayleigh scattering, and frequency-dependent plasmon damping, respectively, determining the sensitivity of the plasmonic nanosensor.
Plasmonic nanosensors
Nanoparticles function as sensing elements, with plasmonic nanoparticles showing promise as ideal sensors for these applications owing to their optimal combination of properties.12 We discussed these features according to their preparation methods, their surface chemistry and their optical effects.The composition and geometry of plasmonic nanoparticles determine their optical properties and sensor performance. In terms of composition, various combinations have been explored, most commonly involving gold and silver. Regarding nanoparticle geometry, the most frequently used shapes for gold and silver nanoparticles include spheres, nanoplates, bipyramids, cubes, nanorods, and combinations of these. However, for biosensing applications, gold nanorods are often preferred as single-nanoparticle sensors due to their optimal stability, high sensitivity, low polydispersity, tunable plasmon resonance wavelength, low plasmon damping, and high scattering efficiency.14,26–32 Therefore, this review primarily focuses on the use of gold nanorods as plasmonic sensors in optical dark-field spectroscopy for molecular biosciences.
Nanoparticle functionalization
Regarding nanoparticle functionalization, the approach depends on the specific system under investigation and the desired properties to be assessed. When nanoparticles are intended for in vitro use, the primary concerns are ensuring their colloidal stability and preventing non-specific interactions with other molecules involved in the study. For in vivo studies, greater caution is necessary due to potential toxicity and interactions with the immune system.3,13,36,37In general, a primary coating is essential to stabilize nanoparticles in physiological media, which often contain varying amounts of salts. The most common strategies for stabilization involve replacing the initial capping agent (such as CTAB, CTAC, citrate, etc.) with covalently attached polyethylene glycol or small DNA chains, such as those composed of thymidine molecules. Additionally, coatings with silica and other polymers are frequently employed to reduce non-specific interactions in complex environments and maintain colloidal stability in both in vitro and in vivo settings.13
For outer functionalization involving the receptor molecule in the sensor scheme, the choice depends on the biological system targeted and may include His-tagged molecules, antibodies, carbohydrates, peptides, small DNA aptamers, or other mutants of interest. Another advantage of using nanoparticles in solution over bulk methods is the option to coat sensors with a lipid membrane, thereby increasing complexity and better mimicking real molecular conditions.42 In many cases, the nanoparticle functionalization aligns with the molecular system under investigation, while in others, the biomolecule used for functionalization serves as a linker for other molecular receptors.
DNA interaction and detection
Nucleic acids such as DNA or RNA are molecules that store information necessary for synthesizing other biomacromolecules.43 This information is encoded in a specific language, highly suitable for use as a recognition code for other nucleic acids and macromolecules like proteins. Therefore, plasmonic nanoparticles functionalized with single or double-stranded DNA molecules are extremely versatile as recognition elements for ligand molecules, especially in conjunction with optical dark-field spectroscopy.44 Research in this field explores dynamics, the hairpin effect, and mechanical properties of DNA, while other investigations focus on developing biosensing methods for detecting targets such as DNA, microRNA, proteins, and other biomolecules.One of the earliest notable applications of DNA molecules led to the development of the plasmon ruler (see subsection “Plasmonic nanosensors”), typically involving a pair of either Au or Ag nanoparticles. When two plasmonic nanoparticles are sufficiently close, their plasmons interact depending on the distance between the nanoparticles. Thus, the DNA plasmon ruler consists of two nanoparticles bound by a single DNA molecule, enabling real-time qualitative study of single DNA hybridization kinetics. Changes in DNA length directly affect the interparticle distance, resulting in observable plasmonic coupling seen in general as a red-shift in scattering spectra.38,45 By monitoring scattering intensity at specific wavelengths, plasmon rulers have also been used to analyse DNA dynamics. For example, it is feasible to investigate conformational changes of two-state open and closed (hairpin) single-stranded DNA (Fig. 3a) tethering two plasmonic nanoparticles. Hairpin formation in the single-stranded DNA reduces the interparticle distance, enhancing their plasmonic coupling (Fig. 3b).38 The DNA hairpin effect on plasmonic coupling can similarly be observed using a gold nanoparticle and a gold nanofilm in the plasmon ruler setup, also referred to as “particle on a mirror”.41,46
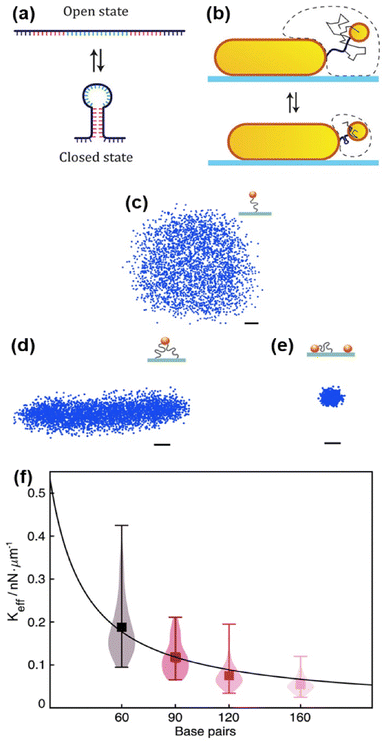 | ||
| Fig. 3 DNA dynamics. (a) Single-stranded DNA molecule in the open state with a sequence capable of reversibly forming a DNA hairpin structure (closed state). (b) The movement of the gold nanosphere (thin black line), tethered to another plasmonic nanoparticle, becomes more confined (the dashed line indicates the region where the tethered gold nanosphere can move) as the DNA (thick black line) forms a hairpin (shown below), reducing the average interparticle distance and resulting in stronger plasmonic coupling. Reproduced with permission from ref. 40. Copyright 2018 American Chemical Society. (c) Radially symmetric scatter plot of a freely mobile single-tethered gold nanoparticle. (d) Elongated scatter plot of a multi-tethered gold nanoparticle with limited mobility. (e) Scatter plot of an immobile particle. 6 μs exposure time over 19 s for a selected particle. 3800 points acquired. Scale bars: 10 nm. (f) Measurement of DNA effective spring constants by thermal fluctuations of a gold nanorods as a function of the length of DNA tethers (1 base pair equals 0.34 nm). Adapted with permission from ref. 46. Copyright 2021 Royal Society of Chemistry. | ||
Optical dark-field spectroscopy is a potent method for studying the mechanical properties of DNA molecules by monitoring the light scattered from individual plasmonic nanoparticles. To track nanoparticles with high speed and precision, the authors employed pulsed illumination synchronized with the camera, achieving high performance with a time resolution of just a few microseconds. For example, observing the constrained Brownian motion of a gold nanoparticle tethered by double-stranded DNA to a non-plasmonic film or substrate allows assessment of DNA persistence length and electrophoretic force.46,47 For instance, DNA tethered to gold nanoparticles observed using total internal reflection dark-field microscopy geometry (see subsection “Dark-field microscopy technique”) serves as molecular force sensors and charge detectors. Nanoparticle movement depends on the number of double-stranded DNA tethers and the colloidal character of the nanoparticle (Fig. 3c–e). This method enables identification of gold nanoparticles tethered by a single DNA molecule, excluding artefacts in data due to miss- or over-functionalization of gold nanoparticles. Continuing exploration of mechanical properties of single molecules, this technique determines the spring constant of single DNA molecules from thermal fluctuations. Interestingly, experiments show the spring constant depends on the number of DNA base pairs studied.48 Results in Fig. 3f demonstrate that longer DNA results in a lower spring constant. Authors also found charge depends on the spring constant. Applying alternating potential across the sample characterizes DNA tether charge properties to sub-piconewton scale forces. This observes charge variation effects on gold nanoparticle surfaces from pH or functionalization changes by electrophoretic force, tracking charged gold nanoparticles tethered by DNA interacting with applied electric fields.46 Additionally, DNA molecules bound to nanoparticles can be enzymatically modified or broken. Using the plasmon ruler concept, these systems monitor enzymatic activity.49
Despite the vast potential of plasmon rulers for single molecule characterization, optical dark-field spectroscopy of DNA-functionalized nanoparticles has primarily been utilized for detection and quantification. Some studies focus on plasmonic coupling via aggregation of multiple gold nanoparticles into clusters upon detecting target sequences, leading to colorimetric changes in scattering images.50 For instance, two hairpin DNA molecules with complementary segments can bind non-covalently to gold nanoparticle surfaces, preventing their clustering without additional functionalization. Target DNA presence causes these sequences to form double-stranded DNA, triggering nanoparticle aggregation upon salt addition. Target DNA concentration is quantified by plasmon coupling in clusters, resulting in significant increases in scattering intensity. Moreover, this technique exhibits high selectivity against random DNA sequences.51 In another example, a dual-mode plasmonic biosensor quantitatively detects microRNA through gold nanoparticle aggregation with two different surface functionalizations via catalytic hairpin assembly (Fig. 4a). This process induces colorimetric changes and enables surface-enhanced Raman scattering (SERS) imaging of a fluorescent dye (6-carboxyl-Xrhodamine) attached to one of the types of gold nanoparticle.52
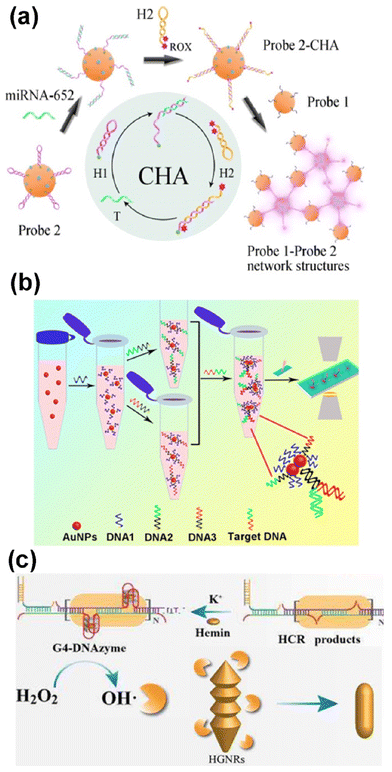 | ||
| Fig. 4 DNA/microRNA detection. (a) Schematic diagram of a dual-mode plasmonic and SERS biosensor (pink glow) based on catalytic hairpin assembly inducing a gold nanoparticle network for the detection of miRNA-652. (ROX: 6-carboxyl-Xrhodamine). Reprinted from ref. 52, with permission from Elsevier. (b) Schematic illustration of nucleic acid detection based on enumeration of gold nanoparticle dimers by dark-field microscopy. Reprinted with permission from ref. 53. Copyright 2017 American Chemical Society (c) scheme of the detection strategy for hepatitis B virus DNA (HBV-DNA) based on surface etching of helical gold nanorods (HGNRs), imaged by DFM (HCR: hybridization chain reaction). Adapted from ref. 34, with permission from Elsevier. | ||
Detection of analytes using either a single gold nanoparticle or plasmonic coupling of nanoparticle dimers via optical dark-field spectroscopy is less susceptible to artefacts and more sensitive compared to methods relying on the aggregation of multiple nanoparticles. Fig. 4b outlines a method where gold nanoparticles are functionalized with distinct DNA sequences complementary to different regions of the target DNA, ensuring high selectivity against other DNA sequences. Thus, the presence of a target DNA molecule leads to Y-shaped binding to two differently functionalized nanoparticles, inducing plasmonic coupling as a dimer and subsequent colorimetric changes.53
Detection of DNA or microRNA can also be achieved by monitoring the scattering of single nanoparticles. However, methodologies for DNA/RNA detection via light scattering by single plasmonic nanoparticles require complex nanoparticle morphologies. For example, using gold nanotriangles enables the detection of DNA hybridization. Monitoring the scattering spectra of single gold nanotriangles allows the detection of target DNA with three times the sensitivity compared to single gold nanospheres of similar sizes.54 In another approach, the complex procedure illustrated in Fig. 4c has been employed to quantitatively detect hepatitis B virus DNA using single helical gold nanorods. In the presence of the target DNA, hairpin DNA molecules unfold to form hybridization chain reaction products. This cascade of molecular events releases hydroxyl groups into the medium, triggering surface etching of the nanoparticle. This change in nanoparticle surface alters its optical properties, enabling indirect monitoring of the DNA by dark-field microscopy. This method is more sensitive than simple detection using functionalized nanoparticles and exhibits selectivity among other viruses’ DNAs.34
Multiplexed analyte detection by using DNA-functionalized nanoparticles by optical dark-field spectroscopy can also be used to detect other biomolecules apart from DNA. For instance, a multiplexed plasmonic biosensor may consist of multiple dispersions of different groups of gold nanorods functionalized with different aptamers. By sequential random deposition of the different groups of aptamer-functionalized nanoparticles, a position-encoded sensor can be built for the detection of multiple proteins such as streptavidin, protease trypsin, and thrombin.24 Thrombin protein can also be quantitatively detected by a more advanced colorimetric procedure if the protein is able to join to two aptamer-functionalized nanoparticles, which plasmon resonance will red-shift due to their coupling. In this case, the reaction and incubation times and DNA concentration must be optimised to achieve a biosensor of low detection limit. This makes this approach able to sense in human serum and with high selectivity against different proteins.55
DNA functionalization of gold nanoparticles is also applicable for detecting and quantifying metabolites or drugs. For example, detecting ATP as a cell's energy source is crucial. In this study, a system was developed where two gold nanoparticles may form a dimer upon ATP release from cells. This method can observe ATP-rich areas near or inside the cell.56,57 In another application, a gold nanoparticle can be tethered to a gold nanofilm using an endotoxin-specific single-stranded DNA aptamer. Upon binding to the analyte, this aptamer bends, enhancing plasmonic coupling. Such biosensors are highly selective, even in complex samples or with other biomolecules present.58 Another drug detection method tracks changes in scattering intensity.59 The DNA aptamer on the gold nanoparticle surface bends due to binding of the drug molecule (kanamycin). This bending brings the ligand and receptor closer to the nanoparticle surface, causing a spectral shift. This intensity enhancement is highly sensitive for monitoring binding kinetics (Fig. 5a).60 Once the ligand and receptor reach equilibrium near the nanoparticle surface, fluctuations in equilibrium coverage can be monitored to derive the power spectrum (Fig. 5b). This allows estimation of equilibrium dissociation constants by analysing data in the frequency domain and determining the corner frequency of the resulting power spectral density (Fig. 5c).60
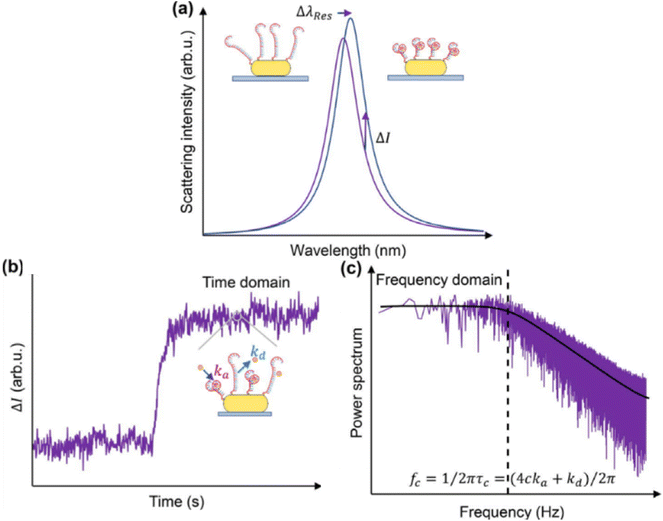 | ||
| Fig. 5 Estimation of equilibrium dissociation constants. (a) Binding of molecules to their aptamers on a plasmonic gold nanorod surface (insets) leads to aptamer contraction and local refractive index increment, resulting in wavelength red-shift (Δλres) and intensity enhancement (ΔI) in scattered light from the gold nanorod. (b) Single-color TIR-DFM records ΔI, depicting a typical Langmuir adsorption curve over time upon analyte detection. Equilibrium fluctuation in the gold nanorod strength reflects association and dissociation rates (ka and kd, respectively) between molecules and aptamers. (c) Analysis of intensity equilibrium fluctuation signals in the frequency domain estimates rate constants via characteristic frequency (fc) at specific molecular concentrations. Reprinted from ref. 60, with the permission of AIP Publishing. | ||
The strategies involving DNA-functionalized plasmonic nanoparticles outlined in this section demonstrate the broad applicability of this technique. Later (see section “Biomolecular interactions in cellular environments”), additional examples of using DNA-functionalized plasmonic nanoparticles for in vitro biosensing by optical dark-field spectroscopy are described. Furthermore, DNA can serve as an initial step in the complex surface functionalization of nanoparticles, enabling their combination with proteins or other more intricate systems for biosensing by optical dark-field spectroscopy (see sections “Protein–lipid interactions” and “Biomolecular interactions in cellular environments”).
Protein interaction detection
Many essential cell functions are directly performed or regulated by protein complexes, acting as crucial molecular machines for cellular processes, often dependent on their structure and dynamics. Protein interactions can be likened to those of a society, where their tasks vary depending on structural conformation, environment, or interaction partners.1 Due to their significant regulatory roles across various cellular aspects, their study holds clinical, pharmaceutical, and biological importance.2 Thus, this section introduces examples where optical dark-field spectroscopy and plasmonic nanoparticles have been integrated to recognize or quantify protein interactions for biological, physical, chemical, and clinical purposes.The initial proof-of-concept experiments demonstrate that monitoring the scattered light of single gold nanoparticles allows for tracking the interaction between the biotin and streptavidin proteins. Initially, gold nanospheres are functionalized with biotin and then immobilized, followed by the addition of varying amounts of streptavidin. Observing the scattered light from these individual nanoparticles reveals that the plasmon resonance position shifted proportionally to the concentration of the ligand (streptavidin).61
Typical techniques for studying macromolecular interaction kinetics integrate data from numerous events over extended periods, thereby masking nanoscale events. In contrast, monitoring the plasmon resonance position or scattering intensity of single plasmonic nanoparticles show that individual molecule interactions can be directly observed.18,25 This capability opens avenues for studying the dynamic heterogeneity of single biomolecular interactions and equilibrium coverage fluctuations, as depicted in the illustrations of different stages of the process in Fig. 6a–e. Another distinct advantage over other single-molecule techniques is the lack of labelling with fluorescent dyes in plasmonic light scattering. Using nanoparticles as sensors enables the recording of molecular events over extended durations (Fig. 6f and g), with sensitivity reliant solely on the refractive index of the molecules of interest, thereby circumventing issues such as blinking, and bleaching associated with fluorescent dyes. The long-term observation of the system allows to obtain the power spectral density from the variations of scattering intensity recorded and to estimate from that the rate constants of the system (Fig. 6h).21 There are notable examples of the use of this technique. For instance, detailed determination of binding constants has allowed for understanding the protein interactions that regulate the circadian rhythm. Such studies provide insights into how protein interactions govern physical, mental, and behavioural changes over the day-night cycle.62 Proteases regulate other aspects of cell function, such as protein catabolism and cell signalling. Monitoring protease kinetic activity using plasmonic nanoparticles represents a step toward developing diagnostic tools.63
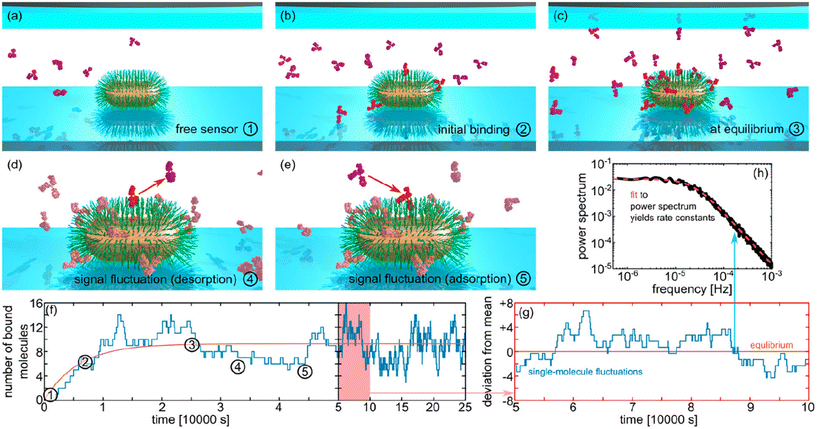 | ||
| Fig. 6 Estimation of equilibrium dissociation constants. (a–e) Binding of molecules to their aptamers on a plasmonic gold nanorod surface leads to aptamer contraction and local refractive index increment, resulting in wavelength red-shift and intensity enhancement in scattered light from the gold nanorod. (f) Single-color total internal reflection dark-field microscopy records ΔI, depicting a typical Langmuir adsorption curve over time upon analyte detection. (g) Equilibrium fluctuation in the gold nanorod strength reflects association and dissociation rates (ka and kd, respectively) between molecules and aptamers. (h) Analysis of intensity equilibrium fluctuation signals in the frequency domain estimates rate constants via characteristic corner frequency at specific molecular concentrations. Reproduced with permission from ref. 21. Copyright 2028 American Chemical Society. | ||
In the utilization of metal nanoparticles in physiological environments, a crucial aspect involves understanding nonspecific interactions. Proteins present in biological fluids such as serum interact non-specifically with the nanoparticle surface, forming a protein corona.64 This coating can significantly alter the physical and chemical properties of the nanomaterial and its interaction with, for instance, the intracellular environment. Therefore, the formation of the protein corona is a critical area of study addressed by the technique.65
Moving forward, the dark-field spectroscopy technique has evolved in two directions to enhance throughput. One focuses on multiple parallel analyte detection, aligning with clinical applications mentioned in the preceding DNA section. The other involves the simultaneous study of protein–protein interactions from a biological perspective.20,21 This advancement includes the creation of a mapped sensor alongside the development of multiple nanoparticle–receptor conjugates (Fig. 7). The sensor fabrication strategy includes two approaches: (i) a mapped sensor is made by sequentially depositing aptamer-coated nanoparticles in a microfluidic flow cell and recording their positions to identify the different sensors (Fig. 7a), or (ii) an unmapped sensor is created by mixing all nanoparticles before deposition, omitting position encoding (Fig. 7b). For protein detection, the analyte is injected into the flow cell in both methods, where it binds to specific aptamer-coated nanoparticles, causing shifts in their plasmon resonances.24
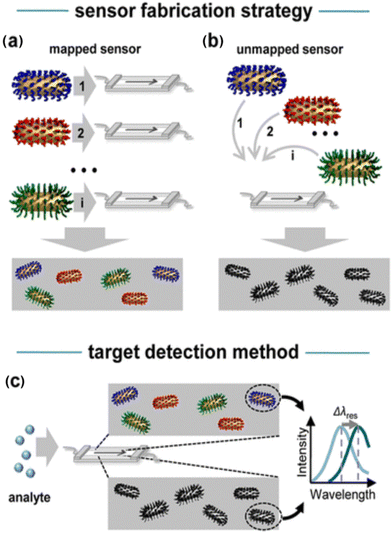 | ||
| Fig. 7 (a) To create a mapped or position-encoded sensor, aptamer-coated nanoparticles 1…i are sequentially deposited in a microfluidic flow cell, with their positions recorded after each step. (b) An unmapped sensor is generated by mixing all particles 1…i before deposition, thus eliminating position encoding. (c) To detect an analyte in a solution, it is injected into the flow cell in both scenarios. The targets bind specifically to their respective aptamer-coated nanoparticles, causing shifts (Δλres) in their plasmon resonances. Reprinted with permission from ref. 24. Copyright 2013 American Chemical Society. | ||
For studying single protein dynamics, plasmonic nanosensors offer a label-free, long-term approach using plasmon rulers. Fig. 8 illustrates a plasmon ruler composed of a nanoparticle dimer bridged by a single protein. In this example, the authors investigated the mechanism of the molecular chaperone HSP90 protein. The dynamics of this protein exhibit scissor-like conformational motions, which may regulate crucial cellular processes.19 For instance, the plasmon rulers track the dynamic behaviour of proteins over time (insets in Fig. 8a), ranging from milliseconds to hours (Fig. 8b). Changes in the distance between plasmonic nanoparticles affect scattering spectra, indicating the protein's different configurations (Fig. 8a). The advanced development of the dark-field microscope setup, capable of measuring scattering intensity variations at specific wavelengths with millisecond time resolution over extended periods, enabled detailed observation of these molecular dynamics. This method offers a force-free approach to recording conformational dynamics of slow-moving single molecules (e.g., milliseconds), challenging traditional paradigms in structural biology by exploring single molecule heterogeneity (non-ergodicity) and investigating memory effects such as non-Markovian dynamics, thus expanding these concepts into biophysics.
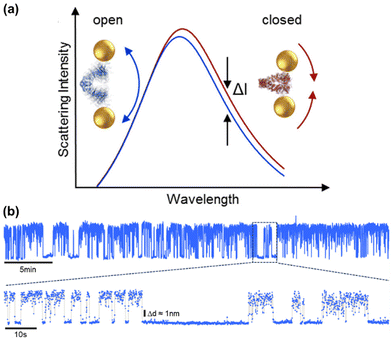 | ||
| Fig. 8 Plasmon rulers’ time traces show Hsp90 dynamics on a time scale of milliseconds to hours. (a) Change of interparticle distance leads to shift in scattering spectra and thus allows us to distinguish the open (blue line) and closed (red) configuration of an Hsp90 sandwiched between two plasmonic nanoparticles. Both overall intensity and the intensity at a given wavelength (black arrows) change with interparticle distance. (b) The relative intensity (normalized to its mean) of a single plasmon ruler (blue line) as a function of time. In this example, the plasmon ruler was measured every 50 ms (at 20 Hz) for 24 h. Dynamics can be observed at time scales ranging from hours to milliseconds. Reproduced with permission from ref. 19. Copyright 2019 American Chemical Society. | ||
In clinical applications, immunoassays detect and quantify biomolecules like antigens based on their specificity to molecules such as antibodies. They are crucial for screening disease-related molecules in healthcare diagnostics, necessitating stringent parameters and controls.66 Among these assays, enzyme-linked immunosorbent assay (ELISA) is renowned despite its drawbacks including long assay times, multiple washing steps, and occasionally poor detection limits.67 Numerous publications explore the use of optical dark-field spectroscopy and plasmonic light scattering as readouts in this field. For example, conjugating one Au nanoparticle functionalized with an antigen and another with its complementary specific antibody forms nanoparticle pairs that markedly amplify scattering intensity and detection sensitivity for early cancer diagnosis.68 Other methods focus on enzyme activity associated with particular diseases. Certain enzymes release metabolites that alter nanoparticle surfaces in coupled reactions, thereby changing monitored optical properties. Monitoring these optical changes enables indirect detection and quantification of specific enzyme metabolism.35 In direct pathogen detection, the approach is somewhat simpler: monitoring antibody-functionalized nanoparticles directly binds to the pathogen. This method has been successfully applied to viruses and bacteria, achieving good repeatability and low detection limits.69,70
These assays can be multiplexed to enhance biomarker search throughput. An intriguing method combines nanoparticle optical properties with quantum dots’ fluorescence. Thus, three tumour biomarkers can be quantified in five human plasma samples as target molecules.71 Other multiplexed assays simplify detection using antibody-coated nanorods. A multi-flow channel microarray chip has been developed, each array featuring gold nanorods with different antibody receptors, allowing construction of ten segments with six nanoparticle-receptors each.72 Moreover, these immunoassays have seen significant refinement through machine learning implementation for image processing, greatly enhancing assay performance.73
Protein–lipid interactions
Taking one step further in the study of biological macromolecules and their interactions, bottom-up synthetic biology is significantly aiding in developing new strategies for applying plasmonic nanosensors. In this section, we explore advanced nanosensor features and complex functionalization strategies involving binary mixtures of lipid membranes and proteins. Lipid membranes are the primary barriers separating the cell's compartments and the cell itself from the exterior. Thus, membrane proteins and receptors participate in more than half of the cell's interactions, controlling diverse processes. For example, processes like viral infection mechanisms or cell division are often controlled by membrane proteins.74Optical dark-field spectroscopy of lipid membrane-functionalized nanoparticles has been successfully implemented in several studies. For its simplicity and reliability, the study of lipid conformational changes on single lipid membranes is noteworthy.75 Increasing complexity by including proteins, protein–membrane interactions have been detected. To initially demonstrate these interactions, the authors inserted biotin-lipids into the lipid membrane and added streptavidin as a ligand molecule.76
In the search for advanced applications of this technology, molecules with pharmacological interest have been studied by developing accurate competitive assays. The assays have monitored and obtained binding constants and, more importantly, drug effectiveness directly on the membrane receptor. Moreover, these assays mimic the real membrane environment without using fluorescent dyes.42 Focusing on method development, the use of plasmonic nanoparticles as sensors has demonstrated huge potential and highlighted the pros and cons of using fluorescent dyes. For instance, a difference of around 20% in the period of a dynamic interaction between proteins and lipid membranes was observed depending on the use of fluorescent labels.23 Also in method development, optical dark-field spectroscopy advanced to directly compete with wide-field fluorescence microscopy imaging. As a model system, the authors used the MinDE protein complex, which interacts cyclically with the membrane. These proteins can synchronize spatially and temporally to form wave-like patterns on the membrane surface (Fig. 9). This work shows how correlating each nanoparticle signal with its position in the field of view can create an image with micrometre resolution and a video of protein–membrane interactions, with an unprecedented time resolution of 30 ms for 24 hours (Fig. 9a). The spatial patterns at different time intervals reveal a decrease in spatial coherence as time progresses, illustrating changes in the nanoparticle scattering that are associated to protein spatial fluctuations (Fig. 9b). The combination of advancements in microscope setup and software development has enabled this sophisticated imaging method. This approach leverages the collective power of hundreds of nanoparticles to resolve macromolecular interaction kinetics and thermodynamics over extended periods, a capability not achievable with other fluorescent-based methods.77
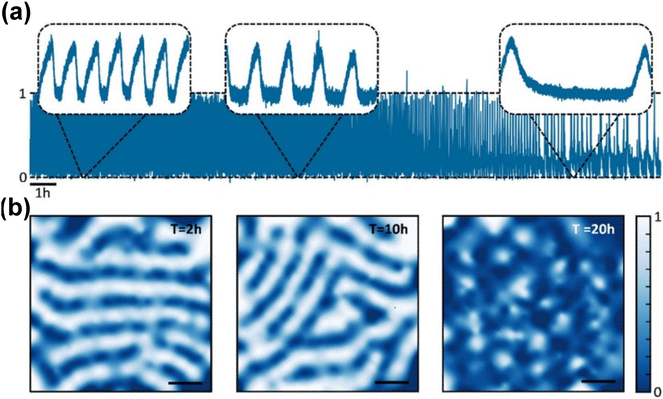 | ||
| Fig. 9 (a) Normalized scattering intensity of a single gold nanoparticle as a function of resolution of 30 ms for 24 hours. The insets show the oscillation behavior for 10 minute intervals at 2, 10, and 20 hours, respectively. The insets show that oscillation period changes over time. (b) Snapshots of the spatial patterns at the three different time intervals corresponding to the insets in panel a (scale bar: 50 μm), showing a loss in spatial coherence at later times. Reprinted with permission from ref. 77. Copyright 2020 American Chemical Society. | ||
Regarding the investigation of the biological mechanisms of protein–membrane interactions, this technology has also established its importance. For example, dark-field spectroscopy helps to elucidate the oligomerization mechanism of some chloroplast proteins, while interacting with the lipid membrane.78 In another example, the methodology was refined to measure dynamic molecular distances and reveal molecular mechanism details. In this work, the authors use a nanoparticle feature called the sensing field, defined by an optimal sensing distance depending on the nanoparticle dimensions. By measuring a chosen membrane–protein dynamic interaction on top of thousands of nanoparticles with different sensing fields (nanoparticles of different sizes), the exact molecular distances of a protein interacting with the membrane can be precisely determined.22 This study demonstrates the power of dark-field spectroscopy and reveals that these proteins have alternative molecular interaction mechanisms that depend on membrane composition, among other factors.
Biomolecular interactions in cellular environments
Cell populations in a tissue rely on various physical and chemical signalling pathways to communicate. This cell response to a stimulus often begins with single cells, which then propagate and spread the signal to surrounding cells. Thus, to understand the cell communication process, sensing at the single-cell level becomes essential. Nanosensors are especially useful for this mission as they have the perfect features. For example, plasmonic nanosensors have been used extracellularly to monitor enzymatic activity in different living environments and at different stages of the bacterial cell life79 In this study, nanoparticles with distinct resonance peaks surrounded by bacterial clusters enable real-time detection and monitoring over extended periods. Outer membrane vesicles work as vehicles for enzyme release and subsequent detection by the plasmonic nanoparticles, which register changes in scattering intensity. This method provides detailed spatial and temporal insights into biological processes at the nanoscale, crucial for understanding microbial behaviour and interactions.The secretion of macromolecules as cell signals has also been detected with single-molecule resolution.80 In this case, the authors used extracellular plasmon rulers as detecting elements. As significant as it sounds, this single-molecule detection of cell-secreted molecules has the potential to develop a variety of therapeutic strategies, such as detecting genetic code mutations, repairing tissues, or detecting bacterial resistance to antibiotics. Regarding the intracellular environment, the detection and quantification of macromolecules are very challenging tasks. However, multiple approaches have been developed to monitor specific molecules in the cytoplasm, which can help detect numerous events such as microRNA expression levels, hormonal instabilities, or the presence of toxins, among others.
In the oncology field, detecting and controlling intracellular microRNA expression levels is of high interest as it can aid in the early detection and prognosis of certain cancer types. In this area, there are several significant studies with multiple approaches using plasmonic nanoparticles as sensors and optical dark-field spectroscopy as a readout.81–85 Additionally, the detection of DNA or protein mutations in the cell helps understand and identify pathological processes. By using various nanoparticle functionalization strategies involving antibodies, it has become possible to target and map different DNA and protein mutations in the cell with high precision. These works have the potential to be used in single-cell studies and even in tissues as diagnostic tools.86,87
Relying on the nanoparticle surface chemistry itself, intracellular detection and quantification strategies can also be developed. One such example studies the autophagy phenomenon, which helps cells survive periods of metabolic starvation. The formation of superoxide radicals during the autophagy process can etch the metal sensor itself (Fig. 10a).88 To allow the observation of such a long process, they introduce new nanoprobes regularly, as a relay, when previous nanoprobes are too etched to be optically monitored (Fig. 10b). Thus, by monitoring the sensor's optical signal, the autophagy process can be directly observed (Fig. 10c). In a similar research line, toxic molecules are detected and mapped inside the cell. Here, hydrogen sulphide, known to be related to numerous diseases, has the capacity to capture silver atoms from the sensor, changing its optical signal and allowing the dynamics and formation of this toxic molecule to be monitored in real time.89
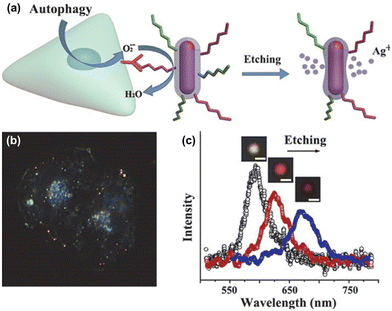 | ||
| Fig. 10 (a) Illustration of the autophagy process of a cell producing superoxide radicals that etch the metal core–shell nanosensor. (b) Representative dark-field spectroscopy images of a HeLa cell studied by a relay of probes during the long autophagy process. (c) Scattering spectra of a single nanorod etched by superoxide radicals for 0, 30, and 60 minutes. Insets show dark-field scattering images of the probe in each status. Scale bar: 500 nm. Reprinted with permission from ref. 88. Copyright 2015 American Chemical Society. | ||
Conclusions and perspectives
In this review, we have explored various applications of advanced optical dark-field spectroscopy, encompassing immune assays, metabolite detection, determination of macromolecular binding constants, and investigation of molecular interaction mechanisms. Recent literature underscores the efficacy of integrating this technique with specific plasmonic nanoparticles and surface modifications for robust clinical test development.We anticipate widespread adoption of these methodologies across laboratories focused on molecular biochemistry, biophysics, clinical diagnostics, and pharmaceutical research. Looking ahead, the future of plasmonic sensing and optical dark-field spectroscopy holds significant potential, particularly in advancing towards in vivo monitoring through implantable sensors or smart tattoos, as current research hints.90–93 It is conceivable that these technologies could eventually replace conventional clinical tests and even revolutionize personal items such as wallets, integrating ID and financial cards into implantable biosensors embedded with coded nanoparticle information.
As remarkable systems, chiral materials exhibit optical activity that is harnessed for (bio)sensing, utilizing changes in circular dichroism peak wavelengths.94 For instance, circular differential scanning intensity spectra can be measured from plasmonic nanoparticles with dark-field microscopy,95 by inducing chiral self-assembly.96 For example, microscopic observation is conducted to demonstrate the enantiomeric switching of individual active DNA origami-assembled plasmonic nanoparticles.97 This breakthrough in detecting chiroptical signals from individual plasmonic nanoparticles paves the way for novel developments in plasmonic biosensing technologies.98,99 These sensors could benefit from improved batch-to-batch consistency, potentially enabling high-throughput production at lower costs.
Additionally, to achieve precise sensing with plasmonic sensors at specific locations, researchers can employ a combination of dark-field microscopy and an optical trapping setup. Optical trapping of plasmonic nanoparticles is straightforward due to their high polarizability and is widely used in studies of nanoparticle dynamics, plasmonic coupling, and optical thermometry.100 While the integration of dark-field microscopy with optical tweezers has been limited in its applications to date, it has been successfully used to observe three-dimensional control of plasmonic nanoparticle dynamics using a sophisticated optical trapping configuration.101 Another application involved studying the photothermal release of DNA from a single gold nanorod, measuring the temperature-dependent kinetics and activation energy of the DNA melting process while simultaneously imaging the trapped nanoparticle with dark-field microscopy.102 Thus, there is substantial potential to exploit this synergistic combination of optical techniques in biosensing applications.
Despite its potential, optical dark-field spectroscopy of single nanoparticles has several technical limitations and areas for improvement.16 For instance, improving time resolution in data acquisition is essential for accurately monitoring the dynamics of rapidly interacting molecules. Advances in high-speed cameras and better synchronization between hardware components could address this challenge. Additionally, processing data from long measurements can be time-consuming; incorporating machine learning and artificial intelligence may help streamline this process. Data storage is another issue, as terabytes of data are often generated. It is also crucial to carefully analyse and minimize noise sources to prevent interference with single-molecule measurements, and to actively correct image drifting and focus to avoid artefacts. These factors highlight key areas for enhancing this powerful technique.
Author contributions
L. L.-P. A. G.-M. and R. A.-G wrote the manuscript and guided all aspects of the work. A. C.-M. and E. J. wrote the manuscript.Data availability
No primary research results, software or code have been included and no new data were generated or analysed as part of this review.Conflicts of interest
There are no conflicts to declare.Acknowledgements
This work has been funded by the Spanish Ministry of Science and Innovation (MICINN) (grants PID2021-123228NB-I00 and PID2023-150760NA-I00) and the Madrid Regional Government (REACT ANTICIPA-UCM). A. C.-M. acknowledges the predoctoral fellowship Contratos Predoctorales de Personal Investigador en Formación from the Universidad Complutense de Madrid (CT15/23).References
- A. Abbott, Nature, 2002, 417, 894–897 CrossRef CAS PubMed.
- G. Rivas and A. P. Minton, Trends Biochem. Sci., 2016, 41, 970–981 CrossRef CAS PubMed.
- M. Soler and L. M. Lechuga, Anal. Bioanal. Chem., 2022, 414, 5071–5085 CrossRef CAS PubMed.
- J. N. Anker, W. P. Hall, O. Lyandres, N. C. Shah, J. Zhao and R. P. Van Duyne, Nat. Mater., 2008, 7, 442–453 CrossRef CAS PubMed.
- K. M. Mayer and J. H. Hafner, Chem. Rev., 2011, 111, 3828–3857 CrossRef CAS PubMed.
- A. Al-Zubeidi, L. A. McCarthy, A. Rafiei-Miandashti, T. S. Heiderscheit and S. Link, Nanophotonics, 2021, 10, 1621–1655 CrossRef CAS.
- J. Zhou, A. I. Chizhik, S. Chu and D. Jin, Nature, 2020, 579, 41–50 CrossRef CAS PubMed.
- S. Cormier, T. Ding, V. Turek and J. J. Baumberg, Adv. Opt. Mater., 2018, 6, 1701281 CrossRef.
- Y. Wang and T. Ding, Nanoscale, 2019, 11, 10589–10594 RSC.
- S. Wang, J. Yao, Z. Ou, X. Wang, Y. Long, J. Zhang, Z. Fang, T. Wang, T. Ding and H. Xu, Nanoscale, 2022, 14, 4705–4711 RSC.
- F. Chen, J. Yao, X. Wang, S. Wang, Z. Liu and T. Ding, Nanoscale, 2023, 15, 476–482 RSC.
- S. Abalde-Cela, S. Carregal-Romero, J. P. Coelho and A. Guerrero-Martínez, Adv. Colloid Interface Sci., 2016, 233, 255–270 CrossRef CAS PubMed.
- R. M. Fratila, S. G. Mitchell, P. del Pino, V. Grazu and J. M. de la Fuente, Langmuir, 2014, 30, 15057–15071 CrossRef CAS PubMed.
- C. Novo, A. M. Funston and P. Mulvaney, Nat. Nanotechnol., 2008, 3, 598–602 CrossRef CAS PubMed.
- P. F. Gao, G. Lei and C. Z. Huang, Anal. Chem., 2021, 93, 4707–4726 CrossRef CAS PubMed.
- S. Celiksoy, W. Ye, K. Wandner, K. Kaefer and C. Sonnichsen, Nano Lett., 2021, 21, 2053–2058 CrossRef CAS PubMed.
- S. Celiksoy, W. Ye, R. Ahijado-Guzman and C. Sönnichsen, ACS Sens., 2021, 6, 716–721 CrossRef CAS PubMed.
- M. A. Beuwer, M. W. Prins and P. Zijlstra, Nano Lett., 2015, 15, 3507–3511 CrossRef CAS PubMed.
- W. Ye, M. Götz, S. Celiksoy, L. Tüting, C. Ratzke, J. Prasad, J. Ricken, S. V. Wegner, R. N. Ahijado-Guzmán and T. Hugel, Nano Lett., 2018, 18, 6633–6637 CrossRef CAS PubMed.
- R. Ahijado-Guzmán, J. Prasad, C. Rosman, A. Henkel, L. Tome, D. Schneider, G. Rivas and C. Sönnichsen, Nano Lett., 2014, 14, 5528–5532 CrossRef PubMed.
- S. S. Aćimović, H. Šípová-Jungová, G. Emilsson, L. Shao, A. B. Dahlin, M. Käll and T. J. Antosiewicz, ACS Nano, 2018, 12, 9958–9965 CrossRef PubMed.
- W. Ye, S. Celiksoy, A. Jakab, A. Khmelinskaia, T. Heermann, A. Raso, S. V. Wegner, G. Rivas, P. Schwille and R. Ahijado-Guzman, J. Am. Chem. Soc., 2018, 140, 17901–17906 CrossRef CAS PubMed.
- C. Lambertz, A. Martos, A. Henkel, A. Neiser, T.-T. Kliesch, A. Janshoff, P. Schwille and C. Sönnichsen, Nano Lett., 2016, 16, 3540–3544 CrossRef CAS PubMed.
- C. Rosman, J. Prasad, A. Neiser, A. Henkel, J. Edgar and C. Sonnichsen, Nano Lett., 2013, 13, 3243–3247 CrossRef CAS PubMed.
- I. Ament, J. Prasad, A. Henkel, S. Schmachtel and C. Sonnichsen, Nano Lett., 2012, 12, 1092–1095 CrossRef CAS PubMed.
- H. Chen, X. Kou, Z. Yang, W. Ni and J. Wang, Langmuir, 2008, 24, 5233–5237 CrossRef CAS PubMed.
- C. Sönnichsen, T. Franzl, T. Wilk, G. von Plessen, J. Feldmann, O. Wilson and P. Mulvaney, Phys. Rev. Lett., 2002, 88, 077402 CrossRef PubMed.
- J. Becker, A. Trügler, A. Jakab, U. Hohenester and C. Sönnichsen, Plasmonics, 2010, 5, 161–167 CrossRef CAS.
- T. Staniszewska, M. Szkulmowski and S. Morawiec, J. Phys. Chem. C, 2021, 125, 14765–14777 CrossRef CAS PubMed.
- A.-I. Henry, J. M. Bingham, E. Ringe, L. D. Marks, G. C. Schatz and R. P. Van Duyne, J. Phys. Chem. C, 2011, 115, 9291–9305 CrossRef CAS.
- T. J. Antosiewicz and M. Kall, J. Phys. Chem. C, 2016, 120, 20692–20701 CrossRef CAS.
- Y. H. Lee, H. Chen, Q.-H. Xu and J. Wang, J. Phys. Chem. C, 2011, 115, 7997–8004 CrossRef CAS.
- L. M. Liz-Marzán, in Colloidal synthesis of plasmonic nanometals, Jenny Stanford Publishing, 2020, pp. 1–13 Search PubMed.
- R. Cheng, L. Tong Li, M. Huang, F. Zhu, Q. Li, H. Liu, J. Gao, X. Hui Zhao, F. Kang Luo and J. Wang, Chem. Eng. J., 2023, 468, 143627 CrossRef CAS.
- F. Wang, Y. Li, Y. Han, Z. Ye, L. Wei, H.-B. Luo and L. Xiao, Anal. Chem., 2019, 91, 6329–6339 CrossRef CAS PubMed.
- R. Mout, D. F. Moyano, S. Rana and V. M. Rotello, Chem. Soc. Rev., 2012, 41, 2539–2544 RSC.
- J. Zhang, L. Mou and X. Jiang, Chem. Sci., 2020, 11, 923–936 RSC.
- C. Sonnichsen, B. M. Reinhard, J. Liphardt and A. P. Alivisatos, Nat. Biotechnol., 2005, 23, 741–745 CrossRef PubMed.
- J. Prasad, I. Zins, R. Branscheid, J. Becker, A. H. Koch, G. Fytas, U. Kolb and C. Sönnichsen, J. Phys. Chem. C, 2015, 119, 5577–5582 CrossRef CAS.
- E. W. A. Visser, M. Horacek and P. Zijlstra, Nano Lett., 2018, 18, 7927–7934 CrossRef CAS PubMed.
- J. E. van Dongen, L. R. Spoelstra, J. T. W. Berendsen, J. T. Loessberg-Zahl, J. C. T. Eijkel and L. I. Segerink, ACS Sens., 2021, 6, 4297–4303 CrossRef CAS PubMed.
- R. Ahijado-Guzman, J. Menten, J. Prasad, C. Lambertz, G. Rivas and C. Sönnichsen, ACS Appl. Mater. Interfaces, 2017, 9, 218–223 CrossRef CAS PubMed.
- C. Yao, P. Wang, R. Wang, L. Zhou, A. M. El-Toni, Y. Lu, X. Li and F. Zhang, Anal. Chem., 2016, 88, 1930–1936 CrossRef CAS PubMed.
- Y. Tian, L. Zhang and L. Wang, Biotechnol. J., 2020, 15, 1800741 CrossRef CAS PubMed.
- B. M. Reinhard, M. Siu, H. Agarwal, A. P. Alivisatos and J. Liphardt, Nano Lett., 2005, 5, 2246–2252 CrossRef CAS PubMed.
- X. Meng, P. Kukura and S. Faez, Nanoscale, 2021, 13, 12687–12696 RSC.
- S. Brinkers, H. R. Dietrich, F. H. de Groote, I. T. Young and B. Rieger, J. Chem. Phys., 2009, 130, 215105 CrossRef PubMed.
- T. Chen, Y. Hong and B. R. M. Reinhard, Nano Lett., 2015, 15, 5349–5357 CrossRef CAS PubMed.
- B. M. Reinhard, S. Sheikholeslami, A. Mastroianni, A. P. Alivisatos and J. Liphardt, Proc. Natl. Acad. Sci. U. S. A., 2007, 104, 2667–2672 CrossRef CAS PubMed.
- N. Boby, S. A. Ali, P. Preena, G. Kaur, S. Kumar and P. Chaudhuri, Talanta, 2018, 188, 325–331 CrossRef CAS PubMed.
- J. Li, C. Kong, Q. Liu and Z. Chen, Analyst, 2018, 143, 4051–4056 RSC.
- C. Song, J. Zhang, X. Jiang, H. Gan, Y. Zhu, Q. Peng, X. Fang, Y. Guo and L. Wang, Biosens. Bioelectron., 2021, 190, 113376 CrossRef CAS PubMed.
- J. Li, Q. Liu, H. Xi, X. Wei and Z. Chen, Anal. Chem., 2017, 89, 12850–12856 CrossRef CAS PubMed.
- L. Soares, A. Csaki, J. Jatschka, W. Fritzsche, O. Flores, R. Franco and E. Pereira, Analyst, 2014, 139, 4964–4973 RSC.
- J. Li, Y. Jiao, Q. Liu and Z. Chen, Anal. Chim. Acta, 2018, 1028, 66–76 CrossRef CAS PubMed.
- F. Liu, Y. Guo, Y. Hu, X. Zhang and X. Zheng, Anal. Bioanal. Chem., 2019, 411, 5845–5854 CrossRef CAS PubMed.
- C. Yang, Y. Tian, B. Wang, Q. Guo and G. Nie, Sens. Actuators B: Chem, 2021, 338, 129870 CrossRef CAS.
- P. Zhu, V. A. Papadimitriou, J. E. van Dongen, J. Cordeiro, Y. Neeleman, A. Santoso, S. Chen, J. C. T. Eijkel, H. Peng, L. I. Segerink and A. Y. Rwei, Sci. Adv., 2023, 9, eadf5509 CrossRef CAS PubMed.
- H. B. Jeon, P. V. Tsalu and J. W. Ha, Sci. Rep., 2019, 9, 13635 CrossRef PubMed.
- H. Xie, M. Yu, R. Xing, C. Wang and W. Ye, Appl. Phys. Lett., 2022, 121, 243703 CrossRef CAS.
- G. Raschke, S. Kowarik, T. Franzl, C. Sönnichsen, T. Klar, J. Feldmann, A. Nichtl and K. Kürzinger, Nano Lett., 2003, 3, 935–938 CrossRef CAS.
- A. Garg, R. Orru, W. Ye, U. Distler, J. E. Chojnacki, M. Kohn, S. Tenzer, C. Sonnichsen and E. Wolf, J. Biol. Chem., 2019, 294, 16604–16619 CrossRef CAS PubMed.
- R. Oliveira-Silva, Y. Wang, S. W. Nooteboom, D. M. F. Prazeres, P. M. R. Paulo and P. Zijlstra, ACS Appl Opt Mater, 2023, 1, 1661–1669 CrossRef CAS PubMed.
- M. Martinez-Negro, G. Gonzalez-Rubio, E. Aicart, K. Landfester, A. Guerrero-Martinez and E. Junquera, Adv. Colloid Interface Sci., 2021, 289, 102366 CrossRef CAS PubMed.
- M. Dolci, Y. Wang, S. W. Nooteboom, P. E. D. Soto Rodriguez, S. Sanchez, L. Albertazzi and P. Zijlstra, ACS Nano, 2023, 17, 20167–20178 CrossRef CAS PubMed.
- K. L. Cox, V. Devanarayan, A. Kriauciunas, J. Manetta, C. Montrose and S. Sittampalam, in Assay Guidance Manual, 2019 Search PubMed.
- S. Hosseini, P. Vázquez-Villegas, M. Rito-Palomares, S. O. Martinez-Chapa, S. Hosseini, P. Vázquez-Villegas, M. Rito-Palomares and S. O. Martinez-Chapa, in Enzyme-Linked Immunosorbent Assay (ELISA) from A to Z, 2018, pp. 67–115 Search PubMed.
- C.-Y. Poon, L. Wei, Y. Xu, B. Chen, L. Xiao and H.-W. Li, Anal. Chem., 2016, 88, 8849–8856 CrossRef CAS PubMed.
- X. Qian, Y. Shen, J. Yuan, C.-T. Yang and X. Zhou, Biosensors, 2022, 12, 1146 CrossRef CAS PubMed.
- F. Chen, T. Di, C.-T. Yang, T. Zhang, B. Thierry and X. Zhou, ACS Sens., 2020, 5, 1140–1148 CrossRef CAS PubMed.
- X. Liu, X. Lin, X. Pan and H. Gai, Anal. Chem., 2022, 94, 5830–5837 CrossRef CAS PubMed.
- P. Chen, M. T. Chung, W. McHugh, R. Nidetz, Y. Li, J. Fu, T. T. Cornell, T. P. Shanley and K. Kurabayashi, ACS Nano, 2015, 9, 4173–4181 CrossRef CAS PubMed.
- Z. Gao, Y. Song, T. Y. Hsiao, J. He, C. Wang, J. Shen, A. MacLachlan, S. Dai, B. H. Singer and K. Kurabayashi, ACS Nano, 2021, 15, 18023–18036 CrossRef CAS PubMed.
- H. Li, T. Zhao and Z. Sun, Rev. Anal. Chem., 2018, 37, 20170012 CrossRef CAS.
- J. Zhang, F. Schuknecht, L. Habermann, A. Pattis, J. Heine, S. D. Pritzl, D. Trauner and T. Lohmüller, Adv. Opt. Mater., 2024, 12, 2302266 CrossRef CAS.
- C. L. Baciu, J. Becker, A. Janshoff and C. Sönnichsen, Nano Lett., 2008, 8, 1724–1728 CrossRef CAS PubMed.
- S. Celiksoy, W. Ye, K. Wandner, F. Schlapp, K. Kaefer, R. N. Ahijado-Guzmán and C. Sönnichsen, J. Phys. Chem. Lett., 2020, 11, 4554–4558 CrossRef CAS PubMed.
- J. Heidrich, V. Wulf, R. Hennig, M. Saur, J. Markl, C. Sönnichsen and D. Schneider, J. Biol. Chem., 2016, 291, 14954–14962 CrossRef CAS PubMed.
- D. Lu, G. Zhu, X. Li, J. Xiong, D. Wang, Y. Shi, T. Pan, B. Li, L. P. Lee and H. Xin, Nat. Photonics, 2023, 17, 904–911 CrossRef CAS.
- S. E. Lee, Q. Chen, R. Bhat, S. Petkiewicz, J. M. Smith, V. E. Ferry, A. L. Correia, A. P. Alivisatos and M. J. Bissell, Nano Lett., 2015, 15, 4564–4570 CrossRef CAS PubMed.
- J. J. Liu, H. H. Yan, Q. Zhang, P. F. Gao, C. M. Li, G. L. Liang, C. Z. Huang and J. Wang, Anal. Chem., 2020, 92, 13118–13125 CrossRef CAS PubMed.
- G. Wang, Y. Guo, Y. Liu, W. Zhou and G. Wang, ACS Sens., 2021, 6, 958–966 CrossRef CAS PubMed.
- M. Li, J. Li, H. Zheng, M. Liu, H. Zhou, L. Zhang, H. Zhang and Q. Shen, Talanta, 2024, 273, 125936 CrossRef CAS PubMed.
- D. Zhang, K. Wang, W. Wei, Y. Liu and S. Liu, Anal. Chem., 2021, 93, 9521–9530 CrossRef CAS PubMed.
- H. H. Yan, M. Huang, F. Zhu, R. Cheng, S. Wen, L. T. Li, H. Liu, X. H. Zhao, F. K. Luo and C. Z. Huang, Anal. Chem., 2023, 95, 3968–3975 CrossRef CAS PubMed.
- X. Wang, Y. Cui and J. Irudayaraj, ACS Nano, 2015, 9, 11924–11932 CrossRef CAS PubMed.
- R. Qian, Y. Cao and Y. T. Long, Angew. Chem., Int. Ed., 2016, 55, 719–723 CrossRef CAS PubMed.
- Z. Chen, J. Li, X. Chen, J. Cao, J. Zhang, Q. Min and J.-J. Zhu, J. Am. Chem. Soc., 2015, 137, 1903–1908 CrossRef CAS PubMed.
- B. Xiong, R. Zhou, J. Hao, Y. Jia, Y. He and E. S. Yeung, Nat. Commun., 2013, 4, 1708 CrossRef PubMed.
- K. Buder, K. Kaefer, B. Flietel, H. S. Uzun, T. Schroeder and C. Sönnichsen, ACS Appl. Bio Mater., 2022, 5, 465–470 CrossRef CAS PubMed.
- K. Kaefer, K. Krüger, F. Schlapp, H. Uzun, S. Celiksoy, B. Flietel, A. Heimann, T. Schroeder, O. Kempski and C. Sönnichsen, Nano Lett., 2021, 21, 3325–3330 CrossRef CAS PubMed.
- S. Li, J. Dai, M. Zhu, N. Arroyo-Currás, H. Li, Y. Wang, Q. Wang, X. Lou, T. E. Kippin and S. Wang, ACS Nano, 2023, 17, 18525–18538 CrossRef CAS PubMed.
- P. Li, G.-H. Lee, S. Y. Kim, S. Y. Kwon, H.-R. Kim and S. Park, ACS Nano, 2021, 15, 1960–2004 CrossRef CAS PubMed.
- N. H. Cho, A. Guerrero-Martínez, J. Ma, S. Bals, N. A. Kotov, L. M. Liz-Marzán and K. T. Nam, Nat. Rev. Bioeng., 2023, 1, 88–106 CrossRef.
- L.-Y. Wang, K. W. Smith, S. Dominguez-Medina, N. Moody, J. M. Olson, H. Zhang, W.-S. Chang, N. Kotov and S. Link, ACS Photonics, 2015, 2, 1602–1610 CrossRef CAS.
- B. Auguié, J. L. Alonso-Gómez, A. Guerrero-Martínez and L. M. Liz-Marzán, J. Phys. Chem. Lett., 2011, 2, 846–851 CrossRef PubMed.
- Q. Zhang, X. Wang, H. Wu, J. Zhang, X. Lin, J. Sa, H. Li, C. Zhou and W. Ni, Nano Lett., 2023, 23, 5180–5186 CrossRef CAS PubMed.
- Y. Tan, X. Lu and T. Ding, ACS Sens., 2024, 9, 3290–3295 CrossRef CAS PubMed.
- C. Zhang, H. Hu, C. Ma, Y. Li, X. Wang, D. Li, A. Movsesyan, Z. Wang, A. Govorov, Q. Gan and T. Ding, Nat. Commun., 2024, 15, 2 CrossRef CAS PubMed.
- F. Zhang, P. Camarero, P. Haro-González, L. Labrador-Páez and D. Jaque, Opto-Electronic Science, 2023, 2, 230019 CAS.
- J. A. Rodrigo, M. Angulo and T. Alieva, Photonics Res., 2021, 9, 1–12 CrossRef.
- H. Sipova, L. Shao, N. Odebo Länk, D. Andrén and M. Käll, ACS Photonics, 2018, 5, 2168–2175 CrossRef CAS.
| This journal is © The Royal Society of Chemistry 2024 |

