 Open Access Article
Creative Commons Attribution 3.0 Unported Licence
New cyclometalated Ru(II) polypyridyl photosensitizers trigger oncosis in cancer cells by inducing damage to cellular membranes†
Jakub
Cervinka‡
 ab,
Alba
Hernández-García‡
c,
Delia
Bautista
d,
Lenka
Markova
 b,
Hana
Kostrhunova
 b,
Jaroslav
Malina
 b,
Jana
Kasparkova
 be,
M. Dolores
Santana
 c,
Viktor
Brabec
 *be and
José
Ruiz
 *c
*c
aFaculty of Science, Department of Biochemistry, Masaryk University, CZ-62500 Brno, Czech Republic
bCzech Academy of Sciences, Institute of Biophysics, CZ-61200 Brno, Czech Republic. E-mail: vbrabec44@gmail.com
cDepartamento de Química Inorgánica, Universidad de Murcia, and Murcia BioHealth Research Institute (IMIB-Arrixaca), E-30100 Murcia, Spain. E-mail: jruiz@um.es
dACTI, Universidad de Murcia, Murcia E-30100, Spain
eDepartment of Biophysics, Faculty of Science, Palacky University, Slechtitelu 27, CZ-78371 Olomouc, Czech Republic
First published on 8th May 2024
Abstract
A new generation series of cyclometalated Ru(II) polypyridyl complexes of the type [Ru(C^N)(N^N)2]+, Ru1–Ru4, were rationally designed and synthesized, where N^N = 2,2′-bipyridine (bpy) and dipyrido[3,2-d:2′,3′-f]quinoxaline (dpq) and C^N = deprotonated methyl 1-butyl-2-aryl-benzimidazolecarboxylate with p-CF3C6H4 or p-Me2NC6H4 substituents in the R3 position of the phenyl ring. The photophysical properties of Ru1–Ru4 revealed absorption maxima around 560 nm with an absorption up to 700 nm. The new Ru complexes were able to generate singlet oxygen (1O2) upon green light irradiation in acetonitrile, with complexes containing the CF3 group, Ru1 and Ru3, being the best performers. Furthermore, Ru1 and Ru3 were also able to photogenerate hydroxyl radicals OH˙. By having PSs capable of undergoing both type I and type II mechanisms, a broader range of cytotoxic effects is achieved. Ru1–Ru4 accumulated in membrane-rich compartments, including the cytoplasmic membrane, mitochondria, and endoplasmic reticulum in HeLa cells. Upon irradiation of Ru1 with green light, all these compartments were damaged in treated cells. Based on in vitro experiments, we deduced that the compound Ru1 under irradiation has the capability to disrupt phospholipid membranes directly. Additionally, differential scanning calorimetry of living cells also indicated damage of cytoplasmic/membrane proteins, ultimately leading to cell death via oncosis.
Introduction
Ruthenium complexes have gained significant attention recently for their potential application in photodynamic cancer therapy (PDT).1 PDT is a promising treatment modality that utilizes photosensitizing agents to selectively target and destroy cancer cells upon exposure to light.2–4 With their unique chemical properties and tunable electronic structures, ruthenium complexes offer a compelling avenue for developing novel photosensitizers (PSs) for PDT, demonstrating a promising treatment modality for oncology.5–7The versatile nature of ruthenium(II) polypyridine complexes allows for the fine-tuning of their chemical and physical properties. Through systematic research, it is possible to tailor the complexes to optimize their photophysical characteristics, such as absorption and emission wavelengths and stability, to achieve maximum therapeutic efficacy. It is also worth noting that understanding the mechanism of action is crucial for successfully implementing any therapeutic approach. Research in this area can show how ruthenium(II) polypyridine complexes interact with cancer cells during PDT.8 This knowledge is essential for refining the design of future complexes, predicting their behavior in biological systems, and optimizing treatment protocols. It is important to highlight that one of these compounds, namely TLD-1433, is currently being studied as a PS for PDT in phase 2 clinical trials for treating non-muscle invasive bladder cancer.9,10
It is also interesting that investigating the biocompatibility and potential toxicity of new ruthenium complexes is pivotal for their clinical translation. Understanding how these complexes interact with biological systems, their pharmacokinetics, and potential side effects is essential for ensuring the safety of patients undergoing PDT. It is also important to consider that cancer cells can develop resistance to conventional treatments. Ruthenium complexes may offer a novel approach to overcome such resistance mechanisms.11–13
The exploration of new ruthenium(II) polypyridine complexes for PDT and the study of their mechanisms of action hold immense potential for advancing cancer therapy.14,15 The development of more efficient, selective, and safe photosensitizers could significantly contribute to the ongoing efforts to enhance the arsenal of cancer treatment options.
On the other hand, cyclometalated Ru(II) compounds have been reported to have anticancer efficacy.16 Cyclometalation lowers the energy of the triplet metal-to-ligand charge transfer state (3MLCT) and shortens the excited state lifetime of complexes as RuA (Chart 1).17 Furthermore, the anionic character of the ligand causes a bathochromic shift of the MLCT absorption band of the Ru(II) cyclometalated complex.18 McFarland et al. studied the cytotoxic and photocytotoxic activities of a series of ruthenium(II) complexes bearing cyclometalated π-expansive ligands such as RuB (Chart 1), and they found that the extent of the π-conjugation plays a crucial role,19 whereas Gaiddon et al. recently reported light activation of RuC.20 Gasser and co-workers have recently reported the near-IR absorbing ruthenium(II) PS RuD.21 On the other hand, some Ru(II) benzimidazole-based complexes (RuE, RuF and RuG) have been previously reported by some of us.22–24 Interestingly, those compounds containing dipyrido[3,2-d:2′,3′-f]quinoxaline (dpq) or dipyrido[3,2-a:2′,3′-c]phenazine (dppz) ligands are active in hypoxic conditions with high phototoxicity. Notably, in addition the Ru(II)-coumarin conjugate, RuG, is a near-IR light-activatable PS.
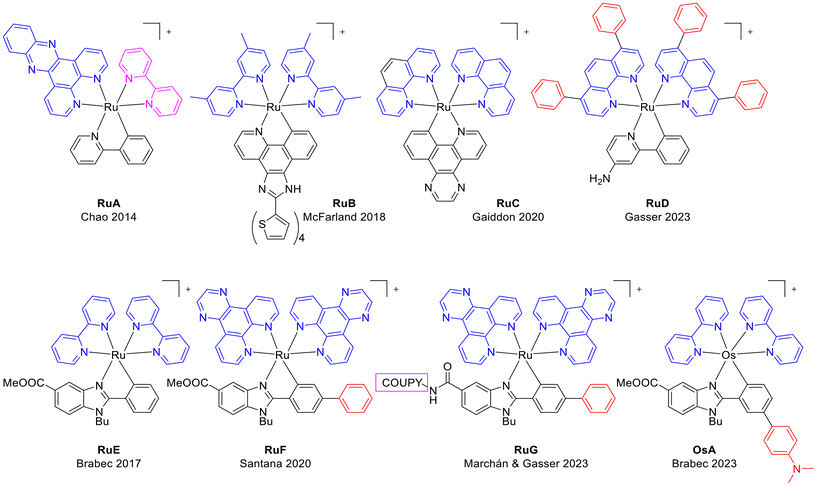 | ||
| Chart 1 Chemical structures of representative organo-ruthenium(II) and organo-osmium(II) complexes closely related to this work. | ||
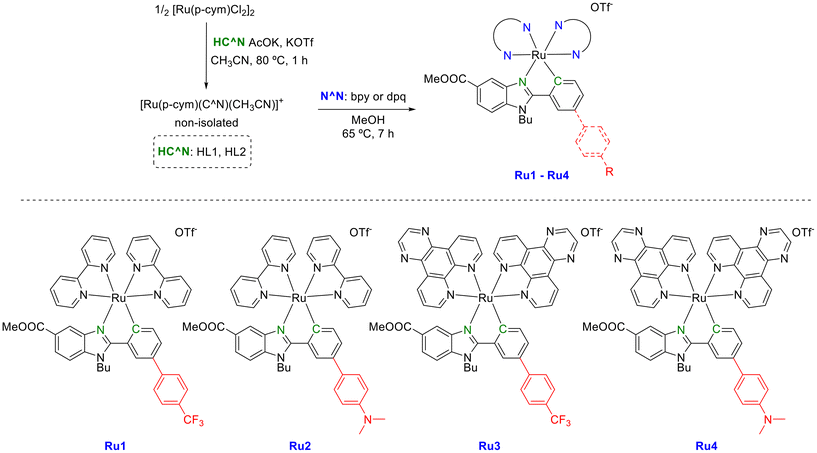
In this work we dealt with the synthesis, chemical characterization, and antiproliferative activity in cancer cells of a new generation of photoactivatable benzimidazole-based cyclometalated ruthenium(II) octahedral complexes with bpy or dpq as ancillary ligands (Scheme 1), that are also effective against hypoxic cancers via green light activation. The incorporation of an electron-withdrawing substituent (CF3) or an electron-donating group (NMe2) in the R3 position of the phenyl ring of the cyclometalating ligand was conducted to explore the influence on the absorption properties of the complexes and on their photobiological activities. The photophysical properties of Ru1–Ru4 revealed absorption maxima around 560 nm with an absorption tail up to 700 nm. The generation of singlet oxygen (1O2) upon light irradiation was confirmed with a 1O2 quantum yield up to 0.15 in acetonitrile. In contrast to the closely related panchromatic osmium complex OsA (Chart 1),25 the involvement of ROS in the mechanism of phototoxicity of the new Ru(II) complexes is demonstrated, together with their ability to induce the denaturation of cytoplasmic and membrane proteins in cancer cells and oncosis. It is important to note that Ru(II)-based PSs with oncosis-inducing ability have not been previously reported.26,27
Results and discussion
Synthesis and characterization of ruthenium complexes (Ru1–Ru4)
Proligands and dpq were obtained following a synthetic three-step procedure (Schemes S1 and S2†) recently reported by some of us.25 Dark red solids Ru1–Ru4 (Scheme 1) were obtained via two-step synthesis following an optimized procedure adapted from the literature.25 First, cyclometallation is carried out by a reaction between the ruthenium dimeric precursor [(η6-p-cymene)RuCl(μ-Cl)]2 and the corresponding proligand HC^N. Then, the corresponding unstable ruthenium intermediate is reacted with bpy or dpq for 7 h in refluxing methanol, obtaining the ruthenium cyclometalated complex.Ruthenium cyclometalated complexes were isolated as triflate salts and purified by column chromatography (1![[thin space (1/6-em)]](https://www.rsc.org/images/entities/char_2009.gif) :
:![[thin space (1/6-em)]](https://www.rsc.org/images/entities/char_2009.gif) 1 CH3CN
1 CH3CN![[thin space (1/6-em)]](https://www.rsc.org/images/entities/char_2009.gif) :
:![[thin space (1/6-em)]](https://www.rsc.org/images/entities/char_2009.gif) DCM) in a 25–30% yield fully characterized by elemental analysis and multinuclear NMR spectroscopy (Fig. S1–S18†) and mass spectrometry. The purities of the new Ru complexes were higher than 95% as shown by RP-HPLC/MS in ACN/H2O (Fig. S19 and S20†). ESI-MS spectra from HPLC-MS displayed [M − OTf]+ with the expected isotopic distribution. The 1H NMR spectra were recorded in DMSO-d6 or CD3CN, and in every case they show aromatic hydrogen peaks between 6 and 9.5 ppm. Aliphatic signals corresponding to the butyl group (4.9, 1.95, 1.3 and 0.9 ppm) and the ester group (3.6 ppm) of the benzimidazole-based ligands were also observed, whereas the characteristic signal of the NMe2 group of the C^N ligand in complexes Ru2 and Ru4 appeared around 2.9 ppm. The stacked 1H NMR (aromatic region) are shown in Fig. 1. Due to the asymmetry of the C^N ligands, the 1H-NMR spectra of complexes Ru1 and Ru2 showed 16 signals for the diastereomeric protons of the two nonequivalent bpy moieties (Fig. 1). A similar situation is observed for the protons of the two dpq ligands of Ru3 and Ru4, although some overlapping of signals occurred. Proton 1, adjacent to the nitrogen of the benzimidazole core, and proton 9, adjacent to the σ-bound C donor atom of the C^N ligand and shielded due to the shortened Ru—C bond distance, were attributed to all the complexes. Their resonances appear as a singlet and a doublet, respectively, and are the most shielded (6.3–6.7 ppm) of the aromatic protons. Other characteristic resonances of complexes are due to protons 12 + 13 and 14 + 15 and occurred as doublets. Their frequencies depend on the substituent (–R3) of the phenyl ring, giving rise to lower frequencies in the case of Ru2 and Ru4 (containing a NMe2 group) than the other ruthenium complexes, Ru1 and Ru3 (containing a CF3 group). This is due to the electron-donor nature of the substituent, which also affects the shift of the resonances of protons 9, 10, and 11, identified by 1H–1H COSY and 1H–1H NOESY-NMR experiments (Fig. S7–S10 and S11–S14†). In the same manner, we have also identified the aromatic hydrogen peaks in the Ru3 and Ru4 complexes (Fig. 1 and Fig. S7–S18†). It is important to note that protons H19 (in Ru1 and Ru2) and H18 (in Ru3 and Ru4) exhibit the highest degree of deshielding due to the trans influence of the carbon atom.
DCM) in a 25–30% yield fully characterized by elemental analysis and multinuclear NMR spectroscopy (Fig. S1–S18†) and mass spectrometry. The purities of the new Ru complexes were higher than 95% as shown by RP-HPLC/MS in ACN/H2O (Fig. S19 and S20†). ESI-MS spectra from HPLC-MS displayed [M − OTf]+ with the expected isotopic distribution. The 1H NMR spectra were recorded in DMSO-d6 or CD3CN, and in every case they show aromatic hydrogen peaks between 6 and 9.5 ppm. Aliphatic signals corresponding to the butyl group (4.9, 1.95, 1.3 and 0.9 ppm) and the ester group (3.6 ppm) of the benzimidazole-based ligands were also observed, whereas the characteristic signal of the NMe2 group of the C^N ligand in complexes Ru2 and Ru4 appeared around 2.9 ppm. The stacked 1H NMR (aromatic region) are shown in Fig. 1. Due to the asymmetry of the C^N ligands, the 1H-NMR spectra of complexes Ru1 and Ru2 showed 16 signals for the diastereomeric protons of the two nonequivalent bpy moieties (Fig. 1). A similar situation is observed for the protons of the two dpq ligands of Ru3 and Ru4, although some overlapping of signals occurred. Proton 1, adjacent to the nitrogen of the benzimidazole core, and proton 9, adjacent to the σ-bound C donor atom of the C^N ligand and shielded due to the shortened Ru—C bond distance, were attributed to all the complexes. Their resonances appear as a singlet and a doublet, respectively, and are the most shielded (6.3–6.7 ppm) of the aromatic protons. Other characteristic resonances of complexes are due to protons 12 + 13 and 14 + 15 and occurred as doublets. Their frequencies depend on the substituent (–R3) of the phenyl ring, giving rise to lower frequencies in the case of Ru2 and Ru4 (containing a NMe2 group) than the other ruthenium complexes, Ru1 and Ru3 (containing a CF3 group). This is due to the electron-donor nature of the substituent, which also affects the shift of the resonances of protons 9, 10, and 11, identified by 1H–1H COSY and 1H–1H NOESY-NMR experiments (Fig. S7–S10 and S11–S14†). In the same manner, we have also identified the aromatic hydrogen peaks in the Ru3 and Ru4 complexes (Fig. 1 and Fig. S7–S18†). It is important to note that protons H19 (in Ru1 and Ru2) and H18 (in Ru3 and Ru4) exhibit the highest degree of deshielding due to the trans influence of the carbon atom.
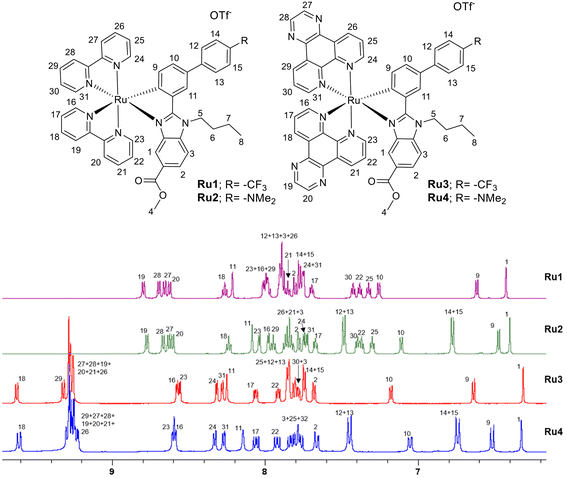 | ||
| Fig. 1 1H NMR stacking spectra (aromatic region) for compounds Ru1–Ru4 in DMSO-d6 along with proton assignment. | ||
Crystal structure by X-ray diffraction
Suitable single crystals of Ru2 for X-ray diffraction analysis were obtained by slow diffusion of diethyl ether into a saturated dichloromethane solution at room temperature for 3 days. The crystal structure of Ru2 is shown in Fig. 2A.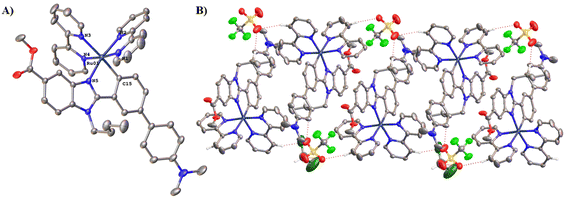 | ||
| Fig. 2 (A) ORTEP plot of the cation of complex Ru2. Hydrogen atoms, counterions and solvent molecules (DCM, diethylether, and H2O) are omitted for clarity. Ellipsoids have been represented at 50% probability. (B) Intermolecular hydrogen bond interactions in the crystal structure of Ru2 give rise to double chains parallel to the direction (1,−1,0). Selected bond lengths (Å) and angles (deg) for Ru2: Ru–N1: 2.040(3), Ru–N2: 2.035(3), Ru–N3: 2.139(3), Ru–N4: 2.059(3), Ru–N5: 2.076(3), Ru–C15: 2.039(3), C15–Ru–N5: 77.90(12), N3–Ru–N4: 77.42(11), N1–Ru–N2: 78.80(12). CCDC reference number for Ru2·CH2Cl2·1/2Et2O·1.75H2O: 2332906.† | ||
Crystallographic data are given in Table S2.† The crystalline structure confirmed the predicted geometry. The Ru complex presents an octahedral geometry around the metal atom with the four nitrogen atoms of the two bpy ligands (N1–N4) and the remaining positions occupied by the C^N ligand. The Ru–Nbpy bond distances (2.035–2.138 Å) and Ru–C15 (2.039(3) Å) are within the range reported for cyclometalated ruthenium.23,28 The trans influence of the σ-bound C donor atom is reflected in longer Ru–N3 distance of 2.138(3) Å. Apart from the important cation–anion Coulomb interactions, the packing in the structure of Ru2 is held together by intermolecular interactions C–H⋯O giving rise to double chains parallel to the direction (1,−1,0) (Table S3† and Fig. 2B).
Photophysical characterization of the compounds
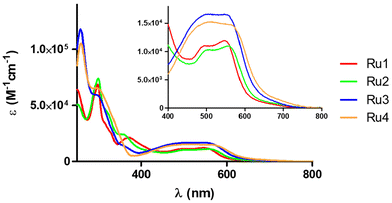
The UV/vis absorption spectra of complexes Ru1–Ru4 (10 μM) were recorded in water (1% dimethylsulfoxide, DMSO) and acetonitrile (Fig. 3 and Fig. S21A and Table S4†) at room temperature. As can be observed in Fig. 3, all the UV/vis absorption spectra of the cyclometalated ruthenium complexes show intense sharp bands between 260 and 340 nm that can be assigned to spin-allowed π–π* transitions involving the N^N and C^N ligands, and other less intense broad bands between 360 and 560 are also observed, which can be attributed to metal–ligand charge transfer transitions (MLCT). As previously described, the lower energy MLCT band can be related to the Ru → N^N charge transfer and the higher energy MLCT band to the Ru → C^N charge transfer.23,29 These charge transitions are characterized by extinction coefficients between 16![[thin space (1/6-em)]](https://www.rsc.org/images/entities/char_2009.gif) 000 and 10
000 and 10![[thin space (1/6-em)]](https://www.rsc.org/images/entities/char_2009.gif) 000 M−1 cm−1, the highest values corresponding to complexes Ru3 and Ru4 that contain the dpq ligand. It should be noted that the observed molar absorption coefficient values in the visible region are suitable for green light-driven applications. The emission spectra of the Ru(II) complexes were recorded in acetonitrile (Fig. S21B†), although none of them were found to be good emitters.
000 M−1 cm−1, the highest values corresponding to complexes Ru3 and Ru4 that contain the dpq ligand. It should be noted that the observed molar absorption coefficient values in the visible region are suitable for green light-driven applications. The emission spectra of the Ru(II) complexes were recorded in acetonitrile (Fig. S21B†), although none of them were found to be good emitters.
![[thin space (1/6-em)]](https://www.rsc.org/images/entities/char_2009.gif) :
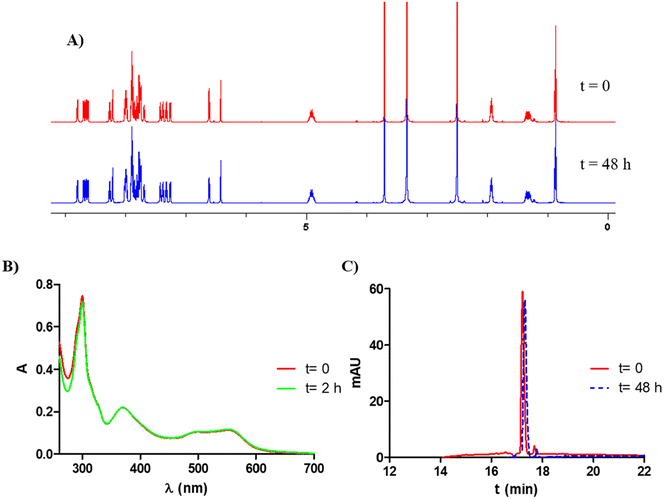
:![[thin space (1/6-em)]](https://www.rsc.org/images/entities/char_2009.gif) water as a mobile phase in gradient mode (Fig. 4A and C for Ru1 and Fig. S22–S24 and Fig. S27–S29† for Ru2–Ru4). No changes were observed in DMSO-d6. In addition, as shown in Fig. 4C, only one single peak was observed in the chromatogram of complex Ru1 (UV detection at 280 nm), the mass spectra of this peak extracted from the chromatogram indicating that compound Ru1 remains intact (Fig. S26†) and suggesting that the complex is not labile in these conditions. On the other hand, photostabilities in DMSO for the investigated complexes were tested under green light irradiation (λ = 520 nm, 2 mW cm−2). As shown in Fig. 4B (for Ru1) and in Fig. S25† (for Ru2–Ru4), their absorption spectra remained unchanged after light exposure for 2 h.
water as a mobile phase in gradient mode (Fig. 4A and C for Ru1 and Fig. S22–S24 and Fig. S27–S29† for Ru2–Ru4). No changes were observed in DMSO-d6. In addition, as shown in Fig. 4C, only one single peak was observed in the chromatogram of complex Ru1 (UV detection at 280 nm), the mass spectra of this peak extracted from the chromatogram indicating that compound Ru1 remains intact (Fig. S26†) and suggesting that the complex is not labile in these conditions. On the other hand, photostabilities in DMSO for the investigated complexes were tested under green light irradiation (λ = 520 nm, 2 mW cm−2). As shown in Fig. 4B (for Ru1) and in Fig. S25† (for Ru2–Ru4), their absorption spectra remained unchanged after light exposure for 2 h.
The Stern–Volmer equation describes dynamic quenching:
In contrast, the Lineweaver–Burk equation is used to describe static quenching:32
As shown in Fig. S31,† the plot of F0/F versus [C] did not show linearity at the concentrations tested (0–25 μM), whereas the plot of 1/(F0 − F) versus 1/[C] showed good linearity for all complexes. In this way, we can confirm that the ruthenium complexes respond to a static quenching mechanism due to their interaction with human serum albumin. The high value of the static quenching constants for all the complexes (∼2 × 10⁵) suggests that the complexes bind effectively to the HSA binding site.
On the other hand, when a small molecule binds to different sites on a macromolecule, an equilibrium is established between free molecules and bound molecules. This balance is given by the Scatchard equation:
| Complex | K LB (M−1) × 105 | K B (M−1) × 106 | n |
|---|---|---|---|
| Ru1 | 2.02 | 6.16 | 1.27 |
| Ru2 | 2.49 | 12.96 | 1.31 |
| Ru3 | 1.76 | 6.12 | 1.28 |
| Ru4 | 2.06 | 6.11 | 1.26 |
Evaluation for 1O2 and/or ˙OH photogeneration in cell-free media
We investigated the ability of ruthenium(II) complexes to produce singlet oxygen, which is the main toxic species for a PS working through the type II mechanism.33 Singlet oxygen production was evaluated spectroscopically in acetonitrile by the decreasing of 1,3-diphenylbenzofuran (DPBF) absorbance at 411 nm (Fig. 5A, Fig. S33 and Table S5†) upon irradiation with green light (520 nm, 0.5 mW cm−2) in the presence of complexes Ru1–Ru4 (4–7 μM). To obtain singlet oxygen quantum yields, [Ru(bpy)3]Cl2 (50 μM) was used as a reference.23,34 As observed, the new ruthenium complexes exhibit a low singlet oxygen quantum yield, the major producers being Ru1 and Ru3 (∼15%), which contain the –CF3 group.We also investigated the ability of the new compounds to produce hydroxyl radical OH˙, a specific type-I ROS that could provide the potential to inhibit hypoxic tumor cells, in PBS (5% DMF) by using a spectroscopic method based on the oxidation of the non-fluorescent 3′-p-(hydroxyphenyl)fluorescein (HPF) probe by OH˙ to the corresponding fluorescent product.35,36 As shown in Fig. 5B and Fig. S34,† under green light irradiation, both Ru1 and Ru3 increased the fluorescence intensity of HPF, whereas Ru2 and Ru4 did not produce hydroxyl radicals in the tested conditions. We can conclude that the substituent plays an important role in the generation of ROS (both singlet oxygen and hydroxyl radicals) in cell-free media.
Effect on the viability of cancer cells
The impact of the investigated Ru-complexes on cancer cells in the dark and after photoactivation was tested on three different human cancer cell lines, namely HeLa (cervical adenocarcinoma), OE33 (oesophageal carcinoma), and A375 cells (melanoma). These cell lines were chosen because these tumor tissue types are readily available for PDT therapy. The MRC5pd30 cell line was also taken into the experiment as a representative of noncancerous, healthy cells.The data summarized in Table 2 reveal that the investigated Ru complexes display activity in cancer cells in the dark. Within the investigated complexes, Ru3 and Ru4 bearing dipyrido[3,2-d:2′,3′-f]quinoxaline (dpq) ligands were more active in the dark than 2,2′-bipyridine (bpy)-containing Ru1 and Ru2. The antiproliferative potency of the four Ru complexes was enhanced by irradiation with green light; the complexes after irradiation were roughly 2–13 times more active compared with the treatment in the dark. However, as the complexes with the bpy-ligands displayed lower toxicity in the dark, their phototoxicity indexes were higher than those found for dpq-containing complexes.
| HeLa (normoxia) | HeLa (hypoxia) | OE33 (normoxia) | A375 (normoxia) | MRC5pd30 | TI | TI | |||||||||
|---|---|---|---|---|---|---|---|---|---|---|---|---|---|---|---|
| Dark | Irrad | PI | Dark | Irrad | PI | Dark | Irrad | PI | Dark | Irrad | PId | Dark | |||
| a Data represent the mean ± SD from at least three independent experiments, each made in triplicate. b 21% O2 + 5% CO2. c 2% O2 + 5% CO2. d PI (phototoxic index) = [IC50]dark/[IC50]irrad. e TI (therapeutic index) = [IC50]MRC5pd30/average of [IC50]HeLa, OE33, A375 (irrad in normoxia). f TI = [IC50]MRC5pd30/average of [IC50]HeLa, OE33, A375 (dark in normoxia). n.d. – not determined, N/A = not applicable. | |||||||||||||||
| Ru1 | 3.5 ± 0.8 | 0.31 ± 0.08 | 11.3 | 3.5 ± 0.8 | 0.9 ± 0.3 | 3.9 | 9.0 ± 0.2 | 0.7 ± 0.1 | 12.9 | 3.3 ± 0.9 | 0.4 ± 0.1 | 8.3 | 2.4 ± 0.1 | 5.1 | 0.5 |
| Ru2 | 4 ± 1 | 0.4 ± 0.1 | 10 | 6 ± 1 | 1.7 ± 0.3 | 3.5 | 4 ± 1 | 0.4 ± 0.1 | 10 | 1.6 ± 0.3 | 0.14 ± 0.04 | 11.4 | 0.8 ± 0.1 | 2.6 | 0.3 |
| Ru3 | 2.6 ± 0.8 | 0.71 ± 0.06 | 3.6 | 2.1 ± 0.7 | 0.7 ± 0.1 | 3 | 3.8 ± 0.4 | 1.0 ± 0.2 | 3.8 | 1.9 ± 0.3 | 0.5 ± 0.2 | 3.8 | 4.9 ± 0.4 | 6.7 | 1.8 |
| Ru4 | 1.2 ± 0.2 | 0.5 ± 0.1 | 2.6 | 1.1 ± 0.1 | 0.5 ± 0.1 | 2.2 | 3.2 ± 0.8 | 1.8 ± 0.3 | 1.8 | 0.7 ± 0.1 | 0.36 ± 0.09 | 1.9 | 2.3 ± 0.5 | 2.6 | 1.4 |
| Cisplatin | 15 ± 1 | n.d. | N/A | n.d. | n.d. | N/A | 10 ± 2 | n.d. | N/A | 12 ± 1 | n.d. | N/A | 7.8 ± 2.0 | N/A | 0.6 |
The antiproliferative activity of the investigated Ru complexes was also determined in HeLa cells under hypoxic conditions (2% O2). The compounds were also significantly active in hypoxia (Table 2). The Ru complexes exhibited comparable IC50 values (in the range of experimental error) under both normoxic and hypoxic conditions. Photoactivation in hypoxia resulted in higher IC50 values and lower phototoxic indexes compared with normoxia, especially for the bpy-containing complexes (Ru1 and Ru2). On the other hand, the dpq-containing complexes (Ru3 and Ru4) showed consistent photoactivity under both conditions, indicating a differential role of oxygen in the photoactivation mechanism.
We also conducted MTT studies with healthy human lung fibroblast MRC5pd30 cells. All Ru complexes were generally less potent (2.5–5.3 times) toward noncancerous cells compared with cancer cells. This contrasts with clinically used cisplatin, which showed no preference for cancer over noncancerous cells (Table 2).
Further experiments were aimed at a deeper description of the mechanism underlying the photoactivity of the investigated Ru complexes. For these experiments, HeLa cells were used to compare already published data obtained with a series of Ir(III) polypyridyl complexes reported by some of us.35,37
Intracellular accumulation and distribution
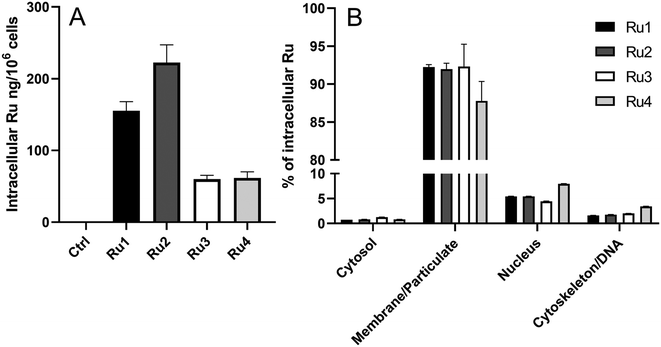
Intracellular uptake and accumulation of compounds significantly affect their biological activity. Therefore, the amount of Ru accumulated inside the HeLa cells treated with the investigated complexes was determined using ICP-MS. Data are summarized in Fig. 6A. As indicated, compounds Ru1 and Ru2 containing bpy-ligands accumulated significantly more in HeLa cells than dpq-containing Ru3 and Ru4. There was no direct correlation between the ability of the compounds to accumulate in the cells and their activity in the dark. Interestingly, complexes with elevated accumulation were those that were more efficient in photoactivation.To find out where Ru complexes localize inside the cells, fractionation of HeLa cells treated by the Ru complexes was performed using a FractionPREP™ Cell Fractionation Kit. For this localization study, we preferred this methodology over the methodology using confocal microscopy, as the investigated Ru complexes show unfavorable fluorescence properties (excitation in the UV region and rather poor emission). As shown in Fig. 6B, the vast majority of Ru (87–92%) was associated with a membrane fraction, in accordance with the high lipophilicity of the complexes. Only a small portion of Ru (ca. 5–8%) was found in the nucleus (nuclear proteins and membrane), while the quantity found in the cytosol and cytoskeleton/DNA was negligible.
ROS generation and oxidative stress
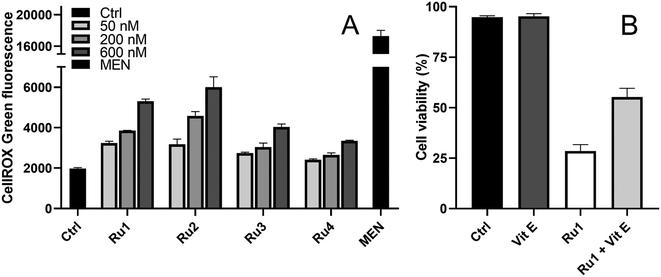
The cytotoxicity data obtained for normoxic and hypoxic conditions (Table 2) revealed the important role of the oxygen concentration in the mechanism of photopotentiation of the two bpy-containing complexes, Ru1 and Ru2. Thus, it is reasonable to suggest that reactive oxygen species (ROS) could play an essential role in the mechanism of action of the complexes, similar to several structurally related Ru compounds (complex RuA in Scheme 1).22 Therefore, the generation of ROS by the Ru complexes under irradiation conditions was investigated by the CellROX Green assay. As shown in Fig. 7A, fluorescence signals (proportional to levels of ROS) in HeLa cells were elevated upon exposure to the Ru complexes under irradiation. Ru1 and Ru2 were more potent in this respect than Ru3 and Ru4, consistent with the dependence of the antiproliferative activity of bpy-containing complexes on oxygen concentration (Table 2).To further explore the causative role of oxygen and oxidative stress in the photoactivity of the complexes investigated in this study, the effect of co-incubation of Ru1 with α-tocopherol (vitamin E, a potent ROS scavenger) has been tested. As indicated in Fig. 7B, the presence of the antioxidant mitigated the phototoxic effect of Ru1, confirming the involvement of ROS in the mechanism of phototoxicity of this compound.
Further studies were aimed at understanding the mechanism of biological activity of the investigated Ru complexes. Ru1 was chosen as a representative compound for these experiments since it exhibited high activity and attractive phototoxic or therapeutic indexes (Table 2).
The treated cells showed features of oncosis
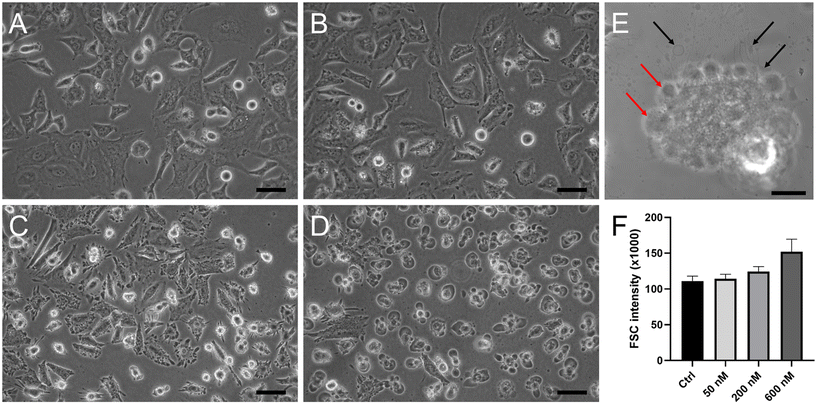
While untreated HeLa cells showed the typical epithelial-like polygonal shape morphology (Fig. 8A), the cells treated with Ru1 and irradiated displayed distinctive morphological features (shown for Ru1 in Fig. 8B–D). As shown in Fig. 8B, low concentrations of the irradiated Ru compound triggered subtle cytoplasmic membrane blebbing in a minor population of cells. On the other hand, higher doses led to severe distortions of the membrane (Fig. 8C), resulting in cytoplasmic protrusions into the extracellular fluid (Fig. 8D). Similarly, small cytoplasmic blebs were observed immediately after irradiation, while after 4 h, morphological alterations typical of oncosis were evident, such as cytoplasm vacuolization when the vacuoles filled up almost the entire cell volume. The whole cells were swollen and rounded (Fig. S35†). Confocal microscopy images confirmed cytoplasm leakage (Fig. 8E, black arrows) and the formation of membrane blebs in the later stages of cell death (Fig. 8E, red arrows). This distinct morphological feature is indicative of the type of cell death termed oncosis. Oncosis is caused by rapid ATP depletion or severe damage to the cell membrane, manifested by cellular swelling, membrane blebbing, or the formation of a single blister devoid of organelles. To confirm cell swelling at the quantitative level, changes in cellular volume were determined by flow cytometry recording the forward scatter (FSC) parameter, which is proportional to cell size. The cells treated with the investigated Ru compounds and irradiated increased dose-dependently in size, confirming the increase in volume due to cellular swelling (Fig. 8F).To support the conclusion made on the basis of cell morphology, we tested some markers typical of oncosis. A surface receptor, porimin (pro-oncosis receptor inducing membrane injury), plays a key role in the abnormal permeability of the membrane resulting in the characteristic swelling of the entire cell during oncosis. The activation of porimin is considered an indicator of oncotic cell death.38
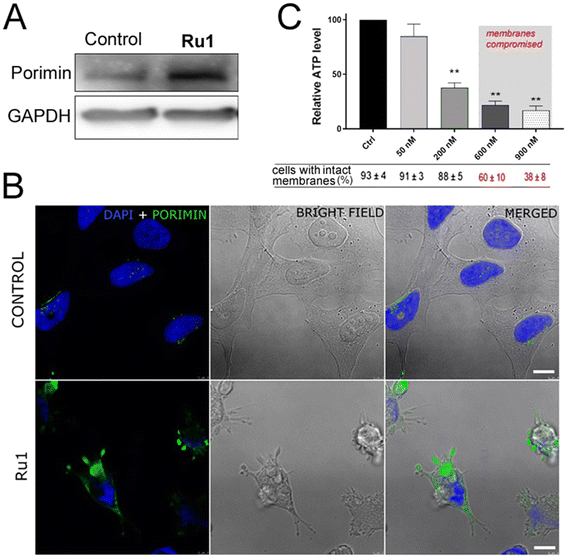
As indicated in Fig. 9A, B, and S36,† an elevated expression of porimin upon incubation with Ru1 and subsequent irradiation was clearly demonstrated by both western blotting analysis (Fig. 9A) and confocal microscopy (Fig. 9B and S36†).
ATP level is also a critical factor in oncosis.39 A decrease in intracellular ATP concentration occurs very rapidly after various lethal processes, although it is most important in processes leading to oncosis. In most mammalian cells, reduced ATP rapidly leads to de-energization of the Na+/K+-ATPase followed by an increase in concentration of Na+ and Cl− accompanied by water influx and cellular swelling.40 Therefore, the effect of irradiated Ru1 on intracellular ATP depletion was also tested. As shown in Fig. 9C, the ATP level of cells after treatment and irradiation with Ru1 proved a rapid decrease, as compared with that in the control irradiated cells. The effect was already observable at low concentrations (50 and 200 nM) in the short time intervals (1 h) when the cell membranes of the vast majority of the cell population were still impermeable.
Thus, both early ATP depletion and porimin expression shown in these experiments support the oncosis as an overriding mechanism of a cell's death induced by Ru1 under irradiation.
Cell cycle distribution revealed differential sensitivity of G1 and G2/M phase cells
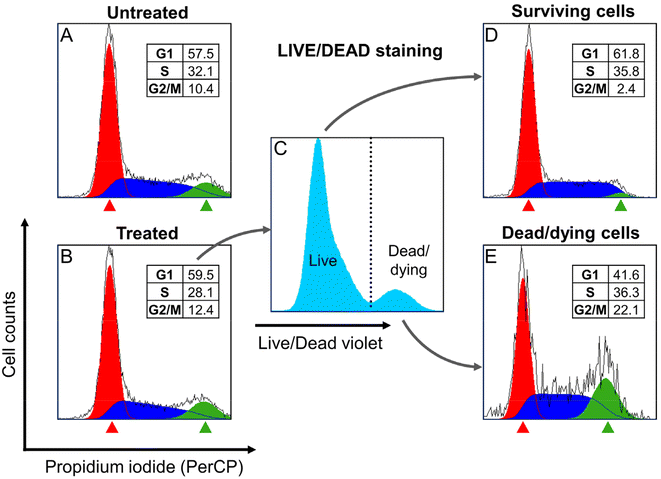
To assess whether the treatment with Ru1 and subsequent irradiation triggered cell cycle arrest, we measured the cell cycle distribution of HeLa cells after their treatment with Ru1 and irradiation with green light. Distribution of the cell population into cell cycle phases was measured using propidium iodide (PI) staining with the prior determination of cell membrane permeability using a LIVE/DEAD Staining Kit (Invitrogen, L34955). Analyzed cells were fixed by ethanol, RNA digested, stained with PI, and analyzed by flow cytometry (Fig. 10). Interestingly, no apparent differences in the cell cycle distribution were observed among bulk populations of treated or non-treated cells (Fig. 10A and B). However, when treated cells were divided into surviving or dead/dying populations using LIVE/DEAD staining (Fig. 10C), large differences in cell cycle distribution emerged (Fig. 10D and E). Cells that survived the treatment were slightly accumulated in the G1 phase, indicating their increased resistance to the treatment. In contrast, dead/dying cells were enriched in the G2/M phase, indicating a higher sensitivity of G2/M phase cells to treatment. This experiment demonstrated the dependence of the sensitivity of HeLa cells to treatment on a specific phase of the cell cycle.Previous results showed that the cells in the G2/M phase are more sensitive to the action of Ru1 than those in the G1 phase. The next experiments were, therefore, performed to clarify this difference in sensitivity.
The important feature of cells in the G2/M phase is the higher content of DNA, which cells synthesize during the preceding S-phase. This fact might suggest that DNA could be a target of Ru1, given that the higher DNA content sensitized cells to the treatment. To test this hypothesis, we performed an experiment using model plasmid DNA. Intact plasmid DNA was mixed with Ru1 in a 1![[thin space (1/6-em)]](https://www.rsc.org/images/entities/char_2009.gif) :
:![[thin space (1/6-em)]](https://www.rsc.org/images/entities/char_2009.gif) 10 (compound
10 (compound![[thin space (1/6-em)]](https://www.rsc.org/images/entities/char_2009.gif) :
:![[thin space (1/6-em)]](https://www.rsc.org/images/entities/char_2009.gif) DNA base) ratio and irradiated for various intervals. Samples were then subjected to electrophoresis, and DNA was visualized with ethidium bromide staining. The results (Fig. S37†) provided clear evidence for DNA photocleavage by the complex, consistent with the formation of ROS after irradiation of Ru1. However, a negligible amount of Ru was associated with DNA in cells (Fig. 6B), which suggests that DNA, while it can be damaged, is unlikely to be the major target for the Ru complexes studied in this work.
DNA base) ratio and irradiated for various intervals. Samples were then subjected to electrophoresis, and DNA was visualized with ethidium bromide staining. The results (Fig. S37†) provided clear evidence for DNA photocleavage by the complex, consistent with the formation of ROS after irradiation of Ru1. However, a negligible amount of Ru was associated with DNA in cells (Fig. 6B), which suggests that DNA, while it can be damaged, is unlikely to be the major target for the Ru complexes studied in this work.
Interestingly, it was demonstrated that cells in the S or G2/M phase accumulate lipophilic compounds to a greater extent than cells in the G1 phase. The proposed mechanism of the increased uptake of lipophiles by G2/M cells involves the greater metabolic activity of these cells or a greater cell surface area through which the cells accumulate the lipophilic compounds.41 Thus, a reasonable explanation for the difference in cell sensitivity of different cell cycle phases could be attributed to the larger surface area, which would be consistent with the predominant accumulation of the complex in cellular membranes.
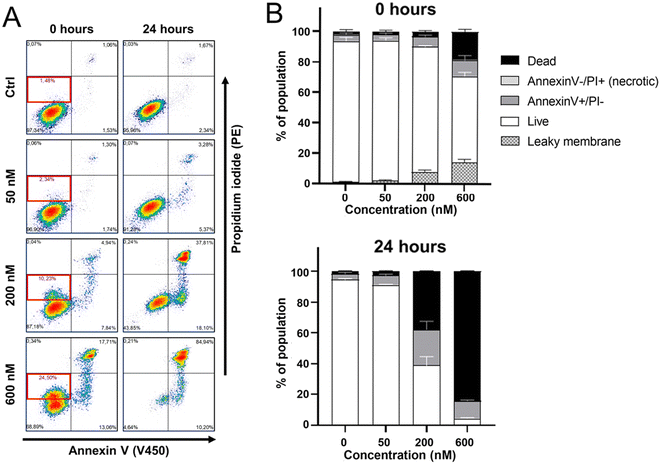
Annexin V/propidium iodide staining confirmed oncosis and showed membrane permeabilization
Annexin V/propidium iodide (PI) staining was conducted to determine the mode of cell death occurring in HeLa cells after their treatment with Ru1 (1 h) and irradiation with green light (1 h). As shown in Fig. 11A and B flow cytometric analysis revealed that the treatment with Ru1 followed by irradiation increased an annexin V positive and PI negative fraction of cells. It was previously shown42,43 that oncotic cells showed annexin V positivity, similar to apoptotic cells. Morphological features should be the main discriminating factor in distinguishing between apoptosis and oncosis.44 The increased positivity for annexin V observed in treated HeLa cells together with specific morphological features (Fig. 8) and oncotic markers (Fig. 9), as well as with non-activation of caspases 3/7 (apoptotic caspases, Fig. S38†), thus confirmed the ability of irradiated Ru1 to induce the oncotic pathway of cell death. Our data (the right upper quadrant in Fig. 11A) also indicate that treating HeLa cells with Ru1 and irradiation led to an elevation in the population of dead cells. Most treated cells died between 0–24 h post-irradiation, suggesting that acute cytotoxicity is the predominant cytostatic factor.Additionally, the results shown in Fig. 11 revealed that immediately after irradiation (t = 0 h), a subset of cells became slightly PI-positive (red bordered area in the left bottom quadrant in Fig. 11A). This indicates a mild cytoplasmic membrane permeabilization that allowed the impermeable dye to penetrate the cells partially. As permeabilization of the cytoplasmic membrane is a sign of oncosis,45 this result further supports the connections of photoactivity of Ru1 with the initiation of oncotic pathways.
It is notable that certain heteroleptic Ir(III) dppz complexes of the type [Ir(C^N)2(dppz)]37 demonstrated cytoplasmic localization within HeLa tumor cells and induced oxidative stress upon exposure to visible light. Subsequently, a second generation of Ir(III) dppz complexes, as highlighted in a recent study,35 exhibited selective phototoxicity in HeLa cancer cells, leading to lysosomal damage and oncosis.
Ru-complex compromises intracellular membranes
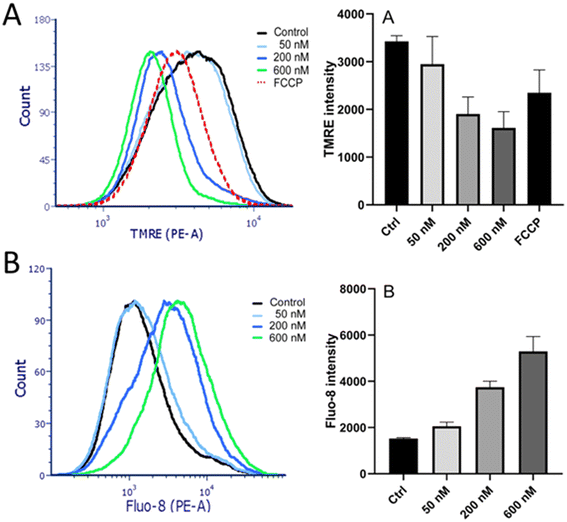
The results of the experiments mentioned above have shown that Ru-complexes preferentially accumulate within cellular membranes (Fig. 6). In addition to the cytoplasmic membrane, the membrane fraction also includes membranes encapsulating subcellular organelles, such as mitochondria and endoplasmic reticulum (ER). Therefore, further experiments were aimed at finding out whether the photoactivity of Ru1 was related also to the damage to these intracellular membranes.A TMRE assay was employed to examine whether mitochondrial membranes were also affected. A fluorescent TMRE stain accumulates in mitochondria due to the negative mitochondrial membrane potential. Maintenance of highly polarized mitochondrial membranes relies on intact membranes, and their permeabilization would result in membrane potential dissipation. TMRE fluorescence intensity in HeLa cells treated with Ru1 and irradiated was measured by flow cytometry. Carbonyl cyanide-p-trifluoromethoxy-phenylhydrazone (FCCP), a hydrogen ionophore that disrupts the hydrogen gradient in mitochondria, was used as a positive control. The cells treated with Ru1 and irradiated displayed a markedly reduced mitochondrial membrane potential (Fig. 12A), suggesting mitochondrial membrane disturbance.
The ER is a cellular organelle playing essential roles in various cellular responses. Notably, the ER stores calcium (Ca2+) and maintains the low levels of cytoplasmic Ca2+ required for cellular signaling. Consequently, perturbation of the ER leads to elevated cytoplasmic Ca2+ levels. Calcium release from ER into the cytoplasm of HeLa was studied using the calcium-sensitive fluorescent probe Fluo-8 AM. The cells were treated in PBS (medium containing no Ca2+), so the increase in cytosolic Ca2+ level observed in this experiment could not be attributed to the intake of extracellular Ca2+ due to the compromised cytoplasmic membrane. Incubation with Ru1 followed by irradiation resulted in a significant elevation of cytoplasmic Ca2+ levels in a dose-dependent manner (Fig. 12B). Thus, the results confirmed that the intracellular membranes, such as those of ER or mitochondria, could be damaged by Ru1 when irradiated with green light.
Studies of the mechanism of membrane permeabilization
Further experiments were aimed to assess whether the cytoplasmic and/or intracellular membranes were permeabilized due to direct damage by Ru1 to membrane components (i.e., phospholipids and proteins) or whether it is a downstream cell response. A fluorescence dequenching-based liposome leakage assay was used for these experiments.46,47 Since this assay identifies direct damage to the membrane's lipid components, it can exclude both the effects of damage to membrane proteins and any downstream damage inflicted by the cells. Liposomes consisting of 18:0 DSPC (1,2-distearoyl-sn-glycero-3-phosphocholine), 18:1 DOPC (1,2-dioleoyl-sn-glycero-3-phosphocholine), cholesterol, and DSPE-PEG2000 (1,2-distearoyl-sn-glycero-3-phosphoethanolamine)-N-[amino(polyethylene glycol)-2000] in molar ratios 30![[thin space (1/6-em)]](https://www.rsc.org/images/entities/char_2009.gif) :
:![[thin space (1/6-em)]](https://www.rsc.org/images/entities/char_2009.gif) 40
40![[thin space (1/6-em)]](https://www.rsc.org/images/entities/char_2009.gif) :
:![[thin space (1/6-em)]](https://www.rsc.org/images/entities/char_2009.gif) 25
25![[thin space (1/6-em)]](https://www.rsc.org/images/entities/char_2009.gif) :
:![[thin space (1/6-em)]](https://www.rsc.org/images/entities/char_2009.gif) 5 were prepared by the film-hydration method followed by extrusion through a 200 nm pore membrane. The composition and representation of phospholipids was chosen based on previous work and represents a suitable model of real cell membranes.48,49 In the liposomes, the self-quenching concentration of carboxyfluorescein was encapsulated. Upon liposome permeabilization or rupture, the fluorescent dye is released into the solvent, increasing fluorescence intensity.
5 were prepared by the film-hydration method followed by extrusion through a 200 nm pore membrane. The composition and representation of phospholipids was chosen based on previous work and represents a suitable model of real cell membranes.48,49 In the liposomes, the self-quenching concentration of carboxyfluorescein was encapsulated. Upon liposome permeabilization or rupture, the fluorescent dye is released into the solvent, increasing fluorescence intensity.
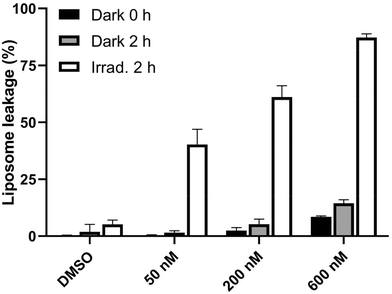
As shown in Fig. 13, upon treatment of liposomes with Ru1 followed by irradiation with green light for 2 h, the fluorescence showed a noticeable rise, indicating severe damage to phospholipid membranes. A slight increase in fluorescence was observed after a 2 h treatment in the dark. However, if liposomes were incubated with Ru1 and irradiated for 2 h, a striking increase in fluorescence was detected. Consequently, these findings imply that the irradiated Ru1 can directly damage the lipid components of cell membranes, potentially playing a substantial role in the phototoxicity of this ruthenium complex.
The investigated Ru compounds interact with proteins
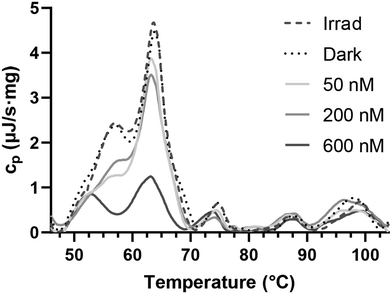
Previous experiments demonstrated the capacity of the investigated Ru compounds to compromise cellular membranes by directly damaging the phospholipids. As proteins are also present in biological membranes, our next investigations were focused on assessing the impact of the investigated Ru compounds on proteins. As shown above, Ru1–Ru4 were able to bind to HSA (Table 1). Next, we aimed to assess whether the ability of the investigated Ru complexes to interact with and distort proteins observed in a cell-free medium (Fig. S30†) is also manifested after the treatment of cancer cells with these complexes. We employed differential scanning calorimetry (DSC) to measure protein denaturation in whole-cell suspensions. DSC measures the heat capacity (cp) of the sample in relation to its temperature. Native proteins typically exhibit high cp values, whereas denatured proteins display lower cp. In the past, DSC profiles of intact HeLa cells were recorded, associating peaks with specific transition temperatures to distinct cellular components.13 Notably, peaks within the temperature range of 40–70 °C were linked to cytoplasmic and membrane proteins, while peaks at higher transition temperatures correspond to nuclear proteins and DNA.DSC profiles derived from both control cells and cells treated with Ru1 (Fig. 14) primarily exhibited distinctions in peaks associated with transition temperatures corresponding to cytoplasmic and membrane proteins.50 On the other hand, minimal variation was observed in DSC profiles at higher temperatures (70–105 °C), suggesting that the nucleus was the unlikely target of the investigated Ru compounds. Acquired data further confirm our earlier findings (Fig. 6B) that the investigated Ru compounds accumulate in membrane-rich compartments and that nuclear DNA is not significantly influenced. Thus, the results obtained using DSC clearly confirm that the phototoxic effect of Ru1 on living HeLa cells consists also of the damage to protein components of the cells.
Conclusions
In summary, we designed and synthesized novel octahedral Ru(II) complexes, Ru1–Ru4, of the type [Ru(C^N)(N^N)2][CF3SO3] with a rational choice of the C^N and N^N ligands, based on the cooperation of bpy and dpq as chromophores with deprotonated methyl 1-butyl-2-aryl-benzimidazolecarboxylate C^N ligands, p-CF3C6H4 or p-Me2NC6H4 being substituents in the R3 position of the phenyl ring. The new Ru complexes were able to generate 1O2 upon green light irradiation (λ = 520 nm) in acetonitrile, Ru1 and Ru3 (containing the CF3 group) being the best performers (1O2 quantum yields of 0.15). In addition, Ru1 and Ru3 were also able to photogenerate hydroxyl radicals OH˙ in free cell assays, it being well known that the PSs capable of following both PDT type I and type II mechanisms in cancer treatment offer enhanced efficacy by inducing cell damage through a broader range. Ru1–Ru4 accumulated in membrane-rich compartments, including the cytoplasmic membrane, mitochondria, and endoplasmic reticulum in HeLa cells. Upon irradiation with green light, the complexes also photoproduced ROS at the cellular level. Our studies showed that compound Ru1 under irradiation has the capability to disrupt phospholipid membranes directly, provoking also mitochondrial membrane depolarization. Additionally, differential scanning calorimetry of living cells also indicated the denaturation of cytoplasmic/membrane proteins, ultimately leading to cell death via oncosis, as shown by FACS and confocal microscopy.Materials and methods
Reagents and chemicals
Synthesis-grade solvents were employed in all cases. Deuterated solvents were purchased from Euriso-top. [Ru(η6-p-cymene)Cl2]2, sodium bisulfite, tetrakis(triphenylphosphine)palladium(0), 2,2′-bipyridine, sodium acetate and sodium triflate were obtained from Merck (Madrid, Spain). Proligands HL1 and HL2 were synthesized following a synthetic procedure published by some of us (Scheme S1†).25 The purities ≥95% of the synthesized complexes used for biological evaluation were determined by RP-HPLC.Preparation of new Ru(II) complexes
[Ru(η6-p-cymene)Cl2]2 (61.2 mg, 0.1 mmol), potassium acetate (59 mg, 0.6 mmol), potassium triflate (75.3 mg, 0.4 mmol) and the corresponding proligand (0.2 mmol), previously synthesized, were added to a microwave tube, dissolved in acetonitrile and stirred at 80 °C for 1 h. The solvent was then removed under reduced pressure and the crude product was dissolved in methanol. Then, the corresponding N^N ligand (0.3 mmol) was added to the solution and stirred at 65 °C for 7 h. The solvent was removed, and the crude solid was purified in alumina column chromatography with a gradient from DCM/CH3CN 9![[thin space (1/6-em)]](https://www.rsc.org/images/entities/char_2009.gif) :
:![[thin space (1/6-em)]](https://www.rsc.org/images/entities/char_2009.gif) 1 to DCM/CH3CN 1
1 to DCM/CH3CN 1![[thin space (1/6-em)]](https://www.rsc.org/images/entities/char_2009.gif) :
:![[thin space (1/6-em)]](https://www.rsc.org/images/entities/char_2009.gif) 1. Finally, ruthenium complexes were recrystallized using dichloromethane and hexane to obtain a dark-red solid.
1. Finally, ruthenium complexes were recrystallized using dichloromethane and hexane to obtain a dark-red solid.
X-ray structure determinations
Intensities were registered at low temperature on a Bruker D8 QUEST diffractometer using monochromated Mo Kα radiation (λ = 0.71073 Å). Absorption corrections were based on multi-scans (program SADABS).51 Structures were refined anisotropically using SHELXL-2018.52 Hydrogen atoms were included using rigid methyl groups or a riding model.![[thin space (1/6-em)]](https://www.rsc.org/images/entities/char_2009.gif) :
:![[thin space (1/6-em)]](https://www.rsc.org/images/entities/char_2009.gif) 20%. In the crystal, molecules are linked via C—H⋯O non-classical hydrogen bonds, leading to the formation of double chains in the [1,−1,0] direction.
20%. In the crystal, molecules are linked via C—H⋯O non-classical hydrogen bonds, leading to the formation of double chains in the [1,−1,0] direction.
Microwave
The first step in the synthetic route for ruthenium complexes was done in an Anton Paar Monowave 50 (315 W) microwave.Nuclear magnetic resonance (NMR) spectroscopy
The 1H, 13C{1H}, and bidimensional NMR spectra were recorded on a Bruker AC 300E, Bruker AV 400, or Bruker AV 600 NMR spectrometer, and chemical shifts were determined by reference to the residual 1H and 13C{1H} solvent peaks.Elemental analysis
The C, H, N, and S analyses were performed with a Carlo Erba model EA 1108 microanalyzer with EAGER 200 software.Mass spectrometry (MS)
ESI mass (positive mode) analyses were performed on an RP/MS TOF 6220. The isotopic distribution of the heaviest set of peaks matched very closely to that calculated for formulating the complex cation in every case.Photophysical characterization
UV/vis spectroscopy was performed on a PerkinElmer Lambda 750 S spectrometer with operating software. Solutions of all complexes were prepared in acetonitrile and water (1% DMSO) at 10 μM. For measuring the photostability, ruthenium complexes (10 μM) were dissolved in an air-saturated DMSO solution and irradiated with green light (2 mW cm−2) for 2 h.Reaction with human serum albumin (HSA)
The stock solution of HSA was prepared by dissolving the HSA in 50 mM Tris-HCl, 100 mM NaCl buffer of pH 7.4. The concentration of HSA was determined by using ε278 = 36![[thin space (1/6-em)]](https://www.rsc.org/images/entities/char_2009.gif) 000 M−1 cm−1.31
000 M−1 cm−1.31
Quantitative analyses of the interaction between Ru1–Ru4 complexes and HSA were performed by fluorimetric titration. A 3.0 mL portion of aqueous protein solution (2.5 μM) was titrated by successive additions of complex solution (0–25 μM). For each addition, the mixing solution was stirred and allowed to stand for 5 min. Fluorescence intensities were then measured at excitation wavelengths of λ = 295 nm. The width of the excitation and emission slit was set at 5 nm, and the emission fluorescence spectra were recorded in the wavelength range λ = 305–570 nm.
Singlet oxygen quantum yield
Singlet oxygen quantum yields were calculated in aerated acetonitrile solution using 1,3-diphenylbenzofuran (DPBF) as a chemical trap upon green light irradiation and using [Ru(bpy)3]Cl2 as a reference. Photolysis of DPBF in the presence of ruthenium complexes was monitored by UV/vis, absorbance of DPBF at 411 was plotted against irradiation times and slopes were calculated. Finally, singlet oxygen quantum yields were calculated using the following equation:where ΦΔr is the singlet oxygen quantum yield of the reference, as said [Ru(bpy)3]Cl2 (ΦΔr = 0.57 in acetonitrile), m are the slopes of the complexes and the reference, and Aλs and Aλr are the absorbance of the compounds and reference at the irradiation wavelength (520 nm), respectively.
Hydroxyl radical generation in cell free media
All compounds (10 μM) were prepared in PBS (5% DMF). To this solution, HPF was added with a final concentration of 10 μM. Then samples were irradiated by green light (520 nm, 2.0 mW cm−2) for indicated time intervals. Fluorescence spectra were obtained with a Horiba Jobin Yvon Fluorolog 3–22 modular spectrofluorometer with a 450 W xenon lamp. Measurements were performed in a right-angled configuration using 10 mm quartz fluorescence cells for solutions at 298 K. The excitation wavelength was set to 490 nm and the excitation and emission slit widths were 3 nm.Biological studies
Ru accumulation in cells
A Petri dish (100 mm) was covered with cells and incubated until the cells filled about 80% of the growth area. Then, the growth medium was replaced with EBSS containing 5 μM of the studied compounds for 2 h. The cells were extensively washed with cold PBS and trypsinized, and the cell pellets were rinsed with PBS. The cells were counted and mineralized by adding 200 μL of 35% HCl and incubated for at least one week. Samples were then diluted with ultrapure water to a final volume of 1500 μL, and the Ru content was assessed by ICP-MS.Subcellular distribution of Ru
The cells were prepared in the same manner as for the uptake experiments, including the same treatment conditions. After harvesting the cells by trypsinization, the pellet was divided into four fractions (cytosolic, membrane/particulate, nuclear, and cytoskeletal) using the FractionPREP Cell Fractionation kit (BioVision, K270) according to the manufacturer's instructions. Each fraction was freeze-dried, resuspended in 200 μL of 35% HCl, and mineralized for at least one week. Samples were then diluted with ultrapure water to a final volume of 1500 μL, and the Ru content was assessed by ICP-MS.ROS
HeLa cells (4 × 10⁴) were seeded on a 96-well plate in cultivation media and left to adhere overnight. The cells were then treated with indicated concentrations of the studied compounds and irradiated (see Treatment and irradiation of cells in Materials and methods). The cells were washed with PBS and stained with 5 μM CellROX Green (Invitrogen, C10444) in PBS for 30 min at 37 °C. 100 μM menadione (Sigma-Aldrich, M5625, dissolved in DMSO) was used as a positive control of ROS induction for 1 h in the cultivation medium. After staining, the cells were washed with PBS and harvested by trypsinization. Fluorescence was measured using flow cytometry (BD FACSVerse).Antioxidants
HeLa cells (3 × 10⁵) were seeded on a 6-well plate in cultivation media or media supplemented with 200 μM alpha-tocopherol (Thermo Scientific Chemicals, A17039.18, dissolved in 100% EtOH) and cultivated for 24 h. The cells were treated with 200 nM Ru1 and irradiated (see Treatment and irradiation of cells in the section Materials and methods). All floating and adherent cells were collected by trypsinization and stained with a LIVE/DEAD Staining Kit (Invitrogen, L34955) according to the manufacturer's instructions. After staining, the cells were centrifuged, and the pellet was resuspended in PBS and analyzed by flow cytometry (BD FACSVerse).Morphology evaluation
HeLa cells were seeded on a 6-well plate at a density of 3 × 10⁵ cells per well in cultivation media and incubated overnight. The cells were treated with indicated concentrations of Ru1 followed by irradiation (see Treatment and irradiation of cells in the section Materials and methods). The cells were then photographed using an Olympus CKX41 inverted microscope equipped with a Canon EOS 1200D camera. Details of HeLa cells treated with 200 nm Ru1 were acquired by a confocal microscope Olympus FV10i. For cell size quantification, the treated cells (as previously described) were harvested by trypsinization and analyzed by flow cytometry (BD FACSVerse).![[thin space (1/6-em)]](https://www.rsc.org/images/entities/char_2009.gif) 000g; 10 min) and combined with 2 × LBS buffer (4% sodium dodecyl sulfate (SDS); 10% 2-mercaptoethanol; 20% glycerol; 0.125 M Tris-HCl and 0.004% bromophenol blue) and heated for 5 min at 95 °C. The samples were separated by SDS-PAGE (4–15%; Mini-PROTEAN® TGX™ Precast Gels), and transferred to PVDF membrane, and porimin and GAPDH were detected using specific primary antibodies (Anti-Porimin (G2) (Santa Cruz Biotechnology, sc-377295), Anti-GAPDH antibody (Sigma-Aldrich, G8795; 1
000g; 10 min) and combined with 2 × LBS buffer (4% sodium dodecyl sulfate (SDS); 10% 2-mercaptoethanol; 20% glycerol; 0.125 M Tris-HCl and 0.004% bromophenol blue) and heated for 5 min at 95 °C. The samples were separated by SDS-PAGE (4–15%; Mini-PROTEAN® TGX™ Precast Gels), and transferred to PVDF membrane, and porimin and GAPDH were detected using specific primary antibodies (Anti-Porimin (G2) (Santa Cruz Biotechnology, sc-377295), Anti-GAPDH antibody (Sigma-Aldrich, G8795; 1![[thin space (1/6-em)]](https://www.rsc.org/images/entities/char_2009.gif) :
:![[thin space (1/6-em)]](https://www.rsc.org/images/entities/char_2009.gif) 200)) and secondary antibody Goat Anti-Mouse IgG (HRP) (ThermoFisher Scientific, 32430; 1
200)) and secondary antibody Goat Anti-Mouse IgG (HRP) (ThermoFisher Scientific, 32430; 1![[thin space (1/6-em)]](https://www.rsc.org/images/entities/char_2009.gif) :
:![[thin space (1/6-em)]](https://www.rsc.org/images/entities/char_2009.gif) 1000). After the substrate (SignalFire™ ECL Reagent A + B) was added, the luminescence was recorded with the Amersham Imager 680.
1000). After the substrate (SignalFire™ ECL Reagent A + B) was added, the luminescence was recorded with the Amersham Imager 680.
Cell cycle distribution
Distribution of the cell population into cell cycle phases was measured using propidium staining with prior determination of cell membrane permeability using a LIVE/DEAD Staining Kit (Invitrogen, L34955). Firstly, 1.5 × 10⁵ cells were seeded on a 6-well plate and left to adhere overnight. The cells were then treated with 200 nM Ru1 and irradiated with green light (see Treatment and irradiation of cells in the section Materials and methods). After 5 h of incubation in drug-free medium, the cells were harvested by trypsinization and stained with a LIVE/DEAD Staining Kit (Invitrogen, L34955) according to the manufacturer's instructions to distinguish living cells before fixation. The cells were fixed in 70% EtOH for at least 24 h at 4 °C. On the day of analysis, the cells were washed with PBS, stained for 30 min at 37 °C in Vindel's solution (10 mM Tris-Cl, 10 mM NaCl, 0.1% Triton X-100) containing 50 μg mL−1 propidium iodide and 100 μg mL−1 RNase A. Samples were then analyzed by using a BD FACSVerse flow cytometer and cell cycle distribution was calculated using FCS Express 7 software.Plasmid DNA photocleavage
Plasmid pBR322 was mixed with compound Ru1 (molar ratio [Ru]/[DNA base] = 1/10) in 10 mM Tris buffer (pH 7.4). Samples were irradiated with the green light for indicated times. After mixing with gel loading buffer, the samples were loaded onto a 1% Tris-acetate-EDTA (TAE)-agarose gel and subjected to electrophoresis for 90 min at 60 V. The gel was stained in 0.5 μg mL−1 ethidium bromide for 15 min, rinsed with distilled water, and visualized using a Gel Logic 112 imaging system.Annexin V/propidium iodide staining
Membrane integrity and phosphatidyl serine exposure on the extracellular side of the membrane were measured by dual annexin V–Pacific Blue conjugate (Invitrogen, A35122) and propidium iodide staining. Cells were seeded on different days at a density of 105, 1.5 × 10⁵, or 2.5 × 10⁵ of cells per 6-well plate for 2-day, 1-day, or immediate evaluation, respectively. After overnight incubation, the cells were treated with indicated concentrations of Ru1 and irradiated (see Treatment and irradiation of cells in the section Materials and methods). The cells were then cultivated in a drug-free medium until the time of analysis. All floating and adherent cells were collected and resuspended in a staining solution composed of 1× annexin V binding buffer (BD Pharmingen); 1× annexin V conjugated to Pacific Blue; and 10 μg ml−1 propidium iodide. After 15 min incubation, the cells were analyzed using flow cytometry (BD FACSVerse).TMRE staining
3 × 10⁵ cells were seeded on a 6-well plate and cultivated overnight. The following day, the cells were treated with indicated concentrations of Ru1 followed by irradiation (see Treatment and irradiation of cells in the section Materials and methods). The cells were then harvested by trypsinization and resuspended in 200 μL of 10 nM TMRE solution in cultivation media. After 30 min staining at 37 °C, the cells were washed with PBS and analyzed using flow cytometry (BD FACSVerse). For a positive control, 10 μM FCCP was added at the beginning of the staining step and then processed as for the other samples.Intracellular calcium determination
Firstly, 3 × 10⁵ cells were seeded on a 6-well plate and incubated overnight. The cells were then treated with indicated concentrations of Ru1 in PBS for 1 h and irradiated with green light (1 h, λmax = 545 nm, 22 W m−2). The cells were then stained with 5 μM Fluo-8 AM (Abcam, ab142773) dissolved in PBS for 30 min at 37 °C. After staining, the cells were collected by trypsinization, the pellet was resuspended in PBS, and it was immediately analyzed by flow cytometry (BD FACSVerse).Liposome leakage assay
Liposomes containing a self-quenching concentration of fluorescent stain were prepared using the thin-film hydration method followed by extrusion. Lipids were dissolved in chloroform to a final concentration of 25 mg mL−1. Then, 2.925 mg of 18:0 DSPC, 3.9 mg of 18:1 DOPC, 1.225 mg of cholesterol, and 1.95 mg of DSPE-PEG2000 were mixed to form a mixture with molar ratios of 30![[thin space (1/6-em)]](https://www.rsc.org/images/entities/char_2009.gif) :
:![[thin space (1/6-em)]](https://www.rsc.org/images/entities/char_2009.gif) 40
40![[thin space (1/6-em)]](https://www.rsc.org/images/entities/char_2009.gif) :
:![[thin space (1/6-em)]](https://www.rsc.org/images/entities/char_2009.gif) 25
25![[thin space (1/6-em)]](https://www.rsc.org/images/entities/char_2009.gif) :
:![[thin space (1/6-em)]](https://www.rsc.org/images/entities/char_2009.gif) 5, respectively. The mixture was incubated for 5 min at 65 °C, and transferred to a 50 mL glass round-bottom flask with 3 mL of chloroform, and the organic solvent was evaporated on a rotary evaporator at 65 °C in a water bath under a N2 atmosphere. The dry lipid film was hydrated by 0.5 ml of 100 mM carboxyfluorescein dissolved in PBS. The solution was sonicated 3 × 3 s, frozen in liquid nitrogen, and thawed at room temperature 5 times. Uniform liposomes were formed by extrusion through a 200 nm membrane 10 times and finally dialyzed in PBS using an 8 kDa dialysis membrane overnight. Liposomes were then diluted with PBS to a final concentration of 25 μg mL−1 and incubated with indicated concentrations of Ru1 or an equivalent volume of DMSO for 0 or 120 min in the dark or irradiated with green light (λmax = 545 nm, 22 W m−2). Fluorescence was measured using Varian Cary Eclipse fluorescence spectrometer with ex: 490 nm and em: 530. Fluorescence was normalized to maximal fluorescence after the addition of 10% Triton X-100 (1/100 volume).
5, respectively. The mixture was incubated for 5 min at 65 °C, and transferred to a 50 mL glass round-bottom flask with 3 mL of chloroform, and the organic solvent was evaporated on a rotary evaporator at 65 °C in a water bath under a N2 atmosphere. The dry lipid film was hydrated by 0.5 ml of 100 mM carboxyfluorescein dissolved in PBS. The solution was sonicated 3 × 3 s, frozen in liquid nitrogen, and thawed at room temperature 5 times. Uniform liposomes were formed by extrusion through a 200 nm membrane 10 times and finally dialyzed in PBS using an 8 kDa dialysis membrane overnight. Liposomes were then diluted with PBS to a final concentration of 25 μg mL−1 and incubated with indicated concentrations of Ru1 or an equivalent volume of DMSO for 0 or 120 min in the dark or irradiated with green light (λmax = 545 nm, 22 W m−2). Fluorescence was measured using Varian Cary Eclipse fluorescence spectrometer with ex: 490 nm and em: 530. Fluorescence was normalized to maximal fluorescence after the addition of 10% Triton X-100 (1/100 volume).
Differential scanning calorimetry experiments
HeLa cells (4 × 10⁶) were seeded on a 100 mm Petri dish in cultivation media and left to adhere overnight. The cells were then treated with specified concentrations of Ru1 and irradiated (see Treatment and irradiation of cells in the section Materials and methods). The cells were washed with PBS, harvested by scraping, and resuspended in 1 mL of filtered PBS. A fraction of the sample was utilized to quantify proteins through the Bio-Rad Protein Assay (Bio-Rad, 500-0002) following the manufacturer's instructions. The sample was then degassed and loaded into the differential scanning calorimeter Nano DSC (TA Instruments, USA). The samples were scanned from 25 to 115 °C with a scan rate of 1 °C min−1. Intrinsic baseline curvature was corrected by subtracting a blank PBS scan. The computed baseline was subtracted from the corrected data (Fig. S40†) and normalized to the protein amount.Conflicts of interest
There are no conflicts to declare.Acknowledgements
The research of J. C., H. K., L. M., J. M., J. K., and V. B. was supported by the Czech Science Foundation (grant 23-06316S). The research of M. D. S. and J. R. was supported by the Spanish Ministerio de Ciencia e Innovación-Agencia Estatal de Investigación (MCI/AEI/10.13039/501100011033) and FEDER funds (project PID2021-122850NB-I00), and Fundación Séneca-CARM (project 21989/PI/22). A. H.-G. thanks Fundación Séneca-CARM for a grant (project 21426/FPI/20).References
- S. Bonnet, Ruthenium-Based Photoactivated Chemotherapy, J. Am. Chem. Soc., 2023, 145(43), 23397–23415, DOI:10.1021/jacs.3c01135.
- X. Zhao, J. Liu, J. Fan, H. Chao and X. Peng, Recent Progress in Photosensitizers for Overcoming the Challenges of Photodynamic Therapy: From Molecular Design to Application, Chem. Soc. Rev., 2021, 50(6), 4185–4219, 10.1039/D0CS00173B.
- J. Karges, F. Heinemann, M. Jakubaszek, F. Maschietto, C. Subecz, M. Dotou, R. Vinck, O. Blacque, M. Tharaud, B. Goud, E. Viñuelas Zahínos, B. Spingler, I. Ciofini and G. Gasser, Rationally Designed Long-Wavelength Absorbing Ru(II) Polypyridyl Complexes as Photosensitizers for Photodynamic Therapy, J. Am. Chem. Soc., 2020, 142(14), 6578–6587, DOI:10.1021/jacs.9b13620.
- J. Zhao, Y. Gao, R. Huang, C. Chi, Y. Sun, G. Xu, X.-H. Xia and S. Gou, Design of Near-Infrared-Triggered Metallo-Photosensitizers via a Self-Assembly-Induced Vibronic Decoupling Strategy, J. Am. Chem. Soc., 2023, 145(21), 11633–11642, DOI:10.1021/jacs.3c01645.
- J. Karges, Clinical Development of Metal Complexes as Photosensitizers for Photodynamic Therapy of Cancer, Angew. Chem., Int. Ed., 2022, 61(5), e202112236, DOI:10.1002/anie.202112236.
- Y. Wu, S. Li, Y. Chen, W. He and Z. Guo, Recent Advances in Noble Metal Complex Based Photodynamic Therapy, Chem. Sci., 2022, 13(18), 5085–5106, 10.1039/D1SC05478C.
- J. Karges, S. Kuang, F. Maschietto, O. Blacque, I. Ciofini, H. Chao and G. Gasser, Rationally Designed Ruthenium Complexes for 1- and 2-Photon Photodynamic Therapy, Nat. Commun., 2020, 11(1), 3262, DOI:10.1038/s41467-020-16993-0.
- L. Conti, E. Macedi, C. Giorgi, B. Valtancoli and V. Fusi, Combination of Light and Ru(II) Polypyridyl Complexes: Recent Advances in the Development of New Anticancer Drugs, Coord. Chem. Rev., 2022, 469, 214656, DOI:10.1016/j.ccr.2022.214656.
- S. Monro, K. L. Colón, H. Yin, J. Roque, P. Konda, S. Gujar, R. P. Thummel, L. Lilge, C. G. Cameron and S. A. McFarland, Transition Metal Complexes and Photodynamic Therapy from a Tumor-Centered Approach: Challenges, Opportunities, and Highlights from the Development of TLD1433, Chem. Rev., 2019, 119(2), 797–828, DOI:10.1021/acs.chemrev.8b00211.
- S. A. McFarland, A. Mandel, R. Dumoulin-White and G. Gasser, Metal-Based Photosensitizers for Photodynamic Therapy: The Future of Multimodal Oncology?, Curr. Opin. Chem. Biol., 2020, 56, 23–27, DOI:10.1016/j.cbpa.2019.10.004.
- F. Qi, H. Yuan, Y. Chen, X.-X. Peng, Y. Wu, W. He and Z. Guo, Type I Photoreaction and Photoinduced Ferroptosis by a Ru(II) Complex to Overcome Tumor Hypoxia in Photodynamic Therapy, CCS Chem., 2022, 5(7), 1583–1591, DOI:10.31635/ccschem.022.202202074.
- L. Hao, J. Wang, Z.-Y. Pan, Z.-W. Mao and C.-P. Tan, Photodegradation of Carbonic Anhydrase IX via a Binding-Enhanced Ruthenium-Based Photosensitizer, Chem. Commun., 2022, 58(58), 8069–8072, 10.1039/D2CC02337G.
- F. Wei, S. Kuang, T. W. Rees, X. Liao, J. Liu, D. Luo, J. Wang, X. Zhang, L. Ji and H. Chao, Ruthenium(II) Complexes Coordinated to Graphitic Carbon Nitride: Oxygen Self-Sufficient Photosensitizers Which Produce Multiple ROS for Photodynamic Therapy in Hypoxia, Biomaterials, 2021, 276, 121064, DOI:10.1016/j.biomaterials.2021.121064.
- Y. Zhang, B.-T. Doan and G. Gasser, Metal-Based Photosensitizers as Inducers of Regulated Cell Death Mechanisms, Chem. Rev., 2023, 123(16), 10135–10155, DOI:10.1021/acs.chemrev.3c00161.
- Y. Wang, P. Mesdom, K. Purkait, B. Saubaméa, P. Burckel, P. Arnoux, C. Frochot, K. Cariou, T. Rossel and G. Gasser, Ru(II)/Os(II)-Based Carbonic Anhydrase Inhibitors as Photodynamic Therapy Photosensitizers for the Treatment of Hypoxic Tumours, Chem. Sci., 2023, 14(42), 11749–11760, 10.1039/D3SC03932C.
- J. Li, L. Zeng, Z. Wang, H. Chen, S. Fang, J. Wang, C.-Y. Cai, E. Xing, X. Liao, Z.-W. Li, C. R. Ashby Jr, Z.-S. Chen, H. Chao and Y. Pan, Cycloruthenated Self-Assembly with Metabolic Inhibition to Efficiently Overcome Multidrug Resistance in Cancers, Adv. Mater., 2022, 34(1), 2100245, DOI:10.1002/adma.202100245.
- H. Huang, P. Zhang, B. Yu, Y. Chen, J. Wang, L. Ji and H. Chao, Targeting Nucleus DNA with a Cyclometalated Dipyridophenazineruthenium(II) Complex, J. Med. Chem., 2014, 57(21), 8971–8983, DOI:10.1021/jm501095r.
- C. Scolaro, A. Bergamo, L. Brescacin, R. Delfino, M. Cocchietto, G. Laurenczy, T. J. Geldbach, G. Sava and P. J. Dyson, In Vitro and in Vivo Evaluation of Ruthenium(II)−Arene PTA Complexes, J. Med. Chem., 2005, 48(12), 4161–4171, DOI:10.1021/jm050015d.
- G. Ghosh, K. L. Colón, A. Fuller, T. Sainuddin, E. Bradner, J. McCain, S. M. A. Monro, H. Yin, M. W. Hetu, C. G. Cameron and S. A. McFarland, Cyclometalated Ruthenium(II) Complexes Derived from α-Oligothiophenes as Highly Selective Cytotoxic or Photocytotoxic Agents, Inorg. Chem., 2018, 57(13), 7694–7712, DOI:10.1021/acs.inorgchem.8b00689.
- J. A. Solís-Ruiz, A. Barthe, G. Riegel, R. O. Saavedra-Díaz, C. Gaiddon and R. Le Lagadec, Light, Activation of Cyclometalated Ruthenium Complexes Drives towards Caspase 3 Dependent Apoptosis in Gastric Cancer Cells, J. Inorg. Biochem., 2020, 208, 111080, DOI:10.1016/j.jinorgbio.2020.111080.
- M. Martínez-Alonso, A. Gandioso, C. Thibaudeau, X. Qin, P. Arnoux, N. Demeubayeva, V. Guérineau, C. Frochot, A. C. Jung, C. Gaiddon and G. Gasser, A Novel Near-IR Absorbing Ruthenium(II) Complex as Photosensitizer for Photodynamic Therapy and Its Cetuximab Bioconjugates, ChemBioChem, 2023, 24(15), e202300203, DOI:10.1002/cbic.202300203.
- V. Novohradsky, J. Yellol, O. Stuchlikova, M. D. Santana, H. Kostrhunova, G. Yellol, J. Kasparkova, D. Bautista, J. Ruiz and V. Brabec, Organoruthenium Complexes with C^N Ligands Are Highly Potent Cytotoxic Agents That Act by a New Mechanism of Action, Chem. – Eur. J., 2017, 23(61), 15294–15299, DOI:10.1002/chem.201703581.
- F. J. Ballester, E. Ortega, D. Bautista, M. D. Santana and J. Ruiz, Ru(II) Photosensitizers Competent for Hypoxic Cancers via Green Light Activation, Chem. Commun., 2020, 56(71), 10301–10304, 10.1039/D0CC02417A.
- E. Ortega-Forte, A. Rovira, M. López-Corrales, A. Hernández-García, F. J. Ballester, E. Izquierdo-García, M. Jordà-Redondo, M. Bosch, S. Nonell, M. D. Santana, J. Ruiz, V. Marchán and G. Gasser, A Near-Infrared Light-Activatable Ru(ii)-Coumarin Photosensitizer Active under Hypoxic Conditions, Chem. Sci., 2023, 14(26), 7170–7184, 10.1039/D3SC01844J.
- A. Hernández-García, L. Marková, M. D. Santana, J. Prachařová, D. Bautista, H. Kostrhunová, V. Novohradský, V. Brabec, J. Ruiz and J. Kašpárková, Cyclometalated Benzimidazole Osmium(II) Complexes with Antiproliferative Activity in Cancer Cells Disrupt Calcium Homeostasis, Inorg. Chem., 2023, 62(16), 6474–6487, DOI:10.1021/acs.inorgchem.3c00501.
- K. Peng, Y. Zheng, W. Xia and Z.-W. Mao, Organometallic Anti-Tumor Agents: Targeting from Biomolecules to Dynamic Bioprocesses, Chem. Soc. Rev., 2023, 52(8), 2790–2832, 10.1039/D2CS00757F.
- R. Guan, Y. Chen, L. Zeng, T. W. Rees, C. Jin, J. Huang, Z.-S. Chen, L. Ji and H. Chao, Oncosis-Inducing Cyclometalated Iridium(III) Complexes, Chem. Sci., 2018, 9(23), 5183–5190, 10.1039/C8SC01142G.
- C. D. Ertl, D. P. Ris, S. C. Meier, E. C. Constable, C. E. Housecroft, M. Neuburger and J. A. Zampese, Sticking and Patching: Tuning and Anchoring Cyclometallated Ruthenium(II) Complexes, Dalton Trans., 2014, 44(4), 1557–1570, 10.1039/C4DT02797C.
- T. Sainuddin, J. McCain, M. Pinto, H. Yin, J. Gibson, M. Hetu and S. A. McFarland, Organometallic Ru(II) Photosensitizers Derived from π-Expansive Cyclometalating Ligands: Surprising Theranostic PDT Effects, Inorg. Chem., 2016, 55(1), 83–95, DOI:10.1021/acs.inorgchem.5b01838.
- D. A. Belinskaia, P. A. Voronina, V. I. Shmurak, R. O. Jenkins and N. V. Goncharov, Serum Albumin in Health and Disease: Esterase, Antioxidant, Transporting and Signaling Properties, Int. J. Mol. Sci., 2021, 22(19), 10318, DOI:10.3390/ijms221910318.
- J. Yellol, S. A. Pérez, A. Buceta, G. Yellol, A. Donaire, P. Szumlas, P. J. Bednarski, G. Makhloufi, C. Janiak, A. Espinosa and J. Ruiz, Novel C,N-Cyclometalated, Benzimidazole Ruthenium(II) and Iridium(III) Complexes as Antitumor and Antiangiogenic Agents: A Structure–Activity Relationship Study, J. Med. Chem., 2015, 58(18), 7310–7327, DOI:10.1021/acs.jmedchem.5b01194.
- H. Zhang, X. Huang and M. Zhang, Spectral Diagnostics of the Interaction between Pyridoxine Hydrochloride and Bovine Serum Albumin in Vitro, Mol. Biol. Rep., 2008, 35(4), 699–705, DOI:10.1007/s11033-007-9143-x.
- N. Alvarez and A. Sevilla, Current Advances in Photodynamic Therapy (PDT) and the Future Potential of PDT-Combinatorial Cancer Therapies, Int. J. Mol. Sci., 2024, 25(2), 1023, DOI:10.3390/ijms25021023.
- G. Ghosh, H. Yin, S. M. A. Monro, T. Sainuddin, L. Lapoot, A. Greer and S. A. McFarland, Synthesis and Characterization of Ru(II) Complexes with π-Expansive Imidazophen Ligands for the Photokilling of Human Melanoma Cells, Photochem. Photobiol., 2020, 96(2), 349–357, DOI:10.1111/php.13177.
- J. Kasparkova, A. Hernández-García, H. Kostrhunova, M. Goicuría, V. Novohradsky, D. Bautista, L. Markova, M. D. Santana, V. Brabec and J. Ruiz, Novel 2-(5-Arylthiophen-2-Yl)-Benzoazole Cyclometalated Iridium(III) Dppz Complexes Exhibit Selective Phototoxicity in Cancer Cells by Lysosomal Damage and Oncosis, J. Med. Chem., 2024, 67(1), 691–708, DOI:10.1021/acs.jmedchem.3c01978.
- A. Dao, S. Chen, L. Pan, Q. Ren, X. Wang, H. Wu, Q. Gong, Z. Chen, S. Ji, J. Ru, H. Zhu, C. Liang, P. Zhang, H. Xia and H. Huang, A 700 Nm LED Light Activated Ru(II) Complex Destroys Tumor Cytoskeleton via Photosensitization and Photocatalysis, Adv. Healthcare Mater., 2024, 2400956, DOI:10.1002/adhm.202400956.
- V. Novohradsky, G. Vigueras, J. Pracharova, N. Cutillas, C. Janiak, H. Kostrhunova, V. Brabec, J. Ruiz and J. Kasparkova, Molecular Superoxide Radical Photogeneration in Cancer Cells by Dipyridophenazine Iridium(III) Complexes, Inorg. Chem. Front., 2019, 6(9), 2500–2513, 10.1039/C9QI00811J.
- F. Ma, C. Zhang, K. V. Prasad, G. J. Freeman and S. F. Schlossman, Molecular Cloning of Porimin, a Novel Cell Surface Receptor Mediating Oncotic Cell Death, Proc. Natl. Acad. Sci. U. S. A., 2001, 98(17), 9778–9783, DOI:10.1073/pnas.171322898.
- Y. Eguchi, S. Shimizu and Y. Tsujimoto, Intracellular ATP Levels Determine Cell Death Fate by Apoptosis or Necrosis, Cancer Res., 1997, 57(10), 1835–1840 CAS.
- B. E. Trump, I. K. Berezesky, S. H. Chang and P. C. Phelps, The Pathways of Cell Death: Oncosis, Apoptosis, and Necrosis, Toxicol. Pathol., 1997, 25(1), 82–88, DOI:10.1177/019262339702500116.
- N. Li, M. Sun, Y. Wang, Y. Lv, Z. Hu, W. Cao, J. Zheng and X. Jiao, Effect of Cell Cycle Phase on the Sensitivity of SAS Cells to Sonodynamic Therapy Using Low-intensity Ultrasound Combined with 5-aminolevulinic Acid in Vitro, Mol. Med. Rep., 2015, 12(2), 3177–3183, DOI:10.3892/mmr.2015.3747.
- H. Lecoeur, M.-C. Prévost and M.-L. Gougeon, Oncosis Is Associated with Exposure of Phosphatidylserine Residues on the Outside Layer of the Plasma Membrane: A Reconsideration of the Specificity of the Annexin V/Propidium Iodide Assay, Cytometry, 2001, 44(1), 65–72, DOI:10.1002/1097-0320(20010501)44:1<65::AID-CYTO1083>3.0.CO;2-Q.
- S. L. Fink and B. T. Cookson, Apoptosis, Pyroptosis, and Necrosis: Mechanistic Description of Dead and Dying Eukaryotic Cells, Infect. Immun., 2005, 73(4), 1907–1916, DOI:10.1128/IAI.73.4.1907-1916.2005.
- J. Balvan, A. Křížová, J. Gumulec, M. Raudenska, Z. Sládek, M. Sedlackova, P. Babula, M. Svobodová, R. Kizek, R. Chmelik and M. Masarik, Multimodal Holographic Microscopy: Distinction between Apoptosis and Oncosis, PLoS One, 2015, 10, e0121674, DOI:10.1371/journal.pone.0121674.
- P. Weerasinghe and L. M. Buja, Oncosis: An Important Non-Apoptotic Mode of Cell Death, Exp. Mol. Pathol., 2012, 93(3), 302–308, DOI:10.1016/j.yexmp.2012.09.018.
- J. Aguilera, S. Vazquez-Reyes and J. Sun, A Fluorescence Dequenching-Based Liposome Leakage Assay to Measure Membrane Permeabilization by Pore-Forming Proteins, Bio-Protoc., 2021, 11(10), e4025, DOI:10.21769/BioProtoc.4025.
- N. G. O. Júnior, M. H. Cardoso, E. S. Cândido, D. van den Broek, N. de Lange, N. Velikova, J. M. Kleijn, J. M. Wells, T. M. B. Rezende, O. L. Franco and R. de Vries, An Acidic Model Pro-Peptide Affects the Secondary Structure, Membrane Interactions and Antimicrobial Activity of a Crotalicidin Fragment, Sci. Rep., 2018, 8(1), 11127, DOI:10.1038/s41598-018-29444-0.
- M. J. Velinova, R. W. H. M. Staffhorst, W. J. M. Mulder, A. S. Dries, B. A. J. Jansen, B. de Kruijff and A. I. P. M. de Kroon, Preparation and Stability of Lipid-Coated Nanocapsules of Cisplatin: Anionic Phospholipid Specificity, Biochim. Biophys. Acta, 2004, 1663(1–2), 135–142, DOI:10.1016/j.bbamem.2004.03.002.
- D. Casares, P. V. Escribá and C. A. Rosselló, Membrane Lipid Composition: Effect on Membrane and Organelle Structure, Function and Compartmentalization and Therapeutic Avenues, Int. J. Mol. Sci., 2019, 20(9), 2167, DOI:10.3390/ijms20092167.
- J. R. Lepock, Measurement of Protein Stability and Protein Denaturation in Cells Using Differential Scanning Calorimetry, Methods, 2005, 35(2), 117–125, DOI:10.1016/j.ymeth.2004.08.002.
- Bruker, SADABS, Bruker AXS Inc., Madison, Wisconsin, USA, 2001 Search PubMed.
- G. M. Sheldrick, Crystal Structure Refinement with SHELXL, Acta Crystallogr., Sect. C: Struct. Chem., 2015, 71(1), 3–8, DOI:10.1107/S2053229614024218.
- A. L. Spek, PLATON SQUEEZE: A Tool for the Calculation of the Disordered Solvent Contribution to the Calculated Structure Factors, Acta Crystallogr., Sect. C: Struct. Chem., 2015, 71(1), 9–18, DOI:10.1107/S2053229614024929.
Footnotes |
| † Electronic supplementary information (ESI) available. CCDC 2332906. For ESI and crystallographic data in CIF or other electronic format see DOI: https://doi.org/10.1039/d4qi00732h |
| ‡ These authors contributed equally to this work. |
| This journal is © the Partner Organisations 2024 |

