DOI:
10.1039/D2RA08060E
(Paper)
RSC Adv., 2024,
14, 1082-1093
Synthesis of CuxCo3−xO4 nanoparticles by a sonochemical method and characterization of structural and optical properties and photocatalytic activity for the degradation of methylene blue
Received
17th December 2022
, Accepted 14th December 2023
First published on 2nd January 2024
Abstract
In the present investigation, CuxCo3−xO4 (x = 0, 0.02, 0.04, 0.06, 0.1) nanoparticles have been synthesized by the sonochemical method and subsequent calcination at high temperature. The synthesized nanoparticles were further characterized using X-ray diffraction, UV-vis spectroscopy, FT-IR spectroscopy, Raman spectroscopy, transmission electron microscopy and energy-dispersive X-ray spectroscopy. The analysis results showed that nanoparticle size, band gap and photocatalytic activity of CuxCo3−xO4 compounds change by altering the Cu doping content. According to the XRD study, no impurity peaks associated with copper or copper oxide phases were observed in the diffractograms of doped samples. The highest degradation of methylene blue dye under visible light was observed in the presence of Cu0.02Co2.98O4 nanoparticles and found to be 87.51% after 330 minutes. This value increased with increasing the amount of photocatalyst and with decreasing dye concentration.
1 Introduction
Cobalt oxide (Co3O4) nanoparticles are one of the interesting metal oxides because they have unique physical and chemical properties. They are widely used in gas sensors, pH sensors, catalysts, anode materials in Li-ion rechargeable batteries, supercapacitors, electrochemical sensors, photocatalysts, solar absorbers and electrochromic materials.1–9 Co3O4 is a p-type antiferromagnetic semiconductor and mixed valence compound (CoO·Co2O3). It adopts the normal spinel structure. So far, several synthesis methods have been employed to produce Co3O4 nanoparticles including hydrothermal/solvothermal,10,11 precipitation,12 sonochemical,13 sol–gel,14 solution combustion,15 successive ionic layer adsorption and reaction (SILAR),16 chemical spray pyrolysis17 and thermal decomposition.18 According to reports, the incorporation of metal dopants is an effective method for improving electrical conductivity and catalytic activity of oxide nanoparticles. Rehman et al.19 prepared Ce and Zn doped CuO nanoparticles by co-precipitation method and a remarkable increment in degradation efficiency for methylene blue (81.64%) under visible light was observed in the presence of these nanocatalysts compared to undoped samples (38.77%). Degradation efficiency was found to be 78% for methylene blue dye under UV-A light using 3% Cu-doped NiO nanoparticles obtained by green synthesis combined with a sol–gel method.20 Several metals are used to modify the Co3O4 nanoparticles including Fe, Mn, Cu, Ni, Mo,20,21 Ag, and Pd.22,23 Jincy and Meena synthesized copper-doped cobalt oxide nanoparticles by a hydrothermal method and they observed that these nanoparticles exhibited extreme sensitivity towards NH3 gas at room temperature even at a lower concentration of 5 ppm in comparison to undoped Co3O4.24 In another work, Cu-doped Co3O4 nanosheets obtained by a solvothermal method show enhanced electrochemical performance due to the reduced particle size and larger surface area.25 Dong and co-workers fabricated mesoporous Ag-doped Co3O4 nanowire arrays supported on an FTO substrate by an electrodeposition-hydrothermal process for water oxidation in 0.5 M H2SO4 and it has been determined that the addition of silver as a dopant significantly improves both the conductivity and stability of the electrocatalyst in an acidic environment.26
As far as we know, there have been no previous reports in the literature regarding the synthesis of Cu-doped Co3O4 nanoparticles using the sonochemical method. In this study, we carried out the synthesis of undoped Co3O4 nanoparticles and various concentrations of Cu-doped Co3O4 nanoparticles using the sonochemical method, followed by thermal treatment at high temperature. For synthesis, we chose the sonochemical method due to its simplicity and low cost. We selected copper as a dopant for our study because the ionic radius of Cu2+ is close to the ionic radius of Co2+ and therefore Cu2+ ions can easily enter into the Co3O4 matrix. The influence of dopant concentration on the structural, optical properties and photocatalytic activity of Co3O4 nanoparticles was examined in detail.
2 Experimental
2.1 Materials and instrumentation
All chemicals [cobalt nitrate (Co(NO3)2·7H2O), copper(II) chloride(CuCl2·2H2O), sodium hydroxide (NaOH), polyvinyl alcohol (PVA), hydrogen peroxide (H2O2) and methylene blue (MB) (C16H18ClN3S) were of analytical grade and were used without any further purification. Bath type ultrasonicator (VCX500) was used for the synthesis of Co3O4 nanoparticles.
The structural analysis of the synthesized oxide powders was analyzed using Rigaku Mini Flex 600 X-ray diffractometer (λ = 1.54060 Å) using Ni-filtered Cu Kα radiation with a step width of 0.1° and a scan speed/duration time of 5° per minute over a range of 2θ from 10° to 90°. Optical properties of the samples were assessed using Specord 250 Plus UV-vis Spectrophotometer. Fourier transform infrared (FTIR) measurement has been carried out within 400–4000 cm−1 region on a Varian 3600 FTIR spectrometer. Transmission electron microscopy (TEM) measurements were conducted on the JEOL JEM-1400 transmission electron microscope. EDX study was carried out on X-Max Energy dispersive spectrometer. Raman spectroscopy measurements were recorded on an EnSpectr R532 spectrometer in the spectral range of 100–800 cm−1.
2.2 Preparation of undoped and Cu-doped Co3O4 nanoparticles
Undoped Co3O4 nanoparticles were synthesized by the sonochemical method and subsequent calcination process with some modifications reported in our previous research.27 In this experiment, sodium hydroxide was used instead of sodium borohydride as a precipitating agent. For the synthesis, 100 ml of 0.1 M Co(NO3)2·7H2O aqueous solution was prepared and stirred with PVA solution as a stabilizer agent (2.0 wt%) for 15 min to obtain a homogenous solution. Then, as-prepared 100 ml of 0.2 M NaOH solution was added drop by drop into the above solution under the sonication process using an ultrasonic probe. This solution was irradiated with 20 kHs ultrasound wave for an hour. The pink precipitate was obtained at the end of the reaction. Finally, the precipitate was centrifuged at 6000 rpm, washed three times with distilled water and ethanol in the end, and dried at room temperature. Thereafter, the product was annealed at 500 °C for 4 h in a Muffle furnace and the color of it turned black powder. For preparing the different concentrations of Cu-doped Co3O4 nanoparticles (CuxCo3−xO4, x = 0.02, 0.04, 0.06, 0.1), a stoichiometric amount of CuCl2·2H2O was dissolved in 100 ml distilled water and added to cobalt nitrate solution. The rest of the experiments is the same as described above. The schematic representation of the synthesis process of CuxCo3−xO4 nanoparticles is given in Fig. 1.
 |
| | Fig. 1 Schematic representation of the experimental work. | |
2.3 Photocatalytic activity measurement
The photocatalytic activity of undoped Co3O4 and Cu-doped Co3O4 nanoparticles was investigated on methylene blue (MB) dye under visible light irradiation. For experiments, initially, 10 mg catalyst was added to the 10 ppm dye solution. Before irradiation, the stirring was performed in the dark for 45 min to get an adsorption–desorption equilibrium between the dye and catalyst. Then 0.4 ml of 450 mM hydrogen peroxide (H2O2) solution as an oxidant was added to the solution and the solution was exposed to visible light irradiation on a magnetic stirrer. 116 W halogen lamp was used as a source of visible light. The experiments were performed at room temperature. At pre-determined time intervals, 3 ml of dye solution was taken out from the beaker and centrifuged at 6000 rpm for 5 min to completely precipitate particles. Then UV-vis adsorption spectra were measured in the range of 400–800 nm. The experiments were also performed by varying the initial dye concentration (5 ppm and 20 ppm) and amount of catalyst (20 mg and 30 mg). Degradation efficiency was calculated by Beer–Lambert law using the following equation:22,28| |
 | (1) |
where C0 and A0-initial concentration and absorbance of dye solution, C and A-concentration and absorbance of dye solution after the time interval, respectively.
3 Results and discussion
3.1 Structural analysis
To elucidate the formation mechanism of CuxCo3−xO4 nanoparticles, structural analysis was conducted before thermal annealing. Fig. 2a shows the XRD patterns of undoped and different concentrations (2%, 4%, 6% and 10%) of Cu-doped samples before thermal annealing. The low-intensity peaks occurred at 2θ = 19.23°, 38.27° corresponding to (001) and (101) planes in the diffractogram of the undoped sample. These results match the JCPDS-30-0443 standard data, confirming the formation of a brucite-like phase of β-Co(OH)2 with a hexagonal crystal structure. It should be noted, there were no diffraction peaks attributed to α-Co(OH)2, Cu(OH)2, or impurities, signifying a high-purity final product. The size and interplanar spacing of the β-Co(OH)2 nanoparticles were determined as 5.17 nm and 4.61183 Å, respectively, based on the most intense peak corresponding to the (001) plane. The lattice parameters were calculated as follows: a = b = 3.17 Å, c = 4.61 Å, and α = β = 90°, γ = 120°. The Debye–Scherrer formula was employed to calculate the crystallite size:29,30| |
D = 0.89λ/β![[thin space (1/6-em)]](https://www.rsc.org/images/entities/char_2009.gif) cos cos![[thin space (1/6-em)]](https://www.rsc.org/images/entities/char_2009.gif) θ θ
| (2) |
where θ is Bragg's angle, λ and β are the X-ray wavelength and the full width at half maximum intensity, respectively.
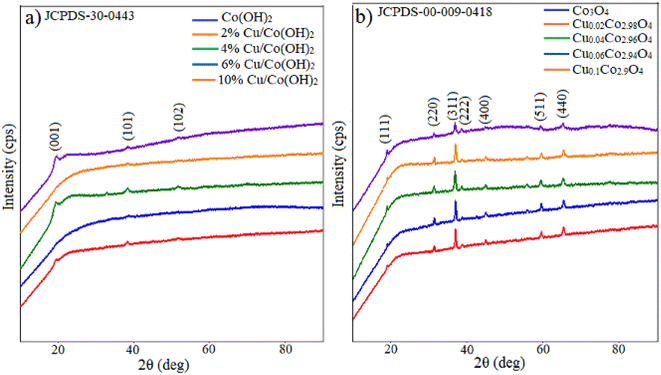 |
| | Fig. 2 XRD patterns of undoped and 2%, 4%, 6%, 10% Cu doped (a) β-Co(OH)2 and (b) Co3O4 nanoparticles. | |
Interplanar spacing (d) is evaluated by Bragg's Law equation:30
| |
 | (3) |
where
n is an integer,
θ-is a diffraction angle and
λ is the wavelength of X-rays.
The lattice constants of β-Co(OH)2 nanoparticles with a hexagonal crystal structure are calculated by the following equation:31
| |
 | (4) |
The values of lattice parameters “a” and “c” were calculated from (101) and (001) reflections, respectively, and the obtained values are consistent with the standard data.
One diffraction peak appeared at 2θ = 38.36° corresponding to the (101) plane in the XRD pattern of 2% Cu doped sample before thermal annealing. In the XRD pattern of 4% Cu doped sample, the small intensity peaks appearing at 2θ = 19.36°, 38.52° and 51.68° values are ascribed to the (001), (101) and (102) crystal planes, respectively. One diffraction peak at 2θ = 38.64° corresponding to (101) plane appeared in the diffractogram of the 6% Cu doped sample, two diffraction peaks at 2θ = 19.65° and 38.06° values corresponding to (001) and (101) planes were observed in the diffractogram of the 10% Cu doped sample. Before thermal annealing, the XRD patterns of Cu-doped samples show peaks associated with β-Co(OH)2, with no observable peaks related to Cu(OH)2. The results reveal that as the concentration of copper increases in doped β-Co(OH)2, the diffraction peak corresponding to the (001) plane shifts to a higher angle. The size and interplanar spacing of 4% Cu doped β-Co(OH)2 nanoparticles were estimated as 5.26 nm and 4.57881 Å, respectively. However, the peak corresponding to the (001) plane was not detected in 2% and 6% Cu-doped Co(OH)2 nanoparticles, and the intensity of this and other peaks in 10% Cu-doped Co(OH)2 nanoparticles was minimal, preventing an accurate size determination.
Fig. 2b illustrates the XRD patterns of undoped and various concentrations (2%, 4%, 6% and 10%) of Cu-doped samples after thermal annealing at 500 °C for 4 h. (111), (220), (311), (222) and (440) reflection planes were observed at 2θ = 18.91°, 31.25°, 36.84°, 38.56°, 65.19° diffraction angles in the XRD pattern of the undoped sample. This result aligns well with JCPDS-00-009-0418 standard data, confirming the formation of Co3O4 with a cubic crystal structure. The space group is identified as Fd-3m (227), and the lattice parameters are a = b = c = 8.0849 Å; α = β = γ = 90°. The lattice constant (a) was calculated using the interplanar spacing value with the following equation,32 yielding a value close to the standard (a = 8.084 Å):
| |
 | (5) |
The lattice constant and nanoparticle size were determined using the most intense peak in the diffractogram, which corresponds to the (311) plane. The crystallite size of undoped, 2%, 4%, 6% and 10% Cu-doped Co3O4 nanoparticles is 22.55 nm, 29.17 nm, 21.87 nm, 34.19 nm and 31.26 nm, respectively. It can be observed that the size of Co3O4 nanoparticles undergoes irregular changes with increasing Cu concentration.
No additional peaks related to the copper or copper oxide were detected in the diffractograms of Cu-doped Co3O4 nanoparticles. This observation suggests that Cu atoms effectively replaced Co atoms, leading to a well-dispersed distribution of Cu within the Co3O4 lattice.33,34 The similarity in ionic radii between Co2+ (0.72 Å) and Cu2+ (0.71 Å) in tetrahedral coordination facilitates the easy incorporation of Cu2+ ions into the Co3O4 matrix, substituting the Co2+ ions. As a result of Cu substitution, the lattice constant of the Co3O4 nanoparticles decreased compared to the undoped samples. Furthermore, the peaks in the diffractograms of Cu-doped Co3O4 nanoparticles exhibited a shift towards higher angles compared to the undoped sample. To further investigate the impact of Cu doping on the Co3O4 nanoparticles, lattice strain (ε), dislocation density (δ), and unit cell volume were calculated from the XRD data using the equations provided, and the corresponding values are presented in Table 1.
| |
 | (6) |
| |
 | (7) |
Table 1 The values of crystal structure parameters of CuxCo3−xO4 (x = 0, 0.02, 0.04, 0.06, 0.1) nanoparticles
| Sample |
2θ (°) |
Crystallite size (nm) |
Interplanar distance (Å) |
Lattice strain |
Dislocation density (10−3) |
Lattice constant (a = b = c) (Å) |
Unit cell volume (Å)3 |
| Undoped Co3O4 |
36.84 |
22.55 |
2.43768 |
0.0051 |
1.967 |
8.0849 |
528.47 |
| Cu0.02Co2.98O4 |
36.94 |
29.17 |
2.43131 |
0.0039 |
1.175 |
8.0637 |
524.33 |
| Cu0.04Co2.96O4 |
36.86 |
21.87 |
2.43653 |
0.0052 |
2.091 |
8.0810 |
527.71 |
| Cu0.06Co2.94O4 |
36.94 |
34.19 |
2.43131 |
0.0033 |
0.855 |
8.0637 |
524.33 |
| Cu0.1Co2.9O4 |
36.95 |
31.26 |
2.43093 |
0.0037 |
1.023 |
8.0625 |
524.09 |
As the nanoparticle size increases, the lattice strain value decreases, and conversely, as the nanoparticle size decreases, the lattice strain value increases. Below are the possible chemical reactions that could occur:
| Co(NO3)2·7H2O → Co2+ + 2NO3− + 7H2O |
| Co2+ + 2OH− + xH2O → Co(OH)2·xH2O |
| CuCl2·2H2O → Cu2+ + 2Cl− + 2H2O |
| Co2+ + Cu2+ + 2OH− + xH2O → CuxCo1−x(OH)2·xH2O |
3.2 UV-vis spectroscopy
The optical absorption spectra of undoped and different concentrations of Cu-doped Co3O4 nanoparticles were recorded at room temperature in the wavelength range of 250 nm and 900 nm. To perform UV-vis spectroscopy measurements, polyvinyl alcohol (PVA) films were prepared based on all synthesized samples by mechanical stirring. Fig. 3a shows the optical absorption spectra of all samples thermal annealed at 500 °C. Three absorption peaks in the ultraviolet, visible and near-infrared regions were observed for all samples. These peaks were found at 272.2 nm, 469.2 nm, and 773.8 nm in the spectrum of undoped Co3O4 nanoparticles. The peak at 272.2 nm is attributed to the PVA. As for the Cu-doped Co3O4 nanoparticles, the absorption peaks were detected at the following wavelengths: 449.4 nm and 762 nm for 2% Cu-doped Co3O4, 485.6 nm and 777.8 nm for 4% Cu-doped Co3O4, 491.2 nm and 778.2 nm for 6% Cu-doped Co3O4, and 534 nm and 826.4 nm for 10% Cu-doped Co3O4 nanoparticles. The results indicate that a blue shift, or a shift towards a lower value of wavelength, was observed in the absorption curve of 2% Cu-doped Co3O4 nanoparticles compared to undoped Co3O4 nanoparticles. Conversely, the absorption curves of 4%, 6%, and 10% Cu-doped Co3O4 nanoparticles showed a red shift, or a shift towards a higher value of wavelength, compared to undoped Co3O4 nanoparticles. The optical band gap values (Eg) of samples have been determined using the following Tauc's equation:where α is the absorption coefficient, hν is the photon energy, B is a constant, and the value of n depends on the nature of transition: n = 2 for indirect allowed transition and n = 1/2 for direct allowed transition, n = 3/2 for direct forbidden transition, n = 3 for indirect forbidden transition. The (αhν)2 versus hν curves for samples annealed at 500 °C are shown in Fig. 3b. It reveals two band gaps associated with the electronic band structure of cobalt oxide. The band gap energy of samples was estimated by extrapolating the linear part of the curves to zero absorption (α = 0).35 The direct Eg values are given in Table 2. The presence of two band gaps is ascribed to the electronic band structure of cobalt oxide. The first band gap (Eg1) is attributed to the O2− Co3+ charge transfer (with the Co3+ level located below the conduction band), whereas the higher band gap (Eg2) is assigned to the O2− Co2+ charge transfer process.35,36
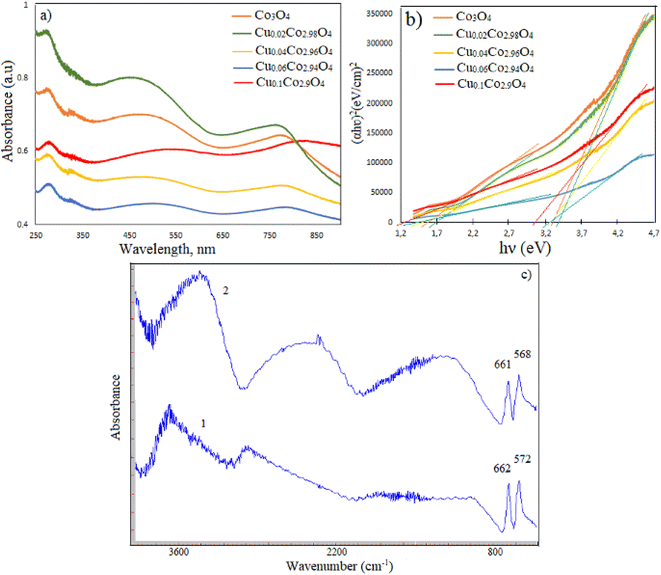 |
| | Fig. 3 (a) The absorption spectrums and (b) the band gap energy plots for CuxCo3−xO4 nanoparticles; (c) FT-IR spectra of undoped (2) and 10% Cu doped Co3O4 nanoparticles (1). | |
Table 2 The band gap energy values and degradation efficiency in 330 min for CuxCo3−xO4 nanoparticles
| Sample |
The band gap (eV) (for samples annealed at 500 °C) |
Degradation efficiency (%) |
| Undoped Co3O4 |
1.58 and 3.33 |
79.20 |
| Cu0.02Co2.98O4 |
1.70 and 3.43 |
87.51 |
| Cu0.04Co2.96O4 |
1.45 and 3.26 |
74.66 |
| Cu0.06Co2.94O4 |
1.44 and 3.21 |
85 |
| Cu0.1Co2.9O4 |
1.26 and 3.08 |
65.60 |
The Eg value of pure Co3O4 nanoparticles increased from 1.58 eV and 3.33 eV to 1.70 eV and 3.43 eV when doped with 2% Cu. However, with higher Cu content, the band gap decreased. The increase in the band gap (Eg) of 2% Cu-doped Co3O4 nanoparticles can be attributed to the Moss–Burstein effect. The energy band broadening occurs when the Fermi level lifts into the conduction band according to Moss–Burstein effect. The decrease in band gap at higher Cu dopant concentrations is associated with crystal defects. The incorporation of more Cu2+ ions into the Co3O4 lattice leads to an increase in defects.37 When Cu2+ ions enter the crystal lattice of cobalt oxide in large quantities, the obtained mixed oxide shows combined physicochemical characteristics of both copper oxide and cobalt oxide.
3.3 FT-IR spectroscopy
IR spectra of undoped and 10% Cu-doped Co3O4 nanoparticles are given in Fig. 3c and d, respectively. Two sharp absorption peaks appeared at 661 cm−1 (υ1) and 568 cm−1 (υ2) in the spectrum of undoped Co3O4 nanoparticles. The υ1 band is attributed to the tetrahedral coordinated Co2+ ions, while the υ2 band is assigned to the octahedral coordinated Co3+ ions.38 These characteristic peaks were observed at 662 cm−1 and 572 cm−1 in the spectrum of 10% Cu-doped Co3O4 nanoparticles. So, this result confirms the formation of Co3O4 with spinel structure. The absence of a peak related to Cu–O bond in the spectrum of Cu-doped Co3O4 nanoparticles can be explained by the overlapping of Cu–O peak with Co–O peak due to their closely similar vibration wavelengths.25,39
3.4 TEM and EDX studies
TEM measurements were conducted to determine the size and morphology of obtained samples. The TEM images of pure Co3O4 nanoparticles are presented in Fig. 4A. For TEM measurements, the sample was dispersed in ethanol by ultrasonic vibration and was dropped onto the surface of carbon-coated copper grids. It can be seen that nanoparticles show spherical-like, hexagonal-like and irregularly structured morphology and the average diameter of Co3O4 nanoparticles is in the range of 5.57–79.15 nm. Fig. 4B displays TEM images of 10% Cu-doped Co3O4 nanoparticles. These nanoparticles exhibit various morphologies, including spherical-like, hexagonal-like, rhombohedral-like, and irregular structures. The size of nanoparticles is in the range of 15.78–78.31 nm.
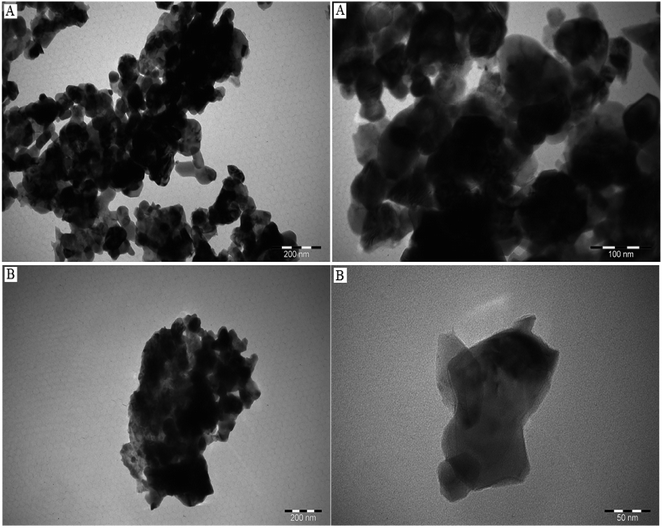 |
| | Fig. 4 TEM images of (A) undoped Co3O4 and (B) 10% Cu-doped Co3O4 nanoparticles. | |
To determine the elemental composition, stoichiometry and purity of samples EDX analysis was carried out. EDX analysis results of undoped Co3O4 nanoparticles (Fig. 5A) indicate the presence of cobalt and oxygen elements, with each element constituting 50% of the composition. The EDX spectrum depicted in Fig. 5B confirms the presence of cobalt, copper and oxygen elements in the synthesized 2% Cu-doped Co3O4 nanoparticles and atomic percentages of these elements are 48.43%, 0.31% and 50.32%, respectively. Based on this result, the percentage ratio of Cu/Co atoms is found to be 0.006, which this value is close to the theoretical ratio of Cu/Co atoms (0.007) in the Cu0.02Co2.98O4 sample. For 4% Cu-doped Co3O4 nanoparticles (Fig. 6A), atomic percentages of cobalt, copper and oxygen elements are 49.47%, 0.53% and 50%, respectively. The percentage ratio of Cu/Co atoms is equal to 0.01 and this value coincides with the theoretical ratio of Cu/Co atoms (0.01) in the Cu0.04Co2.96O4 compound. For 6% Cu-doped Co3O4 nanoparticles (Fig. 6B), atomic percentages of cobalt, copper and oxygen elements are 48.98%, 1.02% and 50%, respectively. According to the result, the percentage ratio of Cu/Co atoms is equal to 0.02 and this value coincides with the theoretical ratio of Cu/Co atoms (0.02) in the Cu0.06Co2.94O4 compound.
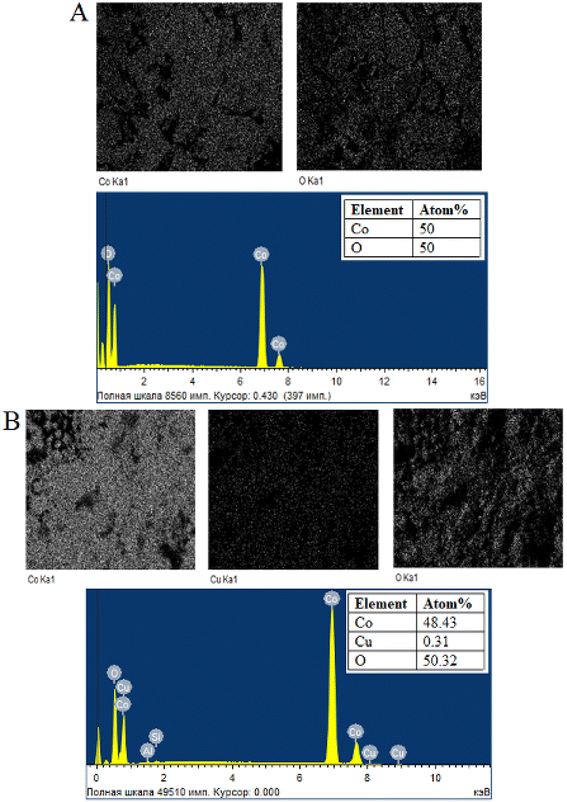 |
| | Fig. 5 Element mapping and EDX spectrum of (A) undoped Co3O4 and (B) 2% Cu-doped Co3O4 nanoparticles. | |
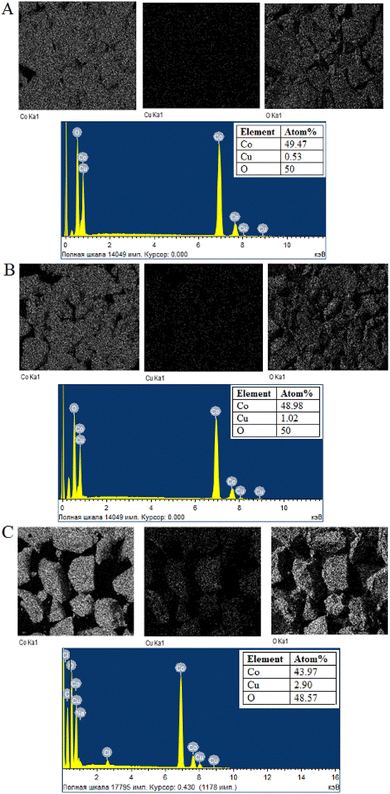 |
| | Fig. 6 Element mapping and EDX spectrum of (A) 4% Cu-doped, (B) 6% Cu-doped and (C) 10% Cu-doped Co3O4 nanoparticles. | |
EDX analysis results of 10% Cu-doped Co3O4 nanoparticles (Fig. 6C) reveal the presence of cobalt, copper, oxygen, sodium, chlorine elements and the atomic percentages of these elements are 43.97%, 2.90%, 48.57%, 3.39% and 1.17%, respectively. The occurrence of trace amounts of sodium and chlorine elements can be attributed to the initial reagents utilized in the synthesis process. Based on the results, the percentage ratio of Cu/Co atoms is equal to 0.06, which is close to the theoretical ratio of Cu/Co atoms (0.03) in the Cu0.1Co2.9O4 sample. When examining the element mapping of the Cu-doped Co3O4 nanoparticles, it becomes evident that the distribution of Co, Cu, and O elements coincides.
3.5 Raman spectroscopy
The Raman spectra of pure, 2% Cu-doped Co3O4 and 10% Cu-doped Co3O4 nanoparticles are presented in Fig. 7. Three Raman peaks at 184 cm−1, 464 cm−1 and 666 cm−1 are observed for pure Co3O4 nanoparticles. These peaks are correspond to the F2g, Eg and A1g modes, respectively, which they are in good agreement with the reported literatures.40–42 The strong band at 666 cm−1 (A1g mode) is assigned to the characteristics of the octahedral sites, while F2g and Eg modes are attributed to the combined vibrations of the tetrahedral site and octahedral oxygen motions.42 As can be seen from the figure, the intensity of Raman peaks decreased after doping of Co3O4 with Cu. The Raman peaks at 514 cm−1 and 674 cm−1 are observed for 2% Cu-doped Co3O4 nanoparticles and the Raman peaks at 512 cm−1 and 674 cm−1 are observed for 10% Cu-doped Co3O4 nanoparticles. A slight shift of the peak observed at A1g mode to higher wavenumbers occurred after doping.
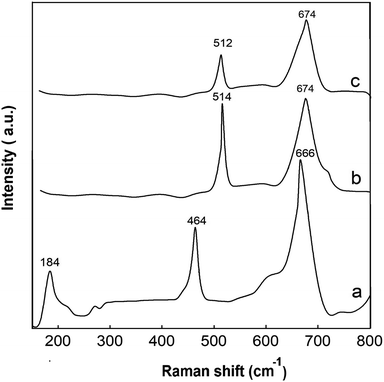 |
| | Fig. 7 Raman spectra of (a) undoped, (b) 2% Cu-doped Co3O4 and (c) 10% Cu-doped Co3O4 nanoparticles. | |
3.6 Photocatalytic activity
Fig. 8 illustrates the photocatalytic degradation of methylene blue in the presence of CuxCo3−xO4 (x = 0, 0.02, 0.04, 0.06, 0.1) nanoparticles. Initially, we examined the dye's degradation efficiency under visible light over time in the presence of H2O2 without a catalyst, for comparative purposes (Fig. 8b). The MB dye exhibits its highest absorption peak at a wavelength of 663.4 nm. The figure clearly indicates a time-dependent reduction in the intensity of the absorption curve. Based on the experimental findings, the degradation efficiency for MB dye in the presence of undoped Co3O4 nanoparticles and H2O2 (Fig. 8a) was determined using the eqn (1) and was 79.20% after 330 min. Conversely, in the absence of a catalyst, the dye's degradation was minimal, with an efficiency of only 2.72% after 330 minutes. According to reports, the decomposition of MB dye without H2O2 proceeds with difficulty when Co3O4 is used as a photocatalyst. The degradation efficiency improves significantly by introducing an oxidant and carefully choosing its concentration. While a higher concentration of the oxidizing agent enhances the degradation rate by increasing hydroxyl radicals (OH˙), there are instances where this process may lead to the counterproductive scavenging of valuable OH˙ radicals, resulting in the formation of weaker hyperoxyl radicals ( ).43 The pH of the dye solution plays a critical role in the degradation. Researchers found that using Co3O4 nanoparticles as a catalyst, an alkaline medium lead to the decomposition of H2O2 into water and oxygen, while in an acidic medium, the number of OH˙ radicals decreases with the formation of positively charged H+ ions, resulting in decreased degradation efficiency.43 Thus, for our experiments, a neutral pH environment was chosen. The mechanism of the photocatalytic degradation process is as follows: when the light energy is equal to or exceeds the band gap energy of the catalyst, electrons are excited from the valence zone to the conduction zone. This generates positively charged holes in the valence zone and negatively charged electrons in the conduction zone. The positively charged holes produce OH˙ radicals through water oxidation or by being captured by OH−. Electrons in the conduction zone react with oxygen adsorbed on the catalyst's surface and form superoxide anion radicals (˙O2−). Consequently, these radicals decompose the dye solution.28,43 The generation of hydroxyl radicals occurs according to the Photo-Fenton reaction mechanism. Based on this complex reaction mechanism, Co2+ ions react with H2O2 to form OH˙ radicals, and Co2+ ions are regenerated as a consequence of the reduction of Co3+ ions together with the ligand present in the solution. The detailed reaction mechanism is as follows:43
| ˙O2− + H2O → H2O2 + ecb− → OH˙ |
| Co2+(ads) + H2O2 → Co3+(ads) + OH− + OH˙ |
| Methylene blue dye + hvb+ → oxidation product |
| Methylene blue dye + OH˙ → degradation product |
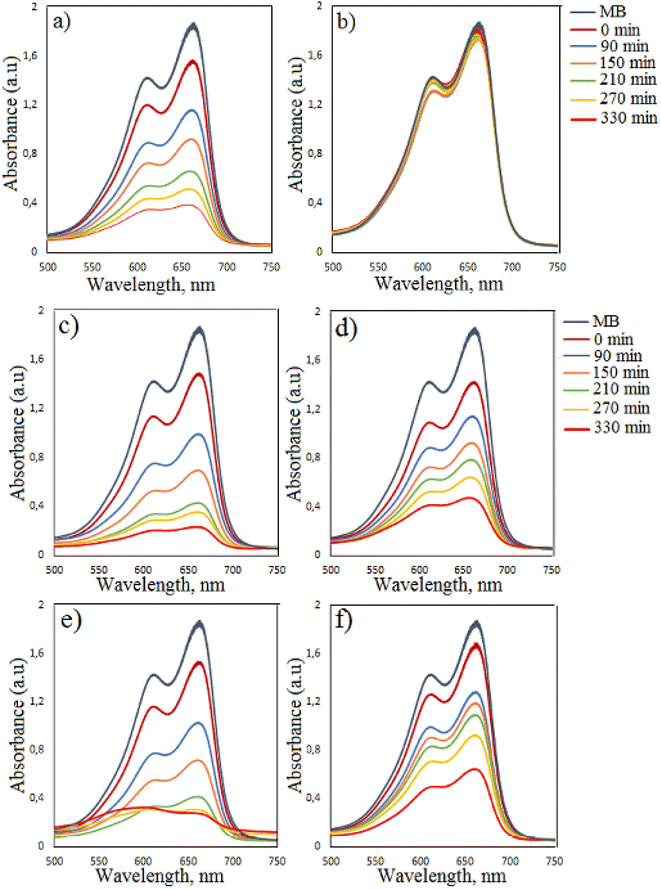 |
| | Fig. 8 Time-dependent photocatalytic degradation of MB dye (a) in the presence of undoped Co3O4 nanoparticles and H2O2; (b) in the presence of H2O2 without catalyst under visible light irradiation; in the presence of (c) 2%, (d) 4%, (e) 6%, (f) 10% Cu-doped Co3O4 nanoparticles and H2O2 under visible light irradiation. | |
The degradation efficiency of MB dye in the presence of Cu0.02Co2.98O4 nanoparticles improved. In the presence of Cu0.02Co2.98O4, Cu0.04Co2.96O4, Cu0.06Co2.94O4, Cu0.1Co2.9O4 nanoparticles, the degradation efficiency of MB dye increased from 46.77% to 87.51%, 38.76% to 74.66%, 44.95% to 85% and 31.47% to 65.60% for 90–330 min irradiation time, respectively. As can be seen from the results, the highest degradation was observed in the presence of Cu0.02Co2.98O4 nanoparticles and the weak degradation was observed in the presence of Cu0.1Co2.9O4 nanoparticles. When Cu0.04Co2.96O4 and Cu0.1Co2.9O4 nanoparticles are used, the degradation efficiency decreases in comparison to undoped Co3O4 nanoparticles. Cu0.02Co2.98O4 nanoparticles have a wide band gap and as a result of their use as a catalyst, an increase in the degradation efficiency occurs with decreasing electron–hole pair recombination and the generation of free electrons and holes for the formation of radicals. However, when the concentration of copper is high, the photocatalytic activity diminishes. This can be ascribed to excessive oxygen vacancies and the high amount of the dopant, which acts as recombination centers for photoinduced electrons and holes.34 The experiments were also performed for the degradation of MB in the presence of Cu0.02Co2.98O4 nanoparticles by varying the initial dye concentration (5 ppm and 20 ppm) and amount of photocatalyst (20 mg and 30 mg). When using 20 mg and 30 mg Cu0.02Co2.98O4 nanoparticles, the degradation efficiency of MB dye was found to be 90.94% and 93.19% in 330 min, respectively. For these experiments, the concentration of the dye was taken as 10 ppm. When using 5 ppm and 20 ppm dye concentrations, the value of the degradation efficiency of MB dye was 90.48% and 86.44% in 330 min, respectively. For these experiments, the amount of photocatalyst was taken as 10 mg (Fig. 9).
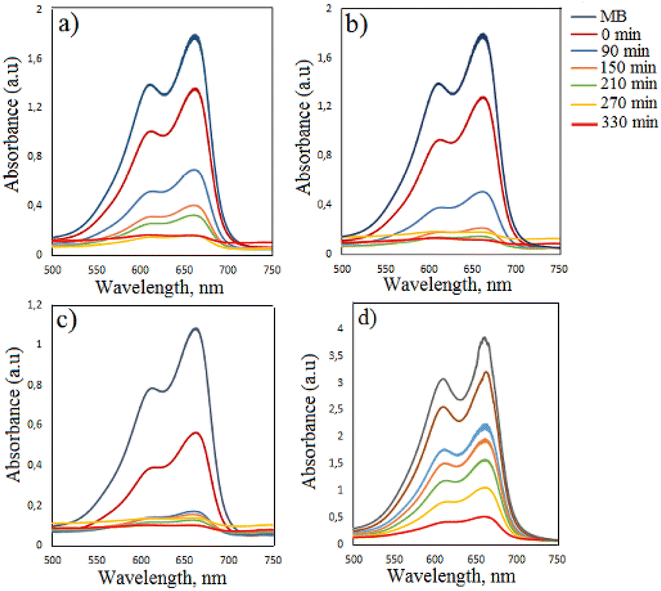 |
| | Fig. 9 Time-dependent photocatalytic degradation of MB dye in the presence of Cu0.02Co2.98O4 nanoparticles: (a) amount of photocatalyst is 20 mg, (b) amount of photocatalyst is 30 mg, (c) the concentration of the dye is 5 ppm and (d) the concentration of the dye is 20 ppm. | |
4 Conclusion
In the present study, CuxCo3−xO4 (x = 0, 0.02, 0.04, 0.06, 0.1) nanoparticles were synthesized by sonochemical method and subsequent calcination at high temperature. Based on the XRD analysis, the size of Co3O4 nanoparticles exhibits irregular changes as the concentration of Cu increases. The band gap value of undoped Co3O4 nanoparticles initially rises from 1.58 eV and 3.33 eV to 1.70 eV and 3.43 eV with a 2% Cu doping content, but subsequently decreases with higher Cu content. The increase in the band gap of Cu0.02Co2.98O4 nanoparticles can be attributed to the Moss-Burstein effect and the decrease of band gap at higher dopant concentrations can be explained with crystal defect. According to TEM measurements, Cu0.1Co2.9O4 nanoparticles exhibit spherical-like, hexagonal-like, rhombohedral-like and irregularly structured morphology and the size of nanoparticles is in the range of 15.78–78.31 nm. EDX results reveal that the percentage ratio of Cu/Co atoms is near to the theoretical ratio of Cu/Co atoms in the CuxCo3−xO4 compound and the distribution of Co, Cu and O elements coincide. FT-IR and Raman results also confirm the formation of Co3O4. The highest degradation efficiency for MB dye (87.51%) was observed in the presence of Cu0.02Co2.98O4 nanoparticles and this value increased with increasing the amount of photocatalyst and with decreasing of dye concentration to 93.19% and 90.48%, respectively.
Conflicts of interest
There are no conflicts to declare.
References
- X. Fan, Y. Xu, C. Ma and W. He, J. Alloys Compd., 2021, 854, 157234, DOI:10.1016/j.jallcom.2020.157234.
- X. Zhu, B. Bai, B. Zhou and S. Ji, Catal. Commun., 2021, 156, 106320, DOI:10.1016/j.catcom.2021.106320.
- F. Zheng and L. Wei, J. Alloys Compd., 2019, 790, 955–962, DOI:10.1016/j.jallcom.2019.03.212.
- G. Wei, L. Yan, H. Huang, F. Yan, X. Liang, S. Xu, Z. Lan, W. Zhou and J. Guo, Appl. Surf. Sci., 2021, 538, 147932, DOI:10.1016/j.apsusc.2020.147932.
- K. Wang, C. Wu, F. Wang, N. Jing and G. Jiang, ACS Sustainable Chem. Eng., 2019, 7, 18582–18592, DOI:10.1021/acssuschemeng.9b04813.
- J. Moon, T. K. Kim, B. VanSaders, C. Choi, Z. Liu, S. Jin and R. Chen, Sol. Energy Mater. Sol. Cells, 2015, 134, 417–424, DOI:10.1016/j.solmat.2014.12.004.
- L. Wang, X. C. Song and Y. F. Zheng, Micro Nano Lett., 2012, 7, 1026–1029, DOI:10.1049/mnl.2012.0609.
- H. Heidari, E. Habibi, R. Mohammad-Rezaei and S. Pirsa, J. Appl. Chem., 2019, 14, 259–270, DOI:10.22075/CHEM.2019.14239.1392.
- S. Dhiman and B. Gupta, Environ. Technol. Innovation, 2021, 23, 101765, DOI:10.1016/j.eti.2021.101765.
- B. Zhang, X. Zhou, C. Jiang, F. Qu and M. Yang, Mater. Lett., 2018, 218, 127–130, DOI:10.1016/j.matlet.2018.01.170.
- M. Pang, G. Long, S. Jiang, Y. Ji, W. Han, B. Wang, X. Liu, Y. Xi, D. Wang and F. Xu, Chem. Eng. J., 2015, 280, 377–384, DOI:10.1016/j.cej.2015.06.053.
- J. M. Xu, J. Zhang, B. B. Wang and F. Liu, J. Alloys Compd., 2015, 619, 361–367, DOI:10.1016/j.jallcom.2014.09.020.
- A. Askarinejad and A. Morsali, Ultrason. Sonochem., 2009, 16, 124–131, DOI:10.1016/j.ultsonch.2008.05.015.
- V. S. Devi, M. Athika, E. Duraisamy, A. Prasath, A. S. Sharma and P. Elumalai, J. Energy Storage, 2019, 25, 100815, DOI:10.1016/j.est.2019.100815.
- J. C. Toniolo, A. S. Takimi and C. P. Bergmann, Mater. Res. Bull., 2010, 45, 672–676, DOI:10.1016/j.materresbull.2010.03.001.
- S. G. Kandalkar, J. L. Gunjakar and C. D. Lokhande, Appl. Surf. Sci., 2008, 254, 5540–5544, DOI:10.1016/j.apsusc.2008.02.163.
- M. Shkir, A. Khan, M. Imran, M. A. Khan, R. A. Zargar, T. Alshahrani, K. D. Arun Kumar, P. Mohanraj, K. V. Chandekar and S. AlFaify, Opt Laser. Technol., 2022, 150, 107959, DOI:10.1016/j.optlastec.2022.107959.
- J. K. Sharma, P. Srivastava, G. Singh, M. S. Akhtar and S. Ameen, J. Mater. Sci. Eng. B, 2015, 193, 181–188, DOI:10.1016/j.mseb.2014.12.012.
- A. Rehman, M. Aadil, S. Zulfiqar, P. O. Agboola, I. Shakir, M. F. Aly Aboud, S. Haider and M. F. Warsi, Ceram. Int., 2021, 47, 5929–5937, DOI:10.1016/j.ceramint.2020.11.064.
-
(a) S. Ghazal, N. Khandannasab, H. Ali Hosseini, Z. Sabouri, A. Rangrazi and M. Darroudi, Ceram. Int., 2021, 47, 27165–27176, DOI:10.1016/j.ceramint.2021.06.135;
(b) W. Zhang, P. Anguita, J. Díez-Ramírez, C. Descorme, J. L. Valverde and A. Giroir-Fendler, Catalysts, 2020, 10, 865–879, DOI:10.3390/catal10080865.
- K. Lu, T. Gu, L. Zhang, Z. Wu, R. Wang and X. Li, Chem. Eng. J., 2021, 408, 127352, DOI:10.1016/j.cej.2020.127352.
- M. Aadil, S. Zulfiqar, M. F. Warsi, P. O. Agboola, I. Shakir, M. Shahid and N. F. Al-Khalli, Ceram. Int., 2021, 47, 9806–9817, DOI:10.1016/j.ceramint.2020.12.121.
- R. Wang, D. Hu, P. Du, X. Weng, H. Tang, R. Zhang, W. Song, S. Lin, K. Huang, R. Zhang, Y. Wang, D. Fan, X. Pan and M. Lei, Front. Chem., 2022, 9, 1–8, DOI:10.3389/fchem.2021.812375.
- C. S. Jincy and P. Meena, Mater. Today: Proc., 2021, 43, 2459–2463, DOI:10.1016/j.matpr.2021.02.529.
- A. UmaSudharshini, M. Bououdina, M. Venkateshwarlu, P. Dhamodharan and C. Manoharan, Appl. Phys. A, 2021, 127, 1–11, DOI:10.1007/s00339-021-04498-6.
- K. Yan, J. Chi, J. Xie, B. Dong, Z. Liu, W. Gao, J. Lin, Y. Chai and C. Liu, Renewable Energy, 2018, 119, 54–61, DOI:10.1016/j.renene.2017.12.003.
- S. J. Mammadyarova, M. B. Muradov, A. M. Maharramov, G. M. Eyvazova, Z. A. Aghamaliyev, O. O. Balayeva and I. Hasanova, Spectrosc. Lett., 2019, 52, 677–686, DOI:10.1080/00387010.2019.1686396.
- R. Singh, P. B. Barman and D. Sharma, J. Mater. Sci.: Mater. Electron., 2017, 28, 5705–5717, DOI:10.1007/s10854-016-6242-2.
- C. M. Magdalane, K. Kaviyarasu, M. V. Arularasu, K. Kanimozhi and G. Ramalingam, Surf. Interfaces, 2019, 17, 100369, DOI:10.1016/j.surfin.2019.100369.
- P. Jamdagni, P. Khatri and J. S. Rana, J. King Saud Univ., Sci., 2018, 30, 168–175, DOI:10.1016/j.jksus.2016.10.002.
- O. O. Balayeva, A. A. Azizov, M. B. Muradov, R. M. Alosmanov, G. M. Eyvazova and S. J. Mammadyarova, Heliyon, 2019, 5, e02725, DOI:10.1016/j.heliyon.2019.e02725.
- C. Aydın, H. M. El-Nasser, F. Yakuphanoglu, I. S. Yahia and M. Aksoy, J. Alloys Compd., 2011, 509, 854–858, DOI:10.1016/j.jallcom.2010.09.111.
- G. Mu, Y. Zeng, Y. Zheng, Y. Cao, F. Liu, S. Liang, Y. Zhan and L. Jiang, Green Energy Environ., 2023, 8, 831–841, DOI:10.1016/j.gee.2021.11.001.
- B. Hameeda, A. Mushtaq, M. Saeed, A. Munir, U. Jabeen and A. Waseem, Toxin Rev., 2021, 40, 1396–1406, DOI:10.1080/15569543.2020.1725578.
- R. M. Al-Tuwirqi, A. A. Al-Ghamdi, F. Al-Hazmi, F. Alnowaiser, A. A. Al-Ghamdi, N. A. Aal and F. El-Tantawy, Superlattices Microstruct., 2011, 50, 437–448, DOI:10.1016/j.spmi.2011.06.007.
- C. R. Dhas, R. Venkatesh, K. Jothivenkatachalam, A. Nithya, B. S. Benjamin, A. M. E. Raj, K. Jeyadheepan and C. Sanjeeviraja, Ceram. Int., 2015, 41, 9301–9313, DOI:10.1016/j.ceramint.2015.03.238.
- O. Muktaridha, M. Adlim, S. Suhendrayatna and I. Ismail, Arabian J. Chem., 2021, 14, 103175, DOI:10.1016/j.arabjc.2021.103175.
- S. A. Makhlouf, Z. H. Bakr, K. I. Aly and M. S. Moustafa, Superlattices Microstruct., 2013, 64, 107–117, DOI:10.1016/j.spmi.2013.09.023.
- Z. S. Mehrabadi, A. Ahmadpour, N. Shahtahmasebi and M. M. B. Mohagheghi, Phys. Scr., 2011, 84, 015801, DOI:10.1088/0031-8949/84/01/015801.
- S. Deng, N. Chen, D. Deng, Y. Li, X. Xing and Y. Wang, Ceram. Int., 2015, 41, 11004–11012, DOI:10.1016/j.ceramint.2015.05.045.
- Y. Wang, X. Wei, X. Hu, W. Zhou and Y. Zhao, Catal. Lett., 2019, 149, 1026–1036, DOI:10.1007/s10562-019-02681-2.
- A. Diallo, A. C. Beye, T. B. Doyle, E. Park and M. Maaza, Green Chem. Lett. Rev., 2015, 8, 30–36, DOI:10.1080/17518253.2015.1082646.
- T. Warang, N. Patel, A. Santini, N. Bazzanella, A. Kale and A. Miotello, Appl. Catal., A, 2012, 423–424, 21–27, DOI:10.1016/j.apcata.2012.02.037.
|
| This journal is © The Royal Society of Chemistry 2024 |
Click here to see how this site uses Cookies. View our privacy policy here.  Open Access Article
 *a,
G. M. Eyvazovaa,
O. O. Balayevab,
G. Aliyevaa,
I. Hasanovab,
S. Z. Melikovac,
N. Musayeva
 d,
N. Sadigove and
M. I. Abdullayeve

![[thin space (1/6-em)]](https://www.rsc.org/images/entities/char_2009.gif) cos
cos![[thin space (1/6-em)]](https://www.rsc.org/images/entities/char_2009.gif) θ
θ


 ).43 The pH of the dye solution plays a critical role in the degradation. Researchers found that using Co3O4 nanoparticles as a catalyst, an alkaline medium lead to the decomposition of H2O2 into water and oxygen, while in an acidic medium, the number of OH˙ radicals decreases with the formation of positively charged H+ ions, resulting in decreased degradation efficiency.43 Thus, for our experiments, a neutral pH environment was chosen. The mechanism of the photocatalytic degradation process is as follows: when the light energy is equal to or exceeds the band gap energy of the catalyst, electrons are excited from the valence zone to the conduction zone. This generates positively charged holes in the valence zone and negatively charged electrons in the conduction zone. The positively charged holes produce OH˙ radicals through water oxidation or by being captured by OH−. Electrons in the conduction zone react with oxygen adsorbed on the catalyst's surface and form superoxide anion radicals (˙O2−). Consequently, these radicals decompose the dye solution.28,43 The generation of hydroxyl radicals occurs according to the Photo-Fenton reaction mechanism. Based on this complex reaction mechanism, Co2+ ions react with H2O2 to form OH˙ radicals, and Co2+ ions are regenerated as a consequence of the reduction of Co3+ ions together with the ligand present in the solution. The detailed reaction mechanism is as follows:43


