 Open Access Article
Enhanced catalytic reductive hydrogenation of an organic dye by Ag decorated graphitic carbon nitride modified MCM-41
Manas Ranjan Pradhana,
Braja B. Nandab,
Asima Subhadarshinia,
Lipsa Pandaa and
Binita Nanda *a
*a
aDepartment of Chemistry, Faculty of Engineering and Technology (ITER), Siksha ‘O’ Anusandhan (Deemed to be) University, Bhubaneswar 751 030, Odisha, India. E-mail: binitananda@soa.ac.in
bP.G. Department of Chemistry, Vikram Deb Autonomous College, Jeypore 764001, Odisha, India
First published on 2nd January 2024
Abstract
Utilization of efficient, stable and reusable catalysts for wastewater treatment and catalytic elimination of toxic pollutants is a challenge among researchers. This present work shows the synthesis of high-surface-activity Ag nanoparticle decorated gC3N4 modified MCM-41 and its efficiency towards catalytic hydrogenation of organic dye in the presence of reducing agent NaBH4. The proposed mechanism is based on the transfer of H+ and 2e− between the dye and the catalyst. Adsorption of dye stuff on the catalyst is a rate-determining step and is accelerated by the MCM-41 support which enhances the surface area. The catalytic efficiency and optimum time requirement were examined through the adsorption–desorption equilibrium, pseudo-first-order reaction kinetic model for the dye. The result obtained was 98% catalytic efficiency followed by the catalytic hydrogenation reaction.
Introduction
A current worldwide concern, water pollution is constantly caused by humans and is being addressed using a variety of calculated strategies.1–5 Discharge of a wide variety of pollutants like organics, pharmaceuticals, textile dyes etc. from industries leads to wastewater treatment being more complicated. In particular, the presence of organic dyes and non-biodegradable pollutants like alcohols in wastewater represents a high risk to human health and entire ecosystems.6–11 Different wastewater techniques like coagulation, biological processes, adsorption, catalytic processes, and photocatalytic processes are adopted.10–13 Catalytic and light-derived processes are of low cost, energy saving, simple to operate and green methods to reduce the concentration of pollutants and convert them into harmless byproducts. The presence of C![[double bond, length as m-dash]](https://www.rsc.org/images/entities/char_e001.gif) N, N
N, N![[double bond, length as m-dash]](https://www.rsc.org/images/entities/char_e001.gif) N, and N
N, and N![[double bond, length as m-dash]](https://www.rsc.org/images/entities/char_e001.gif) O in organic dyes means that catalytic hydrogenation using NaBH4 is a promising method to reduce the toxicity.14–16 In another way, photocatalytic oxidation of alcohols and their derivatives to harmless products is challenging to the scientific community. In this context, development of new catalysts is essential to carry out these reactions.
O in organic dyes means that catalytic hydrogenation using NaBH4 is a promising method to reduce the toxicity.14–16 In another way, photocatalytic oxidation of alcohols and their derivatives to harmless products is challenging to the scientific community. In this context, development of new catalysts is essential to carry out these reactions.
In this scenario, metal nanoparticles play an important role in the decolorization of organic dyes and in the presence of reducing agent NaBH4 can accelerate electron transfer during the reduction reactions.17–19 In heterogeneous catalysis processes, control of nanoparticle morphology contributes a major role in catalytic efficiency. A number of nanoparticles (Au, Ag, Cu, Fe etc.) have already been used in different catalytic applications.20 But today it is a challenge to use nanoparticles in catalytic processes which leads to a decrease in the active catalytic sites because of the obstacle of their aggregation into larger particles. To avoid these problems, immobilization of nanoparticles through doping and coating on support materials overcomes the aggregation problem. To overcome the aggregation problem, immobilization of nanoparticles on the surface of graphitic carbon nitride (gCN) is a feasible alternative.21–23 The surface of gCN acts like an active support favoring the process of adsorption and transfer of electrons between metal nanoparticles and organic molecules, enhancing the catalytic process. gCN is a π-conjugated two-dimensional (2D) material with sp2 hybridization showing improved performance in catalytic applications, high condensation increasing the thermal and chemical stability, faster charge transport and suitable band gap (∼2.7 eV).24–26 Though gCN shows good catalytic activity, photocatalytic activity is still not satisfactory because of (i) limited absorption of broad-spectrum UV/visible light, (ii) absence of interlayer hybridization of electronic states inhibiting charge carrier mobilization, and most importantly (iii) less surface area. To overcome these drawbacks, various strategies are adopted, with doping, formation of heterojunctions, and manipulating the material with an appropriate textural porosity to increase the surface area having been emphasized.
MCM-41, having a structure with a hexagonal array, is the best studied mesoporous siliceous material with high surface area (∼1000 m2 g−1), wide pore diameter and pore volume. With this excellent textural property, it is considered as a good support material. Though it is amorphous by nature, it possesses semiconducting property after modification with transition metals/metal oxides or polymeric semiconducting materials, which are active under visible and UV light. This modification of the MCM-41 support increases the surface-active sites of the semiconducting material and facilitates photogenerated charge transfer to the surface. To date, our group has been attempting a number of works by taking a mesoporous support for various applications. Binita and her group synthesized metal/metal oxide modified MCM-41 (Cu/ZrO2-MCM-41), ZnFe2O4/Al2O3-MCM-41, MnO2-MCM-41, Cu/Al2O3-MCM-41, red mud/MCM-41, and Cu/CuO/gC3N4-MCM-41 for various photocatalytic oxidation and reduction reactions.27–30
The synergistic combination of gCN and metal nanoparticles on a mesoporous support improves the conductivity of nanocomposites. The high surface area provides good adsorption sites for better catalytic applications. During the preparation of gCN/nanoparticle composite, the use of strong reducing agent NaBH4 prevents the oxidation of gCN and promotes the reduction process. Among the modifications with different nanoparticles (Au, Ag, Cu, Pt, etc.), the gCN/Ag composite has attracted attention because of superior optical and electrical properties and high catalytic hydrogenation activity among other gCN/NPs composites.31 The presence of plasmonic Ag nanoparticles enhances the photocatalytic activity due to the localized surface plasmon resonance (LSPR) effect. The LSPR effect is mainly due to the injection of hot electrons which enhances the scattering of photons and leads to high photocatalytic performance. A handful of works have been attempted by taking Ag/gCN for various applications. Plasmonic Ag nanoparticle decorated g-C3N4 was synthesized by the Ding group for the photocatalytic degradation of MO and H2 evolution.32 Khan et al. fabricated an environmentally sustainable Ag/g-C3N4 nanostructure for the photocatalytic degradation of MB and rhodamine B (RhB) and for its antibacterial activity.33 Li and his team synthesized Ag/g-C3N4 nanosheets for photocatalytic oxidation of RhB.34
In this present study, we synthesized exfoliated gCN, which was then anchored on mesoporous support MCM-41 to enhance its surface-active sites. To increase the catalytic efficiency, the surface of gCN/MCM-41 was modified with Ag nanoparticles.
Synthesis of Ag/porous exfoliated g-C3N4-MCM-41
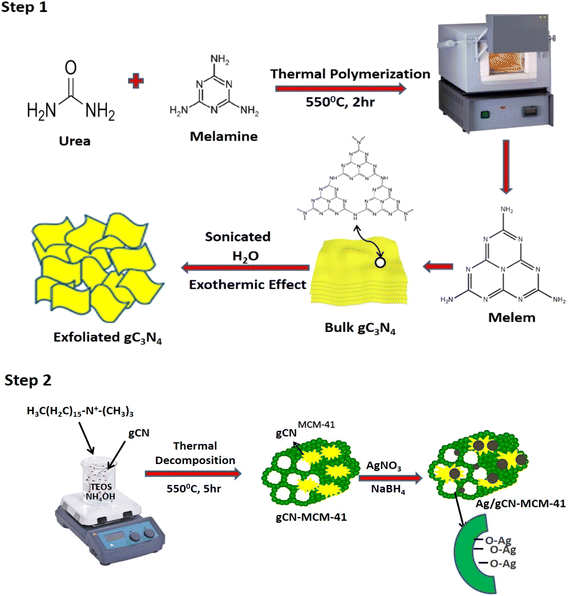
The detailed procedure is divided into four steps.Step 1: Graphitic carbon nitride powders were prepared by heating melamine and urea in a muffle furnace. A semi-closed alumina crucible was filled with 5 g of melamine and 5 g of urea with a cover. And the crucible was heated to 500 °C and for 2 h at a heating rate of 5 °C min−1. After the de-ammonization was performed, the alumina crucible was cooled to room temperature. The product was collected and crushed into powder with the help of a mortar and pestle and named CN. 1 g of porous g-C3N4 along with 135 mL distilled water were taken in a 250 mL beaker. Then, the contents were thoroughly mixed and the solution was sonicated for 4 hours, followed by centrifugation at 2000 rpm. After that, the obtained residue was placed inside a hot air oven for 5 hours for 70 °C. The exfoliated porous CN was collected and converted into powder with the help of a mortar and pestle.
Step 2: 2.4 g of CTAB was mixed with 120 mL of distilled water and stirred for 30 minutes with the help of a magnetic stirrer. 0.8 g of exfoliated porous CN was added to the mixture and stirred continuously for another 1 hour. After that, 8 mL of NH4OH and 10 mL of tetraethyl orthosilicate (TEOS) were added and again stirred vigorously for 4 hours. The mixture was centrifuged at 2000 rpm and the final sample was calcined at 550 °C for 5 hours. After the calcination, the material was converted into powder and named as CNM.
Step 3: 30 mL of 0.002 M sodium borohydride (NaBH4) was taken in an Erlenmeyer flask and kept in an ice bath and stirred continuously. 30 mL of 0.001 M AgNO3 was added dropwise and the stirring was stopped as soon as all the AgNO3 was added and slight heat was applied to the solution. At last, it was centrifuged, dried in a hot air oven for 5 hours for 80 °C and the residue was collected.
Step 4: Different weight percentages (10, 50 and 90) were impregnated on the surface of CNM through a wetness impregnation method and air dried, and termed as 10 Ag/C3N4/MCM-41 (10ACM), 50 Ag/C3N4/MCM-41 (50ACNM) and 90 Ag/C3N4/MCM-41 (90ACNM).
Formation mechanism
CNM had been synthesized by facile incorporation (in situ) of CN into the surface of MCM-41. Then, Ag(0) nanoparticles were dispersed onto the surface of CNM. During the fabrication, the silanol (Si–OH) groups present in MCM-41 and the available lone pair of electrons present in N atoms of CN were responsible for the reduction of Ag+ → Ag(0). Ag(0) nanoparticles are well dispersed on the surface and get reduced over CN and Ag–O–Si bonds are formed. This indicates the strong interaction of Ag nanoparticles and SiO2. With a high loading of Ag, it may encapsulate the pores of MCM-41 and form Ag2O particles. The detailed formation mechanism of CNM is explained in two steps as shown in Scheme 1.Photocatalytic hydrogenation reaction
The catalytic hydrogenation reaction of RhB was evaluated using NaBH4 as a reducing agent in a batch reactor. In a typical experiment, 100 ppm of RhB (25 mL) was taken in a closed Pyrex flask and mixed with an appropriate amount of catalyst and kept in a closed reactor. To maintain the adsorption–desorption equilibrium, the reaction was stirred in the dark for 30 minutes and then to it was added 25 mL of freshly prepared NaBH4. The final solutions were subjected to irradiation with a 150 W xenon lamp with a 420 nm cutoff filter for a fixed period of time, 90 minutes. The solutions were collected after the fixed period of time and were evaluated through UV-visible spectroscopy at λmax = 554 nm for RhB. In the reaction medium, the catalyst dose was varied from 2 mg to 8 mg. The results for the composite were compared with those for neat CN and CNM with same reaction conditions. The removal efficiency (%) of RhB was calculated by the following formula:| Removal efficiency = (C0 − Ct)/C0 × 100% |
X-ray diffraction study
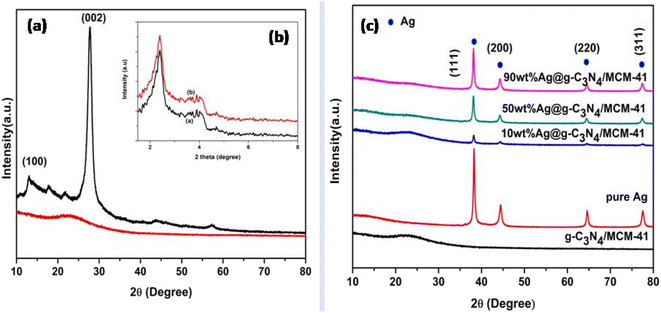
X-ray diffraction was used to determine the structural identity and crystal structure of the synthesized composites, as shown in Fig. 1. In the low-angle XRD pattern of MCM-41, the strong intense (100) peak delineates the presence of mesoporosity and the two less intense (110) and (200) peaks suggest the existence of hexagonal long-range order in the channels.35 After the modification of CN with MCM-41, the strong (100) peak proves that the mesoporosity is maintained, but there is a slight broadening of the (100) peak, indicating the slight reduction in hexagonal symmetry as shown in Fig. 1 (inset). In the broad-angle XRD pattern, two diffraction peaks of exfoliated CN at 2θ = 13.2° and 27.6° describe the planar structure indexed as (100) plane and interlayer stacking of conjugated aromatic system indexed as (002) plane, respectively.36,37 There is no significant peak visible after the modification of MCM-41 with CN because of uniform distribution of very low percentage of CN over the large surface area of MCM-41. The 2θ peak near 22.8° represents the presence of SiO2. The crystallinity decreased and shows a partial amorphous nature because of hybridization of SiO2 with CN. After the modification of CNM surface with different percentages of Ag loading, the crystallinity increases. The peaks at 2θ = 38.4°, 45.3°, 65.7°, and 79.1° corresponding to (111), (200), (220), and (311) planes, respectively, represent the presence of Ag nanoparticles. As the Ag loading increases, the peak intensity is more prominent and confirms the presence of Ag on the surface of CNM. The crystallite size can be calculated by the Scherrer equation (Table 1).| Sample | Crystallite size (nm) |
|---|---|
| g-C3N4 | 6.85 |
| g-C3N4/MCM-41 | 0.28 |
XPS
Formal oxidation state and surface chemical environment were analyzed through XPS spectra, as demonstrated in Fig. 2. The survey spectrum of Ag/C3N4-MCM-41 (ACNM) is shown in Fig. 2a with signals from C, N, Si, Ag elements. Fig. 2b depicts the high-resolution XPS spectrum of C 1s which, after Gaussian curve fitting, was deconvoluted into three single peaks representing functional groups at 284.8 eV (C![[double bond, length as m-dash]](https://www.rsc.org/images/entities/char_e001.gif) C), 285.8 eV (N–C–O), and 288.2 eV (C
C), 285.8 eV (N–C–O), and 288.2 eV (C![[double bond, length as m-dash]](https://www.rsc.org/images/entities/char_e001.gif) N). From the observed peaks it is clear that the binding energy of 284.8 eV mainly corresponds to surface and adventitious sp2 hybridized carbon atoms attached to nitrogen atoms present in the atomic ring of the CN lattice. Again, the peak at 288.2 eV corresponds to a carbon atom bonded to three nitrogen atoms in the same way as that of carbon atoms in melamine molecules. The XPS fitting of N 1s in Fig. 2c gives the result of deconvoluted peaks in the identification of three chemical states of nitrogen at 394.3 eV, 398.1 eV, and 399.9 eV which correspond to sp2 hybridized aromatic N bonded to carbon atoms in the form of C
N). From the observed peaks it is clear that the binding energy of 284.8 eV mainly corresponds to surface and adventitious sp2 hybridized carbon atoms attached to nitrogen atoms present in the atomic ring of the CN lattice. Again, the peak at 288.2 eV corresponds to a carbon atom bonded to three nitrogen atoms in the same way as that of carbon atoms in melamine molecules. The XPS fitting of N 1s in Fig. 2c gives the result of deconvoluted peaks in the identification of three chemical states of nitrogen at 394.3 eV, 398.1 eV, and 399.9 eV which correspond to sp2 hybridized aromatic N bonded to carbon atoms in the form of C![[double bond, length as m-dash]](https://www.rsc.org/images/entities/char_e001.gif) N–C. Another two peaks at 398.1 and 399. 9 eV are ascribed to tertiary nitrogen atom bonded to three carbon atoms N–(C)3 in the CN matrix and to H atom in N–H bonding. Fig. 2d shows the deconvoluted XPS spectrum of Si 2p with peaks observed at 101.5 eV and 100.8 eV. The binding energy peaks at 100.8 eV and 101.5 eV are assigned to the presence of Si–Si (Si substrate) and Si-OHx bonds, respectively. The XPS study shows a peak for O 1s at 532.6 eV, as shown in Fig. 2e, which might be due to the Si–O bond which indicates the close relation between silicon and oxygen. Further, the high-resolution XPS spectrum of Ag 3d has two peaks obtained due to the spin–orbit coupling and related to 3d3/2 and 3d5/2, as shown in Fig. 2f. As per a previous report, the binding energy peaks at 374.2 eV and 368.2 eV are due to the presence of bulk Ag or Ag nanoparticles and binding energies at 374.7 and 368.7 eV suggests the existence of Ag+ oxidic state. After the incorporation of different weight percentages of Ag onto the surface of g-C3N4-MCM-41, the peaks are slightly shifted and the binding energies are located at 366.0 eV, 366.9 eV, 371.8 eV, and 372.5 eV by peak-differentiating technique. The two peaks at 366.9 eV and 372.5 eV are mainly due to the presence of metallic Ag and the shoulder peaks at 366.0 eV and 371.8 eV are in good agreement with Ag+ state.
N–C. Another two peaks at 398.1 and 399. 9 eV are ascribed to tertiary nitrogen atom bonded to three carbon atoms N–(C)3 in the CN matrix and to H atom in N–H bonding. Fig. 2d shows the deconvoluted XPS spectrum of Si 2p with peaks observed at 101.5 eV and 100.8 eV. The binding energy peaks at 100.8 eV and 101.5 eV are assigned to the presence of Si–Si (Si substrate) and Si-OHx bonds, respectively. The XPS study shows a peak for O 1s at 532.6 eV, as shown in Fig. 2e, which might be due to the Si–O bond which indicates the close relation between silicon and oxygen. Further, the high-resolution XPS spectrum of Ag 3d has two peaks obtained due to the spin–orbit coupling and related to 3d3/2 and 3d5/2, as shown in Fig. 2f. As per a previous report, the binding energy peaks at 374.2 eV and 368.2 eV are due to the presence of bulk Ag or Ag nanoparticles and binding energies at 374.7 and 368.7 eV suggests the existence of Ag+ oxidic state. After the incorporation of different weight percentages of Ag onto the surface of g-C3N4-MCM-41, the peaks are slightly shifted and the binding energies are located at 366.0 eV, 366.9 eV, 371.8 eV, and 372.5 eV by peak-differentiating technique. The two peaks at 366.9 eV and 372.5 eV are mainly due to the presence of metallic Ag and the shoulder peaks at 366.0 eV and 371.8 eV are in good agreement with Ag+ state.
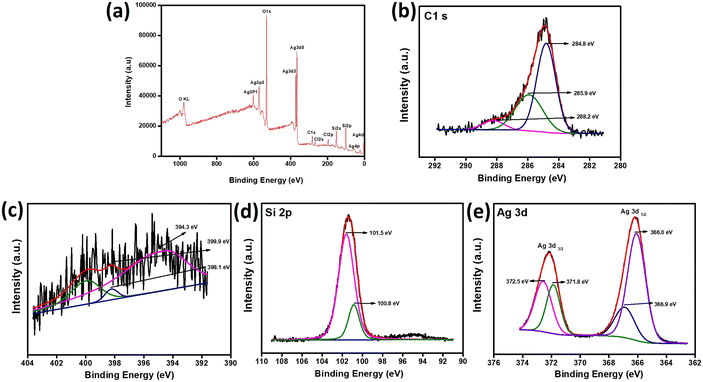 | ||
| Fig. 2 (a) Survey spectrum of 50Ag modified gC3N4/MCXM-41. XPS spectra of (b) C 1s, (c) N 1s, (d) Si 2p, and (e) Ag 3d. | ||
N2 adsorption–desorption isotherm
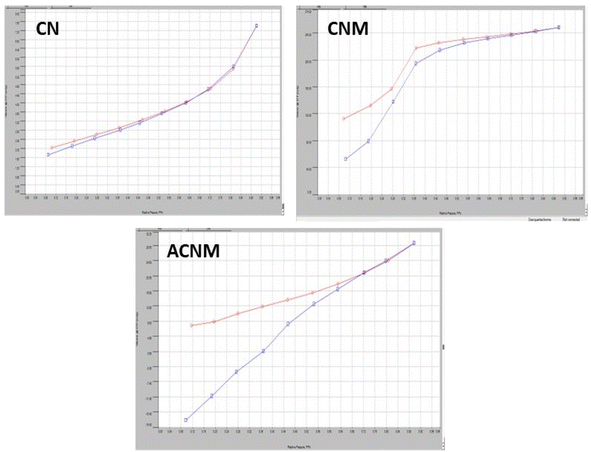
The N2 adsorption–desorption isotherm technique was used to measure the surface area and porosity of the samples through BET analysis. Fig. 3 shows the BET surface area, pore size and pore volume of all the composites (CN, CNM, and 50ACNM). From our previous study, the specific surface area of MCM-41 was recorded as 878 m2 g−1.38 The surface area of pristine CN is found to be 4.7 m2 g−1. After modification of CN with MCM-41 (CNM), this was increased to 200 m2 g−1 and the type IV isotherm is maintained. This confirms the mesoporosity is maintained. But the surface area is again reduced after modification of the fluid–fluid interaction as well as fluid-wall attraction in mesoporous materials. Hence at pore walls there occur capillary condensation and multilayer adsorption of fluid which facilitate the condensation process. The N2 sorption process did not follow the same path as that of adsorption and hence a loop is observed which affects the tensile strength and capillary condensation. Again, there is a decrease in surface area with loading of silver nanoparticles on the surface of CNM. Though the surface area of the modified materials is less as compared to CNM, the active sites are uniformly distributed on the surface, increasing the catalytic activity. The pore volume and pore size follow the same trend as that of surface area and mesoporosity is maintained. The pore size and pore volume of all the materials are shown in Table 2.| No. | Catalyst | Surface area (m2 g−1) | Pore volume (cm3 g−1) | Pore size |
|---|---|---|---|---|
| 1 | CN | 4.7 | 0.009 | 3.30 |
| 2 | CNM | 200 | 0.077 | 3.11 |
| 3 | ACNM | 22 | 0.037 | 3.23 |
UV-visible diffuse reflectance spectroscopy
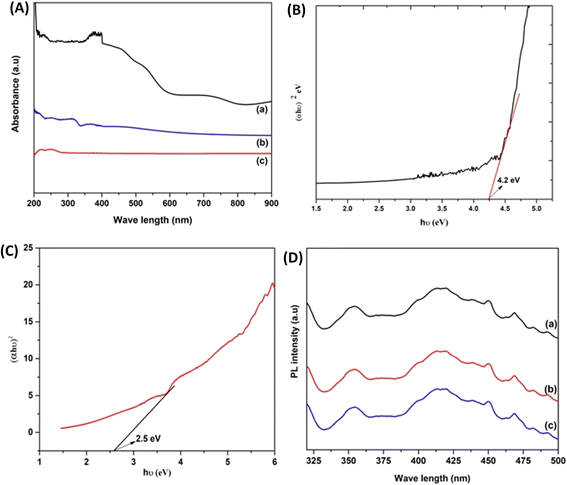
UV-visible diffuse reflectance spectroscopy provides the optical properties, adsorption sites, and band gap energy of the prepared samples, as displayed in Fig. 4A. From our previous study it was seen that CN shows an absorption band in the 300–400 nm range. After modification with MCM-41, a strong UV and blue absorption band with absorption edge around 350 nm is observed. The spectrum of ACNM shows a significant improvement in the absorption region. The loading of Ag remarkably increases the absorption of ACNM and there is a red shift and a broad absorption in the visible region from 400 to 600 nm. This is mainly due to the SPR excitation of Ag nanoparticles which shows an efficient plasmon resonance in the visible region. This leads to more light absorption which facilitates a greater number of electron–hole pairs and subsequently increases the photocatalytic activity. Moreover, the SPR effect of the metallic Ag causes an enhancement of the local electromagnetic fields which speeds up the separation rate of photogenerated electron–hole pairs in the near-surface region of CN. The photogenerated electrons can be instantly scavenged by Ag nanoparticles at the interface of the Ag/g-C3N4 catalyst, creating a Schottky barrier that effectively reduces the probability of recombination of photogenerated electron–hole pairs.To investigate the charge transfer, separation capacity and recombination of electron–hole pairs, photoluminescence spectroscopy was used. Fig. 4D presents the PL spectra of CN, CNM, and ACNM with excitation at 380 nm at room temperature. All the materials exhibited a strong PL band centered at 425 nm, similar to the UV-visible spectra. PL intensity showed a trend with increasing order of ACNM < CNM < CN. PL intensity is directly proportional to electron–hole recombination and ACNM exhibits a significantly lower PL intensity than the other two materials. This confirms that there is a channelization of electron–hole pairs due to the electron relay effect and increases the catalytic efficiency.
Catalytic hydrogenation reaction
Decolorization of 100 ppm RhB was examined using all the prepared catalysts (CN, CNM, and ACNM) in the presence of NaBH4 as a reducing agent. It is observed that in the presence of NaBH4, the dye molecule is converted to the leuco form, which is shown in Scheme 2. A handful of literature studies have been reported to date using NaBH4 in dye degradation processes. Dasari et al. synthesized g-C3N4 nanosheet-supported CuS for photocatalytic degradation of 4-NP using NaBH4.39 Bruno and Leudemir prepared Ag decorated reduced graphene for catalytic hydrogenation of MB and RhB using NaBH4.15 Mengqing and his team synthesized silver decorated silica for photocatalytic degradation of MB using NaBH4.40 In the proposed mechanism, Ag nanoparticles act as an electron relay system. That means the process involves the transfer of electrons from an e− donor (NaBH4)− ion to an e− acceptor (RhB). The reduction using NaBH4 is thermodynamically favorable because there is a significant difference between the reducing potential of the acceptor and donor species. The detailed mechanism of catalytic hydrogenation of RhB is explained in several steps. In step I, NaBH4 decomposes and H2 and e− are formed in the reaction as follows:| 2NaBH4 → 2Na+(aq) + 2BH4−(aq) → B2H6 + H2 + 2e− |
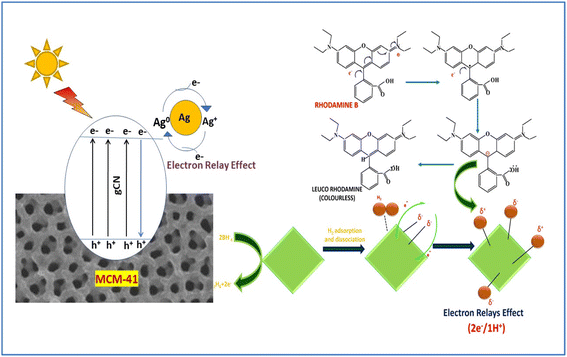 | ||
| Scheme 2 Schematic representation of catalytic hydrogenation of RhB using NaBH4 as a reducing agent. | ||
The H2 and 2e− are taken by Ag/gC3N4/MCM-41. Step II involves the adsorption of H2 molecules followed by dissolution onto the Ag(0) nanoparticle surface. Ag nanoparticles act as an electron relay, producing hydrogen species partially charged on their surface. In step III, the dye (RhB) molecules are adsorbed on the catalyst surface due to the presence of high surface activity of MCM-41 and π–π interactions in graphitic carbon nitride, being the rate-determining steps. In step IV, the adsorbed dye is captured by the electrons (2e−) present in the active sites of Ag nanoparticles along with the hydrogen species (1H+) adsorbed with positive partial charge. In step V, the colorless leuco dye after reduction is desorbed from the catalyst surface leading to reactivation. In the proposed mechanism of the RhB degradation process (i.e., hydrogenation reaction), the dye molecules are adsorbed on the surface of the catalyst in the presence of BH4− ions and redox reactions occur to produce the colorless products. Of the two electrons generated during the hydrogenation reaction, one electron reacts with the central carbon atom of RhB, neutralizing the iminium cation charge along with the radical carbon. The second electron reacts with the radical carbon to generate a carbanion. This carbanion captures the hydrogen having partial positive charge that is adsorbed on the surface of the silver nanoparticles leading to the hydrogenation process and converting RhB to the leuco form.
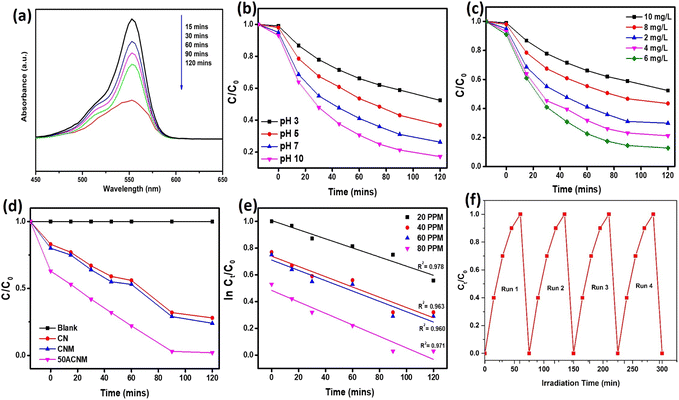
During the photocatalytic reaction, the adsorption–desorption spectra of RhB were obtained, as shown in Fig. 5a. An intense absorption band is seen at λmax = 554 nm for RhB. At different time intervals, the intensity (time-dependent curve) gradually declines. It shows that 120 min is the optimum time set for the photocatalytic degradation of RhB. It implies the complete disappearance of bands associated with chromophore group of the dye. In the reaction process, pH plays a major role, the dye (RhB) changing its spectra at different pH. Fig. 5b depicts the RhB decolorization at different pH. It is seen that in alkaline medium, RhB can undergo a pH-reversible catalyzation reaction giving rise to colorless, non-fluorescent leucoform. Originally, the pH of RhB solution is 7 and after the addition of NaBH4, it increases to nearly 10, leading to decolorization of RhB. The photocatalytic rate was calculated for different catalyst doses (2, 4, 6, 8, and 10 mg) using ACNM as the standard catalyst at different time intervals. As seen from Fig. 5c, when the amount of catalyst increases from 2 mg L−1 to 6 mg L−1 the reaction rate undergoes a process of first increasing, and then decreasing from 8 mg L−1 to 10 mg L−1. The apparent rate constant with an increase in catalyst dose first increases and then decreases (−0.0225 min−1, -0.0223 min−1, -0.0221 min−1, -0.0233 min−1, and -0.0237 min−1). From the experimental result, it is seen that 6 mg catalyst could promote the decolorization reaction efficiency to 98% within 90 min, as exhibited in Fig. 5c. With a further increase in catalyst dose, the degradation efficiency decreases. This is because with an increase in catalyst dose active sites may be occupied and there is repulsion between adsorbed molecules and the free ions in the solution.
The photocatalytic degradation of RhB requires the simultaneous involvement of organic molecules and oxygen. As oxygen is abundant, its concentration is said to be constant throughout the photocatalytic reaction. According to the law of mass action, the photocatalytic reaction follows a quasi-first-order reaction with photocatalytic rate as follows:
| r = −dC/dt = kC |
The adsorption of RhB on the surface of the photocatalyst is a vital process for the photocatalytic reaction. The adsorption–desorption (A–D) equilibrium is considered to follow a Langmuir isotherm. If the A–D equilibrium is still satisfied during the photocatalytic experiment under visible light illumination, the model can be represented as:
| r = −dC/dt = kKC/1 + KC |
This is the Langmuir–Hinshelwood (L–H) model. In the equation, K is the A–D equilibrium constant and C is the reaction concentration in the solution at time t. By integrating the above equation from 0 to t, another form of the L–H model can be written:
| −ln Ct/C0 = Kat + b |
| No. | Concentration of CIP (ppm) | Kapp (min−1) | Regression coefficient (R2) |
|---|---|---|---|
| 1 | 20 | 0.0046 | 0.978 |
| 2 | 40 | 0.0026 | 0.963 |
| 3 | 60 | 0.0024 | 0.960 |
| 4 | 80 | 0.0002 | 0.971 |
The ACNM respond the fast decolorization because of the following factors: (i) high surface area, (ii) surface plasmon resonance effect of Ag nanoparticles, (iii) role of NaBH4, and (iv) reduced rate of electron–hole recombination.
High surface area
The modification of the composite by the mesoporous support (MCM-41) increases the surface area and acts as a support. The CN sheet also has a key role in the decolorization process by avoiding the aggregation of Ag nanoparticles and the π–π stacking interaction enhances the adsorption of the dye onto the surface. This increases the transfer of electrons from donor to acceptor and increases the reaction rate.Surface plasmon resonance effect of Ag nanoparticles
The photocatalytic hydrogenation reduction reaction with the prepared catalyst depends upon the LSPR effect of Ag(0). Loading of Ag increases the absorption of visible light through the surface plasmon resonance effect and creates a Schottky contact between Ag and gCN. Apart from this, Ag nanoparticles act as an electron relay, producing hydrogen species partially charged on their surface and helping in the catalytic reduction process.Role of NaBH4
NaBH4 acts as a reducing agent for the catalytic hydrogenation reaction of RhB. It is itself reduced and produces molecular hydrogen and diborane as byproduct along with the release of extra electrons. These generated electrons are captured by the adsorbed dye which is reduced to the leuco form.Reduced rate of electron–hole recombination
During the absorption of light energy on the surface of the catalyst, electrons jump from the valence band to the conduction band of gCN. Loading of Ag on the surface of gCN acts as a co-catalyst. The electrons in the conduction band of gCN are transferred to Ag nanoparticles and act as an electron relay agent. This approach provides a better channelization of electrons and helps in the reduction of electron–hole recombination and increases the catalytic hydrogenation efficiency.Conclusion
Exfoliated gCN was synthesized by a simple thermal polycondensation reaction and then it was incorporated into MCM-41 to enhance the surface-active sites. Lastly, plasmonic Ag nanoparticles were anchored onto the surface of gCN/MCM-41 by a wetness impregnation method. Ag/gCN-MCM-41 showed excellent catalytic activity for the catalytic hydrogenation of RhB. This is because of the LSPR effect which enhanced the scattering of photons towards the absorption of more light. The Ag nanoparticle decorated catalyst promotes the catalytic reduction of RhB in the presence of NaBH4 as reducing agent to an efficiency of 98% within 90 minutes, converting the dye to colorless hydrogenated form. The catalyst reuse data indicated that the catalyst showed nearly 80–85% efficiency after four consecutive cycles. The catalyst is environmentally benign, of low cost and maintains sustainability for further use.Conflicts of interest
There are no conflicts to declare.Acknowledgements
The authors are thankful to Siksha O Anusandhan (Deemed to be University) for their support for carry out the research work.References
- F. N. Chaudhry and M. F. Malik, J. Ecosyst. Ecography, 2017, 7, 225–231 Search PubMed.
- J. Mateo-Sagasta, H. Turral and J. Burke, Global drivers of water pollution from agriculture, ed. J. Mateo-Sagasta, S. M. Zadeh, H. Turral, 2018, pp. 15–38 Search PubMed.
- R. P. Schwarzenbach, T. Egli, T. B. Hofstetter, U. Von Gunten and B. Wehrli, Annu. Rev. Environ. Resour., 2010, 35, 109–136 CrossRef.
- P. E. Petersen, Community Dent. Oral Epidemiol., 2003, 31, 3–24 CrossRef PubMed.
- N. R. Council and others, Soil and Water Quality: an Agenda for Agriculture, National Academies Press, 1993 Search PubMed.
- C. Zheng, L. Zhao, X. Zhou, Z. Fu and A. Li, Water Treat., 2013, 11, 250–286 Search PubMed.
- V. Sivakumar, Process Saf. Environ. Prot., 2022, 163, 703–726 CrossRef CAS.
- P. Senthil Kumar and A. Saravanan, Detox Fash. Waste Water Treat., 2018, pp. 1–25 Search PubMed.
- D. K. Markandey, Environmental Biotechnology, APH Publishing, 2004 Search PubMed.
- R. Kishor, D. Purchase, G. D. Saratale, R. G. Saratale, L. F. R. Ferreira, M. Bilal, R. Chandra and R. N. Bharagava, J. Environ. Chem. Eng., 2021, 9, 105012 CrossRef CAS.
- S. Hussain, N. Khan, S. Gul, S. Khan and H. Khan, Water Chem., 2020, 1–14 Search PubMed.
- Z. Carmen and S. Daniela, Textile organic dyes-characteristics, polluting effects and separation/elimination procedures from industrial effluents-a critical overview, IntechOpen, 2012, 3, 56–86 Search PubMed.
- M. Ismail, K. Akhtar, M. I. Khan, T. Kamal, M. A. Khan, A. M Asiri, J. Seo and S. B. Khan, Curr. Pharm. Des., 2019, 25, 3645–3663 CrossRef CAS PubMed.
- M. Iuliano, E. Ponticorvo, C. Cirillo, R. Adami and M. Sarno, Mol. Catal., 2023, 544, 113179 CrossRef CAS.
- B. C. Mascarenhas and L. C. Varanda, J. Ind. Eng. Chem., 2021, 103, 124–135 CrossRef CAS.
- R. Das, V. S. Sypu, H. K. Paumo, M. Bhaumik, V. Maharaj and A. Maity, Appl. Catal. B, 2019, 244, 546–558 CrossRef CAS.
- P. Kumar, J. Dixit, A. K. Singh, V. D. Rajput, P. Verma, K. N. Tiwari, S. K. Mishra, T. Minkina and S. Mandzhieva, Nanomaterials, 2022, 12, 3851 CrossRef CAS PubMed.
- M. A. Malik, A. A. Alshehri, M. A. Abomuti, E. Y. Danish and R. Patel, Toxics, 2021, 9, 103 CrossRef CAS PubMed.
- P. Veerakumar, I. P. Muthuselvam, P. Thanasekaran and K.-C. Lin, Inorg. Chem. Front., 2018, 5, 354–363 RSC.
- H. D. Beyene, A. A. Werkneh, H. K. Bezabh and T. G. Ambaye, Sustain. Mater. Technol., 2017, 13, 18–23 CAS.
- R. S. Chouhan, I. Jerman, D. Heath, S. Bohm, S. Gandhi, V. Sadhu, S. Baker and M. Horvat, Nano Sel., 2021, 2, 712–743 CrossRef CAS.
- P. Niu, J. Dai, X. Zhi, Z. Xia, S. Wang and L. Li, InfoMat, 2021, 3, 931–961 CrossRef CAS.
- A. O. Idris, E. O. Oseghe, T. A. M. Msagati, A. T. Kuvarega, U. Feleni and B. Mamba, Sensors, 2020, 20, 5743 CrossRef CAS PubMed.
- S. Patnaik, A. Behera and K. Parida, Catal. Sci. Technol., 2021, 11, 6018–6040 RSC.
- L. Jiang, X. Yuan, Y. Pan, J. Liang, G. Zeng, Z. Wu and H. Wang, Appl. Catal. B, 2017, 217, 388–406 CrossRef CAS.
- X. Liu, R. Ma, L. Zhuang, B. Hu, J. Chen, X. Liu and X. Wang, Crit. Rev. Environ. Sci. Technol., 2021, 51, 751–790 CrossRef CAS.
- B. Nanda, A. C. Pradhan and K. M. Parida, Chem. Eng. J., 2017, 316, 1122–1135 CrossRef CAS.
- B. Nanda, A. C. Pradhan and K. M. Parida, Microporous Mesoporous Mater., 2016, 226, 229–242 CrossRef CAS.
- A. C. Pradhan, B. Nanda, K. M. Parida and M. Das, Dalton Trans., 2013, 42, 558–566 RSC.
- D. Rath, B. Nanda and K. Parida, J. Environ. Chem. Eng., 2017, 5, 6137–6147 CrossRef CAS.
- X. Lin, S.-N. Zhang, D. Xu, L.-H. Sun, G.-Y. Zhai, P. Gao and X.-H. Li, Carbon Nitrides Struct. Prop. Appl. Sci. Technol., 2023, p. 147 Search PubMed.
- F. Ding, T. Ming, H. Zhang, Y. Gao, V. Dragutan, Y. Sun, I. Dragutan and Z. Xu, Resour. Chem. Mater., 2022, 1, 1–7 Search PubMed.
- M. E. Khan, T. H. Han, M. M. Khan, M. R. Karim and M. H. Cho, ACS Appl. Nano Mater., 2018, 1, 2912–2922 CrossRef CAS.
- Z. Li, J. Wang, K. Zhu, F. Ma and A. Meng, Mater. Lett., 2015, 145, 167–170 CrossRef CAS.
- A. C. Pradhan, B. Nanda, K. M. Parida and G. R. Rao, J. Phys. Chem. C, 2015, 119, 14145–14159 CrossRef CAS.
- L. Ge and C. Han, Appl. Catal. B, 2012, 117, 268–274 CrossRef.
- L. Ge, C. Han and J. Liu, Appl. Catal. B, 2011, 108, 100–107 CrossRef.
- A. C. Pradhan and K. M. Parida, J. Mater. Chem., 2012, 22, 7567–7579 RSC.
- D. Ayodhya and G. Veerabhadram, FlatChem, 2019, 14, 100088 CrossRef.
- M. Hu, X. Yan, X. Hu, R. Feng and M. Zhou, J. Sol-Gel Sci. Technol., 2019, 89, 754–763 CrossRef CAS.
| This journal is © The Royal Society of Chemistry 2024 |

