DOI:
10.1039/D3RA05200A
(Paper)
RSC Adv., 2024,
14, 233-244
Effect of synthesis methods on the activity of NiO/Co3O4 as an electrode material for supercapacitor: in the light of X-ray diffraction study†
Received
1st August 2023
, Accepted 4th December 2023
First published on 2nd January 2024
Abstract
The formation of heterostructures by combining individual components (NiO and Co3O4) is a preferred approach to enhance electrochemical performance as it leads to improved charge transfer and surface reaction kinetics. In the present work, a NiO/Co3O4 composite was prepared by two methods. First, neat NiO and Co3O4 were prepared by adopting the hydrothermal method followed by the formation of the composite (i) by a hydrothermal route (NC-Hydro) and (ii) by a calcination route (NC-Cal). NC-Hydro composite shows a specific capacity of 176 C g−1 at 1 A g−1 of current density in the three-electrode system in a 2 M KOH solution as an electrolyte with 90% cyclic retention after 5000 cycles at 4 A g−1. NC-Cal shows a specific capacity of 111 C g−1 at 1 A g−1 with 75% cyclic retention. The coulombic efficiency of NC-Hydro was 86.3% while for NC-Cal it was 42.3%. The reason behind the superior electrochemical performance of NC-Hydro in comparison to NC-Cal may be the large interlayer spacing and lattice parameters of the former, which provide large space for redox reactions. The unit cell volume of the composites was more than that of the constituents. This study reveals that the composites prepared by the hydrothermal method have superior electrochemical properties in comparison to composites prepared by the calcination method.
1. Introduction
To utilize a sustainable form of energy, besides generating clean and green energy, its storage is an essential part as well. In general, supercapacitors are considered for the storage of electric energy in a clean and green way.1 In terms of energy storage, supercapacitors offer advantages over traditional capacitors and batteries as they have superior capacitance, high power density, and long-term stability. Rechargeable batteries and supercapacitors can play an important role in future portable electronic devices and zero-emission electric vehicles in the future.2 In general, electrode materials for supercapacitors can be divided into three types according to charge storage mechanism: (i) capacitive materials in which the surface charges are accumulated electrostatically, (ii) pseudocapacitive materials in which rapid reversible faradaic reaction occurs near the electrode surface, and (iii) battery-type materials in which deep surface faradaic reactions occur.1–5 The selection of electrode materials for supercapacitors is the foremost step to achieve high specific capacitance along with optimal energy density, power density, and cyclic stability. The transition metal oxides/hydroxides, such as MnO2, Co3O4, MoO3, NiO, RuO2, etc. are found to be active materials for pseudocapacitors as they possess high redox activities, high theoretical capacities, high reversibility, etc.6,7 Among these, RuO2 possesses high theoretical specific capacitance (1400–2000 F g−1) and, therefore, it is extensively studied by researchers but its high production costs limit its practical application in the field.8,9 Moreover, single-component transition metal oxides, such as MnO2, SnO2, NiO, ZnO, and Co3O4, are used as a substitute for RuO2 owing to properties, such as non-toxic, natural abundance, environment-friendliness, and high specific capacity.10–14 Regardless, they suffer from low electronic conductivity, cyclic stability, and energy density, etc. It is well known that in comparison to single components, heterostructures that have been formed by combining single components are more favorable for electrochemical performance due to the improvement in charge transfer and surface reaction kinetics.15,16 Among all single-component metal oxides, NiO and Co3O4 have extensively been studied as electrode materials for electrochemical applications because of their affordability, environment-friendliness, corrosion stability in alkaline solution, high redox activity, and high theoretical capacity (NiO ∼2584 F g−1; Co3O4 ∼3560 F g−1).17,18 However, they have drawbacks, including low electronic conductivity, unsatisfactory life cycle, and low specific capacitance, which hinder their practical applications. However, when NiO and Co3O4 are combined to form a heterostructure, the productive effect of both can be seen and their individual drawbacks can be suppressed to some extent.19–24
In this work, we synthesized NiO/Co3O4 by adopting a facile and green method. Two methods were used for the synthesis here by keeping a fixed ratio between NiO and Co3O4: (i) hydrothermal method for synthesis of neat metal oxides followed by using the same hydrothermal method to prepare the composite, and (ii) hydrothermal method for neat metal oxides formation followed by thermal annealing process for composite formation. The composite prepared by these methods has been investigated for usage as the anode in a supercapacitor. The present work correlates the activity of supercapacitors with XRD analysis. The findings are discussed in detail in their respective sections. This study reveals that the composite prepared by the hydrothermal method presented superior electrochemical properties in comparison to the composite prepared by the calcination method.
2. Experimental section
2.1 Synthesis process
2.1.1. Synthesis of NiO. 0.38 g of Ni(CH3CO2)2·4 H2O and 0.72 g of urea were mixed in 80 mL of water and stirred for 30 minutes. The whole solution was then transferred to a Teflon-lined steel autoclave followed by heating at 150 °C for 5 h in a programmable electric oven without stirring to perform the hydrothermal reaction. After cooling naturally to room temperature, the sample was washed with water several times followed by ethanol washing. The sample was then dried at 80 °C for 12 h. The dried sample was collected and subjected to calcination at 300 °C for 2 h at a heating rate of 10 °C per minute.
2.1.2. Synthesis of Co3O4. 1.8 g of Co(NO3)2·6H2O and 1.08 g of urea were mixed in 80 mL of water and stirred for 30 minutes. The solution was then transferred to a Teflon-lined steel autoclave and the hydrothermal process was conducted at 110 °C for 16 h in a programmable electric oven without stirring. After cooling, the sample was washed with water and ethanol several times and dried at 80 °C for 12 h. Finally, the sample was calcined at 450 °C for 2 h at a heating rate of 10 °C per minute.
2.1.3. Synthesis of NiO/Co3O4 (hydrothermal). For the synthesis of NiO/Co3O4 composite, NiO and Co3O4 were mixed in a 2![[thin space (1/6-em)]](https://www.rsc.org/images/entities/char_2009.gif) :
:![[thin space (1/6-em)]](https://www.rsc.org/images/entities/char_2009.gif) 1 ratio in 50 mL water and stirred for 15 minutes, followed by the addition of 50 mL of water. The solution was then transferred to a Teflon-lined steel autoclave for the hydrothermal process at 160 °C for 16 h in a programmable electric oven without stirring. After cooling, the sample was washed with water and ethanol several times and dried at 80 °C for 12 h. The dried sample of NiO/Co3O4 thus obtained has been abbreviated as NC-Hydro.
1 ratio in 50 mL water and stirred for 15 minutes, followed by the addition of 50 mL of water. The solution was then transferred to a Teflon-lined steel autoclave for the hydrothermal process at 160 °C for 16 h in a programmable electric oven without stirring. After cooling, the sample was washed with water and ethanol several times and dried at 80 °C for 12 h. The dried sample of NiO/Co3O4 thus obtained has been abbreviated as NC-Hydro.
2.1.4. Synthesis of NiO/Co3O4 (calcination). For the synthesis of NiO/Co3O4 composite by the calcination method, the same amount of NiO and Co3O4 (as taken in hydrothermal synthesis) were taken in 60 mL of water and sonicated for 60 minutes, followed by stirring at 250 rpm for 18 h. The sample was then collected and calcined at 200 °C for 1 h at a heating rate of 5°/min. The as-synthesized sample was abbreviated as NC-Cal. Scheme 1 represents the synthesis of neat and composites.
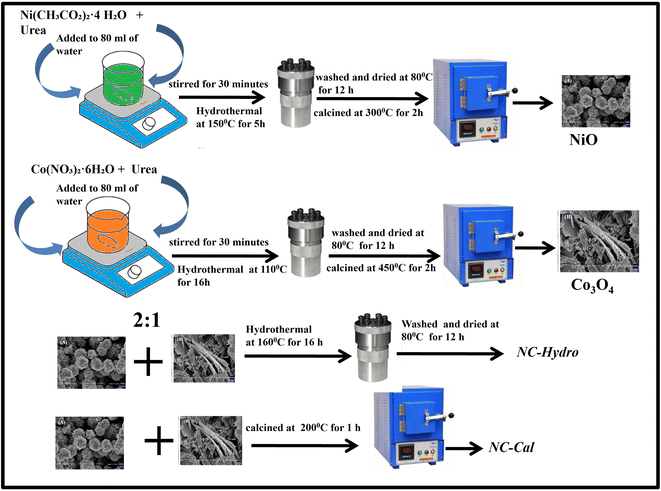 |
| | Scheme 1 Schematic representation of the synthesis of NC-Hydro and NC-Cal. | |
2.2 Characterization
The prepared samples were characterized by X-ray diffraction (XRD), X-ray photoelectron spectroscopy (XPS), and field-emission scanning electron microscopy (FESEM). Rigaku-Ultima IV powder diffractometer was used to record the XRD pattern of the samples using a CuKα radiation source (λ = 0.154 nm) within the 2θ range of 10 to 80°. LaB6 NIST standard was used to calibrate the instrumental broadening of diffraction peaks. XPS measurement was performed on a Thermo scientific ESCA LABXi+ with a non-monochromatic X-ray source. Binding energy correction was performed using the C 1s peak of 284.6 eV as a reference. FESEM images were collected on a Carl Zeiss Model Supra 55, Germany. Electrochemical measurements were performed with a potentiostat/galvanostat (IVIUM-VERTEX).
2.3 Fabrication of the electrode
The electrochemical measurements were carried out by using three electrode systems in a 2 M aqueous solution of KOH as an electrolyte. The sample deposited on Ni foam was taken as working electrode, Pt wire as counter electrode and Hg/HgO as reference electrode with working potential range of 0–0.6 V. Cyclic voltammetry, galvanostatic charge–discharge, and electrochemical kinetics were studied in detail. Before use, nickel foam (area of 1.5 × 1 cm2) was washed with HCl, water, and acetone for 10 minutes in a sonicator, respectively.20,21 Nickel foam was then dried at 80 °C for 12 h in a vacuum oven. The drop-casting method was used to deposit the sample over the nickel foam (the area of deposition was 1 × 1 cm2). The ratio of 80![[thin space (1/6-em)]](https://www.rsc.org/images/entities/char_2009.gif) :
:![[thin space (1/6-em)]](https://www.rsc.org/images/entities/char_2009.gif) 16
16![[thin space (1/6-em)]](https://www.rsc.org/images/entities/char_2009.gif) :
:![[thin space (1/6-em)]](https://www.rsc.org/images/entities/char_2009.gif) 4 (sample
4 (sample![[thin space (1/6-em)]](https://www.rsc.org/images/entities/char_2009.gif) :
:![[thin space (1/6-em)]](https://www.rsc.org/images/entities/char_2009.gif) carbon black
carbon black![[thin space (1/6-em)]](https://www.rsc.org/images/entities/char_2009.gif) :
:![[thin space (1/6-em)]](https://www.rsc.org/images/entities/char_2009.gif) Nafion, i.e., 4 mg
Nafion, i.e., 4 mg![[thin space (1/6-em)]](https://www.rsc.org/images/entities/char_2009.gif) :
:![[thin space (1/6-em)]](https://www.rsc.org/images/entities/char_2009.gif) 0.8 mg
0.8 mg![[thin space (1/6-em)]](https://www.rsc.org/images/entities/char_2009.gif) :
:![[thin space (1/6-em)]](https://www.rsc.org/images/entities/char_2009.gif) 4 μL) was maintained for deposition onto the nickel foam. After deposition, the electrode (nickel foam with sample deposited on it) was dried at 80 °C for 12 h in a vacuum oven. Before using the electrode, 10 MPa pressure was applied to the foam for 10 seconds. The mass deposited on the nickel foam was found to be 2.94 mg.
4 μL) was maintained for deposition onto the nickel foam. After deposition, the electrode (nickel foam with sample deposited on it) was dried at 80 °C for 12 h in a vacuum oven. Before using the electrode, 10 MPa pressure was applied to the foam for 10 seconds. The mass deposited on the nickel foam was found to be 2.94 mg.
3. Results and discussions
3.1 X-ray diffraction (XRD) analysis
Fig. 1(a) illustrates the XRD patterns in the XRD diffractogram of NiO, Co3O4, NC-Hydro, and NC-Cal, respectively. The diffraction peaks of NiO are found at 2θ values of 37.2, 43.3, 62.7, 75.4, and 79.3 and correspond to the planes, (111), (200), (220), (311), and (222), respectively. These values are well matched with the cubic NiO phase (JCPDS file no. 47-1049; Fig. 1(A)).25 Similarly, for Co3O4, the diffraction peak is found around 2θ values of 19, 31.3, 36.8, 38.5, 44.8, 55.7, 59.4, and 65.2, respectively, with the corresponding planes, (111), (220), (311), (222), (400), (422), (511), and (440) that are matched with the cubic Co3O4 phase (JCPDS file no. 09-0418; Fig. 1 (B)). Fig. 1(E) and (F) correspond to the diffraction peaks of NC-Hydro and NC-Cal, respectively.26 In Fig. 1(E) and (F), the diffraction peaks of both NiO and Co3O4 can be seen in composite NC-Hydro and NC-Cal indicating the formation of NiO/Co3O4 composite by both the hydrothermal and calcination methods. The crystallite size (Dhkl) and micro-strain (ε) of the composites were calculated by using eqn (1) and (2),27,28 where Dhkl is the crystallite size that is normal to the reflection plane (hkl) in nm; λ is the wavelength of X-ray used in nm; θ is the Bragg angle; βhkl is the width of the diffraction beam used (rad), which is calculated after correcting the instrumental broadening (β0 = 0.08 rad); and K is the shape factor of the crystallite size (K = 0.9, when βhkl is defined as the half-high width of diffraction peaks)| |
 | (1) |
| |
 | (2) |
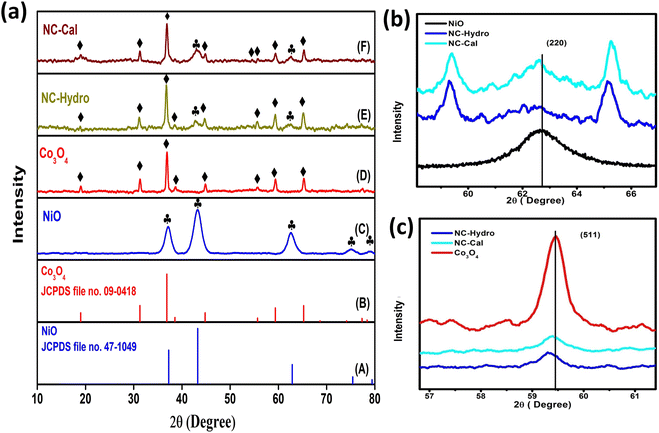 |
| | Fig. 1 (a) The XRD patterns in the XRD diffractogram of (C) NiO, (D) Co3O4, (E) NC-Hydro, and (F) NC-Cal, in comparison to those from standard powder diffraction of (A) NiO (JCPDS no-47-1049) and (B) Co3O4 (JCPDS no- 09-0418). Fig. 1(b) and (c) shows the shifting of XRD peaks towards lower 2θ values along the lattice planes, (220) and (511), respectively. The symbol  indicates the peaks of NiO and ♦ is used to denote the peaks of Co3O4. indicates the peaks of NiO and ♦ is used to denote the peaks of Co3O4. | |
The interlayer spacing (d) is calculated using Bragg's eqn (3). Where λ is the wavelength of the X-ray used; n is the order of diffraction; and θ is the angle of diffraction.29,30
| |
nλ = 2d![[thin space (1/6-em)]](https://www.rsc.org/images/entities/char_2009.gif) sin sin![[thin space (1/6-em)]](https://www.rsc.org/images/entities/char_2009.gif) θ θ
| (3) |
The degree of crystallinity is calculated by using eqn (4), where Xc is the degree of crystallinity; βhkl is the full width at half maximum of (hkl) the reflection after correcting the instrumental broadening (β0 = 0.08 rad); and KA is the constant set of 0.24.31
| |
 | (4) |
The lattice parameters for the cubic structure (a = b = c) are calculated using eqn (5); here, h, k, and l are the Miller indices, and d is the interlayer spacing.30
| |
 | (5) |
Table 1 depicts the average crystallite size, average micro-strain, interlayer spacing, lattice parameters, cell volume, and crystallinity of the materials along the lattice planes, (220) and (511), respectively, for NiO and Co3O4. The crystallite size for the NiO phase upon forming a composite with Co3O4 is found to be 5.1 and 6.67 nm, respectively, for NC-Hydro and NC-Cal. Similarly, the average crystallite size of Co3O4 for NC-Hydro and NC-Cal, respectively, is found to be 23.93 and 24.9 nm. The average crystallite size of both the phases, i.e., NiO and Co3O4, is found to be lower for NC-Hydro as compared to NC-Cal, proving the importance of hydrothermal techniques. The micro-strain of the NC-Cal is more than that of NC-Hydro; this may be because the calcination method causes greater defect and strain than the materials prepared by hydrothermal methods. Therefore, micro-strain, in the case of NC-Cal, is higher. While comparing the interlayer spacing of the materials along the lattice planes, (220) and (511), lattice expansion was observed in both the cases of NC-Hydro and NC-Cal. Fig. 1(b) represents the (220) lattice plane of NiO, NC-Hydro, and NC-Cal. Fig. 2(a) shows the shifting of XRD peaks towards lower 2θ values along the lattice plane (220) with respect to NiO in the case of composite materials. It is well known that whenever XRD peaks shift towards a lower 2θ value, lattice expansion occurs; consequently, a larger space is made available for redox reactions, resulting in increasing electrochemical properties.32 The same decrease in trend was observed when the XRD peak was considered along the lattice plane (511) as shown in Fig. 1(c), i.e., lattice expansion in composites occurred in comparison to Co3O4. However, the interlayer spacing of NC-Hydro was more expanded in comparison to NC-Cal, which may be one of the reasons behind its stable electrochemical properties.32 The degree of crystallinity (Xc) decreases after the formation of the composite as depicted in Table 1. This means that after the formation of the composite, its amorphous nature increases, which is a good sign of the enhancement of electrochemical properties. Here, the Xc is comparable for both NC-Hydro and NC-Cal. It is known that the higher the micro-strain, the higher will be the amorphous nature. An amorphous nature with a small crystallite size is beneficial for electrochemical activity.33 The lattice parameters of the composites increase with respect to the neat constituents. Consequently, the unit cell volume shows expansion which may facilitate the intercalation and deintercalation of the electrolytes during the electrochemical process.
Table 1 The average crystallite size, micro-strain, interlayer spacing, and crystallinity of the NiO, Co3O4, NC-Hydro, and NC-Cal
| Sample |
Average crystallite size (nm) |
Average micro-strain (1 × 10⁻² lines per m2) |
Interlayer spacing, d (in nm) |
Lattice parameters (a = b = c, cubic system) (Å) |
Unit cell volume V (Å)3 |
Crystallinity |
| (220) |
(511) |
(220) |
(511) |
(220) |
(511) |
(220) |
(511) |
| NiO |
5.3 |
1.5 × 10⁻² |
1.4802 |
— |
4.186 |
— |
73.34 |
— |
0.0023 |
— |
| Co3O4 |
30.79 |
0.3 × 10⁻² |
— |
1.5524 |
— |
8.064 |
— |
524.4 |
— |
0.322 |
| NC-Hydro |
NiO |
5.1 |
1.1 × 10⁻² |
1.4830 |
1.5562 |
4.194 |
8.085 |
73.77 |
528.49 |
0.0014 |
0.18 |
| Co3O4 |
23.9 |
| NC-Cal |
NiO |
6.6 |
1.8 × 10⁻² |
1.4824 |
1.5549 |
4.192 |
8.075 |
73.65 |
526.53 |
0.0019 |
0.15 |
| Co3O4 |
24.9 |
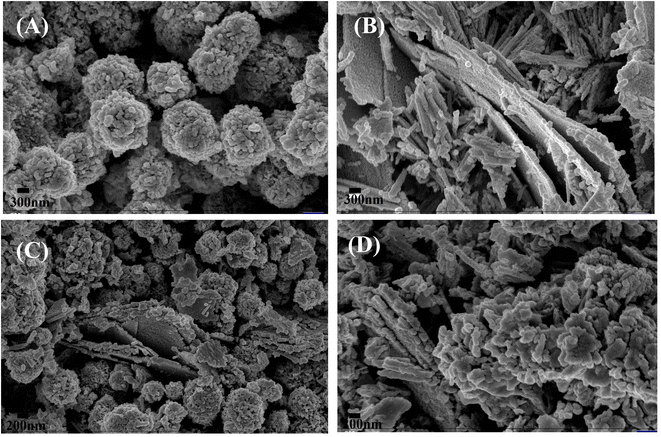 |
| | Fig. 2 The FESEM micrographs of (A) NiO, (B) Co3O4, (C) NC-Hydro, and (D) NC-Cal. | |
3.2 Field-emission scanning electron microscopy (FESEM)
Fig. 2 shows the FESEM images of NiO, Co3O4, NC-Hydro, and NC-Cal, respectively. Fig. 2(A) presents the FESEM image of NiO, where NiO particles assemble to form a brain-like structure. Fig. 2(B) presents the FESEM image of Co3O4, where it can be observed that the Co3O4 particles aggregate to form rod-like structures that are again assembled to form 2D sheet-like structures. Both rod and 2D sheet-like structures are present in Co3O4. 2D sheet-like structures play a vital role in increasing the electrochemical stability, flexibility, and tunable properties of an electrode.34 Fig. 2(C) and (D) show the FESEM images of NC-Hydro and NC-Cal respectively. FESEM images of NC-Hydro and NC-Cal are presented at various magnitudes in Fig. S1.† By observing the FESEM images of both NC-Hydro and NC-Cal, it was found that NiO/Co3O4 composites prepared by hydrothermal and calcination method shared the same type of images, i.e., both consist of brain-like structures, along with rods and sheet-like structure. This indicates that the stable structure of NiO and Co3O4, even after hydrothermal and calcination treatments, retains their original structures.
3.3 X-ray photoelectron spectroscopy (XPS)
XPS is used to detect the chemical states of the materials. Fig. 3(a) shows the XPS survey scan spectra of NiO, NC-Hydro, NC-Cal, and Co3O4, respectively, indicating the presence of Ni, O, and Co. Fig. 3(b)–(d) represents the XPS spectra of NiO, NC-Hydro, NC-Cal, and Co3O4 for Ni 2p, Co 2p, and O 1s, respectively. From Fig. 3(b) and (c), the shifting of the XPS peaks of Ni and Co from their respective neat NiO and Co3O4 peaks can be easily seen; this may be due to the interaction between NiO and Co3O4 in the composites. Fig. S2(a)–(j)† represents the deconvoluted peaks of Ni, Co, and O, respectively, for NiO, NC-Hydro, and NC-Cal. The XPS peaks of Ni in the NiO, NC-Hydro, and NC-Cal were split into two spin–orbit components, i.e., Ni 2p3/2 (at ∼853.5 eV) and Ni 2p1/2 (at ∼872.3 eV). The XPS peaks for Ni 2p3/2 found in the range of 853.5 to 853.8 eV represent Ni2+, and the peaks at ∼855 eV are due to Ni3+ with two satellite peaks at ∼860.8 and 865.6 eV, respectively. The peak for Ni 2p1/2 is found around 872 eV, along with a satellite peak at ∼879 eV. The presence of Ni2+ and Ni3+ states confirms the existence of non-stoichiometric NiO.35 Similarly, the XPS peaks of Co for Co3O4, NC-Hydro, and NC-Cal are split into two spin–orbit components, i.e., Co2p3/2 (∼779 eV) and Co2p1/2 (∼795 eV). The XPS peaks at ∼779 eV and 780 eV for Co 2p3/2 represent Co3+ and Co2+ states, respectively, along with a satellite peak at ∼786.25 eV. The XPS peak at ∼795 eV is assigned to the Co 2p1/2 for the Co3+ oxidation state with a satellite peak at ∼803 eV. The difference between the spin–orbit splitting energy states of Co, i.e., Co 2p3/2 and Co 2p1/2, was ∼15 eV, indicating the existence of Co2+ and Co3+; which is in good agreement with our XPS results.36,37 As shown in Fig. S2(g)–(j),† the O 1s peaks of NiO, Co3O4, NC-Hydro, and NC-Cal were deconvoluted into two peaks. The peak present at ∼529 eV was due to the M–O bonding, and the peak at ∼531 eV was due to the presence of surface-adsorbed oxygen.38,39
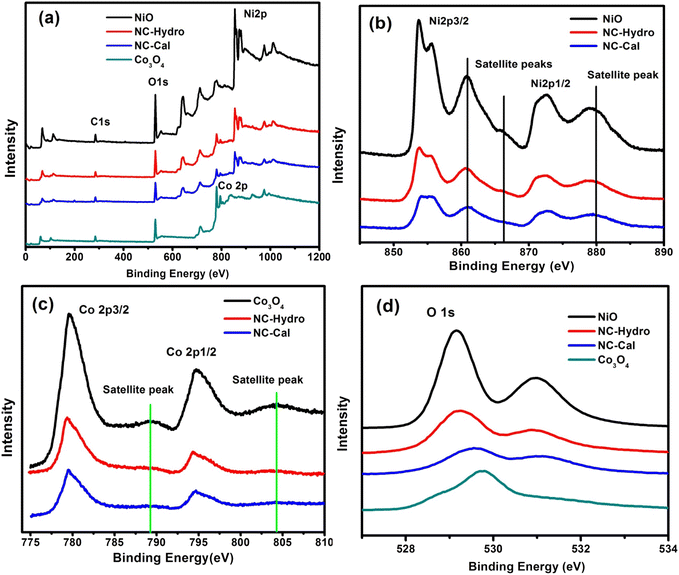 |
| | Fig. 3 The XPS spectra of NiO, NC-Hydro, NC-Cal, and Co3O4, (a) the survey scan spectra (b) Ni 2p, (c) Co 2p, and (d) O 1s. | |
4. Electrochemical measurements
In order to investigate the electrochemical properties of NiO, Co3O4, NC-Hydro, and NC-Cal as a supercapacitor electrode material for supercapacitor applications, cyclic voltammetry (CV) and galvanostatic charge–discharge (GCD) have been studied using a three-electrode electrochemical system with 2 M aqu. KOH solution as an electrolyte. Fig. 4(a) and (b) represent the CV of NC-Hydro and NC-Cal, respectively, with a scan rate ranging from 100 to 0.5 mV s−1. Fig. 4(c) displays the CV of NiO, Co3O4, NC-Hydro, and NC-Cal at 100 mV s−1. As depicted in Fig. 4(a) and (b), current increases with the scan rate due to the formation of a thick diffusion layer at lower scan rates, which restricts the electrolyte flux from entering the electrode, resulting in a decrease in current.40 The degree of irreversibility and quasi-reversibility increases with an increase in the scan rate, maybe due to the polarization and solution resistance; this results in shifting of oxidation and reduction peaks of NC-Hydro and NC-Cal toward higher and lower potential, respectively.41 From the CV patterns of NC-Hydro and NC-Cal, the patterns indicate a battery-like behavior of both the composites. By involving two charge storage processes, the electrochemical charge storage processes occur: (i) the non-faradic and (ii) the faradaic process. These are given below.19,22,24| | |
NiO–Co3O4 (surface) + OH− ↔ NiO–Co3O4(OH−) surface + e−
| (i) |
| |
 | (ii) |
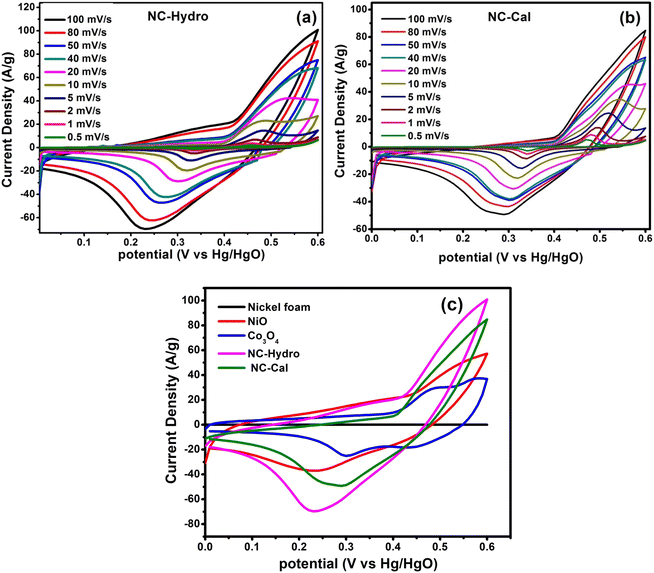 |
| | Fig. 4 The cyclic voltammetry curves at different scan rates, (a) NC-Hydro, (b) NC-Cal, (c) comparison of cyclic voltammetry among neat nickel foam, NiO, Co3O4, NC-Hydro, and NC-Cal at a scan rate of 100 mV s−1. | |
Fig. 4(c) compares the CV currents of neat nickel foam, NC-Cal, NC-Hydro, Co3O4, and NiO, respectively, at 100 mV s−1; the current response of NC-Hydro and NC-Cal is more than that of NiO and Co3O4, suggesting that both NiO and Co3O4 have a synergistic effect towards current generation. Furthermore, the current generated by NC-Hydro was more than that of NC-Cal. This may be due to the difference in the synthesis conditions, although the amount of NiO and Co3O4 used in the synthesis of the composites is the same. NC-Hydro covers a large area when considered along the potential and scan rate axis in comparison to NC-Cal, NiO, and Co3O4, indicating a large specific capacity of NC-Hydro. The specific capacity of the prepared material is calculated from the CV curve using the following equation.
where
Cs is the specific capacity in C g
−1; ∫
I(v)d
v is the integrated area under the CV curve;
v is the potential;
υ is the scan rate in mV s
−1; and
m is the mass of the active material in g.
42 The specific capacity of the NC-Hydro, NC-Cal, NiO, and Co
3O
4 at 100 mV s
−1 is found to be 229, 152, 109, and 56 C g
−1, respectively.
Table 2 represents the specific capacity of NC-Hydro and NC-Cal at different scan rates. From
Table 2, it was observed that the specific capacity (C g
−1) of NC-Hydro is more than that of NC-Cal till a scan rate of up to 40 mV s
−1; above that, the specific capacity was low in comparison to NC-Cal. The reason behind the high specific capacity of NC-Cal after the scan rate of 40 mV s
−1 may be due to the high average micro-strain of NC-Cal. At lower scan rates, the defect states are more accessible to the electrolyte, which improves the electrochemical performance.
Table 2 The specific capacity of NC-Hydro and NC-Cal at different scan rates
| Scan rate (mV s−1) |
100 |
80 |
50 |
40 |
20 |
10 |
5 |
2 |
1 |
0.5 |
| Specific capacity (C g−1) |
NC-Hydro |
229 |
241.4 |
254.2 |
283.3 |
359.1 |
396.2 |
428 |
459.6 |
517.7 |
707.1 |
| NC-Cal |
151.9 |
167.6 |
221.3 |
258.2 |
374.6 |
493.5 |
586.6 |
659.4 |
729.4 |
864.8 |
The Trasatti method is used to determine the capacitive contribution of surface-controlled charge component (EDLS) and diffusion control charge component (pseudocapacitive) reaction of the electrode materials. The surface-controlled charge component dominates at a high scan rate, while the diffusion-controlled charge component dominates at a low scan rate. Therefore, at a high scan rate, the outer charge (q0) contributes to capacitance as the access of the electrolyte is restricted only to the outer surface of the electrode material. Contrarily, at low scan rates, the movement of electrolyte is not restricted; it has access to both the inner and the outer surfaces, therefore, the total stored charge can be obtained. The y-intercept of the linear fit, q Vs ν−1/2 at ν = ∝, shows the outer charge (q0) stored at the outer surface of the electrode, while the y-intercept of the linear fit, 1/q Vs ν1/2 at ν = 0, shows the total stored charge (qt). The inner charge (qi) is calculated by subtracting qo from qi.43 Fig. 6 represents the Trasatti plot of NC-Hydro and NC-Cal. Fig. 5(a) and (b) represent the Trasatti plot of NC-Hydro; here, the value of q0 is found to be 421.2 C g−1, and qt is 1000 C g−1. From these values, the value of qi is calculated to be 578.8 C g−1. Similarly, from Fig. 5(c) and (d), the value of q0 and qt for NC-Cal is found to be 325.3 and 813 C g−1, respectively. The calculated qi value is 487.7 C g−1. In both cases, the value of qi is found to be greater than that of q0, suggesting that the inner surface of the electrode possesses a more active surface compared to the outer surface. The result shows the dominancy of the diffusion control charge component (57.8% for NC-Hydro, 60% for NC-Cal) over the capacitive control charge component (42.2% for NC-Hydro, 40% for NC-Cal). The inner charge storage capacity of NC-Cal (60%) is more than NC-Hydro (57.8%), while the outer charge storage capacity of NC-Hydro (42.2%) is more than that of NC-Cal (40%). It is a well-known aspect that the inner charge (qi) arises from the internal regions of voids, grain boundaries, pores, cracks, crevices, etc. It is directly linked with micro-strain.44,45 The enhancement in the inner charge storage capacity of NC-Cal compared to NC-Hydro may be due to the presence of defect states in the micro-strain region, which improves the conductivity of the active material and increases the number of active sites.46 The micro-strain of NC-Cal was found to be more compared to NC-Hydro (as shown in Table 1). This could be the reason behind the greater contribution of NC-Cal towards inner charge storage as compared with NC-Hydro. Furthermore, the electrochemical kinetics of the NC-Hydro was studied by using Dunn's method. The detailed analysis and graphs are included in Fig. S3.†
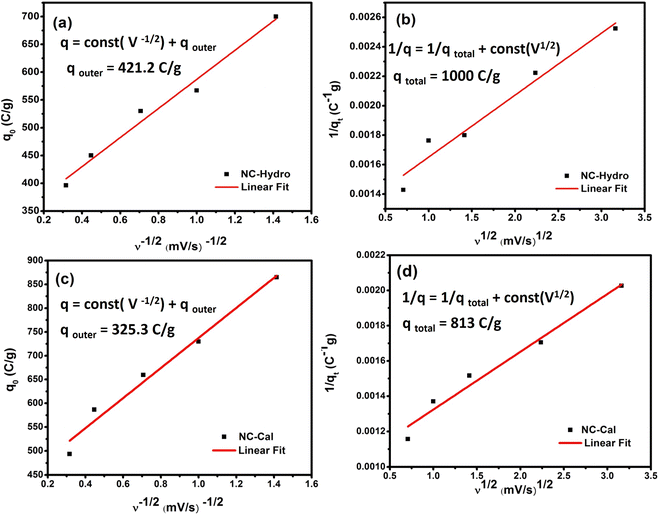 |
| | Fig. 5 A representation of (a) the plot of q0 Vs ν−1/2 and (b) 1/q Vs ν1/2 for NC-Hydro, and (c) the plot of q0 Vs ν−1/2 and (d) 1/q Vs ν1/2 for NC-Cal. | |
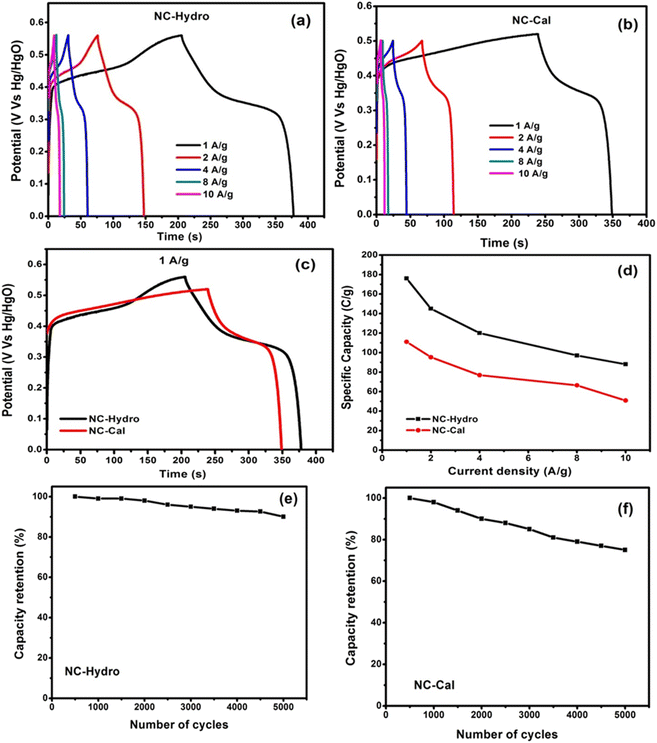 |
| | Fig. 6 A representation of the GCD curves of (a) NC-Hydro, (b) NC-Cal at different current densities, (c) comparison between GCD curves of NC-Hydro and NC-Cal at a current density of 1 A g−1 according to their maximum reachable potential. (d) Specific capacity at various current densities; cyclic retention at a current density of 2 A g−1 (e) NC-Hydro and (f) NC-Cal. | |
Further, the charging and discharging capability of NC-Hydro and NC-Cal was studied by galvanostatic charge–discharge curves (GCD curves). The GCD curves of NC-Hydro and NC-Cal are measured at different current densities of 1, 2, 4, 8, and 10 A g−1 (Vs Hg/HgO) within the potential range of 0 to 0.56 V (Vs Hg/HgO). For NC-Cal, at 0.56 V, the discharge does not happen, and a parallel line with respect to the time axis is obtained; therefore, 0.5 V is chosen for NC-Cal to study charge–discharge characteristics. Fig. 6(a) and (b) represent the GCD curves of NC-Hydro and NC-Cal at different current densities. The non-linear (voltage plateaus) GCD curves of NC-Hydro and NC-Cal are well-matched with their respective CV curves, indicating their battery-type nature.47 The specific capacity was calculated from the GCD curve using the formula, Cs = I × t/m, where Cs is the specific capacity at constant current; I is the discharge current; Δt is the discharge time; and m is the mass of electrode material.42,43 The specific capacity of NC-Hydro is found to be 176, 145, 120, 98, and 88 C g−1, respectively, for 1, 2, 4, 8, and 10 A g−1. The specific capacity decreases with an increase in current density because of the decrease in the diffusion rate of OH- into the electrode surface. Similarly, the specific capacity of NC-Cal is found to be 111, 95.2, 76.8, 66.4, and 50.86 C g−1, respectively, for 1, 2, 4, 8, and 10 A g−1. CV and GCD provide valuable information on the charge storage behavior of an electrode material. The specific capacity value of the NC-Hydro and NC-Cal obtained from CV and GCD is different because CV and GCD are two different measurement techniques. The capacitance obtained from CV is scan-rate dependent and represents an average over the potential range. On the other hand, GCD measurements involve the application of a constant current, providing a more localized capacitance value at a specific current density.48,49
Fig. 6(c) shows a comparison between GCD curves of NC-Hydro and NC-Cal at a current density of 1 A g−1 with respect to their maximum reachable potential. From Fig. 7(c), it is clear that the discharge time of NC-Hydro is more than that of NC-Cal. This may be one of the reasons behind the higher specific capacitance of NC-Hydro than NC-Cal. Fig. 6(d) shows the distribution of specific capacity with respect to current densities. It is found that the NC-Hydro showed ∼55% capacity retention even after the high current density of 10 A g−1, while for NC-Cal, it is found to be 46%.
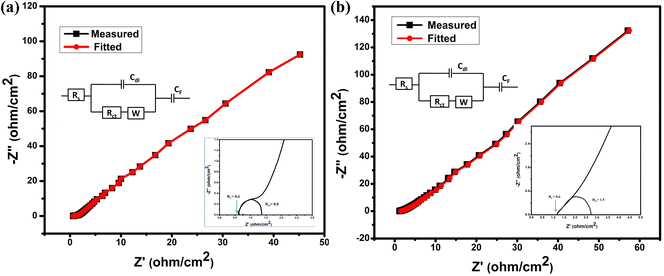 |
| | Fig. 7 (a and b) Nyquist plot of impedance from 10 mHz to 100 kHz; inset shows equivalent circuit and semi-circle of Nyquist plot for NC-Hydro and NC-Cal. | |
From the coulombic efficiency (η) value of any charge storage process, one can easily predict the ease with which the ion insertion or de-insertion may occur. The coulombic efficiency (η) of a supercapacitor is represented by the formula, η = (ΔtD/ΔtC) × 100, where ΔtC and ΔtD are the charging and discharging time, respectively.41 By using the formula, the coulombic efficiency of NC-Hydro is found to be 86.3%, which is more than that of NC-Cal (42.3%). Fig. 6(e) and (f) show the cyclic retention of NC-Hydro and NC-Cal, respectively. Approximately, 90 and 75% of the initial specific capacity was retained by NC-Hydro and NC-Cal after 5000 cycles at 4 A g−1. This suggests the good rate capability of NC-Hydro in comparison to NC-Cal. FESEM images of NC-Hydro and NC-Cal after the stability study are included in the ESI (Fig. S4†). The reproducibility of the electrode material is an important parameter to test its practical application and commercial viability. To study the reproducibility of NC-Hydro, three working electrodes of NC-Hydro are prepared in nickel foam and named electrode 1, electrode 2, and electrode 3. Reproducibility tests are conducted with GCD measurements in 2 M KOH electrolyte at 2 A g−1. The GCD curves of the 3 electrodes exhibit similar patterns (as well as similar specific capacitance) at 2 A g−1 as shown in Fig. S5.† In addition to the reproducibility test, the effect of electrolyte, effect of electrolyte concentration, effect of active material ratio, and effect of potential window (w.r.t. Ag/AgCl) have been studied, and the results are shown in Fig. S6.†
From electrochemical impedance spectroscopy, the frequency-dependent super-capacitive behavior of NC-Hydro and NC-Cal is studied in the frequency range of 10 mHz to 100 kHz with a signal amplitude of 5 mV. The EIS data is analyzed by the Nyquist plot. Fig. 7(a) and (b) shows the Nyquist plot of NC-Hydro and NC-Cal; the variables are plotted with an imaginary component (−Z′′) vs. a real component (−Z′) of the impedance; their corresponding fitted equivalent circuit is shown in the inset. The equivalent circuit consists of internal resistance (Rs), charge transfer resistance (Rct), Warberg (W) impedance, double-layer capacitance (Cdl), and pseudo-capacitance (Cp). The Nyquist plot of NC-Hydro and NC-Cal consists of three regions: (i) high-frequency semicircle, (ii) middle-frequency Warburg impedance, and (iii) low-frequency capacitive behavior. At the high-frequency region, the intercept of the Nyquist plot on the x-axis gives the value of Rs. The value of Rs for the NC-Hydro and NC-Cal is found to be 0.6 and 1.2 Ω, respectively, as shown in the inset of Fig. 7(a) and (b). The Rs value in the case of NC-Hydro is found to be lower than NC-Cal. The diameter of the semicircle gives the value of Rct, i.e., 0.8 and 1.5 Ω, respectively, for NC-Hydro and NC-Cal. The Rct value of NC-Hydro is found to be lower than NC-Cal, indicating the good conductivity of NC-Hydro.42,47 Therefore, it would not be wrong to state that the composite prepared by the hydrothermal method is more suitable for electrochemical reactions rather than by the calcination method. Table 3 presents a comparison of the supercapacitor activity of previously reported NiO/Co3O4 and our product.
Table 3 Comparison of NiO/Co3O4 materials reported for supercapacitors
| Electrode material |
Specific capacitance (C g−1 or F g−1) |
Electrolyte |
Cyclic stability |
Ref. |
| Retention (%) |
Cycles |
| NiO/Co3O4 core/shell nanofibers |
437 F g−1 at 1 A g−1 |
6 M KOH |
82.9 |
1000 |
19 |
| NiO/Co3O4 nano-heterostructure |
405 F g−1 at 1 A g−1 |
6 M KOH |
97.9 |
1000 |
20 |
| NiO/Co3O4 composite |
801 F g−1 at 1 A g−1 |
3 M KOH |
85 |
1000 |
21 |
| Co3O4/NiO nano films |
572 F g−1 at 1 A g−1 |
6 M KOH |
— |
— |
22 |
| Co3O4/NiO nanocomposites |
256 F g−1 at 10 mV s−1 |
1 M KOH |
— |
— |
23 |
| 233 F g−1 at 20 mV s−1 |
| Porous Co3O4@NiO core–shell |
692.8 F g−1 at 1 A g−1 |
6 M KOH |
90.83 |
3000 |
24 |
| This work |
541.9 F g−1 at 1 A g−1 (176 C g−1) |
2 M KOH |
90 |
5000 |
|
| NC-Hydro |
660.3 F g−1 at 10 mV s−1 |
| 598.5 F g−1 at 20 mV s−1 |
| This work |
480 F g−1 at 1 A g−1 (111 C g−1) |
2 M KOH |
75 |
5000 |
|
| NC-Cal |
823 F g−1 at 10 mV s−1 |
| 624 F g−1 at 20 mV s−1 |
5. Conclusions
In summary, forming a heterostructure by combining individual NiO and Co3O4 is the most favorable approach to improve electrochemical performance. NiO/Co3O4 composite was synthesized here by adopting two methods: (i) hydrothermal and (ii) calcination. The specific capacity was calculated both from CV and GCD curves. The electrochemical kinetics of the systems were found out from the Trasatti plot. The specific capacity of NC-Hydro and NC-Cal calculated from GCD curves was found to be 176 C g−1 and 111 C g−1, respectively, at 1 A g−1. NC-Hydro showed ∼55% capacity retention at a high current density of 10 A g−1, and for NC-Cal, it was found to be 46%. In this study, the activity of the supercapacitor was successfully correlated with the XRD analysis. By analyzing the electrochemical results of NC-Hydro and NC-Cal, it was concluded that the composite prepared by the hydrothermal method performed well as a supercapacitor compared to the composite prepared by the calcination method. This could be due to its large interlayer spacing and lattice parameters that provide a large space for redox reactions to take place. This work may provide new insights into the electrochemical characteristics of the composite with the help of X-ray diffraction results.
Conflicts of interest
The authors declare no conflicts of interest.
Acknowledgements
Dr Amtul Nashim (File no. PDF/2016/002397) and Dr Soumyashree Pany (File no. PDF/2016/002751) are grateful to DST-SERB for financial assistance. The authors are very much thankful to Siksha ‘O’ Anusandhan University (Deemed to be University) for creating the opportunity for us to publish this research.
References
- S. Najib and E. Erdem, Nanoscale Adv., 2019, 8, 2817–2827 RSC.
- F. Wang, W. Xiongwei, Y. Xinhai, L. Zaichun, Z. Yi, F. Lijun, Z. Yusong, Z. Qingming, W. Yuping and H. Wei, Chem. Soc. Rev., 2017, 46, 6816–6854 RSC.
- G. Wang, L. Zhang and J. Zhang, Chem. Soc. Rev., 2012, 41, 797–828 RSC.
- A. Vlad, N. Singh, C. Galande and P. M. Ajayan, Adv. Energy Mater., 2015, 5, 1402115 CrossRef.
- Z. Liang, C. Qu, W. Zhou, R. Zhao, H. Zhang, B. Zhu, W. Guo, W. Meng, Y. Wu, W. Aftab, Q. Wang and R. Zou, Adv. Sci., 2019, 6, 1802005 CrossRef PubMed.
- H. Pang, X. Li, Q. Zhaoi, H. Xue, W.-Y. Lai, Z. Hu and W. Huang, Nano Energy, 2017, 35, 138–145 CrossRef CAS.
- T. Zhai, L. Wan, S. Sun, Q. Chen, J. Sun, Q. Xia and H. Xia, Adv. Mater., 2017, 29, 1604167 CrossRef PubMed.
- R. B. Rakhi, W. Chen, D. Cha and H. N. Alshareef, J. Mater. Chem., 2011, 21, 6197–16204 RSC.
- R. R. Bi, X.-L. Wu, F.-F. Cao, L.-Y. Jiang, Y. G. Guo and L.-J. Wan, J. Phys. Chem. C, 2010, 114, 2448–2451 CrossRef CAS.
- Y. Qian, S. Lu and F. Gao, J. Mater. Sci., 2011, 46, 3517–3522 CrossRef CAS.
- Z. Y. Ji, J. L. Wu, X. P. Shen, H. Zhou and H. T. Xi, J. Mater. Sci., 2011, 46, 1190–1195 CrossRef CAS.
- T. Lu, Y. P. Zhang, H. B. Li, L. K. Pan, Y. L. Li and Z. Sun, Electrochim. Acta, 2010, 55, 4170–4173 CrossRef CAS.
- R. Liang, Y. Du, P. Xiao, J. Cheng, S. Yuan, Y. Chen, J. Yuan and J. Chen, Nanomaterials, 2021, 10, 1248 CrossRef PubMed.
- L. Xing, Y. Dong and X. Wu, RSC Adv., 2018, 8, 28172–28178 RSC.
- P. Jiang, Q. Wang, J. Dai, W. Li and Z. Wei, Mater. Lett., 2017, 188, 69–72 CrossRef CAS.
- M. Gao, W. K. Wang, Q. Rong and J. Jiang, ACS Appl. Mater., 2018, 10, 23163–23173 CrossRef CAS PubMed.
- Z. Xiao, L. Fan, B. Xu, S. Zhang, W. Kang, Z. Kang, H. Lin, X. Liu, S. Zhang and D. Sun, ACS Appl. Mater. Interfaces, 2017, 9, 41827–41836 CrossRef CAS PubMed.
- K.-W. Nam and K.-B. Kim, J. Electrochem. Soc., 2002, 149, A346 CrossRef CAS.
- E. S. Agudosi, E. C. Abdullah, A. Numan, N. M. Mubarak, S. R. Aid, R. Benages-Vilau, P. Gómez-Romero, M. Khalid and N. Omar, Sci. Rep., 2020, 10, 1–13 CrossRef PubMed.
- J. Qiu, Z. Bai, E. Dai, S. Liu and Y. Liu, J. Alloys Compd., 2018, 763, 966–974 CrossRef CAS.
- X. W. Wang, D. L. Zheng, P. Z. Yang, X. E. Wang, Q. Q. Zhu, P. F. Ma and L. Y. Sun, Chem. Phys. Lett., 2017, 667, 260–266 CrossRef CAS.
- Y. Zuo, J.-J. Ni, J.-M. Song, H.-L. Niu, C.-J. Mao, S.-Y. Zhang and Y.-H. Shen, Appl. Surf. Sci., 2016, 370, 528–535 CrossRef CAS.
- P. P. Sahay, J. Alloys Compd., 2021, 867, 159022 CrossRef CAS.
- H. Wei, X. Guo, Y. Wang, Z. Zhou, H. Lv, Y. Zhao, Z. Gu and Z. Chen, Appl. Surf. Sci., 2022, 574, 151487 CrossRef CAS.
- X. C. Lou, X. J. Zhao, Y. L. Xiong and X. T. Sui, J. Sol–Gel Sci. Technol., 2010, 54, 43–48 CrossRef CAS.
- M. Pudukudy and Z. Yaakob, Chem. Pap., 2014, 68, 1087–1096 CAS.
- A. Nashim and K. M. Parida, Chem. Eng. J., 2013, 215, 608–615 CrossRef.
- E.-J. Lee, Z. Chen, H.-J. Noh, S. C. Nam, S. Kang, D. H. Kim, K. Amine and Y.-K. Sun, Nano Lett., 2014, 14, 4873–4880 CrossRef CAS PubMed.
- Y. Sheng, X. Tang, E. Peng and J. Xue, J. Mater. Chem. B, 2013, 1, 512–521 RSC.
- D. Mondal, S. Das, B. K. Paul, D. Bhattacharya, D. Ghoshal, A. L. Gayen, K. Das and S. Das, Mater. Res. Bull., 2019, 115, 159–169 CrossRef CAS.
- H. Elhendawi, R. M. Felfel, A. El-Hady, M. Bothaina and F. M. Reicha, Int. Scholarly Res. Not., 2014, 1–8 Search PubMed.
- L. Wang, Z. H. Dong, Z. G. Wang, F. X. Zhang and J. Jin, Adv. Funct. Mater., 2013, 23, 2758–2764 CrossRef CAS.
- J. Theerthagiri, G. Durai, T. Tatarchuk, M. Sumathi, P. Kuppusami, J. Qin and M. Y. Choi, Ionics, 2020, 26, 2051–2061 CrossRef CAS.
- Y. Han, Y. Ge, Y. Chao, C. Wang and G. G. Wallace, J. Energy Chem., 2018, 27, 57–72 CrossRef.
- J. K. Kim, Polymers, 2019, 11, 120 CrossRef PubMed.
- J.-S. Gwag and Y.-K. Sohn, Bull. Korean Chem. Soc., 2012, 33, 505–510 CrossRef CAS.
- B. Qiu, W. Guo, Z. Liang, W. Xia, S. Gao, Q. Wang, X. Yu, R. Zhao and R. Zou, RSC Adv., 2017, 7, 13340–13346 RSC.
- X. Zhu, M. Sun, R. Zhao, Y. Li, B. Zhang, Y. Zhang, X. Lang, Y. Zhu and Q. Jiang, Nanoscale Adv., 2020, 2, 2785–2791 RSC.
- Q. T. Trinh, K. Bhola, P. N. Amaniampong, F. Jerome and S. H. Mushrif, J. Phys. Chem. C, 2018, 122, 22397–22406 CrossRef CAS.
- M. Alam, K. Karmakar, M. Pal and K. Mandal, RSC Adv., 2016, 6, 114722–114726 RSC.
- X. Lang, H. Mo, X. Hu and H. Tian, Dalton Trans., 2017, 46, 13720–13730 RSC.
- A. Nashim, S. Pany and K. M. Parida, J. Energy Storage, 2021, 42, 103145 CrossRef.
- S. Pany, A. Nashim, K. Parida and P. K. Nanda, ACS Appl. Nano Mater., 2021, 4, 10173–10184 CrossRef CAS.
- A. K. Singh, D. Sarkar, K. Karmakar, K. Mandal and G. G. Khan, ACS Appl. Mater. Interfaces, 2016, 8, 20786–20792 CrossRef CAS PubMed.
- K. V. Sankar, S. Surendran, K. Pandi, A. M. Allin, V. D. Nithya, Y. S. Lee and R. Selvan, RSC Adv., 2015, 5, 27649–27656 RSC.
- H. Wang, X. Xu and A. Neville, RSC Adv., 2021, 11, 26273–26283 RSC.
- A. Nashim, S. Pany, K. M. Parida and J. Nanda, ChemistrySelect, 2019, 4, 12037–12042 CrossRef CAS.
- B. Pandit, D. P. Dubal and B. R. Sankapal, Electrochim. Acta, 2017, 242, 382–389 CrossRef CAS.
- S. A. Pande, B. Pandit and B. R. Sankapal, Mater. Lett., 2017, 209, 97–101 CrossRef CAS.
|
| This journal is © The Royal Society of Chemistry 2024 |
Click here to see how this site uses Cookies. View our privacy policy here.  Open Access Article
 *
*
![[thin space (1/6-em)]](https://www.rsc.org/images/entities/char_2009.gif) :
:![[thin space (1/6-em)]](https://www.rsc.org/images/entities/char_2009.gif) 1 ratio in 50 mL water and stirred for 15 minutes, followed by the addition of 50 mL of water. The solution was then transferred to a Teflon-lined steel autoclave for the hydrothermal process at 160 °C for 16 h in a programmable electric oven without stirring. After cooling, the sample was washed with water and ethanol several times and dried at 80 °C for 12 h. The dried sample of NiO/Co3O4 thus obtained has been abbreviated as NC-Hydro.
1 ratio in 50 mL water and stirred for 15 minutes, followed by the addition of 50 mL of water. The solution was then transferred to a Teflon-lined steel autoclave for the hydrothermal process at 160 °C for 16 h in a programmable electric oven without stirring. After cooling, the sample was washed with water and ethanol several times and dried at 80 °C for 12 h. The dried sample of NiO/Co3O4 thus obtained has been abbreviated as NC-Hydro.![[thin space (1/6-em)]](https://www.rsc.org/images/entities/char_2009.gif) :
:![[thin space (1/6-em)]](https://www.rsc.org/images/entities/char_2009.gif) 16
16![[thin space (1/6-em)]](https://www.rsc.org/images/entities/char_2009.gif) :
:![[thin space (1/6-em)]](https://www.rsc.org/images/entities/char_2009.gif) 4 (sample
4 (sample![[thin space (1/6-em)]](https://www.rsc.org/images/entities/char_2009.gif) :
:![[thin space (1/6-em)]](https://www.rsc.org/images/entities/char_2009.gif) carbon black
carbon black![[thin space (1/6-em)]](https://www.rsc.org/images/entities/char_2009.gif) :
:![[thin space (1/6-em)]](https://www.rsc.org/images/entities/char_2009.gif) Nafion, i.e., 4 mg
Nafion, i.e., 4 mg![[thin space (1/6-em)]](https://www.rsc.org/images/entities/char_2009.gif) :
:![[thin space (1/6-em)]](https://www.rsc.org/images/entities/char_2009.gif) 0.8 mg
0.8 mg![[thin space (1/6-em)]](https://www.rsc.org/images/entities/char_2009.gif) :
:![[thin space (1/6-em)]](https://www.rsc.org/images/entities/char_2009.gif) 4 μL) was maintained for deposition onto the nickel foam. After deposition, the electrode (nickel foam with sample deposited on it) was dried at 80 °C for 12 h in a vacuum oven. Before using the electrode, 10 MPa pressure was applied to the foam for 10 seconds. The mass deposited on the nickel foam was found to be 2.94 mg.
4 μL) was maintained for deposition onto the nickel foam. After deposition, the electrode (nickel foam with sample deposited on it) was dried at 80 °C for 12 h in a vacuum oven. Before using the electrode, 10 MPa pressure was applied to the foam for 10 seconds. The mass deposited on the nickel foam was found to be 2.94 mg.


 indicates the peaks of NiO and ♦ is used to denote the peaks of Co3O4.
![[thin space (1/6-em)]](https://www.rsc.org/images/entities/char_2009.gif) sin
sin![[thin space (1/6-em)]](https://www.rsc.org/images/entities/char_2009.gif) θ
θ


