 Open Access Article
Creative Commons Attribution 3.0 Unported Licence
The influence of crystal structures on the performance of CoMoO4 battery-type supercapacitor electrodes†
Kunli Yanga,
Joseph P. Clineb,
Bohyeon Kima,
Christopher J. Kielyab and
Steven McIntosh *a
*a
aDepartment of Chemical and Biomolecular Engineering, Lehigh University, Bethlehem, PA 18015, USA. E-mail: mcintosh@lehigh.edu
bDepartment of Materials Science and Engineering, Lehigh University, Bethlehem, PA 18105, USA
First published on 11th March 2024
Abstract
CoMoO4 is a promising battery-type supercapacitor electrode material that can offer relatively high storage capacity and cycle stability. In this work, we investigate the role of the crystalline phase of CoMoO4 in determining these performance parameters. The hydrate phase of CoMoO4 was synthesized on a nickel foam substrate via hydrothermal reaction with subsequent annealing under an inert atmosphere leading to the formation of the β-phase CoMoO4. Similar nanoplate morphologies were observed in all of the samples. The hydrate-phase CoMoO4 demonstrates larger specific capacity than the annealed β-phase CoMoO4. Besides, the samples synthesized at lower temperatures have better rate capability than the sample annealed at higher temperatures. However, the hydrate phase had worse long-term stability compared to the β-phase samples.
1. Introduction
The intermittent nature of renewable energy requires the further development of energy storage technologies, with coupling between these energy storage methods likely necessary to meet demands for both high power and high energy storage capacity.1,2 Supercapacitors are of great interest as they can potentially provide substantially higher power density than battery systems, increased capacity in comparison with traditional film capacitors, and long cycle life.3 Based on their charge storage mechanisms, supercapacitors can be broadly classified as electrical double-layer capacitors (EDLCs) or pseudocapacitors. EDLCs store charge via a non-faradaic process whereby charges are electrostatically separated and are adsorbed onto the surfaces of the electrodes. Therefore, the EDLC capacity is proportional to the electrode surface area,4 providing very high-power density but only limited energy density.3 Compared to EDLCs, pseudocapacitors store energy through fast near-surface redox reactions to provide higher specific capacitance5,6 while maintaining high power density.7,8RuO2 was first introduced as the electrode material for pseudocapacitors because of its multiple oxidation states, wide electrical potential range, high conductivity, and superior electrochemical reversibility.9–12 However, the scarcity of resources and the extremely high cost of RuO2 hinders wide application.13,14 The report of the pseudocapacitive behavior of RuO2 inspired the exploration of other TMOs, such as cobalt oxide, nickel oxide, and iron oxide, with manganese oxide receiving the most interest.3,15–22 Even with many advantages such as multiple oxidation states, high abundance, low cost, and environmental benignity, several shortcomings of TMOs like poor electrical conductivity still need to be addressed.23 More recently, transition metal molybdates (TMMs), especially NiMoO4 and CoMoO4 are emerging as excellent electrode materials, due to their electrochemical activity, enhanced electronic conductivity, and high abundance.24–26 To enhance the electrochemical properties of CoMoO4, approaches including fabricating unique morphologies and making composites with conductive carbon materials have been demonstrated.27–31
In this article, we studied the influence of annealing temperature on the electrochemical properties of CoMoO4. CoMoO4 was synthesized on nickel foams via a facile hydrothermal reaction. Hydrate-phase CoMoO4 was obtained at lower annealing temperatures, while β-phase CoMoO4 was synthesized at 350 °C and higher temperatures. The hydrate-phase CoMoO4 has higher specific capacity than the β-phase CoMoO4. The long-term stability of CoMoO4 is also closely related to the crystal phase. The decrease in electrochemical surface area (ECSA), increased charge transfer resistance, and worse diffusion are the main factors that lead to the degradation during long-term tests. Besides, 350 °C CoMoO4 with lower crystallinity has a higher specific capacity than 450 °C CoMoO4 which has a higher crystallinity, indicating that crystallinity also influences the electrochemical properties of CoMoO4.
2. Experimental
2.1 Synthesis of CoMoO4 on nickel foam substrate
CoMoO4 was synthesized on nickel foams32–34 by a facile hydrothermal method. Before the hydrothermal reaction, a piece of nickel foam (3 cm × 2 cm × 0.1 cm) was cleaned by ultrasonication in ethanol and deionized water. 1.5 mmol cobalt nitrate hexahydrate (Co(NO3)2·6H2O) and 1.5 mmol sodium molybdate dihydrate (Na2MoO4·2H2O) were dissolved in 30 mL DI water and stirred for 30 minutes to form a clear purple solution. A cleaned nickel foam was immersed in the solution within an autoclave prior to sealing and heating in an oven at 160 °C for 4 hours. The sample was then cleaned by ultrasonication in deionized water and dried overnight in an oven at 60 °C. Without further treatment, such samples are labeled herein as-synthesized CoMoO4. The weight of nickel foam before and after the hydrothermal reaction was carefully measured, and the increased weight was regarded as the weight of active materials. The average loading of CoMoO4 on the nickel foam for all samples was between 0.90 and 0.92 mg cm−2. To study the influence of the annealing temperatures, some as-synthesized samples were annealed under N2 environment at 200 °C, 350 °C, and 450 °C for 2 hours, and are herein labeled as such.2.2 Characterization
The crystalline structures of the samples were studied by X-ray diffraction (XRD, Cu Kα radiation, PANalytical Empyrean X-ray Diffractometer). The interlayer spacing of the samples was calculated by Bragg's law, eqn S1,† using the data extracted from XRD. Thermogravimetric analysis (TGA, TA instrument Q500) was applied to study the water loss of CoMoO4 during annealing. TGA curves were collected from 25 °C to 500 °C under N2 atmosphere at a heating rate of 5 °C min−1. Raman spectra were collected (WITec Raman Imaging alpha300 R) with a 532 nm wavelength laser. The morphologies of the samples were imaged by field emission scanning electron microscopy (FESEM, Hitachi 4300 SE) with accompanying elemental analysis by X-ray energy dispersive spectrometry (XEDS). Transmission electron microscopy (TEM) was applied to study the crystal structure of observed morphologies.Electrochemical measurements, including cyclic voltammetry (CV), galvanostatic charge–discharge (GCD), electrochemical impedance spectroscopy (EIS), and electrochemical surface area (ECSA) were carried out in a traditional three-electrode system (Gamry Reference 3000, Gamry Instruments, Malvern PA, USA), using 2 M KOH aqueous solution as the electrolyte, Pt mesh as the counter electrode, and Hg/HgO reference electrode. CV curves were measured between 0 and 0.6 V at scan rates between 1 mV s−1 and 10 mV s−1. The CV curves typically stabilized after 20 cycles. Information on calculation of calculating the electrode capacity, ESCA, and fitting of the cyclic voltammograms can be found in the ESI.†
3. Results and discussion
3.1 Structural characterization
Fig. 1(a) shows the XRD patterns of CoMoO4 on Ni mesh as-synthesized and after annealing in N2 at 200 °C, 350 °C, and 450 °C for two hours. The XRD patterns of as-synthesized and 200 °C annealed CoMoO4 match well with standard patterns of the triclinic hydrate phase of CoMoO4 (PDF #14-0086), while the XRD patterns of samples annealed at 350 °C and 450 °C CoMoO4 match with the standard patterns of monoclinic β-phase CoMoO4 (PDF #21-0868). The sharper peaks of 450 °C annealed CoMoO4 indicate that, as expected, the crystallites grow as the annealing temperature increases. The color of the materials changed from purple to brown as the hydrate phase transformed into the β-phase.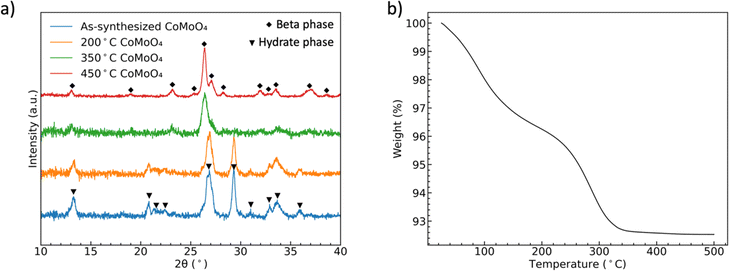 | ||
| Fig. 1 (a) XRD patterns showing the formation of two phases of CoMoO4, (b) TGA curves of the hydrate CoMoO4 from 25 °C to 500 °C in N2 showing the two processes of dehydration. | ||
Both CoMoO4 phases have octahedrally coordinated CoO6 and tetrahedrally coordinated MoO4, with the hydrate phase having additional coordination water bound to Co atoms.35 The CoO6 octahedra form two different [CoO6]4 units depending on the phases: in the β-phase, edge-sharing CoO6 octahedra can be considered closely packed, while in the hydrate-phase the CoMoO4, are more loose-packed in a Z-shape [CoO6]4 unit. The lattice water in the hydrate phase occupies the interstitial sites in this more open structure.35 The interlayer spacing of the hydrate phase and β phase is calculated by Bragg's law based on the XRD data, Fig. S1.† The calculated interlayer spacing matches with the two crystalline structures, also confirming the more open structure of hydrate phase.35–37 The overall similarity of metal coordination enables the facile transition from hydrate- to β-phase upon annealing.35
TGA of as-synthesized material under N2, Fig. 1(b), indicates two distinct weight loss regions in the temperature range of 60 °C to 200 °C and 240 °C to 340 °C.38 The first weight loss is generally attributed to the reversible loss of lattice water, while the second dehydration is attributed to the irreversible phase change from hydrate- to β-phase, as indicated by the XRD patterns. We noted in our own experiments that samples heated to only 200 °C would regain mass is left in the open laboratory for a period of several hours, indicating that the samples can reabsorb water from the environment. However, the weight loss was permanent after annealing at and above 350 °C.
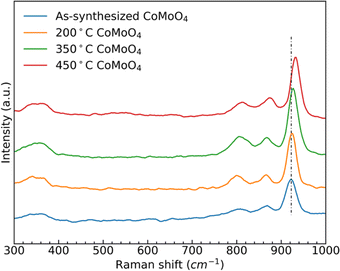
Raman spectra of the as-synthesized and annealed samples, Fig. 2, show three similar bands between 950 cm−1 and 800 cm−1, and two bands around 350 cm−1. The strong band at 930 cm−1 and weaker bands at 880 cm−1 and 350 cm−1 all correspond to the stretching vibrations of Mo–O–Co in CoMoO4.39,40 The peak at 340 cm−1 is due to the vibration of MoO4.41 After the transition from the hydrate phase to the β phase, the stronger peak at around 930 cm−1 shifted to a higher wavenumber, due to the reduced Mo–O–Co bond length in the β-phase CoMoO4.
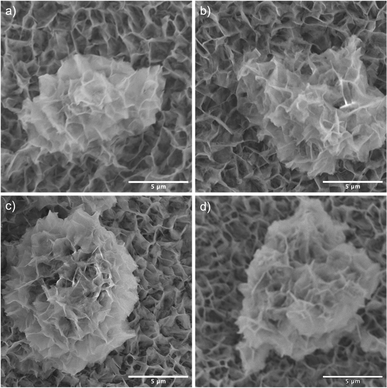
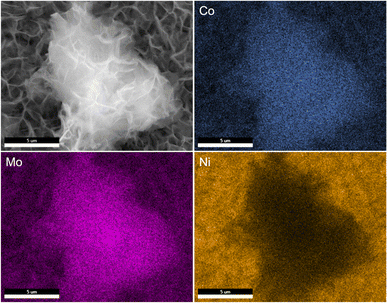
SEM images reveal that the synthesis yields a thin film of CoMoO4 nanoplates over the surface of the nickel foam with associated agglomerations of CoMoO4 nanoplates growing on the surface of the thin film, Fig. 3. Lower magnification wider views are provided in Fig. S2.† This morphology is maintained after annealing despite the change in the crystal structure, likely due to the overall structural similarity35 and small unit cell volume change from 103.8 Å3 of hydrate-phase CoMoO4 to 106.5 Å3 β-phase CoMoO4. Associated EDS mapping confirms the uniform distribution of Co and Mo throughout these structures as synthesized, Fig. 4. The high background Ni signal is due to the Ni-foam substrate and is lower in the region of the larger central nanoplate agglomeration due to lower Ni concentration relative to the Ni-foam. A sample of the as-synthesized material was mechanically removed from the nickel film for TEM analysis. Fig. S3(a)† is a TEM image of the removed nanoplate with the associated electron diffraction pattern shown in Fig. S3(b),† with the crystal structure of these morphologies matching the hydrate phase, Table S1.†
3.2 Electrochemical characterization
Cyclic voltammetry (CV) collected from the samples show clear redox peaks in the measured potential window, Fig. 5, demonstrating that the CoMoO4 structures are active as possible pseudocapacitor materials in alkaline electrolyte. These redox peaks are attributable to changes in Co oxidation state as Mo is not considered to be redox active within this window. Mo is suggested to aid in both enhancing electronic conductivity and providing structural integrity to the electrode material when compared to the use of pure cobalt oxide.42,43 The two hydrate phase electrode materials, the as-synthesized CoMoO4 and 200 °C CoMoO4 show two distinct oxidation peaks centered around 0.31 V and 0.39 V (vs. Hg/HgO). This indicates that the hydrate-phase CoMoO4 has two distinct and accessible oxidation states or structures of Co. Given that the Co within the hydrate phase of CoMoO4 exists in a similar octahedral coordination with similar Co–O bond distances,35 we may anticipate that these distinct oxidation peaks are due to distinct changes in oxidation state rather than crystallographic site dependent. Based on prior computational reports, we suggest that the first of these peaks is attributable to Co2+ being oxidized to Co3+ at a lower potential, prior to further oxidation to Co4+ as the potential increases.44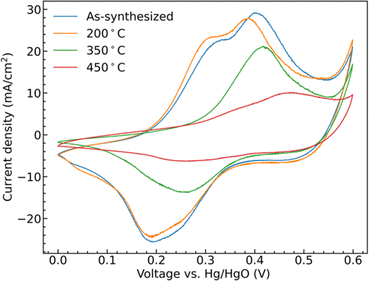 | ||
| Fig. 5 CV curves of as-synthesized CoMoO4, 200 °C CoMoO4, 350 °C CoMoO4, and 450 °C CoMoO4 from 0 to 0.6 V (vs. Hg/HgO) at a scan rate of 10 mV s−1 in 2 M KOH. | ||
The two β-phase materials, those annealed at 350 °C and 450 °C, show less single oxidation and reduction peaks and are generally shifted to higher potentials at a scan rate of 10 mV s−1. The 350 °C annealed sample shows a single peak, likely due to the overlapping of the redox potentials of the two redox transitions. The 450 °C shows two overlapping, lower intensity, but still distinct peaks shifted to higher potential by around 0.07 V when compared with the as-synthesized hydrate-phase sample. At the same scan rate, the area within the CV curves is proportional to the capacitance of the electrode indicating that the hydrate-phase CoMoO4 has a larger capacitance than the β-phase CoMoO4.
The shifting of the redox potentials as the crystal phase transitions from the hydrate phase to the β-phase is attributable to the change of the Madelung electric field exerted on the metal ions. With the redox potential increasing when the field becomes weaker.45,46 For example, Padhi et al. explained that the redox potential of Fe2+/3+ in an olivine structure was higher than that in a NASICON structure due to a reduction in the Madelung electric field experienced by Fe cations in the edge-sharing FeO6 octahedra within the olivine structure.47 Similarly, in CoMoO4, Co cations in the more compact edge-sharing β-phase of CoMoO4 will experience a reduced field, and thus demonstrate a higher redox potential when compared to the hydrate phase.35
To further deconvolute the redox behavior of the materials, CV scans were performed at scan rates from 1 mV s−1 to 10 mV s−1, Fig. 6. The oxidation and reduction peaks of CoMoO4 shift to higher and lower potential, respectively, as the scan rate increases as expected from standard kinetic models.32 The total charge storage mechanism of pseudocapacitors can generally be considered as a combination of surface and bulk processes.48 These are typically deconvoluted through the simple approach proposed by Linström et al.49 where the peak current density of the redox reaction is related to the scan rates by a power-law relationship with pre-exponential, a, and exponent, b, eqn S2.†50 The exponent “b” can vary between 0.5 for a bulk-limited process to 1.0 for a surface-limited process. The b values of the four CoMoO4 samples are between 0.5 and 1, Table S3,† indicating that the charge storage mechanism is a mixture of the two processes, noting that the b values for the hydrate-phase are smaller than for β-phase. This result suggested that more of the bulk material is involved in the redox reactions for the hydrate phase, at least partly explaining the demonstrated larger specific capacity compared to the more surface limited β phase.
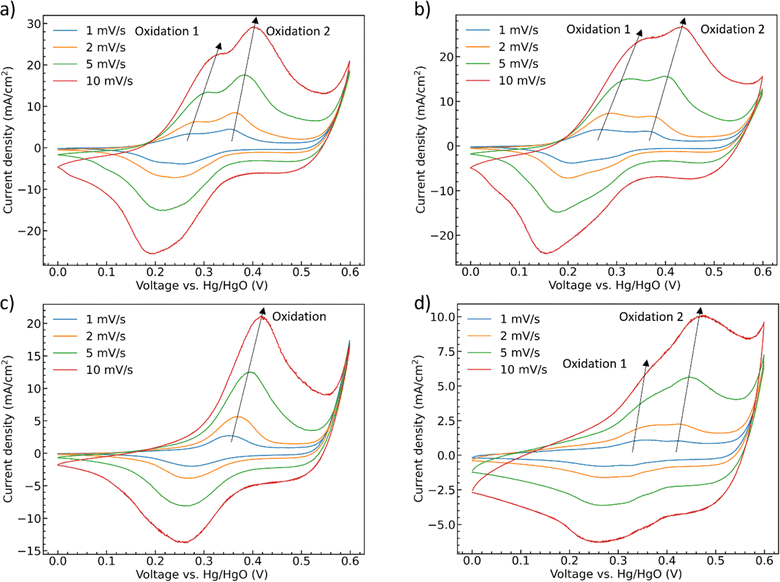 | ||
| Fig. 6 CV curves as a function of scan rate (a) as-synthesized CoMoO4, (b) 200 °C CoMoO4, (c) 350 °C CoMoO4, (d) 450 °C CoMoO4 from 0 to 0.6 V (vs. Hg/HgO) in 2 M KOH. | ||
The current contribution from surface and bulk can be further assessed by the following equation:51–55
| i(v) = k1v + k2v1/2 = isurface + ibulk |
i(v) is the peak current density (A cm−2) at different scan rate v (mV s−1), k1 (A cm−2 mV−1 s) and k2 (A cm−2 mV−1/2 s1/2) are the constants, isurface (A cm−2) and ibulk (A cm−2) stand for the contribution of the capacitive- and diffusion-controlled process. Therefore, by plotting and fitting i/v1/2 vs. v1/2, the value of constant k1 (the slope) and k2 (the y intercept) can be determined, Fig. S4.† For the as-synthesized hydrate-phase sample, Fig. 7(a) and (b), the current contribution of the bulk decreased from 54.76% to 27.68% when the scan rate increased from 1 mV s−1 to 10 mV s−1. This was because more diffusion-controlled bulk reaction was involved when the scan rate was slow. Similarly, in the 450 °C sample, Fig. 7(c) and (d), the current contribution of the bulk decreased from 12.36% to 4.27%. The bulk portion in the 450 °C sample was significantly smaller than that in the as-synthesized sample, which matched the conclusion made in the discussion of the b values. We suggest that this greater bulk activity is due to the more open crystal structure and potential for ionic transport within the hydrate phase.56,57
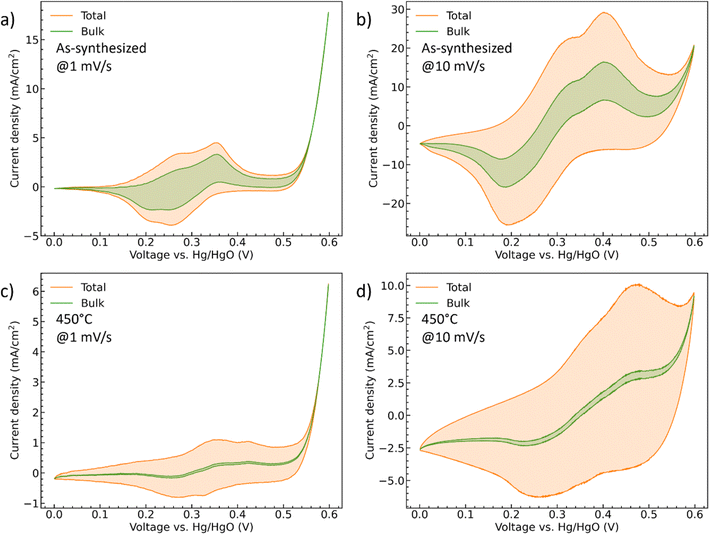 | ||
| Fig. 7 The CV curves of (a and b) the as-synthesized and (c and d) 450 °C CoMoO4 with deconvoluted diffusion-controlled current contributions at both 1 mV s−1 and 10 mV s−1. | ||
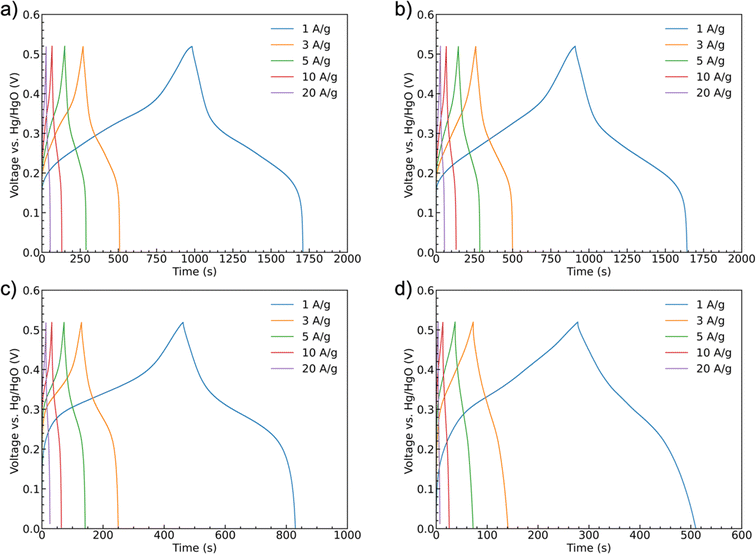
Galvanostatic charge/discharge curves were recorded for the samples at scan rates of 1 A g−1, 3 A g−1, 5 A g−1, 10 A g−1, and 20 A g−1 up to 0.52 V, Fig. 8. All of the curves show similar trends with a shallower initial charging gradient at lower potentials. This gradient increases once the accessible sites of the first oxidation state are fully occupied until the charging is stopped. The discharge curves have a shallower shape indicating battery-like behavior. The potential ranges for these shifts in slope are generally consistent with the peak positions observed in the CV scans. Unlike a pseudocapacitive material as MnO2, which has a rectangular shape CV curve, CoMoO4 does not have constant capacitance over the whole potential window.58 Therefore, instead of capacitance, capacity was used to represent the charge storage ability of the CoMoO4 samples. Fitting to the standard model, eqn (S3),† the weight-specific capacities of as-synthesized CoMoO4, 200 °C CoMoO4, 350 °C CoMoO4, and 450 °C CoMoO4 are 724.9, 731.7, 367.2 and 231.7 C g−1 at the current density of 1 A g−1, respectively, confirming the capacity trends expected from the CV data. The as-synthesized hydrate-phase CoMoO4 exhibited superior specific capacity compared to similar materials (Table S4†).
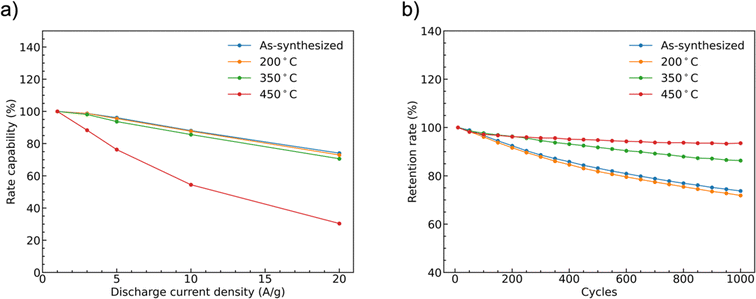
The rate capability of supercapacitor electrodes at high charge and discharge current density is important for real applications. Fig. 9(a) shows the trend of the specific capacities of the four CoMoO4 electrodes at scan rates from 1 A g−1 to 20 A g−1. The capacities decreased as current density increased because of decreased reactive materials involved in the redox reactions.32 The as-synthesized CoMoO4, 200 °C CoMoO4, and 350 °C CoMoO4 exhibited a similar trend of rate capability. The 450 °C CoMoO4 had the worst performance among all CoMoO4 samples and only had a retention rate of 30% at a high current density of 20 A g−1.
The long-term cycle stability of the CoMoO4 electrodes was studied at a current density of 10 A g−1 for 1000 cycles, Fig. 9b. After 1000 cycles, the specific capacities of the as-synthesized, 200 °C, 350 °C, and 450 °C CoMoO4 electrodes were 74%, 72%, 86%, and 94% of the initial capacities, respectively.
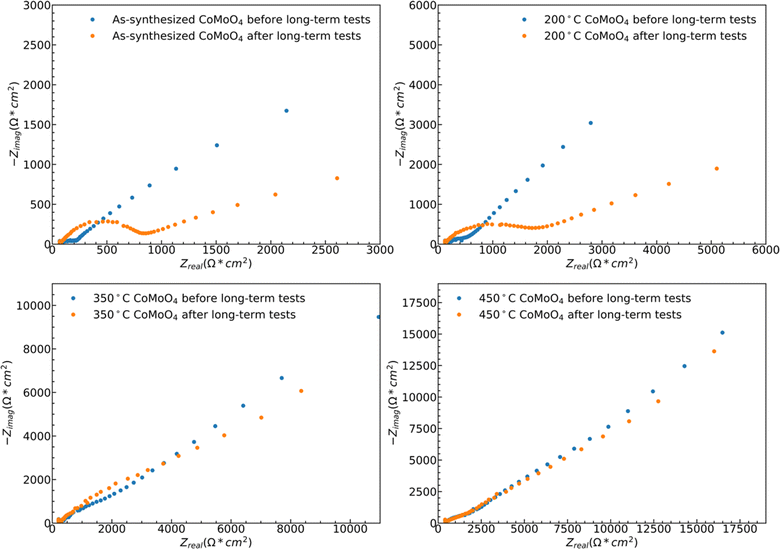
While both hydrate phase samples show relatively poor cycling stability, no significant morphology changes were observed by SEM, Fig. S5.† Some restructuring is evident upon measuring the ECSA, Fig. S6.† The ECSA was calculated based on eqn S4,† and the ECSA of as-synthesized, 200 °C, 350 °C, and 450 °C CoMoO4 before the long-term test are 29.5, 57.5, 105.5 and 186.5 cm2, respectively. The ECSA of the as-synthesized material remains relatively unchanged upon 1000 cycles, increasing from 29.5 to 31.25 cm2, and that of the 200 °C annealed sample decreases from 57.5 to 41.25 cm2. The ECSA-area normalized EIS analysis reveals two dominant processes: a high-frequency arc attributable to a charge transfer process, likely surface kinetics, and a lower-frequency arc attributable to diffusion, Fig. 10. The higher frequency arc of the hydrate phase is smaller than that of the β phase, indicating that the hydrate phase has a smaller charge transfer resistance, which may partially explain why the hydrate phase exhibits higher capacitance. After cycling, both hydrate-phase samples show clear increases in the magnitude of the higher frequency arc, attributed to degradation in surface kinetics.41
The 350 °C β-phase material undergoes ECSA loss in a ratio that is close to that of the lost capacity, Fig. S6,† but again shows no clear structural change in SEM, Fig. S5.† This indicates that the degradation is likely due to the loss of surface area without bulk structural change. This loss of active surface is confirmed by the relatively little change in the ECSA-area normalized impedance spectra after cycling, indicating no change in the operating mechanism Fig. 10. As may be expected from the relatively little change in capacity with cycling, the ECSA, EIS data, and SEM observed morphology change little for the 450 °C β-phase material upon cycling.
4. Conclusion
The hydrate-phase CoMoO4 and the β-phase CoMoO4 nanoplate structures can be synthesized by the hydrothermal reaction and subsequent annealing. The facile transition from the hydrate phase to the β-phase upon heating occurs without significant morphological change. Intriguingly, hydrate-phase CoMoO4 electrodes exhibit higher specific capacity than their β-phase counterparts, with rapid surface kinetics. Both the rapid surface kinetics and storage capacity exhibited by the hydrate phase degrade significantly upon long-term cycling, although the mass basis capacity is still substantially greater than that for the β-phase samples. This work suggests that it may be more efficient to use the low-temperature synthesized hydrate-phase CoMoO4, which was generally regarded as a precursor of CoMoO4, directly as a supercapacitor electrode, particularly if the surface kinetics can be maintained or enhanced.Conflicts of interest
There are no conflicts to declare.Acknowledgements
Kunli Yang was partially supported by the National Science Foundation under grant CBET-1803758.References
- Z. Yang, J. Zhang, M. C. W. Kintner-Meyer, X. Lu, D. Choi, J. P. Lemmon and J. Liu, Chem. Rev., 2011, 111, 3577–3613 CrossRef CAS PubMed.
- M. H. Nehrir, C. Wang, K. Strunz, H. Aki, R. Ramakumar, J. Bing, Z. Miao and Z. Salameh, IEEE Trans. Sustain. Energy, 2011, 2, 392–403 Search PubMed.
- P. Simon and Y. Gogotsi, Nat. Mater., 2008, 7, 845–854 CrossRef CAS PubMed.
- E. Frackowiak, Phys. Chem. Chem. Phys., 2007, 9, 1774–1785 RSC.
- D. P. Chatterjee and A. K. Nandi, J. Mater. Chem. A, 2021, 9, 15880–15918 RSC.
- H. Liu, X. Liu, S. Wang, H. K. Liu and L. Li, Energy Storage Mater., 2020, 28, 122–145 CrossRef.
- M. R. Lukatskaya, S. Kota, Z. Lin, M.-Q. Zhao, N. Shpigel, M. D. Levi, J. Halim, P.-L. Taberna, M. W. Barsoum, P. Simon and Y. Gogotsi, Nat. Energy, 2017, 2, 17105 CrossRef CAS.
- S. Fleischmann, J. B. Mitchell, R. Wang, C. Zhan, D. E. Jiang, V. Presser and V. Augustyn, Chem. Rev., 2020, 120, 6738–6782 CrossRef CAS PubMed.
- S. Trasatti and G. Buzzanca, J. Electroanal. Chem., 1971, 29, 4–8 CrossRef.
- J. P. Zheng and T. R. Jow, J. Electrochem. Soc., 1995, 142, L6–L8 CrossRef CAS.
- T. R. Jow and J. P. Zheng, J. Electrochem. Soc., 1998, 145, 49 CrossRef CAS.
- B. E. Conway, Electrochemical Supercapacitors: Scientific Fundamentals and Technological Applications, Springer New York, New York, 1999 Search PubMed.
- O. Ghodbane, J. L. Pascal and F. Favier, ACS Appl. Mater. Interfaces, 2009, 1, 1130–1139 CrossRef CAS PubMed.
- R. Liu, A. Zhou, X. Zhang, J. Mu, H. Che, Y. Wang, T. T. Wang, Z. Zhang and Z. Kou, Chem. Eng. J., 2021, 412, 128611 CrossRef CAS.
- M. Toupin, T. Brousse and D. Bélanger, Chem. Mater., 2004, 16, 3184–3190 CrossRef CAS.
- H. Y. Lee and J. B. Goodenough, J. Solid State Chem., 1999, 223, 220–223 CrossRef.
- K. C. Liu and M. A. Anderson, Mater. Res. Soc. Symp. Proc., 1995, 393, 427–432 CrossRef CAS.
- T. F. Yi, T. T. Wei, J. Mei, W. Zhang, Y. Zhu, Y. G. Liu, S. Luo, H. Liu, Y. Lu and Z. Guo, Adv. Sustainable Syst., 2020, 4, 1–22 Search PubMed.
- S. Vijayakumar, A. Kiruthika Ponnalagi, S. Nagamuthu and G. Muralidharan, Electrochim. Acta, 2013, 106, 500–505 CrossRef CAS.
- G. Godillot, P. L. Taberna, B. Daffos, P. Simon, C. Delmas and L. Guerlou-Demourgues, J. Power Sources, 2016, 331, 277–284 CrossRef CAS.
- R. Kumar, H. J. Kim, S. Park, A. Srivastava and I. K. Oh, Carbon, 2014, 79, 192–202 CrossRef CAS.
- Y. Zeng, M. Yu, Y. Meng, P. Fang, X. Lu and Y. Tong, Adv. Energy Mater., 2016, 6, 1–17 Search PubMed.
- V. Augustyn, P. Simon and B. Dunn, Energy Environ. Sci., 2014, 7, 1597–1614 RSC.
- M. C. Liu, L. Bin Kong, C. Lu, X. M. Li, Y. C. Luo and L. Kang, Mater. Lett., 2013, 94, 197–200 CrossRef CAS.
- P. Li, C. Ruan, J. Xu and Y. Xie, Electrochim. Acta, 2020, 330, 135334 CrossRef CAS.
- Y. Qian, J. Zhang, J. Jin, S. Yang and G. Li, ACS Appl. Energy Mater., 2022, 5, 5830–5840 CrossRef CAS.
- K. Chi, Z. Zhang, Q. Lv, C. Xie, J. Xiao, F. Xiao and S. Wang, ACS Appl. Mater. Interfaces, 2017, 9, 6044–6053 CrossRef CAS PubMed.
- S. H. Kazemi, M. Tabibpour, M. A. Kiani and H. Kazemi, RSC Adv., 2016, 6, 71156–71164 RSC.
- Z. Xu, Z. Li, X. Tan, C. M. B. Holt, L. Zhang, B. S. Amirkhiz and D. Mitlin, RSC Adv., 2012, 2, 2753–2755 RSC.
- X. Yu, B. Lu and Z. Xu, Adv. Mater., 2014, 26, 1044–1051 CrossRef CAS PubMed.
- W. Li, X. Wang, Y. Hu, L. Sun, C. Gao, C. Zhang, H. Liu and M. Duan, Nanoscale Res. Lett., 2018, 13, 1–10 CrossRef PubMed.
- D. Guo, H. Zhang, X. Yu, M. Zhang, P. Zhang, Q. Li and T. Wang, J. Mater. Chem. A, 2013, 1, 7247–7254 RSC.
- J. Wang, J. Chang, L. Wang and J. Hao, Ionics, 2018, 24, 3967–3973 CrossRef CAS.
- G. K. Veerasubramani, K. Krishnamoorthy and S. J. Kim, J. Power Sources, 2016, 306, 378–386 CrossRef CAS.
- K. Eda, Y. Uno, N. Nagai, N. Sotani and M. S. Whittingham, J. Solid State Chem., 2005, 178, 2791–2797 CrossRef CAS.
- M. Zang, N. Xu, G. Cao, Z. Chen, J. Cui, L. Gan, H. Dai, X. Yang and P. Wang, ACS Catal., 2018, 8, 5062–5069 CrossRef CAS.
- Y. Zhang, H. Guo, P. Yuan, K. Pang, B. Cao, X. Wu, L. Zheng and R. Song, J. Power Sources, 2019, 442, 227252 CrossRef CAS.
- J. A. Rodriguez, S. Chaturvedi, J. C. Hanson, A. Albornoz and J. L. Brito, J. Phys. Chem. B, 1998, 102, 1347–1355 CrossRef CAS.
- D. T. Dam, T. Huang and J. M. Lee, Sustainable Energy Fuels, 2017, 1, 324–335 RSC.
- P. L. Villa, F. Trifirò and I. Pasquon, React. Kinet. Catal. Lett., 1974, 1, 341–344 CrossRef CAS.
- F. Nti, D. A. Anang and J. I. Han, J. Alloys Compd., 2018, 742, 342–350 CrossRef CAS.
- X. Hu, W. Zhang, X. Liu, Y. Mei and Y. Huang, Chem. Soc. Rev., 2015, 44, 2376–2404 RSC.
- D. Cai, B. Liu, D. Wang, Y. Liu, L. Wang, H. Li, Y. Wang, C. Wang, Q. Li and T. Wang, Electrochim. Acta, 2014, 125, 294–301 CrossRef CAS.
- M. Bajdich, M. García-Mota, A. Vojvodic, J. K. Nørskov and A. T. Bell, J. Am. Chem. Soc., 2013, 135, 13521–13530 CrossRef CAS PubMed.
- A. Gutierrez, N. A. Benedek and A. Manthiram, Chem. Mater., 2013, 25, 4010–4016 CrossRef CAS.
- M. Wakihara and O. Yamamoto, Lithium-Ion Batteries: Fundamentals and Performance, John Wiley & Sons, Weinheim, 2008 Search PubMed.
- A. K. Padhi, K. S. Nanjundaswamy and J. B. Goodenough, J. Electrochem. Soc., 1997, 144, 1188 CrossRef CAS.
- H. Shao, Z. Lin, K. Xu, P. L. Taberna and P. Simon, Energy Storage Mater., 2019, 18, 456–461 CrossRef.
- H. Lindström, S. Södergren, A. Solbrand, H. Rensmo, J. Hjelm, A. Hagfeldt and S. E. Lindquist, J. Phys. Chem. B, 1997, 101, 7710–7716 CrossRef.
- H. Pan, J. F. Ellis, X. Li, Z. Nie, H. J. Chang and D. Reed, ACS Appl. Mater. Interfaces, 2019, 11, 37524–37530 CrossRef CAS PubMed.
- G. P. Sharma, Vikas, R. G. S. Pala and S. Sivakumar, Energy Fuels, 2021, 35, 19765–19774 CrossRef CAS.
- T. -C. Liu, W. G. Pell, B. E. Conway and S. L. Roberson, J. Electrochem. Soc., 1998, 145, 1882–1888 CrossRef CAS.
- V. Augustyn, P. Simon and B. Dunn, Energy Environ. Sci., 2014, 7, 1597–1614 RSC.
- G. R. Reddy, G. R. Dillip, G. L. Manjunath and S. W. Joo, J. Electrochem. Soc., 2022, 169, 060549 CrossRef CAS.
- K. Prasad, T. V. M. Sreekanth, K. Yoo and J. Kim, J. Alloys Compd., 2023, 961, 170896 CrossRef CAS.
- G. R. Reddy, G. R. Dillip, G. L. Manjunath and S. W. Joo, J. Electrochem. Soc., 2022, 169, 060549 CrossRef CAS.
- D. B. Malavekar, S. B. Kale, V. C. Lokhande, U. M. Patil, J. H. Kim and C. D. Lokhande, J. Phys. Chem. C, 2020, 124, 28395–28406 CrossRef CAS.
- T. Brousse, D. Belanger and J. W. Long, J. Electrochem. Soc., 2015, 162, A5185–A5189 CrossRef CAS.
Footnote |
| † Electronic supplementary information (ESI) available. See DOI: https://doi.org/10.1039/d3ra05878f |
| This journal is © The Royal Society of Chemistry 2024 |

