 Open Access Article
Synthesis of CoFe2O4@SiO2–NH2 and its application in adsorption of trace lead†
Yanxia Zeng abcd,
Jiliang Xieabc,
Xin Xiao
 *abc,
Li Chen*bc and
Xiashi Zhu*d
aJiangsu Key Laboratory of Marine Bioresources and Environment, Jiangsu Ocean University, 59 Cangwu Road, Haizhou, Lianyungang 222005, China. E-mail: xiaoxin@njust.edu.cn
bCo-Innovation Center of Jiangsu Marine Bio-industry Technology, Jiangsu Ocean University, 59 Cangwu Road, Haizhou, Lianyungang 222005, China. E-mail: chenli@jou.edu.cn
cJiangsu Institute of Marine Resources Development, 59 Cangwu Road, Haizhou, Lianyungang 222005, China
dSchool of Chemistry and Chemical Engineering, Yangzhou University, Yangzhou City, Jiangsu Province 225009, China
First published on 2nd January 2024
Abstract
In this work, an amine functionalized CoFe2O4 magnetic nanocomposite material CoFe2O4@SiO2–NH2 was prepared successfully by modifying coated-CoFe2O4@SiO2 magnetic nanoparticles with 3-aminopropyltriethoxysilane (APTES) and became an efficient adsorbent for the separation and analysis of trace lead in water. The CoFe2O4@SiO2–NH2 magnetic nanoparticles were characterized using SEM, TEM, XRD, FTIR, VSM and BET techniques. Then, the adsorption mechanism was preliminarily investigated through ZETA, XPS, and adsorption kinetic experiments. The adsorption process was fitted by pseudo-second-order kinetics and a Langmuir isotherm model. The main adsorption mechanism of CoFe2O4@SiO2–NH2 towards lead ions was the chelation between the amino groups of CoFe2O4@SiO2–NH2 and lead cations, as well as the strong Coulomb interaction between the electron donor atoms O and N in the surface of CoFe2O4@SiO2–NH2 and lead cations. The adsorption capacity is 74.5 mg g−1 and the adsorbent can be reused 5 times. Hence, this prepared CoFe2O4@SiO2–NH2 could find potential applications for the removal of trace metal ions in surface water.
1 Introduction
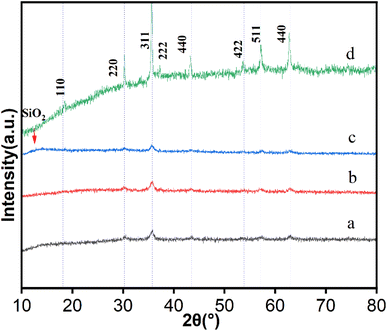
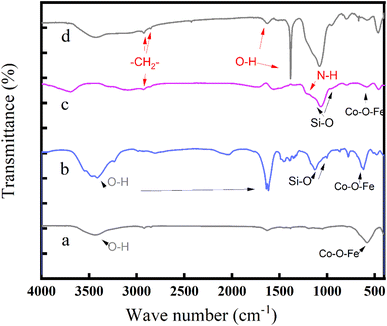
CoFe2O4 is considered to be the most promising permanent magnetic material due to its moderate saturation magnetization strength and good chemical stability.1 CoFe2O4 is a hard magnetic material belonging to the Fd3m space group which has an anti-spinel cubic structure with the molecular formula (M1−δ2+Feδ3+)[Mδ2+Fe2−δ3+]O4, with the cations in parentheses occupying tetrahedral sites and those in square brackets occupying octahedral sites respectively. The degree of inversion delta (δ) depends on the synthesis method and heat treatment and is 0 for normal spinel ferrite and 1 for anti-spinel ferrite.2 Although CoFe2O4 has been reported to have some extraction ability,3 simple CoFe2O4 nanomaterials are not adequate in this respect due to their agglomeration, unstable nature, and few surface active groups. Functionalized modification of the surface of CoFe2O4-based core–shell carriers can further improve their extraction ability.SiO2 is widely used in the fields of catalysis, adsorption, and biomedicine because of its cheap availability, stable chemical properties, non-toxicity, and large specific surface area. SiO2 has silicon hydroxyl groups on its surface, which is favorable for the preparation of core–shell shaped composites.4 The SiO2 layer not only prevents oxidation and aggregation in solution, but also obtains high chemical inertness in almost the whole pH range, excellent biocompatibility, feasibility and diversity of surface modifications, and is easy to be modified to obtain good magnetic response and new properties.5 Some literature reports suggest that further functionalization of CoFe2O4@SiO2 nanoparticles is more advantageous and effective in removing various metal ions from aqueous solutions.6,7 Combining the high adsorption capacity of nanoparticles and the easy separation characteristics of CoFe2O4 magnetic cores, the preparation of magnetic nanocomposites or further surface modification with specific ligands has been proved to be an effective method to obtain selective, rapid, simple and high adsorption capacity extractants for trace metals extraction.8 SiO2 coating on CoFe2O4 magnetic cores can increase the stability, dispersion and active site of pure CoFe2O4 nanoparticles in solution.9 Some literature reports suggest that further functionalization of CoFe2O4@SiO2 nanoparticles is more advantageous and effective in removing various metal ions from aqueous solutions.5,10
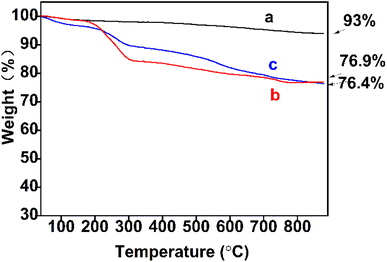
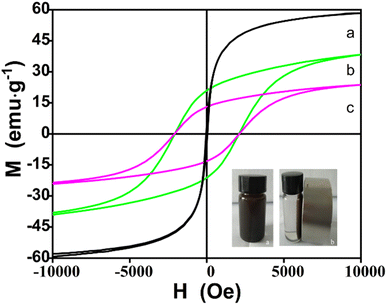
This paper establishes a new method for the separation of trace amounts of lead ions in water using magnetic solid-phase extraction ICP-OES, which is based on the preparation of magnetic nanocomposites CoFe2O4@SiO2–NH2 as an extractant. The particles were characterized by SEM, TEM, EDS, XRD, FRIR, TGA, VSM, and BET experiments, the factors that affect the extraction and elution of trace lead ions were optimized, and this method was applied to the actual determination of lead content in water samples.
2 Materials and experiment methods
2.1 Materials
Ethylene glycol (EG), ethanol absolute, ferric chloride (FeCl3·6H2O), cobalt chloride (CoCl2·6H2O), anhydrous sodium acetate (CH3COONa), polyethylene glycol (molecular weight 4000), and ammonia water (25% NH3 H2O) were purchased from Macklin Reagent (Shanghai, China). All other reagents were purchased from Sinopharm Chemical Reagent Co., Ltd (Shanghai, China) and were of analytical grade or better unless otherwise stated. Ultrapure water (Millipore, Milli-Q) was used for reagent water throughout the studies.2.2 Preparation of CoFe2O4@SiO2 MNPs
CoFe2O4 MNPs were synthesized using hydrothermal technology.11 Typically, FeCl3·6H2O (5.405 g) and CoCl2·6H2O (2.375 g) were dissolved in ethylene glycol (90 mL), and stirred at 323 K for 30 min. Then, a certain amount of CH3COONa (7.335 g) and polyethylene glycol (2.0 g) were added into the mixture with magnetic stirring for 30 min. Subsequently, the suspension was moved into a Teflon reactor (150 mL) and placed in an oven at 473 K for 16 h without stirring. After that, magnetic decanting was used to wash with ethanol three to four times, the above solution was then further washed with ultrapure water until the pH was close to neutral. The obtained CoFe2O4 materials were dried and bagged for use.CoFe2O4@SiO2 nanoparticles were prepared by using an improved Stöber method.12 CoFe2O4 magnetic nanoparticles (0.100 g) were dissolved in ethanol and deionized water by sonication for 30 min, and then a certain amount of cetyltrimethylammonium bromide (CTAB) and 1.00 mL tetraethyl silicate (TEOS) were added sequentially in a weakly alkaline environment. The mixture was reacted for 12 h at 40 °C under continuous stirring. The resulting product was collected by an external magnetic field and rinsed with deionized water and ethanol six times thoroughly. The resulting product was then dried in vacuum to obtain CoFe2O4@SiO2 MNPs.
2.3 Preparation of CoFe2O4@SiO2–NH2 MNPs
The particle was prepared according to the reference literature with slight modifications.13 The experimental steps are as follows: CoFe2O4@SiO2 MNPs (2.0 g) were dispersed into 150 mL of ortho xylene and stirred at 50 °C for 1 h. Then, 8 mL of 3-aminopropyltriethoxysilane (APTES, 99.0%) was dropped into the suspension through a constant pressure titration funnel and the mixture was mechanically stirred in an oil bath at 100 °C for 24 h. The reaction products were separated using permanent magnets, washed with water and ethanol to neutral, vacuum dried at 80 °C for 12 h, and then bagged to obtain CoFe2O4@SiO2–NH2 product. The synthesis procedure was illustrated in Fig. 1.2.4 Procedure for extraction
The general extraction procedure was illustrated in Fig. 2. A series Pb2+ standard solution or sample solution, buffer solution (pH = 8.00) solution, and 10 mg CoFe2O4@SiO2–NH2 MNPs were sequentially added to a centrifuge tube and brought to a constant volume of 200.00 mL. Subsequently, the solution in the tube was shaken at constant temperature and left to stand at 50 °C for 30 min. Then use Nd-Fe-B permanent magnetic material to collect CoFe2O4@SiO2–NH2 MNPs containing Pb2+ extraction solution, stewing it for about 10 min until the suspension becomes clear, and then use pipette to absorb the supernatant. The MNPs were ultrasonically eluted by 8.0 mL 1 mol L−1 hydrochloric acid for 2.5 min. The eluted solution was collected and brought up to volume, and the target analyte was detected with ICP-OES. The entire process takes about 43 min in duration.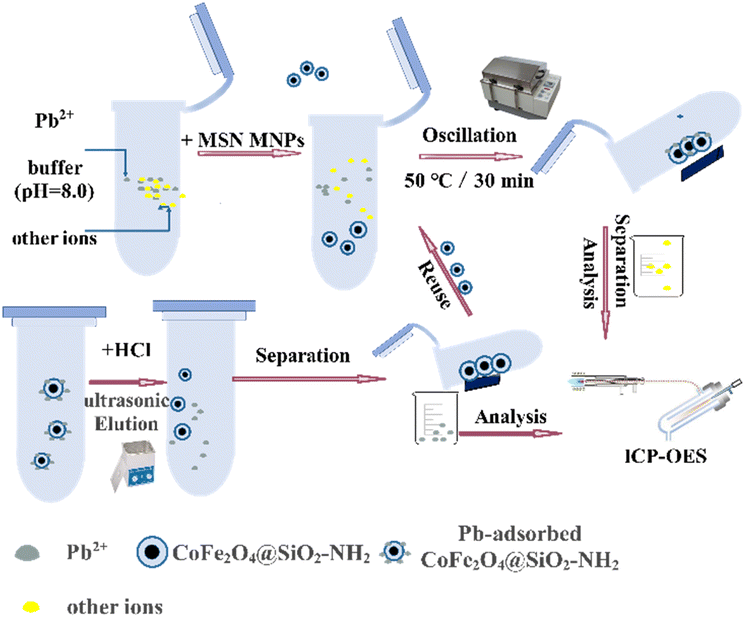 | ||
| Fig. 2 Schematic process of the MSPE procedure for detecting Pb2+ content using CoFe2O4@SiO2–NH2 as the absorbent. | ||
2.5 Sample preparation
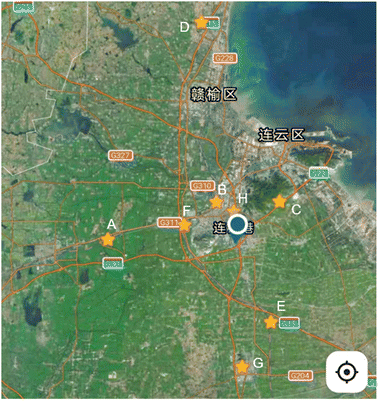
The water samples were collected from several reservoirs and springs in Lianyungang City, China. The pre-treatment steps of the sample are carried out according to the Chinese National Standard method.14 Approximately 50.0 mL of the lake water samples were filtered through a 0.45 μm membrane to remove suspended particles before analysis. The samples were stored at −4 °C in a refrigerator. The location of sampling points is shown in Fig. 3.3 Results and discussion
3.1 Characterization of the MNPs
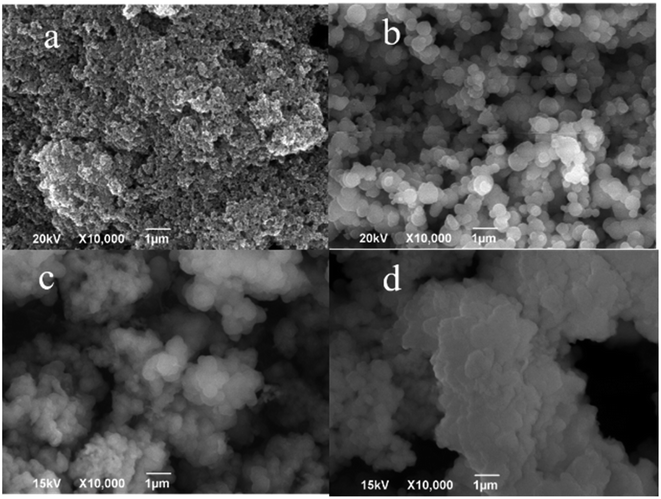 | ||
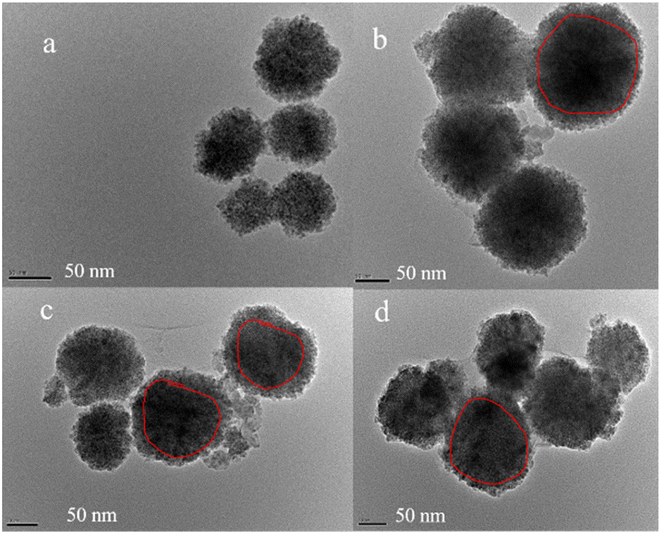
| Fig. 4 SEM images of (a) CoFe2O4, (b) CoFe2O4@SiO2, (c) CoFe2O4@SiO2–NH2 and (d) CoFe2O4@SiO2–NH2 nanoparticles after adsorption of lead ions. | ||
![[thin space (1/6-em)]](https://www.rsc.org/images/entities/char_2009.gif) :
:![[thin space (1/6-em)]](https://www.rsc.org/images/entities/char_2009.gif) 2 (Fig. 6A). CoFe2O4@SiO2 contains Co, Fe, O, and Si, with a Si atomic number content of 20% (Fig. 6B). The elements identified in the composite structure of the prepared CoFe2O4@SiO2–NH2 nanoparticles were C, N, O, Fe, Co and Si, with atomic percentages of 26.8, 2.47, 24.2, 13.2, 6.28 and 27.3%, respectively. CoFe2O4@SiO2–NH2 contains element N, indicating that NH2− has been successfully loaded onto CoFe2O4@SiO2 nanoparticles (Fig. 6C).
2 (Fig. 6A). CoFe2O4@SiO2 contains Co, Fe, O, and Si, with a Si atomic number content of 20% (Fig. 6B). The elements identified in the composite structure of the prepared CoFe2O4@SiO2–NH2 nanoparticles were C, N, O, Fe, Co and Si, with atomic percentages of 26.8, 2.47, 24.2, 13.2, 6.28 and 27.3%, respectively. CoFe2O4@SiO2–NH2 contains element N, indicating that NH2− has been successfully loaded onto CoFe2O4@SiO2 nanoparticles (Fig. 6C).
3.2 Extraction efficiency on different heavy metal ions
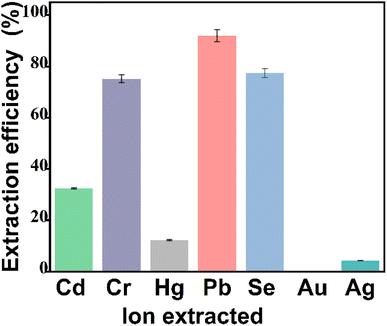
The extraction effect of CoFe2O4@SiO2–NH2 on different heavy metal ions was found that, CoFe2O4@SiO2–NH2 has certain extraction ability for various heavy metal ions. The extraction effect is in the order of Pb > Se > Cr > Cd > Hg > Ag, while gold ions are hardly extracted because of the [AuCl4]− anionic form in solution (Fig. 11). The intermolecular interactions between functional groups and heavy metals are complex, and the experimental results show that the prepared CoFe2O4@SiO2–NH2 composites have a large difference in the extraction ability of different metal ions and the forms of the extracted lead ions in solution will be further explored by pH and zeta experiments. The results of this experiment suggest that the high affinity of cations for the functional groups of the nanoparticles makes the nanoparticles highly selective.3.3 Optimizations of lead(II) extraction
This study found that the selection of extractant, pH value, ionic strength, extraction temperature, extraction time, amount of extractant and other factors had a certain impact on the extraction of metal ions.Studying the impact of pH within the range of 5.0 to 9.0 on the extraction performance for Pb2+. All pH values were measured by a pH meter (PHS-25B). Lead ion morphology varies with pH value. When pH < 7.0, lead ions mainly exists in the form of free ions and when pH ≥ 7.0, the extraction rate suddenly increases, reaching its maximum at pH 8.0, while the extraction rate sharply decreases when pH > 8.0. Therefore, pH = 8.0 was chosen as the optimal extraction pH (Fig. S2a†). Lead ions gradually exists as Pb(OH)+ and Pb(OH)2 t in the range of pH = 8–11. At pH = 8, the main form of lead present in solution is the positively charged Pb(OH)+ and lead present is Pb(OH)2 at pH > 9, which form is unable to generate coulombic forces with the negative charges on the surface of the extracted material.
Using sodium chloride as the model electrolyte, evaluate the effect of ionic strength in the concentration range of 0–1.0% (w/v) (Fig. S2b†). As the concentration of NaCl increases, the extraction efficiency of Pb2+ gradually decreases, mainly due to the competitive extraction of Na+ caused by the increase in NaCl concentration, resulting in a decrease in extraction efficiency. Based on this result, no electrolyte was added during the extraction process.
Studying the effect of extraction time on extraction rate (Fig. S2c†). The results showed that after 30 minutes of extraction, the extraction equilibrium can be reached, and the extraction rate is greater than 90%. Therefore, the optimal shaking time selected was 30 minutes.
Studying the effect of solution temperature on extraction rate (Fig. S2d†). The results showed that, the extraction rate showed a slow upward trend as the temperature increased at the range of 20–60 °C. At a temperature of 50 °C, the extraction rate could reach over 95%. Therefore, the optimal extraction temperature selected was 50 °C.
3.4 Extraction capacity
Extraction capacity is defined as the maximum amount of Pb(II) extracted per gram of CoFe2O4@SiO2–NH2. Under the optimized conditions, the changes in extraction capacity of CoFe2O4@SiO2–NH2 are shown in Fig. S3† at the range of 1.0–10 μg mL−1 Pb2+ solution concentration. When Pb2+ concentration is 4.0 μg mL−1, the extraction capacity of CoFe2O4@SiO2–NH2 for Pb2+ is 74.5 mg g−1, which reaches the maximum value. Therefore, the extraction capacity of CoFe2O4@SiO2–NH2 for Pb2+ is 74.5 mg g−1.3.5 Optimizations of lead(II) elution conditions
The effects of eluent selection, eluent concentration, eluent volume and eluent time on the elution effect were investigated as follows. Under optimal conditions, the effect of the same concentration and volume of hydrochloric acid and nitric acid on the elution process of lead was investigated. It can be seen from Fig. S4† that hydrochloric acid has the best elution effect and the highest elution rate. And then the effect of the concentration of 0.2–3 mol L−1 hydrochloric acid eluent on the elution rate of Pb2+ was investigated. The results showed that 1 mol L−1 hydrochloric acid solution had the highest elution rate (>90%) (Fig. S5a†). The effect of eluent volume on elution efficiency was investigated in the range of 2.0–10.0 mL (0.1 g CoFe2O4@SiO2–NH2 MNPs). The eluent rate of hydrochloric acid was more than 85% in the range of 6–10.0 mL and reached more than 95% in the volume of 8.0 mL, as shown in Fig. S5b.† There is no obvious change in elution efficiency when the temperature ranges from 20 to 60 °C, as shown in Fig. S5c.† Therefore, to improve experimental efficiency, room temperature can be selected as the best elution temperature. The effect of elution time was shown in Fig. S5d.† The elution efficiency was increased to more than 95% as the elution time was 2.5 min. Ultrasonic elution can significantly reduce the elution time, and a 2.5 min of ultrasonic elution can be selected as the best elution time.3.6 Interference experiment of metal elements
The standard solutions of mixed elements (GSB04-2824-2011 and GSB04-1766-2004) were selected to be added into the target lead ion according to the mass ratio of 1![[thin space (1/6-em)]](https://www.rsc.org/images/entities/char_2009.gif) :
:![[thin space (1/6-em)]](https://www.rsc.org/images/entities/char_2009.gif) 10, 1
10, 1![[thin space (1/6-em)]](https://www.rsc.org/images/entities/char_2009.gif) :
:![[thin space (1/6-em)]](https://www.rsc.org/images/entities/char_2009.gif) 100, 1
100, 1![[thin space (1/6-em)]](https://www.rsc.org/images/entities/char_2009.gif) :
:![[thin space (1/6-em)]](https://www.rsc.org/images/entities/char_2009.gif) 1000 for interference ion experiment. The experimental results show that K+, Na+ and Fe3+ with 1000 times the mass of Pb2+ have no interference on CoFe2O4@SiO2–NH2 extraction of Pb2+. Ca2+, Ba2+, Mg2+ with 100 times mass ratio of Pb2+ have no interference on the extraction of Pb2+, Co2+, Cu2+, Zn2+, Ag+, Mn2+, Ni2+ with 10 times mass ratio of Pb2+ had no interference on the extraction results. While Cr6+, Cd2+, Se2+ interfered with Pb2+ extraction (the error of measurement results is ±5%).
1000 for interference ion experiment. The experimental results show that K+, Na+ and Fe3+ with 1000 times the mass of Pb2+ have no interference on CoFe2O4@SiO2–NH2 extraction of Pb2+. Ca2+, Ba2+, Mg2+ with 100 times mass ratio of Pb2+ have no interference on the extraction of Pb2+, Co2+, Cu2+, Zn2+, Ag+, Mn2+, Ni2+ with 10 times mass ratio of Pb2+ had no interference on the extraction results. While Cr6+, Cd2+, Se2+ interfered with Pb2+ extraction (the error of measurement results is ±5%).
3.7 Optimization of analytical wavelengths and analytical performance
The spectral line wavelengths of different elements have different intensity and interference in the atomic emission spectrometer determination (ICPAES 6300). The wavelength order of lead spectral line is 216.999{455}, 220.353{453} nm, etc. (Fig. 12). In this experiment, 220.353 nm spectral line with the strongest signal and the least interference was selected for analysis (C0 = 1.0 mg L−1) (Fig. 12a). Under optimal conditions, the linear range of Pb2+ obtained by this method is 0.0–1.00 × 10⁴ μg L−1, and the linear fitting equation is y = 2268c + 19 (R2 = 0.9999, c: mg L−1) (Fig. 12c), the detection limit (3σ) is 0.027 μg L−1, and the relative standard deviation (RSD) ranges from 0.19 to 3.2%.3.8 Cycles
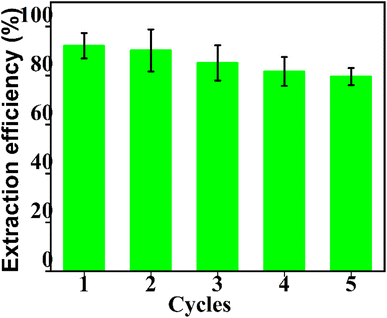
In order to investigate the recycling of the CoFe2O4@SiO2–NH2 nanoparticles, they were washed with 8 mL mol L−1 hydrochloric acid twice after each MSPE run, and were then used again. The results showed that the extraction capacity did not decrease significantly (extraction rate >80%) after 5 times of recovery (Fig. 13), indicating that the reusability of CoFe2O4@SiO2–NH2 MNPs is not affected after amination.3.9 Recovery rate experiment
Standard water sample (GBW08608) and actual water sample, with 1–50 μg L−1 Pb2+ standard solution as the spiked solution, were used to measure the spiked recovery rate, as shown in Table S1.† The recoveries of Pb2+ were 94.6% to 106%, meeting the accuracy requirement (80–120%) (Table S1†).3.10 Actual sample determination
This method is used to determine trace amounts of Pb2+ in local water samples, and the results are shown in Table S2.† The experimental results showed that the lead content in local water was at a low allowable level, the method was simple and rapid, and the results were satisfactory. Compared with other methods for the determination of Pb2+ reported in the literature, the results are shown in Table S3,† indicating that this method has the advantages of low detection limit and wide linear range.3.11 Zeta potential analysis
Zeta potential reflects the type and magnitude of the surface charge of a material.20 Under different pH values, zeta potential changes of CoFe2O4@SiO2–NH2 MNPs are shown in Fig. S6.† As can be seen from Fig. S6,† the zero-point potential of the MNPs is 5.9. When pH < 5.9 (pHpzc = 5.9), CoFe2O4@SiO2–NH2 surface is positively charged. When pH > 5.9, zeta potential is negative, and the ability of the extractant to bind to heavy metals through electrostatic attraction is enhanced at this point.30 At higher pH, Pb2+ hydrolyzed in aqueous solution, resulting in decreased extraction capacity of the MNPs.21–253.12 Electron binding energy analysis before and after extraction
Element composition and chemical valence state were measured by XPS. The changes of electron binding energy before and after Pb2+ extraction by MNPs were compared using XPS high resolution images. The full spectrum of XPS (Fig. S7†) shows the presence of Co, Fe, Si, O, and N elements on CoFe2O4@SiO2–NH2 surface, indicating the successful preparation of CoFe2O4@SiO2–NH2. By comparing the high resolution maps before extraction and after extraction, it can be found that after extraction of Pb2+, the strength of N 1s increases, and the chemical binding energy of N atom moves towards higher binding energy, suggesting that N atom participates in coulomb interaction and N 1s produces a new peak of 406.28 eV (Fig. 14A), which is the result of chelation interaction between the amino group on the extractant and metal ions. By comparing O 1s peaks of before extraction and after extraction (Fig. 14B), it can be seen that O atom moves towards higher binding energy after extraction, suggesting that O atom participates in coulomb interaction.21,26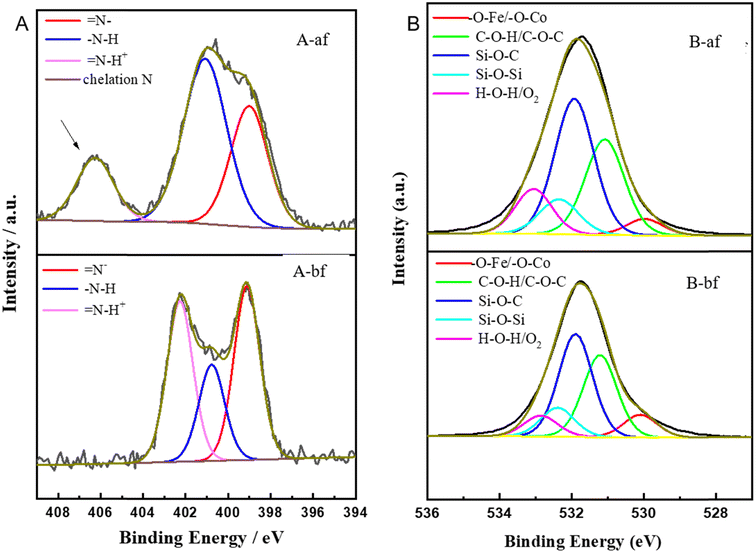 | ||
| Fig. 14 XPS core-level spectra of CoFe2O4@SiO2–NH2 of the samples before and after extraction (N 1S (A), O 1S (B)). | ||
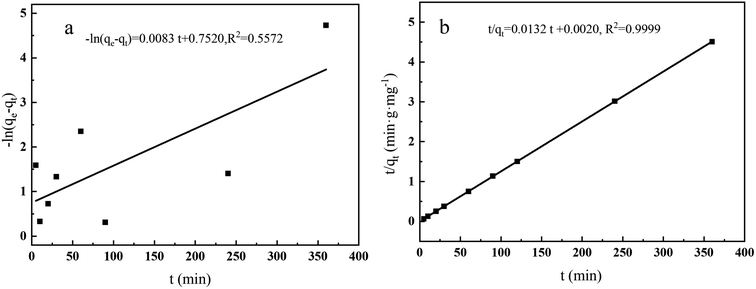
3.13 Adsorption kinetics experiment
In order to investigate the adsorption kinetics of lead(II) on CoFe2O4@SiO2–NH2, pseudo-first order and pseudo-second order kinetic models were used.Pseudo-first-order kinetic models formula:
ln(Qe − Qt) = ln![[thin space (1/6-em)]](https://www.rsc.org/images/entities/char_2009.gif) Qe − k1t Qe − k1t
| (2-1) |
Pseudo-second-order kinetic models formula,
 | (2-2) |
ln(qe − qt) = ln![[thin space (1/6-em)]](https://www.rsc.org/images/entities/char_2009.gif) qe − k1t qe − k1t
| (2-3) |
The value of Qe and k1 can be obtained after fitting the graph of t by Qt and by plotting t by t/Qt in formula (2-2), Qe and k2 can be obtained.
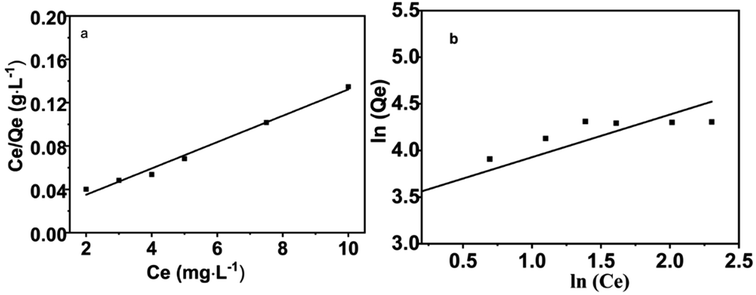
In this experiment, two dynamic models were selected to fit the experimental data, describe the dynamic characteristics of the extraction process, and speculate the rate control steps of the extraction process, including the pseudo-first-order kinetic model (formula (2-1)) and the pseudo-second-order kinetic model (formula (2-2)). The correlation coefficient of the quasi-second-order kinetic model (R2 = 0.9999) is higher than that of the quasi-first-order kinetic model (R2 = 0.5625) (Table S4†). In addition, Qt (75.8 mg g−1) of the pseudo-second-order kinetic model is closer to the experimental Qe,exp (74.5 mg g−1). The adsorption kinetics experiments of CoFe2O4@SiO2–NH2 on Pb(II) show that the adsorption conforms to the pseudo-second-order kinetic model, and the adsorption can be considered as monomolecular chemisorption (Fig. 15). Langmuir model is more suitable to describe the extraction behavior of extractants.
3.14 Adsorption isothermal model
Langmuir (Fig. 16a) and Freundlich (Fig. 16b) adsorption isotherm models were used to study the extraction process of lead ions by CoFe2O4@SiO2–NH2 nanocomposites.Langmuir adsorption isotherm model is shown in formula (2-4)
 | (2-4) |
Freundlich adsorption isotherm model is shown in formula (2-5)
 | (2-5) |
4 Conclusion
CoFe2O4@SiO2–NH2 MNPs with a core–shell structure were successfully prepared via a mild and facile hydrothermal method in the presence of water. The saturation magnetization of the as-prepared material was 24.2 emu g−1, which means a good magnetic separation performance. The Langmuir adsorption capacity of Pb2+ was 74.5 mg g−1 at 323 K and a pH of 8, and the MNPs could be recycled for 5 times. pH plays an important role in metal ion extraction. The pH value affects the interaction between the extractant and the target ion during the extraction process by affecting the morphology of Pb2+ in the aqueous solution and the surface charge of the extractant.27 At pH = 8, lead ions mainly exist in the form of Pb(OH)+ in the solution while as pH increases, lead ions coexist in the form of Pb(OH)+ and Pb(OH)2. When pH = 11, the form of lead ions mainly exists in Pb(OH)2, so an excessively high pH value will lead to a decrease in the extraction capacity of lead ions.21–25 Besides, zeta potential of the MNPs was negative when pH > 5.9, and the ability of the extractant to bind to heavy metals through electrostatic attraction was enhanced at this point.28 Physical adsorption of adsorbents is strongly influenced by the pore size distribution and surface area of the adsorbent.29 An increase in micropores increases the specific surface area and further promotes physical adsorption, whereas an increase in mesopores promotes the diffusion of adsorbate to accelerate the adsorption kinetics.30 The prepared MNPs has micropores and mesopores, and the BET experiments show that there is a weak force of physical adsorption. The XPS experiments show that the chemical binding energy of O and N changes after extraction, suggesting that the carboxyl, hydroxyl, and amine groups on the CoFe2O4@SiO2–NH2 interact with the lead ions by surface complexation. A large number of hydroxyl-activated groups are present on the surface of the SiO2, and the SiO2 coats the CoFe2O4, which forms the shell–core structure and increases the surface complexation of the pure CoFe2O4. A large number of hydroxyl groups existed on the surface of SiO2, and SiO2 coated CoFe2O4, forming a shell–core structure, which increased the stability, dispersion, and adsorption of pure CoFe2O4, nanoparticles in solution. A large number of hydroxyl groups existed on the surface of SiO2 grafted silanol groups on one end of the APTES through covalent bonding. The silanol on the APTES were bonded with each other to form a gel reticulation structure in order to increase the extraction ability of the metal ions. Amino groups on the other end of the APTES increased the amino group at the other end of APTES increases the selective extraction ability of the target ions and causes an increase in the surface charge of the prepared material, which increases the dispersion of the material in aqueous solution, the electrostatic attraction with the target ions, and the interaction force between the surface N atoms and the target ions. The main adsorption mechanism of CoFe2O4@SiO2–NH2 to lead ions was the binding of amino groups and silicon hydroxyl intermediates from APTES with lead ions to form a chelation interaction, coulombic interactions between electronegative O atoms from silicon hydroxyl and Pb(OH)+, as well as the electrostatic attraction between the negative charge O atoms in the surface of CoFe2O4@SiO2–NH2 and lead cations, so as to achieve the purpose of removing lead ions from the solution (Fig. 17). Thus, the synthesized magnetic nanocomposites can be used in many industries for the removal of contaminated metal ions, which is beneficial in achieving sustainable development.Conflicts of interest
There are no conflicts to declare.Acknowledgements
This work was supported by the Priority Academic Program Development of Jiangsu Higher Education Institutions and the Research Program of “521 Project” of Lianyungang City of China. This study was supported by the Postgraduate Research and Practice Innovation Program of Jiangsu Province (CXZZ13_0892, China); Open Subject of Jiangsu Institute of Marine Resources Development; Jiangsu Ocean University Youth Fund (JSIMR202203, China); the Practical Innovation Project for college students of Huaihai Institute of Technology (2021, China); Technology development project of Jiangsu Institute of Marine Resources Development (HKK2022109, China); Open-end Funds of Jiangsu Key Laboratory of Function Control Technology for Advanced Materials, Jiangsu Ocean University (jsklfctam202307, China).References
- S. Zhang and H. Niu, et al., Arsenite and arsenate adsorption on coprecipitated bimetal oxide magnetic nanomaterials: MnFe2O4 and CoFe2O4, Chem. Eng. J., 2010, 158(3), 599–607 CrossRef CAS.
- V. H. Ojha and K. M. Kant, Investigation of structural and magnetic properties of strained CoFe2O4 nanoparticles, J. Phys. Chem. Solids, 2021, 148, 109655 CrossRef CAS.
- X. Wu and W. Wang, et al., PEG-assisted hydrothermal synthesis of CoFe2O4 nanoparticles with enhanced selective adsorption properties for different dyes, Appl. Surf. Sci., 2016, 389, 1003–1011 CrossRef CAS.
- P. Arévalo-Cid and J. Isasi, et al., Comparative study of core-shell nanostructures based on amino-functionalized Fe3O4@SiO2 and CoFe2O4@SiO2 nanocomposites, J. Alloys Compd., 2018, 766, 609–618 CrossRef.
- A. F. P. Allwin Mabes Raj and M. Bauman, et al., Superparamagnetic Spinel-Ferrite Nano-Adsorbents Adapted for Hg2+, Dy3+, Tb3+ Removal/Recycling: Synthesis, Characterization, and Assessment of Toxicity, Int. J. Mol. Sci., 2023, 24(12), 10072 CrossRef CAS PubMed.
- W. Wu and Q. He, et al., Magnetic iron oxide nanoparticles: Synthesis and surface functionalization strategies, Nanoscale Res. Lett., 2008, 3(11), 397–415 CrossRef CAS PubMed.
- C. Ren and X. Ding, et al., Core–shell superparamagnetic monodisperse nanospheres based on amino-functionalized CoFe2O4@SiO2 for removal of heavy metals from aqueous solutions, RSC Adv., 2017, 7(12), 6911–6921 RSC.
- S. V. Thakkar and L. Malfatti, Silica-graphene porous nanocomposites for environmental remediation: A critical review, J. Environ. Manage., 2021, 278(P1), 111519 CrossRef CAS.
- Y. Wang and R. Zhou, et al., Novel environmental-friendly nano-composite magnetic attapulgite functionalized by chitosan and EDTA for cadmium (II) removal, J. Alloys Compd., 2020, 817, 153286 CrossRef CAS.
- L. Mueller and H. Traub, et al., Trends in single-cell analysis by use of ICP-MS, Anal. Bioanal. Chem., 2014, 406, 6963–6977 CrossRef CAS.
- A. F. Werner Stober, Department. Controlled Growth of Monodisperse Silica Spheres in the Micron Size Range 1 WERNER, J. Colloid Interface Sci., 1968, 26(1968), 62–69 CrossRef.
- H. Wang and J. Huang, et al., A facile synthesis of monodisperse CoFe2O4/SiO2 nanoparticles, Appl. Surf. Sci., 2011, 257(16), 7107–7112 CrossRef CAS.
- X. Wang and Z. Zhang, et al., A Mild and Facile Synthesis of Amino Functionalized CoFe2O4@SiO2 for Hg(II) Removal, Nanomater, 2018, 8(9), 673 CrossRef PubMed.
- Standardization Administration of PRC (SAC), GB/T 14848-2017 Groundwater Quality Standards, Published online, 2017, pp. 1–19 Search PubMed.
- H. Wang and J. Huang, et al., A facile synthesis of monodisperse CoFe2O4/SiO2 nanoparticles, Appl. Surf. Sci., 2011, 257(16), 7107–7112 CrossRef CAS.
- B. Tang and L. Luan, et al., Removal of aqueous Cd(II) and Ni(II) by aminopyridine functionalized magnetic Fe3O4 nanocomposites, J. Mol. Liq., 2021, 331, 115780 CrossRef CAS.
- C. Ren and X. Ding, et al., Core-shell superparamagnetic monodisperse nanospheres based on amino-functionalized CoFe2O4@SiO2 for removal of heavy metals from aqueous solutions, RSC Adv., 2017, 7(12), 6911–6921 RSC.
- H. Zhang and H. Li, et al., Synthesis of Magnetic CoFe 2 O 4 Nanoparticles and Their Efficient Degradation of Diclofenac by Activating Persulfate via Formation of Sulfate Radicals, J. Nanosci. Nanotechnol., 2018, 18(10), 6942–6948 CrossRef CAS.
- C. R. Ren and X. G. Ding, et al., Core-shell superparamagnetic monodisperse nanospheres based on amino-functionalized CoFe2O4@SiO2 for removal of heavy metals from aqueous solutions, RSC Adv., 2017, 7(12), 6911–6921 RSC.
- D. C. Culita and C. M. Simonescu, et al., o-Vanillin functionalized mesoporous silica – coated magnetite nanoparticles for efficient removal of Pb(II) from water, J. Solid State Chem., 2016, 238, 311–320 CrossRef CAS.
- S. P. Kuang and Z. Z. Wang, et al., Preparation of triethylene-tetramine grafted magnetic chitosan for adsorption of Pb(II) ion from aqueous solutions, J. Hazard. Mater., 2013, 260, 210–219 CrossRef CAS.
- M. Zhong and H. Kou, et al., Nasal Delivery of D-Penicillamine Hydrogel Upregulates a Disintegrin and Metalloprotease 10 Expression via Melatonin Receptor 1 in Alzheimer’s Disease Models, Front. Aging Neurosci., 2021, 13, 660249 CrossRef CAS.
- S. Zhuang and K. Zhu, et al., Fibrous chitosan/cellulose composite as an efficient adsorbent for Co(II) removal, J. Cleaner Prod., 2021, 285, 124911 CrossRef CAS.
- J. Cao and P. Wu, et al., Ultrafast Fabrication of Self-Healing and Injectable Carboxymethyl Chitosan Hydrogel Dressing for Wound Healing, ACS Appl. Mater. Interfaces, 2021, 13(20), 24095–24105 CrossRef CAS PubMed.
- J. R. Evans and W. G. Davids, et al., Kinetics of cadmium uptake by chitosan-based crab shells, Water Res., 2002, 36(13), 3219–3226 CrossRef CAS PubMed.
- H. K. An and B. Y. Park, et al., Crab shell for the removal of heavy metals from aqueous solution, Water Res., 2001, 35(15), 3551–3556 CrossRef CAS PubMed.
- M. Kumari and C. U. Pittman, et al., Heavy metals [chromium (VI) and lead (II)] removal from water using mesoporous magnetite (Fe3O4) nanospheres, J. Colloid Interface Sci., 2015, 442(Vi), 120–132 CrossRef CAS.
- C. Santhosh and E. Daneshvar, et al., Magnetic SiO2@CoFe2O4 nanoparticles decorated on graphene oxide as efficient adsorbents for the removal of anionic pollutants from water, Chem. Eng. J., 2017, 322, 472–487 CrossRef CAS.
- C. Santhosh and V. Velmurugan, et al., Role of nanomaterials in water treatment applications: A review, Chem. Eng. J., 2016, 306, 1116–1137 CrossRef CAS.
- L. Li and Y. Lv, et al., Enhance pore structure of cyanobacteria-based porous carbon by polypropylene to improve adsorption capacity of methylene blue, Bioresour. Technol., 2022, 343(2021), 126101 CrossRef CAS.
Footnote |
| † Electronic supplementary information (ESI) available. See DOI: https://doi.org/10.1039/d3ra06091h |
| This journal is © The Royal Society of Chemistry 2024 |


