 Open Access Article
Creative Commons Attribution 3.0 Unported Licence
Promotion of SO2 resistance of Ce–La/TiO2 denitrification catalysts by V doping
Yang Liua,
Na Wang *b,
Huidong Xiec,
Yepeng Suna,
Kaiyue Yanga,
Liang Zhanga,
Chang Yangc and
Chengmin Ged
aXi'an University of Science and Technology, Xi'an, 710054, Shaanxi, China
bShaanxi University of Science and Technology, Xi'an, 710016, Shaanxi, China. E-mail: wangna811221@sust.edu.cn; Fax: +86-29-82202335; Tel: +86-29-82203378
cXi'an University of Architecture and Technology, Xi'an, 710055, Shaanxi, China
dShandong Dongyuan New Material Technology Co., 257300, Shandong, China
First published on 10th January 2024
Abstract
Conventional cerium-based denitrification catalysts show good catalytic activity at moderate and high temperatures, but their denitrification performance may be decreased due to poisoning by SO2 in the flue gas. In this paper, V was introduced into Ce–La/TiO2 catalysts by a ball-milling method, and the effects of the V content on catalyst denitrification performance and SO2 resistance were investigated. Fourier-transform diffuse reflectance in situ infrared spectroscopy was used to examine the denitrification mechanism and evaluate the catalysts for surface acidity, redox characteristics, and SO2 adsorption. After introducing V, Brønsted acids played the dominant role in the catalytic reaction by increasing the number of acidic sites on the catalyst surface, adsorbing NH3 to participate in the reaction, and improving the sulfur resistance by inhibiting SO2 poisoning. The Ce3+ and O ratio on the catalyst surface were also enhanced by V doping, which reduced interactions between SO2 and the primary metal oxide active ingredients. The modified catalyst inhibited the formation of sulfate species on the catalyst surface and prevented the generation of additional nitrate species on the surface, which protected the main active sites. After V doping, the NH3-SCR reaction on the catalyst surface followed the Langmuir–Hinshelwood mechanism.
1 Introduction
NOx is a major atmospheric pollutant whose emissions cause acid rain, photochemical smog, and ozone layer depletion.1 Selective catalytic reduction (SCR) has a wide range of denitrification efficiencies, does not produce secondary contamination due to NH3 escape, and is widely used in various plants and municipal waste facilities.2 Cerium-based catalysts are one of the commonly used catalysts in SCR, which is due to the fact that Ce atoms contain a special arrangement of electrons outside the nucleus and have excellent oxidizing properties and oxygen storage capacity. CeO2 can be converted from Ce4+ to Ce3+ when cerium ions generate oxygen vacancies,3 giving the catalyst excellent redox properties and thermal stability. Cerium promotes the conversion of nitrate species and ammonia species, which facilitates the conversion of NH3 and NO to reactive intermediates on the catalyst surface, thus promoting the NH3-SCR reaction.Usually, the flue gas in coal-fired boilers contains SO2, which inevitably poisons the catalyst and reduces its denitrification performance. The reasons for SO2 poisoning can be classified into three categories: (1) the competitive adsorption of SO2 with reactants inhibits the formation of reactive intermediates; (2) the reaction of SO2 with NH3 to generate (NH4)2SO4 and NH4HSO4, which covers active sites on the catalyst surface and reduces the specific surface area of the catalyst; (3) metal active sites are sulfated by SO2 to create metal sulfates, which results in the loss of the active components and results in irreversible deactivation. For Ce-based catalysts, SO2 can be adsorbed and oxidized to SO3 by CeO2 to generate Ce(SO4)2 or Ce2(SO4)3 or react with NH3 to form stable (NH4)2SO4 or NH4HSO4, the NO conversion of CeO2/TiO2 catalysts was close to 100% above 300 °C and remained stable for 12 h. However, the value decreased significantly after 12 h, which was below 40% after 48 h.4 For Mn-based catalysts, the NO conversion of fresh samples of MnO2-based catalysts was 100% at 130–150 °C. After SO2 poisoning, the NO conversion decreased sharply from 100% to 53% at 130 °C and did not increase when the reaction temperature was increased to 150 °C.5 Ma et al.6 prepared Cu0.02Fe0.2W0.02TiOx by doping W to Cu0.02Fe0.2TiOx catalysts, the NO conversion of which maintained at 100% after passing water and sulfur at 240 °C for 10 h. Jiang et al.7 prepared Mn–Fe(0.4)–Ce(0.4)/ACN catalysts, which showed a NOx conversions higher than 95% at 100–250 °C, and remained around 91% at 175 °C for 32 h under 100 ppm SO2 and 10 vol% H2O.
Early studies on SO2 poisoning catalysts mostly concentrated on vanadium-based catalysts. In the temperature range of 180 to 400 °C, Li et al.'s8 investigation of the distribution of SO2 oxidation products during the NH3-SCR process over V2O5/TiO2 catalysts discovered that the amount of gaseous SO3 products increased with temperature in this range. The presence of O2 in flue gas promoted the oxidation of SO2 and the formation of gaseous SO3 on the V2O5/TiO2 catalysts. On the catalyst surface, the major pathway for SO2 oxidation comprises oxidizing SO2 to generate adsorbed SO3, which either desorbs to form gaseous SO3 or interacts with NH3 to form sulfate. Sulfite is created when a tiny amount of SO2 interacts with NH3; this product was then quickly oxidized to (NH4)2SO4. At 180 °C, the amount of deposition products peaked, while below 230 °C, more NH4+ emerged. Additives that also strengthened the water and sulfur resistance of the rare-earth-based catalysts helped them conduct denitrification even better. Many researchers have prepared binary-loaded metal oxide catalysts using transition metals and doping with rare earth elements such as CoO,9 Cr2O3,10 and Sm2O3.11 This method boosted the denitrification activity of the original Ce-based catalysts as well as their resistance to water and sulfur.
In this paper, we prepared a Ce–La–V/TiO2 catalyst via a previously reported ball milling method.12 The effect of the V introduction on the denitrification performance of the catalyst as well as on the water and sulfur resistance was tested. It was found that the NO conversion still maintained 85% after 52 h of water and sulfur feeding. After stopping the water and sulfur, the NO conversion recovered to 99%. In addition, the mechanism of the resistance to SO2 toxicity at high temperatures was elucidated using various physicochemical characterization techniques and reaction kinetics analysis.
2 Experimental
2.1 Catalysts preparation
According to the chemical formula of Ce10La2VxTi88−x (where x is the mass ratio of V2O5 per 100 parts of catalyst), cerium carbonate, lanthanum carbonate, ammonium metavanadate and titanium dioxide were added and put in the nylon ball milling jar, appropriate amount of deionized water and zirconia balls were added. The volume of the ball milling jar was 530 mL, the inner diameter was 94.5 mm, the height was 93.5 mm, the weight of zirconia balls was 95 g, and the volume of water was 100 mL. Then the slurry was ball milled in KQM-Z/B planetary ball mill, the rotational speed and time were set (usually 500 rpm, 1 h), and the direction of rotation was changed once per 20 min, separation of the slurry from the zirconia balls at the end of the process, and the slurry was dried in an oven at 105 °C for 12 h. After drying, the slurry was calcined at 500 °C for 4 h to obtain the desired catalysts, and the corresponding catalysts were notated as 10Ce–2La–xV/Ti (x = 0.1, 0.3, 0.6, 0.9, 1.4 and 2.3). In addition, the catalyst was poisoned by passing 300 ppm SO2 and 5% H2O on top of a mixture of 500 ppm NO, 500 ppm NH3, 5% H2O and N2, which was allowed to stabilize and then reacted continuously for 4 h to obtain a poisoned sample, which was labeled as 10Ce–2La–xV/Ti–S.2.2 Catalysts activity test
First, the prepared catalysts were ball-milled and attached to porous cordierite cylinders (commercial grade, φ 20 × L 50). After drying in an oven, the catalyst-loaded cordierite cylinders were placed in a quartz tube furnace to test the catalytic activity of the catalyst. The catalyst was loaded with a weight of 1 g. The gas mixture consisted of 500 ppm NO, 500 ppm NH3, 300 ppm SO2, 5% H2O, and 3% O2, with N2 as the equilibrium gas. The total gas flow rate was 2500 mL min−1 and the corresponding GHSV was 150![[thin space (1/6-em)]](https://www.rsc.org/images/entities/char_2009.gif) 000 mL g−1 h−1. The flow of all the gases was controlled by a mass flowmeter. NO and NO2 concentrations at the outlet were monitored in real time using an ECOM flue gas analyzer (Germany). NO conversion, N2 selectivity and SO2 conversion were calculated from eqn (1)–(3):
000 mL g−1 h−1. The flow of all the gases was controlled by a mass flowmeter. NO and NO2 concentrations at the outlet were monitored in real time using an ECOM flue gas analyzer (Germany). NO conversion, N2 selectivity and SO2 conversion were calculated from eqn (1)–(3):
 | (1) |
 | (2) |
 | (3) |
In order to visualize the differences in the catalytic activity of the samples more intuitively, the tests were conducted at a higher GHSV (150![[thin space (1/6-em)]](https://www.rsc.org/images/entities/char_2009.gif) 000 mL g−1 h−1), keeping the NO conversion rate lower than 30%, and the surface activation energies of the different catalysts were calculated. Assuming that the NH3-SCR catalytic reaction is not controlled by diffusion, the SCR reaction rate normalized by the specific surface area of the catalyst can be calculated according to eqn (4)13,14
000 mL g−1 h−1), keeping the NO conversion rate lower than 30%, and the surface activation energies of the different catalysts were calculated. Assuming that the NH3-SCR catalytic reaction is not controlled by diffusion, the SCR reaction rate normalized by the specific surface area of the catalyst can be calculated according to eqn (4)13,14
 | (4) |
Turn over frequency (TOF) can be calculated to compare the catalytic rate of different catalysts. Keeping the NO conversion below 30% (to ensure that all catalytically active sites are operational), the TOF value of NO on the active center Ce is calculated from eqn (5):15,16
 | (5) |
2.3 Characterization of catalysts
The physical composition of the samples was examined using a Thermo ARL SCINTAG X'TRA X-ray diffraction analyzer. Cu K-rays (wavelength 0.154056 nm) were used as its X-ray source, with a tube voltage of 40 kV and a tube current of 40 mA. Sample surface area, pore volume and pore size were measured by N2 adsorption and desorption using a Biaode SSA-7300 automatic pore size and surface area analyzer. X-ray photoelectron spectroscopy (XPS) was carried out using a Thermo Scientific K-Alpha electron spectrometer equipped with an Al Kα (hv = 1486.6 eV) radiation at an operating voltage of 12 kV and a reference pressure of 3 × 10⁻⁷ mbar. Temperature programmed desorption/reduction (TPD/TPR) experiments were carried out on a chemisorption apparatus (Micromeritics, AutoChem II 2920). TG and DSC quantities were measured using a simultaneous thermal analyzer (PerkinElmer STA-8000). N2 was used as the carrier gas, and the samples were heated up to 100 °C at a heating rate of 10 °C min−1 to pretreat moisture and other impurities on their surface, and then heated up to 800 °C at a heating rate of 10 °C min−1. The in situ IR tests were performed on an in situ FTIR spectrometer (Tensor 27). The tests were consisted by four parts: NH3 adsorption, NO + O2 adsorption, NO + O2 reaction with pre-adsorbed NH3 and NH3 reaction with pre-adsorbed NO + O2.3 Results and discussion
3.1 Characterization of catalysts physical properties
Fig. 2 shows the N2 adsorption–desorption isotherms and BJH pore size distribution. As shown in Fig. 2(a), all samples showed typical H3 hysteresis loops at higher relative pressures in the latter half (P/P0 = 0.7–1.0), which is usually associated with capillary coalescence in the catalyst.18 The curves were a type IV isotherm according to the IUPAC classification, indicating that the catalysts had mesoporous structures. From Fig. 2(b), it is clear that all samples showed a wide range of pore sizes, further confirming that the catalysts are mesoporous and are made up of a variety of irregularly shaped particles stacked together. In addition, the specific surface area, total pore volume, and average pore size obtained from N2 adsorption–desorption isotherms were calculated (Table 1). These values were slightly reduced after adding V because it favored sintering. After poisoning, the catalyst's surface area, average pore volume, and total pore volume were drastically decreased, demonstrating that sulfate species had coated the catalyst's surface.19
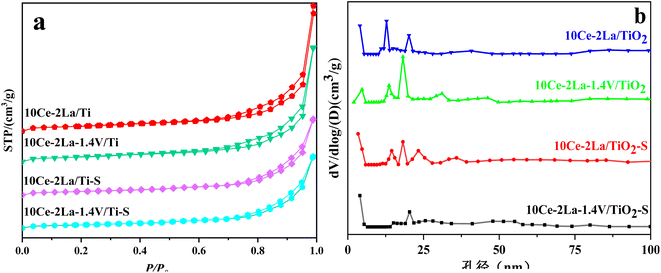 | ||
| Fig. 2 (a) N2 adsorption–desorption isotherms and (b) BJH pore size distributions of 10Ce–2La–xV/Ti series catalysts before and after poisoning. | ||
| Samples | Surface area (m2 g−1) | Pore volume (cm3 g−1) | Diameter of hole (nm) |
|---|---|---|---|
| 10Ce–2La/Ti | 74.13 | 0.062 | 21.96 |
| 10Ce–2La–1.4V/Ti | 71.81 | 0.056 | 16.55 |
| 10Ce–2La/Ti–S | 57.51 | 0.037 | 15.73 |
| 10Ce–2La–1.4V/Ti–S | 54.30 | 0.035 | 15.65 |
3.2 Catalyst surface acidity
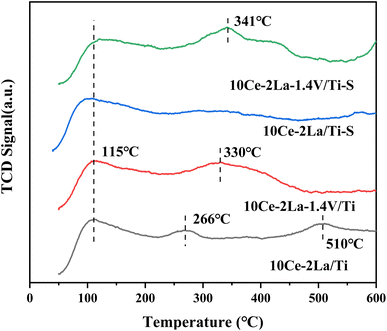
NH3-TPD was used to investigate the acidic properties of the catalyst surface (Fig. 4). While the peaks of medium and strong acidic sites in the temperature range of 200–500 °C were associated with the desorption of NH4+ from Brønsted acidic sites, the peaks of weak acidic sites below 200 °C corresponded to physisorbed NH3 on the catalyst. The peaks of strong acidic sites >500 °C were attributed to the desorption of liganded NH3 on Lewis acidic sites.21 By comparison, we found that the weak acidic site peaks did not change much after the introduction of V. However, the peak intensities and peak areas of the strong acidic sites in the catalysts increased significantly and the detachment peaks moved toward higher temperatures, which may be due to the interaction of the different active components, which in turn led to an increase in the length of the metal–oxygen coordination bonds and the surface acidity.22 Meanwhile the decrease in the peak area of the strong acidic sites indicates that the medium-strong and weak acidic sites play a greater role in the catalytic activity of the catalyst during the catalytic reaction. In addition, it was observed that the peak intensity of the weak acidic sites of the 10Ce–2La/Ti catalyst became smaller after poisoning, which may be due to the reaction of SO2 on the surface of the catalyst to generate sulfate to reduce the number of acidic sites, which led to the weakening of the catalyst's ability to adsorb NH3. In contrast, the peak position of catalyst 10Ce–2La–1.4V/Ti–S not only shifted toward high temperature, but also the peak intensity and peak area of the medium-strong acidic sites increased instead, indicating that the sulfation of the catalyst increased the NH3 uptake by the medium, which is one of the reasons that the catalyst exhibits good water and sulfur.233.3 Catalyst redox properties
XPS was used to investigate the chemical environment of the catalyst surface elements. The XPS spectra of catalyst Ce 3d are shown in Fig. 5(a), in which ten peaks were fitted to the spectra of all the samples. These were identified with “U” and “V” for the 3d5/2 and 3d3/2 spin–orbit components of Ce, respectively, which were located at 879 eV (V0), 885 eV (V2), 900 eV (U0), and 905 eV (U2). These belong to the 3d104f1 initial electronic state of Ce3+, and the remaining peaks were related to the 3d104f0 state of Ce4+. The existence of the double peaks of V0/U0 and V2/U2 suggests the presence of partially-reduced oxygen vacancies in the catalyst.24 The fitted integrated peak area ratio of Ce3+ and total Ce was used to determine the relative content of Ce3+ on the catalyst surface, as shown in Table 2 by the formula Ce3+ (%) = (SV0 + SV2 + SU0 + SU2)/(SU + SV) × 100%.25 After introducing V, Ce and La concentrations on the catalyst surface considerably rose, proving that V interacted with the active ingredients and had an impact on how many atoms were present there. The higher proportion of Ce3+, was attributed to an increase in the Ce concentration and also to the movement of free carriers on the catalyst surface towards the CeO2 surface, which had a higher binding energy (eV).26 A large fraction of Ce3+ on the catalyst surface enhanced the formation of oxygen vacancies, unsaturated chemical bonds, and charge imbalance, all of which boost the NO oxidation reaction.27,28 Fig. 5(b) depicts the catalyst's La 3d XPS spectra, in which La 3d5/2 and La 3d3/2 peaks emerged in all spectra at 834 eV and 37 eV, as well as at 852 eV and 855 eV, respectively.29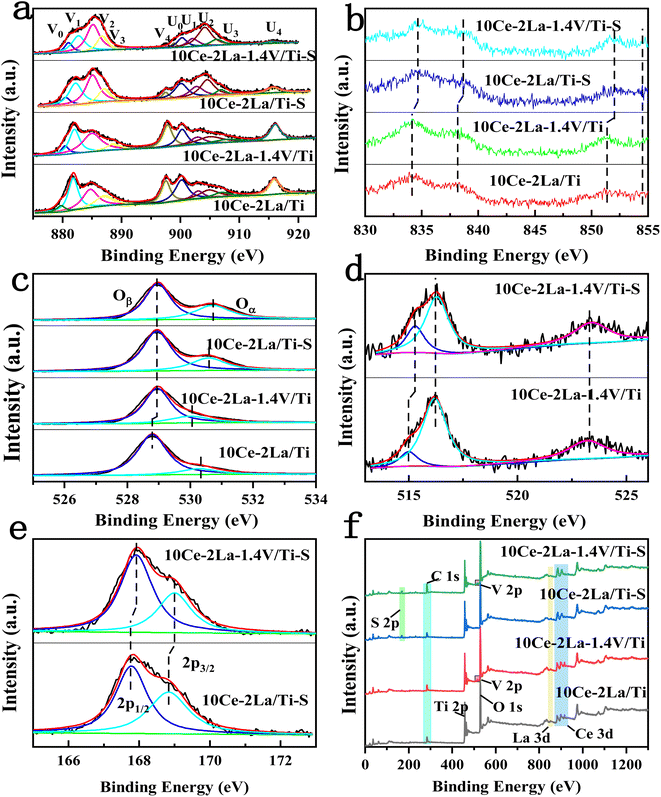 | ||
| Fig. 5 XPS spectra of 10Ce–2La/Ti and 10Ce–2La–1.4V/Ti catalysts and before and after poisoning. (a) Ce 3d; (b) La 3d; (c) O 1s; (d) V 2p; (e) S 2p; (f) full spectrum. | ||
| Samples | Surface atomic concentration (at%) | Ce3+/Ce | Oα/O | V4+/V | |||||
|---|---|---|---|---|---|---|---|---|---|
| O | Ce | La | V | S | Ti | ||||
| 10Ce–2La/Ti | 71.94 | 2.74 | 0.28 | — | — | 25.04 | 42.14% | 14.34% | — |
| 10Ce–2La–1.4V/Ti | 70.58 | 3.42 | 0.40 | 1.21 | — | 24.92 | 45.60% | 21.40% | 9.98% |
| 10Ce–2La/Ti–S | 70.53 | 2.39 | 0.25 | — | 3.75 | 23.08 | 53.49% | 27.51% | — |
| 10Ce–2La–1.4V/Ti–S | 69.84 | 2.92 | 0.40 | 0.72 | 4.63 | 21.50 | 57.30% | 34.07% | 18.83% |
Fig. 5(c) shows the O 1s XPS spectrum of the catalyst, in which peaks belonging to lattice oxygen and surface unsaturated oxygen (labeled Oβ and Oα), can be observed at positions 528.7–529 eV and 530.1–530.7 eV. Because surface unsaturated oxygen Oα has a higher migration rate than lattice oxygen Oβ, Oα increased the number of surface oxygen vacancies, which were more favorable to the SCR reaction.30 The relative atomic percentages of these oxygen species on the catalyst surface were estimated from the areas of the fitted peaks, as listed in Table 2. The Oα/(Oα + Oβ) ratio on the catalyst surface significantly increased after adding V, which is consistent with the Ce 3d XPS analysis and is one of the reasons for the good activity of the catalyst. Fig. 5(d) showed the V 2p XPS spectra before and after catalyst poisoning, in which the V4+ peak was located at 515.2 eV, and the V5+ peaks were located at 516.4 eV and 523.1 eV. This indicates that V on the catalyst surface mainly existed as V5+.31 The ratio of V4+/(V4+ + V5+) on the catalyst surface increased significantly after poisoning. Ce3+ also increased significantly, but the concentrations of Ce and V, the main active components on the surface of the catalyst, decreased. This was because SO2 reacted with the active components to produce sulfate in the presence of O2.7 Similarly, the significant increase in the Oα/(Oα + Oβ) ratio on the surface after catalyst poisoning was because the higher Ce3+ ratio promoted the creation of more surface oxygen vacancies. This was because oxygen from sulfate species was formed on the sample surface after sulfation, as well as chemisorbed oxygen.32 Fig. 5(e) shows the S 2p XPS spectra of the catalyst before and after poisoning, in which peaks belonging to the spin–orbit components of S6+ 2p3/2 and S6+ 2p1/2 can be observed at 167.7–168 eV and 168.8–169 eV after fitting. This implies that S in +6 valence state was mostly present on the catalyst surface as SO42−.33,34 After poisoning, the XPS peaks of all elements on the catalyst changed to higher binding energies, showing that the electron cloud density around each element was lowered to varying degrees. All were involved in the sulfation reaction. Peaks of Ce, La, O, Ti, V, S and C were observed in the full spectrum of the catalyst in Fig. 5(f).
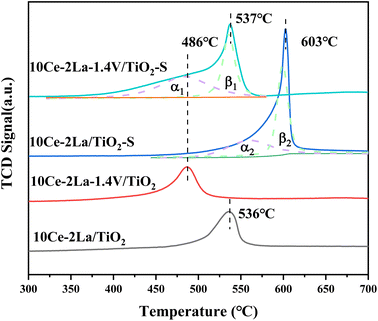
As shown in Fig. 6, the redox properties of catalysts before and after 10Ce–2La/Ti and 10Ce–2La–1.4V/Ti poisoning were tested using H2-TPR. Measurements were performed using CuO as the standard, and the hydrogen consumption for the reduction peaks between 400 °C and 700 °C was quantitatively calculated (Table 3). 10Ce–2La/Ti displayed a large H2 reduction peak, which was attributed to the reduction of surface-liganded unsaturated Ce4+, which played an important role in the oxidation reaction.35 After introducing V, the catalyst reduction peaks shifted toward lower temperatures, and the H2 consumption increased significantly (1.37 → 1.51 mmol g−1). This indicates strong interactions between V oxides and Ce oxides on the catalyst, which enhanced the reducing properties of the catalyst, which promoted catalytic cycling during SCR reaction.36 A strong peak was observed at 603 °C in the poisoned 10Ce–2La/Ti–S sample, which was shifted to a higher temperature relative to the fresh sample. This shift was primarily due to the reduction of S6+ to S4+ in sulfate, along with the reduction of certain metal oxides.37 To study the degree of metal oxide reduction in the catalyst 10Ce–2La–1.4V/Ti–S, the peaks were divided into α- and β-peaks by fitting, and the fitted area ratio was used to calculate the amount of hydrogen consumed for each peak. The α peak was associated with the reduction of metal oxides on the catalyst surface, while the β peak was related to the reduction process of sulfate species.36 The position of the metal oxide reduction peak in 10Ce–2La–1.4V/Ti–S was essentially unchanged, and the hydrogen consumption of α1 was larger than that of α2 (1.54 > 0.89 mmol g−1). That of β1 was less than that of β2 (1.00 < 1.157 mmol g−1), indicating that co-doping V with 10Ce–2La/Ti limited the interactions between SO2 and active metal oxide.
| Samples | Peak position (°C) | H2 consumption (mmol g−1) |
|---|---|---|
| 10Ce–2La/Ti | 536 | 1.37 |
| 10Ce–2La–1.4V/Ti | 486 | 1.51 |
| 10Ce–2La/Ti–S | 603 | 2.05 |
| 10Ce–2La–1.4V/Ti–S | 537 | 2.54 |
3.4 SO2 desorption and reaction
SO2-TPD was used to investigate the adsorption capacity of the catalyst toward SO2. As shown in Fig. 7(a), the catalyst contained two main desorption peaks in the temperature ranges of 400–460 °C and 600–670 °C. The low-temperature peaks were related to the desorption of SO2 from the catalyst surface,38 while the high-temperature peaks were related to the desorption of SO2 generated by the decomposition of sulfate species. The peak of 10Ce–2La/Ti at 665 °C represented the decomposition of cerium sulfate.39 In comparison, the desorption peak of 10Ce–2La/Ti at low temperature has a larger peak area, implying that more SO2 molecules are absorbed on the surface than 10Ce–2La–1.4V/Ti, the addition of V reduced the amount of SO2 molecules absorbed on the surface of the catalyst in order to alleviate competition between SO2 and NO adsorption, and to prevent the occupation of more active sites. The addition of V enhanced the strength of the catalyst's high-temperature peak, indicating that SO2 molecules were adsorbed onto V2O5 species, shielding the catalyst's major active sites.40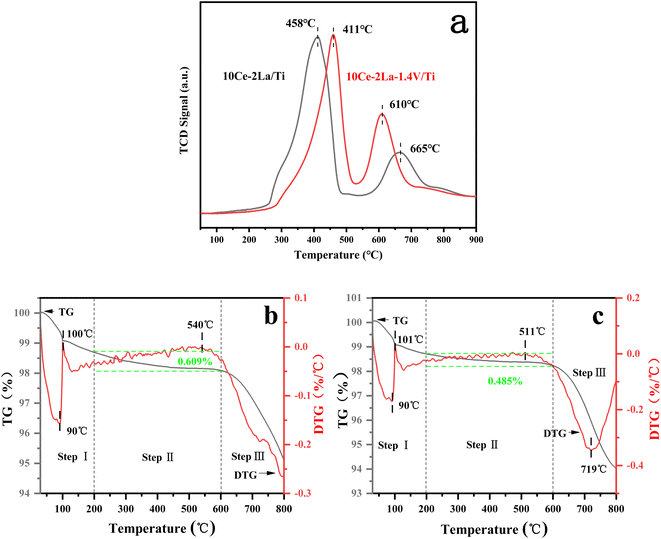 | ||
| Fig. 7 SO2-TPD curves of fresh catalysts and TG/DTG curves of poisoned catalysts. (a) SO2-TPD curves; (b) 10Ce–2La/Ti; (c) 10Ce–2La–1.4V/Ti. | ||
To study the substances generated on the surface of the samples during the catalytic reaction, the poisoned samples were analyzed using thermogravimetric analysis, and the results are shown in Fig. 7(b) and (c). The two samples' weight reduction procedure was separated into three steps: step I (40–200 °C) was mostly ascribed to the desorption of water from the samples; step II (200–600 °C) was attributed to the breakdown of ammonium sulfate and ammonia bisulfate on the catalyst surface; and step III (600–800 °C) to the decomposition of sulfates in the samples.36,41 10Ce–2La–1.4V/Ti–S showed an absorption peak related to the decomposition of sulfate (511 °C) and an exothermic peak related to the phase transition of the composite metal oxide (719 °C) above 500 °C. The 10Ce–2La/Ti–S catalyst had a higher decomposition temperature (540 °C), which was attributed to the low decomposition temperature of VOSO4 generated by SO2 with V. The 10Ce–2La/1.4V/Ti–S catalyst had the highest decomposition temperature (540 °C). In addition, the weight loss of ammonium sulfate or ammonia bisulfate on the surface of the 10Ce–2La–1.4V/Ti–S catalyst was larger (0.609%) than that of 10Ce–2La/Ti–S (0.485%). It is shown that the introduction of V protects the main active component of the catalyst from reacting with SO2 and inhibits the formation of sulfate species on the catalyst surface, thus enhancing the water and sulfur resistance of the catalyst.
3.5 In situ infrared spectroscopy of catalysts
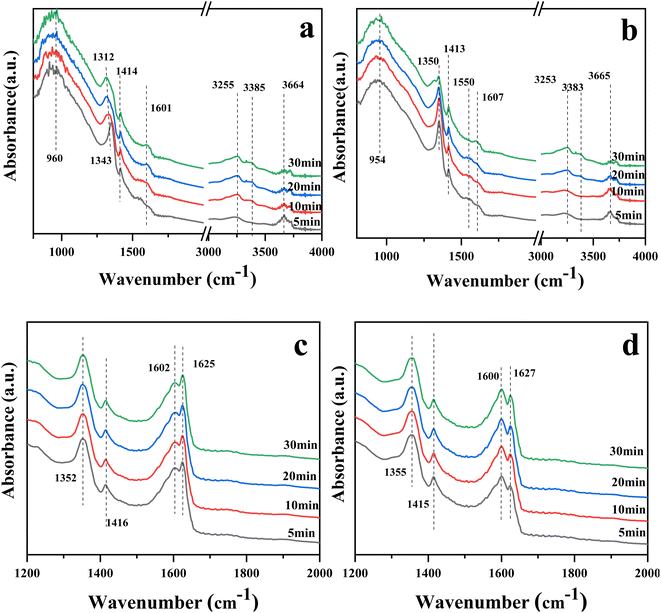
Fig. 8(a) and (b) show the in situ DRIFTS spectra of catalysts 10Ce–2La/Ti and 10Ce–2La–1.4V/Ti after adsorbing NH3 (500 ppm) for 30 min. The peaks near 954 (960) cm−1 for both samples were related to weakly-adsorbed gas-phase NH3.42,43 Absorption peaks near 1312–1343 (1350) cm−1 and 1414 (1413) cm−1 belonged to NH4+ at Brønsted acid sites.44,45 The asymmetric bending vibration of NH3 coupled to Lewis acid sites was responsible for the lower absorption peak at 1601 (1607) cm−1.44 The peak at 3253–3385 cm−1 was attributed to the stretching vibration of NH3 at the Lewis acid sites.46 10Ce–2La–1.4V/Ti shows a weak adsorption band near 1550 cm−1, which is due to the oxidation of NH3 on the catalyst surface by surface-active oxygen to generate an important intermediate product, –NH2, in the catalytic reaction –NH2 facilitates the conversion of NO, and promotes the smooth progress of the SCR reaction.47 In comparison, the intensity of the peaks related to the Brønsted acidic sites increased after the introduction of V, and NH3 was more easily activated. This indicates that Brønsted acids dominated the reaction, and the addition of V increased the proportion of Brønsted acids.The DRIFTS spectra of the catalysts 10Ce–2La/Ti and 10Ce–2La–1.4V/Ti after 30 minutes of NO (500 ppm) + O2 adsorption are shown in Fig. 8(c) and (d). Nitrate bridged ions and free nitrate ions, respectively, were responsible for the bands at 1355 (1352) cm−1 and 1600 (1602) cm−1.48 The absorption peak belonging to the nitrite species trans-N2O22− was located at 1415 cm−1. Weakly adsorbed gas-phase NO2 was thought to be active in the band at 1625–1627 cm−1 because it may react quickly with gaseous NH3.45
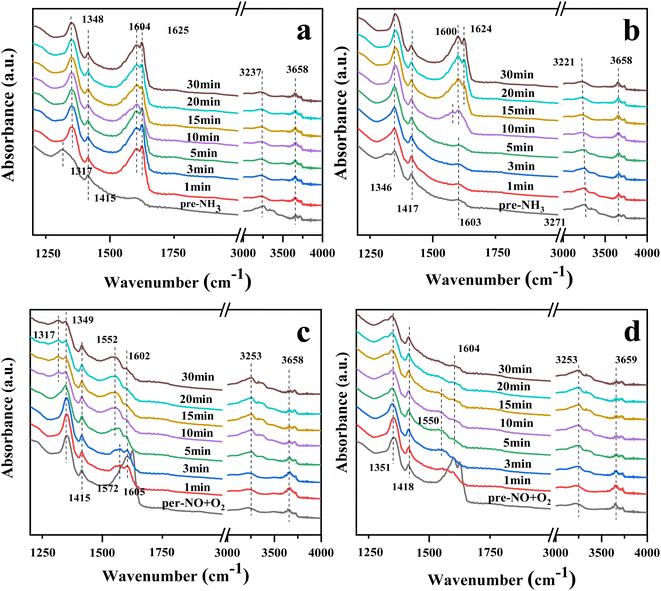
Fig. 9(a) and (b) show the DRIFTS profiles of the catalysts 10Ce–2La/Ti and 10Ce–2La–1.4V/Ti after 30 min of pre-adsorption of NH3 (500 ppm) followed by NO (500 ppm) + O2 (3%) adsorption for 30 min. In the NH3 adsorption curve, the peaks near 1317 and 1415 (1417) cm−1 belonged to NH4+ on the Brønsted acid sites, and the intensity of the peak at 1415 (1417) cm−1 did not change greatly with the passage of NO + O2. This was attributed to the coincidence of the peak at 1600 (1604) cm−1 for the NH3 and Lewis acid sites with the stronger peaks of rapidly-generated nitrate at 1604 and 1625 cm−1 after flowing NO + O2. This indicates that pre-adsorbed NH3 did not directly react with gas-phase NO and that the NH3-SCR did not involve gas-phase NO. With the passage of NO + O2, the intensity of the 1415 (1417) cm−1 peak did not change significantly, because, at this time, the 1600 (1604) cm−1 peaks of NH3 and Lewis acid sites overlapped with those of the stronger nitrate peaks at 1604 and 1625 cm−1. This suggests that pre-adsorbed NH3 did not react directly with gas-phase NO and that the NH3-SCR reaction did not proceed via the Eley–Rideal mechanism.
Fig. 9(c) and (d) show the DRIFTS spectra of the catalysts 10Ce–2La/Ti and 10Ce–2La–1.4V/Ti pre-adsorbed with NO (500 ppm) + O2 (3%) for 30 min and then allowed to adsorb NH3 (500 ppm) for 30 min. Prior to the passage of NH3, peaks attributed to nitrates were observed at 1349 (1351) cm−1, 1624 (1625) cm−1, 1415 (1418) cm−1, and 1600 (1604) cm−1, similar to those in Fig. 8(a) and (b).49 The nitrate peaks at 1602 and 1625 cm−1 disappeared rapidly upon the passage of NH3, it indicates that adsorbed NO can react with NH3 in the adsorbed state, so the reaction mechanism is Langmuir–Hinshelwood mechanism. In an L-H reaction mechanism, the reaction orders of both NO and NH3 are zero.50
3.6 Catalyst denitrification performance testing
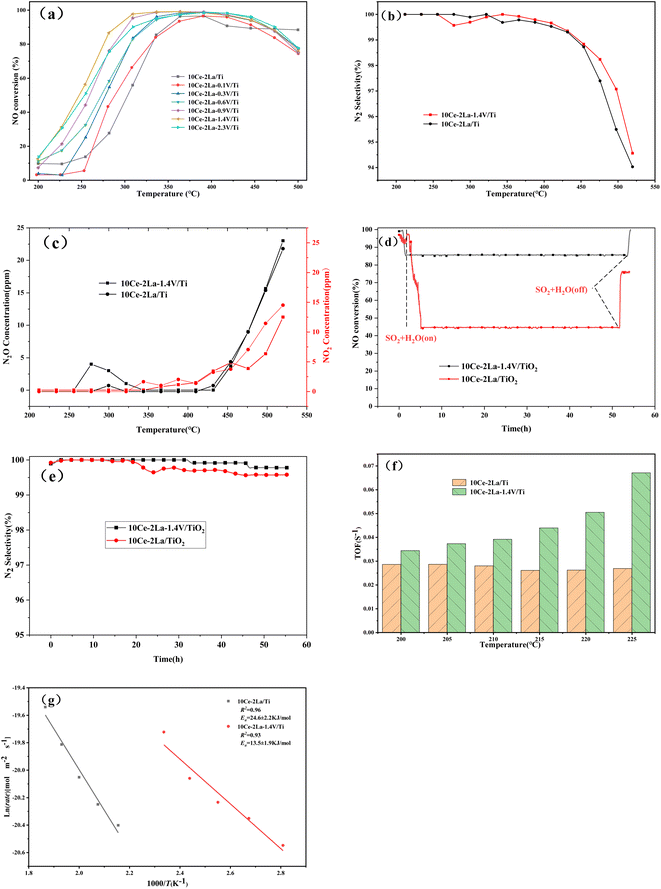
Fig. 10(a) shows the NO conversion versus temperature curves of the catalysts after adding different ratios of V. The overall activity of the catalyst was improved after adding V, and the starting temperatures were all lower. As the weight percent of V increases, the catalyst denitrification efficiency improved and then became worse, and the temperature window gradually became wider. The optimal catalytic efficiency was obtained when the weight ratio of V2O5 was 1.4, and the denitrification efficiency remained above 80% in the temperature range of 270–490 °C. The NO conversion reached a maximum of 99% at 330 °C, and the catalytic activity was greatly improved compared with the original rare-earth-based catalyst. In addition to catalytic activity, N2 selectivity is another important index for evaluating a catalyst's performance. As the temperature of the reaction increased, N2O and NO2 were produced, causing the N2 selectivity to slowly decrease, as shown in Fig. 10(b) and (c). In the reaction temperature interval, the N2 selectivity and N2O concentration of catalyst was slightly improved by the addition of V. The lower N2O generation resulted in better overall N2 selectivity than the original catalyst.The stability of the catalyst was tested by passing 300 ppm SO2 under constant test conditions and the results were shown in Fig. 10(d). After 2.5 h of the water and sulfur feeding, the NO conversion of 10Ce–2La/Ti decreased from the initial 97% to 44%, which maintained almost unchanged for 52 h. If the feeding of water and sulfur was cut off, the NO conversion recovered to 78%. Compared with 10Ce–2La/TiO2, the V-doped catalyst had a higher NO conversion in the presence of water and sulfur, which remained above 85% and recovered to 99% after shutting down water and sulfur. Fig. 10(e) shows the N2 selectivity comparison in the water and sulfur resistance stabilization experiments. Both the two catalysts showed a high N2 selectivity over than 99% and the N2 selectivity was not influenced by water and sulfur. It can also seen that the N2 selectivity was slightly improved by the addition of V. The turnover frequency (TOF) value calculated from eqn (5) is shown in Fig. 10(f). The 10Ce–2La–1.4V/Ti catalyst displayed better TOF values at each temperature, demonstrating that single Ce atoms on the catalytic surface were the primary active sites and displayed the best intrinsic activity under identical circumstances. Additionally, the reaction rate of NO on each square meter of a catalyst within the investigated temperature range was calculated according to eqn (4). It was plotted as ln(rate) against 1000/T, and the Arrhenius activation energy of the reaction was determined by fitting. As shown in Fig. 10(g), the surface activation energy of 10Ce–2La/Ti was 24.6 kJ mol−1, which was higher than that of 10Ce–2La–1.4V/Ti (13.5 kJ mol−1). The lower activation energy suggests an improved denitrification efficiency.
4. Conclusion
V-doped 10Ce–2La–xV/Ti catalysts were prepared by a ball milling method, and it was found that the rare earth Ce exerted a synergistic effect with V. The composite carrier-type oxides exhibited a good activity window and denitrification performance, as well as excellent water and sulfur resistance when the weight ratio of V2O5 was 1.4. The prepared catalysts showed mesoporous structures, and the ball milling method enhanced the interactions between different active components, resulting in good dispersion of the active components. V doping improved the surface acidity of the catalysts, and Brønsted acids on the surface of the catalysts played the dominant role. The greater number of acid sites adsorbed more NH3 that participated in the reaction and also prevented SO2 poisoning. The Ce3+ and O ratios on the catalyst surface were also enhanced by the addition of V, which was significant for the SCR-NH3 reaction. V limited the interactions between SO2 and the main active component (metal oxides), reduced the amount of SO2 adsorbed on the catalyst surface, and inhibited the formation of sulfate species on the catalyst surface. These all improved the sulfur resistance of the catalyst. The NH3-SCR on the catalyst surface proceeded via the Langmuir–Hinshelwood mechanism, with Brønsted acid sites playing the dominant role. The better denitrification activity and sulfur resistance of 10Ce–2La–xV/Ti catalysts make them promising for various applications.Author contributions
Yang Liu: writing – original draft, data curation, formal analysis, investigation, methodology. Na Wang: conceptualization, data curation, formal analysis, funding acquisition, investigation, methodology, project administration, supervision, validation, writing – review & editing. Huidong Xie: investigation, methodology, project administration, supervision. Yepeng Sun: data curation, formal analysis. Liang Zhang: investigation, methodology. Kaiyue Yang: investigation, methodology. Chang Yang: data curation, formal analysis. Chengmin Ge: conceptualization, funding acquisition, supervision, validation.Conflicts of interest
The authors declare that they have no known competing financial interests or personal relationships that could have appeared to influence the work reported in this paper.Acknowledgements
The work was supported by the National Natural Science Foundation of China under grant No. 51708447 and Major Scientific and Technological Innovation Projects of Shandong Province under grant No. 2019JZZY010343. The project is also supported by the Science and Technology Planning Project of Yulin City, Shaanxi Province under grant CXY-2021-135. We would like to thank Mogo Edit (https://www.mogoedit.com) for its English editing during the preparation of this manuscript.References
- D. Singh, A. Kumar, K. Kumar, B. Singh, U. Mina, B. B. Singh and V. K. Jain, Statistical modeling of O3, NOx, CO, PM2.5, VOCs and noise levels in commercial complex and associated health risk assessment in an academic institution, Sci. Total Environ., 2016, 572, 586–594 CrossRef CAS PubMed.
- Y. Liu, K. Liu, P. Wang, Z. Jin and P. Li, Electrocatalytic upcycling of nitrogenous wastes into green ammonia: advances and perspectives on materials innovation, Carbon Neutrality, 2023, 2, 14 CrossRef.
- L. Long, S. Tian, Y. Zhao, X. Zhang, W. Luo and X. Yao, Promotional effects of Nb5+ and Fe3+ co-doping on catalytic performance and SO2 resistance of MnO–CeO2 low-temperature denitration catalyst, J. Colloid Interface Sci., 2023, 648, 876–888 CrossRef CAS PubMed.
- J. Xu, Y. Zhang, X. Zou, T. Tang, Q. Zhang, F. Guo and H. Liu, Recent advances and perspectives in the resistance of SO2 and H2O of cerium-based catalysts for NOx selective catalytic reduction with ammonia, New J. Chem., 2022, 46, 2053–2067 RSC.
- X. Fang, Y. Liu, Y. Cheng and W. Cen, Mechanism of Ce-Modified Birnessite-MnO2 in Promoting SO2 Poisoning Resistance for Low-Temperature NH3-SCR, ACS Catal., 2021, 11, 4125–4135 CrossRef CAS.
- S. Ma, X. Zhao, Y. Li, T. Zhang, F. Yuan, X. Niu and Y. Zhu, Effect of W on the acidity and redox performance of the Cu0.02Fe0.2WaTiOx (a = 0.01, 0.02, 0.03) catalysts for NH3-SCR of NO, Appl. Catal., B, 2019, 248, 226–238 CrossRef CAS.
- L. Jiang, Y. Liang, W. Liu, H. Wu, T. Aldahri, D. S. Carrero and Q. Liu, Synergistic effect and mechanism of FeO and CeO co-doping on the superior catalytic performance and SO2 tolerance of Mn-Fe-Ce/ACN catalyst in low-temperature NH3-SCR of NO, J. Environ. Chem. Eng., 2021, 9, 106360 CrossRef CAS.
- Y. Li, J. Xiong, Y. Lin, J. Guo and T. Zhu, Distribution of SO2 oxidation products in the SCR of NO over V2O5/TiO2 catalysts at different temperatures, Ind. Eng. Chem. Res., 2020, 59, 5177–5185 CrossRef CAS.
- H. Li, J. Zhang, Y. Cao, F. Li and Y. Wang, Enhanced activity and SO2 resistance of Co-modified CeO2-TiO2 catalyst prepared by facile co-precipitation for elemental mercury removal in flue gas, Appl. Organomet. Chem., 2020, 34, e5463 CrossRef CAS.
- L. Yu, W. Liu, Z. Gao, X. Zhao, J. Gao and R. Yang, Promotion effect of chromium on the activity and SO2 resistance of CeO2–TiO2 catalysts for the NH3-SCR reaction, Ind. Eng. Chem. Res., 2021, 60, 11676–11688 CrossRef.
- H. Liu, Z. Fan, C. Sun, S. Yu, S. Feng, W. Chen, D. Chen, C. Tang, F. Gao and L. Dong, Improved activity and significant SO2 tolerance of samarium modified CeO2-TiO2 catalyst for NO selective catalytic reduction with NH3, Appl. Catal., B, 2019, 244, 671–683 CrossRef CAS.
- N. Wang, L. Wang, H. Xie, Y. Liu, Y. Sun, C. Yang and C. Ge, Preparation of high temperature NH3-SCR catalysts with carbonate as precursors by ball milling method, RSC Adv., 2022, 12, 35094–35102 RSC.
- B. Shen, Y. Wang, F. Wang and T. Liu, The effect of Ce–Zr on NH3 -SCR activity over MnOx (0.6)/Ce0.5Zr 0.5O2 at low temperature, Chem. Eng. J., 2014, 236, 171–180 CrossRef CAS.
- Y. Liu, J. Xu, H. Li, S. Cai, H. Hu, C. Fang, L. Shi and D. Zhang, Rational design and in situ fabrication of MnO2@NiCo2O4 nanowire arrays on Ni foam as high-performance monolith de-NOx catalysts, J. Mater. Chem. A, 2015, 3, 11543–11553 RSC.
- R. Q. Long and R. T. Yang, Fe-ZSM-5 for selective catalytic reduction of NO with NH3: a comparative study of different preparation techniques, Catal. Lett., 2001, 74, 201–205 CrossRef CAS.
- S. Brandenberger, O. Kröcher, A. Tissler and R. Althoff, The determination of the activities of different iron species in Fe-ZSM-5 for SCR of NO by NH3, Appl. Catal., B, 2010, 95, 348–357 CrossRef CAS.
- Z. Fan, J. W. Shi, C. Gao, G. Gao, B. Wang, Y. Wang, C. He and C. Niu, Gd-modified MnOx for the selective catalytic reduction of NO by NH3: The promoting effect of Gd on the catalytic performance and sulfur resistance, Chem. Eng. J., 2018, 348, 820–830 CrossRef CAS.
- S. W. K. Sing, Reporting physisorption data for gas/solid systems with special reference to the determination of surface area and porosity (Recommendations 1984), Pure Appl. Chem., 1985, 57, 603–619 CrossRef.
- Z. Liu, J. Zhu, S. Zhang, L. Ma and S. I. Woo, Selective catalytic reduction of NOx by NH3 over MoO3-promoted CeO2/TiO2 catalyst, Catal. Commun., 2014, 46, 90–93 CrossRef CAS.
- L. Meng, J. Wang, Z. Sun, J. Zhu, H. Li, J. Wang and M. Shen, Active manganese oxide on MnOx –CeO2 catalysts for low-temperature NO oxidation: Characterization and kinetics study, J. Rare Earths, 2018, 36, 142–147 CrossRef CAS.
- C. Fang, D. Zhang, S. Cai, L. Zhang, L. Huang, H. Li, P. Maitarad, L. Shi, R. Gao and J. Zhang, Low-temperature selective catalytic reduction of NO with NH3 over nanoflaky MnOx on carbon nanotubes in situ prepared via a chemical bath deposition route, Nanoscale, 2013, 5, 9199–9207 RSC.
- D. Chen, J. Feng, J. Sun, C. Cen and Y. Xiong, Molybdenum modified montmonrillonite clay as an efficient catalyst for low temperature NH3-SCR, Chem. Eng. Technol., 2020, 95, 1441–1452 CAS.
- X. S. Du, X. Gao, L. W. Cui, Y. C. Fu, Z. Y. Luo and K. F. Cen, Investigation of the effect of Cu addition on the SO2-resistance of a CeTi oxide catalyst for selective catalytic reduction of NO with NH3, Fuel, 2012, 92, 49–55 CrossRef CAS.
- R. Q. Long and R. T. Yang, Structural characterization of CeO2-TiO2 and V2O5/CeO2-TiO2 catalysts by Raman and XPS techniques, J. Phys. Chem. B, 2003, 107, 5162–5167 CrossRef.
- S. Liu, P. Yao, Q. Lin, S. Xu, M. Pei, J. Wang, H. Xu and Y. Chen, Optimizing acid promoters of Ce-based NH3-SCR catalysts for reducing NOx emissions, Catal. Today, 2021, 382, 34–41 CrossRef CAS.
- W. Cha, S. H. Ehrman and J. Jurng, Surface phenomenon of CeO2-added V2O5/TiO2 catalyst based chemical vapor condensation (CVC) for enhanced selective catalytic reduction at low temperatures, Chem. Eng. J., 2016, 304, 72–78 CrossRef CAS.
- T. Zhang, R. Qu, W. Su and J. Li, A novel Ce–Ta mixed oxide catalyst for the selective catalytic reduction of NOx with NH3, Appl. Catal., B, 2015, 176, 338–346 CrossRef.
- W. Liu, Y. Long, S. Liu, Y. Zhou, X. Tong, Y. Yin, X. Li, K. Hu and J. Hu, Promotional effect of Ce in NH3-SCO and NH3-SCR reactions over Cu-Ce/SCR catalysts, J. Ind. Eng. Chem., 2022, 107, 197–206 CrossRef CAS.
- l. A. A. Vesga, XPS fitting model proposed to the study of Ni and La in deactivated FCC catalysts, J. Electron Spectrosc., 2019, 233, 5–15 CrossRef.
- W. Zheng, X. Zhang, Y. Zheng and Y. Yue, “Oxynitride trap” over N/S co-doped graphene-supported catalysts promoting low temperature NH3-SCR performance: insight into the structure and mechanisms, J. Hazard. Mater., 2022, 423, 127187 CrossRef CAS PubMed.
- F. Wang, G. Li, B. Shen, Y. Wang and C. He, Mercury removal over the vanadia-titania catalyst in CO2-enriched conditions, Chem. Eng. J., 2015, 263, 356–363 CrossRef CAS.
- A. Tan, J. Wang, L. Li, A. Liu, G. Song, K. Guo, Y. Luo, F. Liu, F. Gao and L. Dong, Gas phase sulfation of ceria-zirconia solid solutions for generating highly efficient and SO2 resistant NH3-SCR catalysts for NO removal, J. Hazard. Mater., 2020, 388, 121729 CrossRef PubMed.
- A. Fan, Y. Jing, J. Guo, X. Shi, S. Yuan and J. Li, Investigation of Mn doped perovskite La-Mn oxides for NH3-SCR activity and SO2/H2O resistance, Fuel, 2022, 310, 122237 CrossRef CAS.
- X. Yao, K. Kang, J. Cao, L. Chen, W. Luo, W. Zhao, J. Rong and Y. Chen, Enhancing the denitration performance and anti-K poisoning ability of CeO2-TiO2/P25 catalyst by H2SO4 pretreatment: Structure-activity relationship and mechanism study, Appl. Catal., B, 2020, 269, 118808 CrossRef CAS.
- C. Fang, D. Zhang, L. Shi, R. Gao, H. Li, L. Ye and J. Zhang, Highly dispersed CeO2 on carbon nanotubes for selective catalytic reduction of NO with NH3, Catal. Sci. Technol., 2013, 3, 803–811 RSC.
- L. Jiang, Q. Liu, G. Ran, M. Kong, S. Ren, J. Yang and J. Li, V2O5-modified Mn-Ce/AC catalyst with high SO2 tolerance for low-temperature NH3-SCR of NO, Chem. Eng. J., 2019, 370, 810–821 CrossRef CAS.
- X. Fang, Y. Liu, Y. Cheng and W. Cen, Mechanism of Ce-modified birnessite-MnO2 in promoting SO2 poisoning resistance for low-temperature NH3 -SCR, ACS Catal., 2021, 11, 4125–4135 CrossRef CAS.
- L. Weiman, L. Haidi and C. Yunfa, Mesoporous MnOx–CeO2 composites for NH3-SCR: the effect of preparation methods and a third dopant, RSC Adv., 2019, 9, 11912–11921 RSC.
- X. Huang, S. Li, W. Qiu, Y. Chen, J. Cheng, Y. Sun, G. Bai, L. Song, G. Zhang and H. He, Effect of Organic Assistant on the Performance of Ceria-Based Catalysts for the Selective Catalytic Reduction of NO with Ammonia, Catalysts, 2019, 9, 357 CrossRef CAS.
- S. Jia, G. Pu, W. Xiong, P. Wang, J. Gao and C. Yuan, Investigation on simultaneous removal of SO2 and NO over a Cu-Fe/TiO2 catalyst using vaporized H2O2: An analysis on SO2 effect, Ind. Eng. Chem. Res., 2021, 60, 13474–13484 CrossRef CAS.
- C. Sun, H. Liu, W. Chen, D. Chen, S. Yu, A. Liu, L. Dong and S. Feng, Insights into the Sm/Zr co-doping effects on N2 selectivity and SO2 resistance of a MnOx-TiO2 catalyst for the NH3-SCR reaction, Chem. Eng. J., 2018, 347, 27–40 CrossRef CAS.
- N. Wang, C. Ye, H. Xie, L. Wang, B. Zheng, Y. He, C. Yang, J. Zhou and C. Ge, High-temperature vanadium-free catalyst for selective catalytic reduction of NO with NH3 and theoretical study of La2O3 over CeO2/TiO2, Catal. Sci. Technol., 2021, 11, 6112–6125 RSC.
- Z. Liu, S. Zhang, J. Li and L. Ma, Promoting effect of MoO3 on the NOx reduction by NH3 over CeO2/TiO2 catalyst studied with in situ DRIFTS, Appl. Catal., B, 2014, 144, 90–95 CrossRef CAS.
- P. Gong, J. Xie, D. Fang, F. He, F. Li and K. Qi, Enhancement of the NH3-SCR property of Ce-Zr-Ti by surface and structure modification with P, Appl. Surf. Sci., 2020, 505, 144641 CrossRef CAS.
- Z. Yan, J. Yang, X. Ge, J. Yu, L. Wei, T. Yang, B. He, X. Wang and L. Liu, Manganese oxide catalysts supported on zinc oxide nanorod arrays: A new composite for selective catalytic reduction of NOx with NH3 at low temperature, Appl. Surf. Sci., 2019, 491, 579–589 CrossRef CAS.
- N. Li, S. Tan, T. Wang, L. Hou, K. Jiao and W. Wu, Study on Performance and mechanism of low-temperature NH3-SCR denitrification over Mn/(Ce, La)PO4 catalysts, Mol. Catal., 2023, 551, 113648 CrossRef CAS.
- Y. Zhang, X. Yue, T. Huang, K. Shen and B. Lu, In situ DRIFTS studies of NH3-SCR mechanism over V2O5-CeO2/TiO2-ZrO2 catalysts for selective catalytic reduction of NOx, Materials, 2018, 11, 1307 CrossRef PubMed.
- Y. Pan, B. Shen, L. Liu, Y. Yao, H. Gao, C. Liang and H. Xu, Develop high efficient of NH3-SCR catalysts with wide temperature range by ball-milled method, Fuel, 2020, 282, 118834 CrossRef CAS.
- N. Li, C. Ren, L. Hou, K. Jiao and W. Wu, Study on NH3-SCR performance and mechanism of Mn supported SO42−-CeCO3F-CePO4 catalysts, Mol. Catal., 2022, 533, 112763 CrossRef CAS.
- S. Yang, J. Li, C. Wang, J. Chen, L. Ma, H. Chang, L. Chen, Y. peng and N. Yan, Fe–Ti spinel for the selective catalytic reduction of NO with NH3: Mechanism and structure–activity relationship, Appl. Catal., B, 2012, 117, 73–80 CrossRef.
| This journal is © The Royal Society of Chemistry 2024 |

