DOI:
10.1039/D3RA07159F
(Paper)
RSC Adv., 2024,
14, 5216-5221
Evidence for non-Arrhenius behavior of EPDM rubber by combining Arrhenius and time–temperature superposition (TTS) extrapolations†
Received
20th October 2023
, Accepted 25th January 2024
First published on 9th February 2024
Abstract
Studying the non-Arrhenius behavior of rubber is crucial to ensure appropriate lifetime prediction and reduce ineffective acceleration experiments. In this paper, accelerated thermal aging from 70 °C to 130 °C is conducted on an ethylene propylene diene monomer (EPDM) rubber and the tensile characteristics of the rubber are tested. Further, the popular Mooney–Rivlin equation is employed to analyze the influence of aging temperature and time on the effective crosslink densities. The enormous increase in the physical crosslinking density when the aging temperature reaches 115 °C demonstrates that the activation energy varied during the degradation process. By combining the Arrhenius extrapolation with the time–temperature superposition (TTS) extrapolation, a novel method to prove the non-Arrhenius behavior of EPDM rubber is provided. Based on the method proposed in this study, the activation energies for the high- and low-temperature processing of rubber can be determined.
1. Introduction
Rubber materials are widely used in many applications owing to their excellent mechanical properties. The most important applications of rubber are in the manufacturing of tires, seals, and vibration absorbers, and therefore, rubber materials are exposed to a wide variety of environments. For most rubbers in oxygen-containing environments, the mechanical strength is greatly affected by oxidation, especially at relatively high temperatures, which limits the service lifetime of rubbers.1–3 Thus, long-term behavior prediction and evaluation of rubber materials are key issues to ensure the safe use of rubber components.
The lifetime prediction of rubber materials often requires extrapolation of accelerated aging data.4 The time–temperature superposition (TTS) is a commonly used extrapolation method for lifetime prediction of polymers.5,6 The TTS method indicates that the material mechanical property values against ageing time under different ageing temperatures can be shifted to a selected reference temperature, Tref, by multiplying the times appropriate to experiments at temperature T by a shift factor aT, and aT = exp[Ea(1/Tref − 1/T)/R],7 where Ea is the activation energy, R the gas constant, and T the absolute temperature. Tref is chosen as the lowest in the range of experimental temperatures, and the shift factor aT is empirically chosen to obtain the best superposition of the data for each temperature. However, because this is an empirical method, even a small difference in the shift factors may lead to significant deviation in the predicted results of room-temperature lifetime. Thus, the other extrapolation Arrhenius model, which is a theoretical method, is used more widely.8–12 Nevertheless, many scholars have suggested that the activation energy Ea of an elastomer is not constant over a wide temperature range, and there is a transition temperature that results in changes in activation energy,13 i.e., rubber exhibits non-Arrhenius behavior over a wide temperature range. Gillen et al.14 found that, if the non-Arrhenius behavior is ignored, the predicted results using the Arrhenius extrapolation will differ by 20 times from the ultrasensitive oxygen consumption method. Chun et al.15 estimated the lifetime of multilayer ceramic capacitors in the temperature range between 55 °C and 85 °C, and they demonstrated that the conventional lifetime estimation can be erroneous and proposed that the non-Arrhenius behavior of the capacitor must be considered. Blivet et al.16 reported that an Arrhenius deviation at low temperatures can lead to large overestimations of lifetime prediction. Byungwoo et al.17 estimated fatigue life values for various types of rubbers used in the tire sidewalls, found that the Arrhenius equation fails to fit the test data, and provided a modified Arrhenius equation.
Studying the non-Arrhenius behavior of rubber is crucial to ensure the predicted lifetime. Therefore, many scholars have begun to explore how to determine the non-Arrhenius behavior of materials. The Arrhenius equation considers Ea to be a constant; however, when the aging temperature changes over a wide range, the aging mechanism of the material will change; that is, the activation energy is no longer a constant. Thus, the evidence of the non-Arrhenius behavior according to the changes in their activation energy is popular. Celina et al.9 reviewed the non-Arrhenius behavior of many types of rubbers and provided a simple approach for dealing with curvature, which was introduced to obtain Ea in different temperature ranges. Gillen et al.18 evidenced the non-Arrhenius behavior of polychloroprene rubber materials using the ultra-sensitive oxygen consumption approach, and a slow drop in Ea from 96 kJ mol−1 above 80 °C to an average value of 82 kJ mol−1 below 80 °C was observed. Zhang et al.19 estimated the change in activation energy by linearly fitting the degradation rates versus the inverse temperature relationship curve between every adjacent temperature.
In fact, during thermal aging, main-chain scission, crosslink formation, and crosslink breakage can occur.20–22 Besides, the activation energy depends not only on the degree of crosslinking but also on its type.23 According to the variation in the crosslink density of rubbers with the aging temperature, changes in the activation energy can be demonstrated. Therefore, we can determine the temperature at which the activation energy changes by studying the crosslink densities of the aged rubber samples.
It is well known that the structure–property relationship can be characterized by analyzing the tensile stress–strain curves, which are commonly represented by the Mooney–Rivlin equation. The Mooney plot of the material in the small to moderate stretch range is a straight line, and the crosslink density of the material can be determined by the model parameters.24 In this study, we aged the ethylene propylene diene monomer (EPDM) rubber over a wide temperature range (from 70 °C to 130 °C) and then analyzed the influence of aging temperature and time on the effective crosslink densities of the aged rubber using the popular Mooney–Rivlin equation. Based on the variation in the effective physical crosslink densities with the aging temperature, the temperature at which the activation energy changes was determined, and the activation energies at low and high temperatures were obtained. Finally, the derived activation energies were substituted into the calculation equation of the shift factor, and the shift results by the TTS were used to confirm the results of our study.
2. Experimental details
2.1 Material and sample preparation
EPDM sheets with a thickness of 2 mm were provided by Zhuzhou Times New Material Technology Co., Ltd, China. They were punched into dumb-bell specimens for aging and tensile tests. The specimen size is shown in Fig. 1. The main formulation of the EPDM rubber compound is as follows: 100 phr EPDM, 30 phr silica, 10 phr zinc oxide, 2 phr stearic acid, 50 phr aluminium hydroxide, 20 phr titanium dioxide, 8 phr paraffin oil, 5 phr antioxidant, and 6.4 phr vulcanization activator. The samples were prepared using a laboratory two-roll open mill (XK-160) following a standard mixing procedure elaborated in ASTM-D3192. All compounds were compressed into sheets using a press vulcanizer (XLB-D) at 170 °C under 200 bar for 15 min.
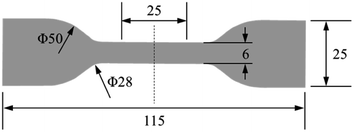 |
| | Fig. 1 Specimen size for the aging test (unit: mm). | |
2.2 Experiments
Thermal aging experiments were performed in a convection oven under various combinations of aging time and temperature. The conditions for thermal degradation are listed in Table 1. Three specimens were tested under each aging condition. After reaching the prescribed aging time, the specimens are shelved in air for 24 hours. Then, uniaxial tensile tests were carried out using an AGS-X electronic testing machine at a loading rate of 200 mm min−1 until the specimens are broken.
Table 1 Accelerated degradation conditions for the rubber composites
| Aging temperature (°C) |
Aging time (days) |
| 70 |
7, 14, 28, 56, 84 |
| 85 |
7, 14, 28, 56, 84 |
| 100 |
7, 14, 28, 56, 77 |
| 115 |
4, 7, 14, 28 |
| 130 |
4, 7, 14 |
3. Results and discussion
3.1 Effect of thermal aging on tensile behavior
The stress–strain curves of the unaged and aged rubbers are provided in the ESI data (Fig. S1†). The tensile strength and ultimate elongation were chosen as the indexes to evaluate the effect of thermal aging on the tensile behavior of rubber, as shown in Fig. 2 and 3. It can be seen that the tensile strength and ultimate elongation decrease as the aging process progresses under different aging temperatures. Furthermore, when the aging temperature is below 100 °C, both the tensile strength and ultimate elongation decrease slowly with aging time, whereas they decrease rapidly when the temperature reaches 115 °C. The decrease in the tensile strength and ultimate elongation with aging time approximates to an exponential relationship. These results indicate that the mechanical properties of rubber deteriorate in oxygen-containing environments, especially under high-temperature conditions.25
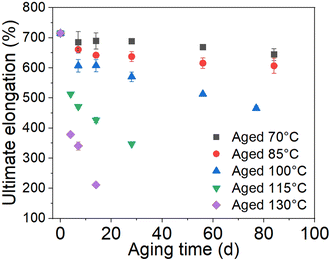 |
| | Fig. 2 Change in ultimate elongation with time. | |
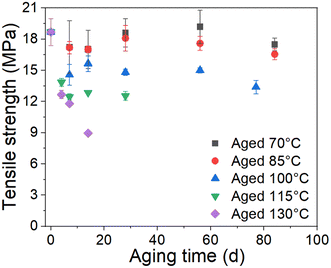 |
| | Fig. 3 Change in tensile strength with time. | |
3.2 Change in the crosslink density of EPDM during thermal aging
Mooney–Rivlin (MR) equation is a popular approach to simply parameterize the nonlinear stress–strain behavior, and it provides information on the crosslink density.24,26 The relevant MR equation for the uniaxial extension is as follows:| |
 | (1) |
| |
 | (2) |
where σ is the engineering stress, λ is the stretch ratio, and C1 and C2 are characteristic constants of the rubber material. By plotting the reduced Mooney stress (σM) against the reciprocal 1/λ, shown in eqn (2), the apparent MR constants C1 and C2 can be determined by linear regression in a range of small to intermediate deformations, i.e., 0.5 < 1/λ < 1.27 For our data, we selected the value of 1/λ between 0.4 and 0.7 for discussion, as in some previous works [see e.g. ref. 24].
C1 is believed to be directly related to the physically effective density Np of fixed network chains:26
| |
 | (3) |
The total effective crosslink density Ne can be determined as follows:26
| |
 | (4) |
where
R is the gas constant,
T is the absolute temperature, and
ρ is the density of the EPDM rubber (0.86 g cm
−3).
We selected the data from the stress–strain results in Fig. S1,† which satisfies 0.5 < 1/λ < 1 to plot the Mooney stress against the reciprocal 1/λ, as shown in Fig. 4 (scatter data). Then, using eqn (2) to fit the plots, the values for C1 and C2 were obtained, and Fig. 4 shows the fitting results. According to the fitting values of C1 and C2 at different aging temperatures and times, the change in the physical density of the network chains and the total effective crosslink density caused by thermal aging can be calculated using eqn (3) and (4), respectively. Fig. 5 shows the result of the crosslink density affected by physical aging. It can be seen from Fig. 5a that the physical crosslink densities of the aged rubbers at aging temperatures of 70–100 °C are almost the same but increases slightly compared with that of the unaged rubber. The average physical crosslink density increases 0.36 mol kg−1 after aging for approximately 80 days at aging temperatures of 70–100 °C. However, a significant increase in the physical crosslink density of the aged rubber at aging temperatures of 115 °C and 130 °C is observed. Even when the aging time is 14 days, the physical crosslink density increases 0.72 mol kg−1 and 2.12 mol kg−1 at the two aging temperatures, respectively. The influence of aging time and temperature on the total effective crosslink density is shown in Fig. 5b, which shows that the total effective crosslinking density is not significantly affected by physical aging, and the maximum increase is approximately 0.5 mol kg−1. It has been proved that the activation energy depends not only on the degree of crosslinking but also on its type.23 Thus, the enormous increase in physical crosslinking density may lead to a change in the activation energy of the aged EPDM rubber.
 |
| | Fig. 4 Plots of Mooney stress versus inverse strain for EPDM samples at different aging times and temperatures. | |
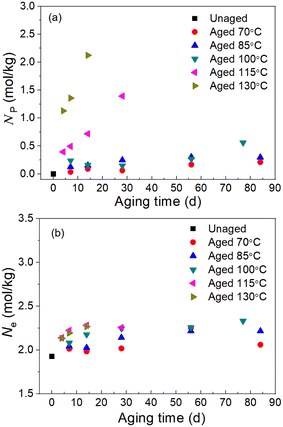 |
| | Fig. 5 Results of (a) the physical crosslink density Np and (b) total crosslink density Ne from the Mooney–Rivlin equation. | |
3.3 Evidence of the non-Arrhenius behavior using Arrhenius and TTS extrapolations
During the thermo-oxidation aging process, the degradation rate of an investigated property can be expressed using a Dakin-type kinetic relation as follows:28| |
 | (5) |
where p represents the investigated property, t is the aging time, k(T) is the rate constant of degradation, which is a function of temperature T, and f(p) represents the function of the degree of degradation.
The temperature dependence of the rate constant k(T) can be described by the Arrhenius relation as follows:
| |
k(T) = A![[thin space (1/6-em)]](https://www.rsc.org/images/entities/char_2009.gif) e−Ea/RT e−Ea/RT
| (6) |
where
A is the pre-exponential factor,
Ea is the activation energy,
R is the gas constant, and
T is the temperature.
From Fig. 2 and 3, we can see that the decrease in the tensile strength and ultimate elongation of the test materials caused by thermal aging follows an exponential relation. Thus, the function of the degree of degradation can be written as follows:
Hence, after substituting eqn (7) into (5) and integrating, the following dependence of the investigated property on the aging time and aging temperature was obtained:
| |
p = p0![[thin space (1/6-em)]](https://www.rsc.org/images/entities/char_2009.gif) ek(T)t ek(T)t
| (8) |
As we know, the elongation reaching 75% of its initial value is usually chosen as a failure criterion in the engineering field. Herein, we chose the ultimate elongation to construct the method. The ultimate elongation is the investigated property and the data are fitted in Fig. 2 using eqn (8). The fitting results are shown in Fig. 6. The scatter data represent the test data, and the lines represent the fitting curves. The coefficients of determination (R2) of the fitting curves at 70 °C, 85 °C, 100 °C, 115 °C, and 130 °C are 0.87, 0.71, 0.89, 0.83, and 0.94, respectively. The time tc to reach a certain amount of damage is defined as the lifetime of the material. Combining eqn (6) and (8), the lifetime can be obtained as follows:
| |
 | (9) |
where
m is the fitting parameter. Using 75% of the original value of ultimate elongation of unaged EPDM rubber as the failure value of the material, the lifetime
tc for the elongation reaching 75% of the original value under different aging temperatures can be calculated using the fitting functions of the curves in
Fig. 6.
Fig. 7 shows the plot of the logarithm of the lifetime
versus 1000/
T (the scatter points).
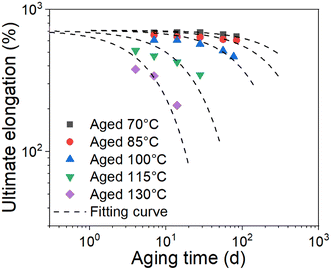 |
| | Fig. 6 Fitting results of the ultimate elongation of EPDM with aging time at different aging temperatures. | |
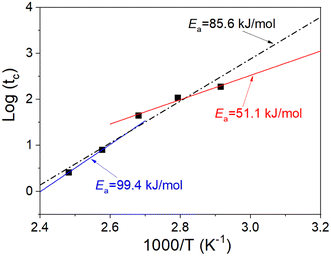 |
| | Fig. 7 Plot of the logarithm of the lifetime versus 1000/T. | |
The effect of the aging temperature and time on the crosslinking density of the aged rubber demonstrated a change in the activation energy at the transition temperature of 100 °C. Therefore, we separated the experimental temperatures into two ranges, one is 70–100 °C and the other is 115–130 °C, and then fitted the data in the two different temperature ranges in Fig. 7 using eqn (9). We obtained the results of the activation energy Ea, where Ea was 99.4 kJ mol−1 in the high-temperature range and 51.1 kJ mol−1 in the low-temperature range. The TTS was then implemented by choosing 70 °C as the reference point and shifting the remaining curves along the log aging time (taging) axis. Herein, the shift factors were calculated using the equation “aT = exp[Ea(1/Tref − 1/T)/R]” with the two different Ea values determined by the curve fittings in different temperature ranges, and the master curve of the ultimate elongation was obtained (as shown in Fig. 8). The superposition is quite good; moreover, the shift factors are used to achieve the superposition of the tensile strength (as shown in Fig. 9). We assumed that the activation energy in the range of experimental tests is constant. From the average slope of the black dashed line fitted using eqn (9), a global activation energy of 85.6 kJ mol−1 can be obtained, as shown in Fig. 7. The TTS was implemented again with the same reference temperature of 70 °C, while the shift factors were calculated using the Ea value of 85.6 kJ mol−1. The shifted result is shown in Fig. 10, which shows that the data in the temperature range from 70 °C to 100 °C show good superposition; however, at higher temperatures, the data cannot overlap. This means that the master curve cannot be obtained by the calculated shift factors with a constant Ea value of 85.6 kJ mol−1. Thus, the EPDM in the experimental temperature range presents the non-Arrhenius behavior, and by combining the Arrhenius approach with the TTS, the transition temperature and individual activation energies can be obtained.
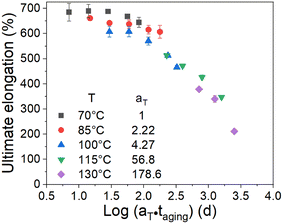 |
| | Fig. 8 Superposition of the ultimate elongation data at a reference temperature of 70 °C using two Ea values (51.1 kJ mol−1 and 99.4 kJ mol−1). | |
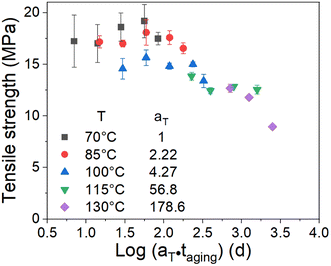 |
| | Fig. 9 Superposition of the tensile strength data at a reference temperature of 70 °C using two Ea values (51.1 kJ mol−1 and 99.4 kJ mol−1). | |
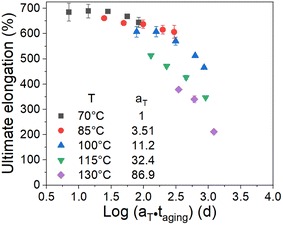 |
| | Fig. 10 Superposition of the ultimate elongation data at a reference temperature of 70 °C using global Ea (85.6 kJ mol−1). | |
4. Conclusions
Based on the tensile results of the unaged and aged rubbers, the variation in the crosslink densities with the aging temperature and time were investigated by the popular Mooney–Rivlin equation. The enormous increase in the physical crosslink density of the aged rubber beyond the aging temperature of 115 °C indicated a change in the activation energy of the EPDM rubber. Choosing the aging temperature 100 °C as the transition temperature, by fitting the data in the two different temperature ranges, i.e. 70–100 °C and 115–130 °C, the activated energies were found to be different in the two temperature ranges, which are 99.4 kJ mol−1 in the high-temperature range and 51.1 kJ mol−1 in the low-temperature range.
TTS was adopted to construct the ultimate elongation and tensile strength master curves. The shift results proved that using the two different Ea values determined in different temperature ranges, the master curves of the ultimate elongation and tensile strength can be achieved, whereas with a global Ea value determined in the tested aging temperature range without considering the change in activated energy, the master curve cannot be obtained. By combining the Arrhenius extrapolation with the TTS extrapolation, we proposed a method to demonstrate the non-Arrhenius degradation behavior of EPDM rubbers. Based on the proposed method, the transition temperature of the rubber, which results in a change in the activation energy, was confirmed, and the activation energies for the high- and low-temperature processes of the rubber material were determined.
Author contributions
Zhiguo Cui: writing – original draft. Wensong Liu: conceptuation and validation. Lei Tan: methodology. Guodong Sun: validation. Xiaoling Hu: conceptualization, funding acquisition, writing, review, and editing.
Conflicts of interest
There are no conflicts to declare.
Acknowledgements
The authors would like to acknowledge the National Natural Science Foundation of China [grant numbers 12172320, 12302088], the Natural Science Foundation of Hunan Province [grant number 2021JJ30642], and the Research Foundation of Education Bureau of Hunan Province [grant number 20C1756].
References
- P. Pourmand, L. Hedenqvist, A. M. Pourrahimi, I. Furó, T. Reitberger, U. W. Gedde and M. S. Hedenqvist, Polym. Degrad. Stab., 2017, 146, 184–191 CrossRef CAS.
- P. Pourmand, M. S. Hedenqvist, I. Furó and U. W. Gedde, Polym. Test., 2017, 64, 267–276 CrossRef CAS.
- P. Pourmand, M. S. Hedenqvist, I. Furó and U. W. Gedde, Polym. Degrad. Stab., 2017, 144, 473–484 CrossRef CAS.
- M. B. Hassine, M. Naït-Abdelaziz, F. Zari, X. Colin, C. Tourcher and G. Marque, Mech. Mater., 2014, 79, 15–24 CrossRef.
- R. J. Pazur, Polym. Degrad. Stab., 2014, 104, 57–61 CrossRef CAS.
- Z. M. Zhu, C. K. Jiang, Q. Cheng, J. W. Zhang, S. Y. Guo, Y. Xiong, B. Q. Fu, W. L. Yang and H. Jiang, RSC Adv., 2015, 5, 90178–90183 RSC.
- T. H. Anh and T. V. Khanh, J. Mater. Sci., 2005, 40, 5243–5248 CrossRef CAS.
- P. H. Mott and C. M. Roland, Rubber Chem. Technol., 2001, 74, 79–88 CrossRef CAS.
- M. Celina, K. T. Gillen and R. A. Assink, Polym. Degrad. Stab., 2005, 90, 395–404 CrossRef CAS.
- P. Davies and G. Evrard, Polym. Degrad. Stab., 2007, 92, 1455–1464 CrossRef CAS.
- P. N. Mohanadas, T. Santhanakrishnan, N. R. Manoj and T. Mukundan, Polym. Polym. Compos., 2021, 29, S501–S510 CAS.
- P. M. Lugt, Tribol. Int., 2023, 179, 108142 CrossRef CAS.
- M. Pushp, A. Lonnermark, P. Vikegard, X. F. Wei and M. Hedenqvist, Polym. Test., 2023, 120, 107948 CrossRef CAS.
- K. T. Gillen and M. Celina, Polym. Degrad. Stab., 2000, 71, 15–30 CrossRef.
- J. S. Chun, K. Lee, G. J. Lee, J. h. Lee, C. H. Hong, S. H. Yoon, J. Y. Choi and W. Jo, Materialia, 2024, 33, 101996 CrossRef CAS.
- C. Blivet, J. F. Larché, Y. Israëli and P. O. Bussière, Polym. Degrad. Stab., 2022, 199, 109890 CrossRef CAS.
- M. Byungwoo, K. Keekeun, P. Keontae, P. Soo and S. Chang-Sung, Mech. Mater., 2020, 147, 103405 CrossRef.
- K. T. Gillen, R. Bernstein and D. K. Derzon, Polym. Degrad. Stab., 2005, 87, 57–67 CrossRef CAS.
- H. Zhang, Y. Li and Y. S. Wang, Key Eng. Mater., 2016, 723, 237–241 Search PubMed.
- R. L. Fan, Y. Zhang, C. Huang, Y. X. Zhang, Y. Z. Fan and K. Sun, J. Appl. Polym., 2001, 81, 710–718 CrossRef CAS.
- P. Budrugeac, Die Angew. Makromol. Chem., 1997, 247, 19–30 CrossRef CAS.
- E. L. D. Souza, M. D. S. Zanzi, K. V. D. Paiva, J. L. G. Oliveira, A. S. Monteiro, G. M. D. O. Barra and G. B. Dutra, Polym. Eng. Sci., 2021, 61, 3001–3016 CrossRef.
- M. Youssef, Polym. Test., 2003, 22, 235–242 CrossRef CAS.
- S. Schlögl, M. L. Trutschel, W. Chassé, G. Riess and K. Saalwächter, Macromolecules, 2014, 47, 2759–2773 CrossRef.
- Z. M. Zhu, C. K. Jiang, Q. Cheng, J. W. Zhang, S. Y. Guo, Y. Xing, B. Q. Fu, W. L. Yang and H. Jiang, RSC Adv., 2015, 5(109), 90178–90183 RSC.
- T. Saleesung, D. Reichert, K. SaalwäChter and C. Sirisinha, Polymers, 2015, 56, 309–317 CrossRef CAS.
- M. C. Boyce and E. M. Arruda, Rubber Chem. Technol., 2000, 73, 504–523 CrossRef CAS.
- B. Moon, N. Jun, S. Park, C. S. Seok and U. Hong, Polymers, 2019, 11, 136 CrossRef PubMed.
|
| This journal is © The Royal Society of Chemistry 2024 |
Click here to see how this site uses Cookies. View our privacy policy here.  Open Access Article
 *c
*c


![[thin space (1/6-em)]](https://www.rsc.org/images/entities/char_2009.gif) e−Ea/RT
e−Ea/RT
![[thin space (1/6-em)]](https://www.rsc.org/images/entities/char_2009.gif) ek(T)t
ek(T)t


